relationship between retinal nerve fiber layer...
TRANSCRIPT
Research ArticleRelationship between Retinal Nerve Fiber Layer Thickness andHemoglobin Present in the Optic Nerve Head in Glaucoma
Marta Gonzalez-Hernandez,1 Jose Sigut Saavedra,2 and Manuel Gonzalez de la Rosa3
1Department of Ophthalmology, Hospital Universitario de Canarias, La Laguna, Spain2Department of Systems Engineering, University of La Laguna, La Laguna, Spain3Department of Ophthalmology, University of La Laguna, La Laguna, Spain
Correspondence should be addressed to Manuel Gonzalez de la Rosa; [email protected]
Received 4 January 2017; Revised 25 April 2017; Accepted 7 May 2017; Published 4 June 2017
Academic Editor: Vital P. Costa
Copyright © 2017 Marta Gonzalez-Hernandez et al. This is an open access article distributed under the Creative CommonsAttribution License, which permits unrestricted use, distribution, and reproduction in any medium, provided the original workis properly cited.
Purpose. To observe the relationship between topographic hemoglobin levels in the optic nerve head (ONH), the rim thickness(BMO-MRW), and retinal nerve fiber layer (RNFL) thickness. Methods. 96 normal eyes and 82 glaucomas were examined usingTOP strategy (Octopus 300 perimeter), SPECTRALIS OCT, and Laguna ONhE program which estimates hemoglobin fromconventional color photographs (Horus Scope DEC 200 fundus camera). Results. The correlation between Laguna ONhEglaucoma discriminant function (GDF) and SPECTRALIS BMO-MRW was R = 0 81 (P < 0 0001), similar to that between theBMO-MRW and BMO-RNFL thicknesses (R = 0 85, P < 0 0001) (P = 0 227 between both R values). GDF correlated well withRNFL thicknesses in the 360 degrees around the nerve, similar to mean perimetric sensitivity (MS) and BMO-MRW. Theamount of hemoglobin in the nasal and temporal sectors showed low correlation with superior and inferior RNFL thicknesses.The superotemporal and inferotemporal sectors located on the vertical diameter of the disk showed good intercorrelation butwithout a clear RNFL topographic relationship. Conclusion. GDF showed high correlation with RNFL thickness. Except in thenasal and temporal sectors, ONH hemoglobin correlated well with RNFL thickness.
1. Introduction
One of the main factors that have recently been related to theoptic nerve glaucomatous lesion is the vascular component[1]. Until very recently, the most accessible method of studywas flow, analyzed by echo Doppler in nearby vessels [2].Subsequently, several attempts have been made to measureoxygen concentration in the nerve itself [3] and morerecently, some methods to measure vascular structure andflow through OCT angiography have been developed [4]and the amount of form elements present in the blood usinglaser Doppler [5] or speckle [6].
Our group has proposed a simple method to topograph-ically measure the amount of hemoglobin in the blood fromconventional color images of the optic nerve head (ONH)[7], especially noting the differences between its red andgreen components. The main obstacle in achieving this isthat the chromatic result of the analysis of the red-green-
blue (RGB) components of conventional photographicimages does not depend exclusively on the absorption ofhemoglobin but also on the spectral composition of the illu-mination light, the absorption of the lens, and the spectralresponse of the detector used. The essential idea that hasallowed the Laguna ONhE program to resolve this dilemmais to choose a known chromatic pattern within the eye tocompensate for all these variables.
The relative amount of hemoglobin present in the tis-sue of the optic nerve head (ONH) is estimated as follows:a central point in the ONH is manually identified as aprovisional centroid, to facilitate the identification of itsborders by automatic imaging analysis procedures, whichtake into account previous experiences in which photo-graphic images were adjusted with delimitations performedusing OCT. The result can be refined by the user ifdeemed necessary. Then, the real centroid of the delimitationis calculated, which is divided regularly by four diameters,
HindawiJournal of OphthalmologyVolume 2017, Article ID 2340236, 10 pageshttps://doi.org/10.1155/2017/2340236
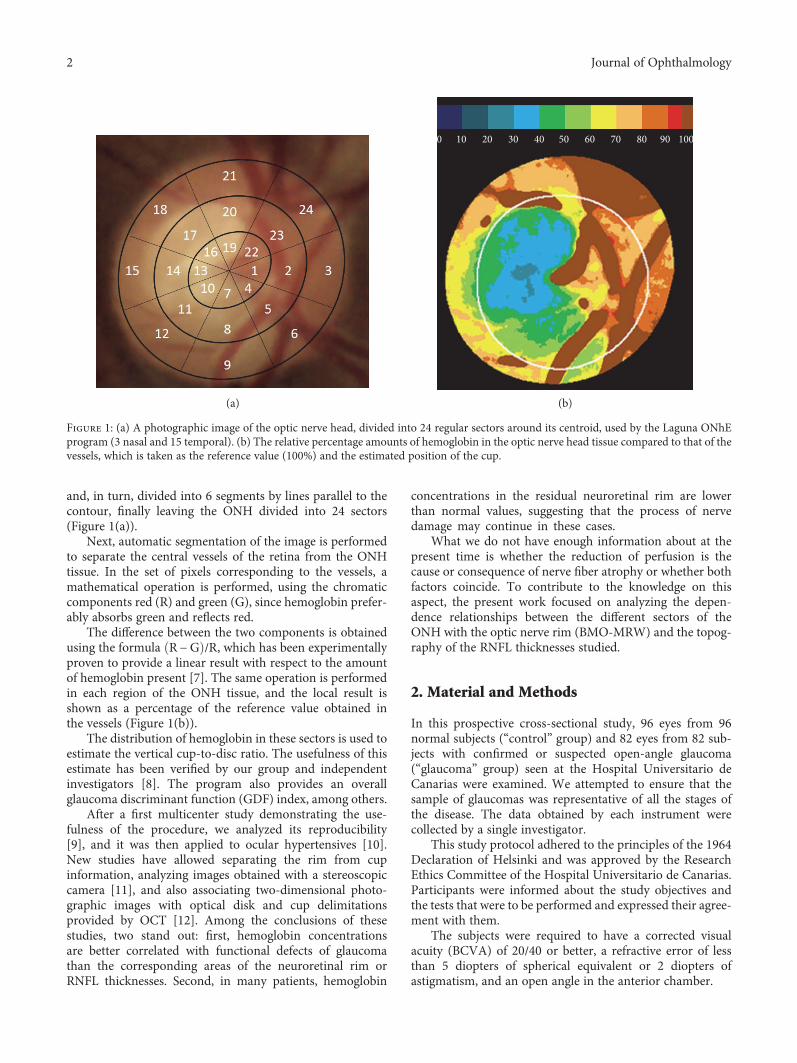
and, in turn, divided into 6 segments by lines parallel to thecontour, finally leaving the ONH divided into 24 sectors(Figure 1(a)).
Next, automatic segmentation of the image is performedto separate the central vessels of the retina from the ONHtissue. In the set of pixels corresponding to the vessels, amathematical operation is performed, using the chromaticcomponents red (R) and green (G), since hemoglobin prefer-ably absorbs green and reflects red.
The difference between the two components is obtainedusing the formula R−G /R, which has been experimentallyproven to provide a linear result with respect to the amountof hemoglobin present [7]. The same operation is performedin each region of the ONH tissue, and the local result isshown as a percentage of the reference value obtained inthe vessels (Figure 1(b)).
The distribution of hemoglobin in these sectors is used toestimate the vertical cup-to-disc ratio. The usefulness of thisestimate has been verified by our group and independentinvestigators [8]. The program also provides an overallglaucoma discriminant function (GDF) index, among others.
After a first multicenter study demonstrating the use-fulness of the procedure, we analyzed its reproducibility[9], and it was then applied to ocular hypertensives [10].New studies have allowed separating the rim from cupinformation, analyzing images obtained with a stereoscopiccamera [11], and also associating two-dimensional photo-graphic images with optical disk and cup delimitationsprovided by OCT [12]. Among the conclusions of thesestudies, two stand out: first, hemoglobin concentrationsare better correlated with functional defects of glaucomathan the corresponding areas of the neuroretinal rim orRNFL thicknesses. Second, in many patients, hemoglobin
concentrations in the residual neuroretinal rim are lowerthan normal values, suggesting that the process of nervedamage may continue in these cases.
What we do not have enough information about at thepresent time is whether the reduction of perfusion is thecause or consequence of nerve fiber atrophy or whether bothfactors coincide. To contribute to the knowledge on thisaspect, the present work focused on analyzing the depen-dence relationships between the different sectors of theONH with the optic nerve rim (BMO-MRW) and the topog-raphy of the RNFL thicknesses studied.
2. Material and Methods
In this prospective cross-sectional study, 96 eyes from 96normal subjects (“control” group) and 82 eyes from 82 sub-jects with confirmed or suspected open-angle glaucoma(“glaucoma” group) seen at the Hospital Universitario deCanarias were examined. We attempted to ensure that thesample of glaucomas was representative of all the stages ofthe disease. The data obtained by each instrument werecollected by a single investigator.
This study protocol adhered to the principles of the 1964Declaration of Helsinki and was approved by the ResearchEthics Committee of the Hospital Universitario de Canarias.Participants were informed about the study objectives andthe tests that were to be performed and expressed their agree-ment with them.
The subjects were required to have a corrected visualacuity (BCVA) of 20/40 or better, a refractive error of lessthan 5 diopters of spherical equivalent or 2 diopters ofastigmatism, and an open angle in the anterior chamber.
0 10 20 30 40 50 60 70 80 90 100
(a) (b)
Figure 1: (a) A photographic image of the optic nerve head, divided into 24 regular sectors around its centroid, used by the Laguna ONhEprogram (3 nasal and 15 temporal). (b) The relative percentage amounts of hemoglobin in the optic nerve head tissue compared to that of thevessels, which is taken as the reference value (100%) and the estimated position of the cup.
2 Journal of Ophthalmology
Patients in the “glaucoma” group had characteristic opticnerve defects or suspected disease data, such as intraocularpressure (IOP) greater than 21mmHg, associated with afamily history of glaucoma, a suggestive aspect of ONH, ora borderline condition in the visual field, for example, a meandefect greater than 2dB or depressed points in the defectcurve. Subjects with IOP greater than 25mmHg or pressuresbetween 21 and 25mmHg associated with a corneal thickness(ECC) of less than 500μm were also included, regardless ofother types of signs or symptoms.
The presence of cataracts was not considered an a prioriexclusion criterion, provided that visual acuity was notreduced below 20/40. No special importance was attachedto equating the samples by age, since previous studies haveshown no significant changes with age in the hemoglobinvalues of the ONH in normal subjects [11].
Patients included in the “control” group did not haveany significant ocular pathology in the eye recruited forthe study, had an intraocular pressure lower than21mmHg, and had no family history of glaucoma. Thesesubjects were not selected by the glaucoma section of ourhospital but rather they comprised hospital staff, patientsfrom other sections without intraocular pathology, or familymembers of patients. All subjects had previous perimetricexperience, and none had any systemic disease that couldaffect vision.
All patients underwent a complete ophthalmologicexamination and a perimetric study using program 32 andTOP strategy of the Octopus 300 perimeter (Haag-StreitAG, Bern, Switzerland) [13].
In all cases, two images of the ONH were obtained usingthe Horus Scope DEC 200 handheld camera (MiiS, Taiwan),which were analyzed with the Laguna ONhE version 4.0(INSOFT SL, Spain), averaging the results. A detaileddescription of the use of the program has been published [14].
An examination with the Glaucoma Module PremiumEdition (GMPE) of the SPECTRALIS OCT (HeidelbergEngineering, Germany) was also performed. The versionwe used allows the export, using a module called RNFLExport, of the 768 values of RNFL thickness obtained inthe 360-degree circumference with respect to the centerof the nerve to be calculated with respect to the ends ofBruch’s membrane.
The limits of Bruch’s membrane were not taken intoaccount to delimit the edges of the ONH when using the
Laguna ONhE program. However, the automatic edge iden-tification algorithms used by this program take into accountthe experience accumulated in other studies in which thephotographic images were adjusted with the ONH edgesdelimited by OCT [12].
3. Statistical Analysis
All statistical analyses were performed using MedCalc(version 7.3, software MedCalc (Mariakerke, Belgium)) andExcel 2016 (Microsoft, Redmond, USA). For the develop-ment of the Laguna ONhE program, the blue, green, andred components were evaluated using the MATLAB imageanalysis program (The MathWorks Inc., Natick, MA) andits toolbox for image processing.
After ensuring a normal distribution of the variables,Pearson correlations were also calculated between theindices provided by the perimeter and the Laguna ONhEprogram, as well as the indices and thicknesses providedby SPECTRALIS OCT.
4. Results
Demographic and clinical characteristics of the two groupsstudied are summarized in Table 1.
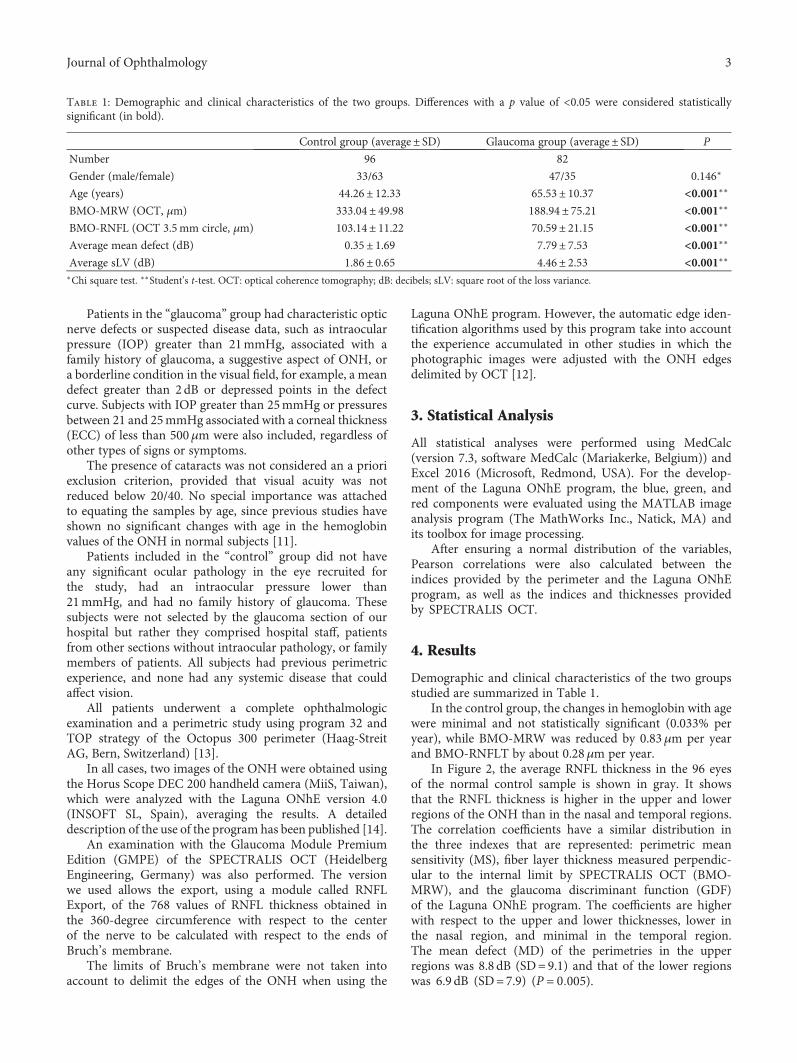
In the control group, the changes in hemoglobin with agewere minimal and not statistically significant (0.033% peryear), while BMO-MRW was reduced by 0.83μm per yearand BMO-RNFLT by about 0.28μm per year.
In Figure 2, the average RNFL thickness in the 96 eyesof the normal control sample is shown in gray. It showsthat the RNFL thickness is higher in the upper and lowerregions of the ONH than in the nasal and temporal regions.The correlation coefficients have a similar distribution inthe three indexes that are represented: perimetric meansensitivity (MS), fiber layer thickness measured perpendic-ular to the internal limit by SPECTRALIS OCT (BMO-MRW), and the glaucoma discriminant function (GDF)of the Laguna ONhE program. The coefficients are higherwith respect to the upper and lower thicknesses, lower inthe nasal region, and minimal in the temporal region.The mean defect (MD) of the perimetries in the upperregions was 8.8 dB (SD=9.1) and that of the lower regionswas 6.9 dB (SD=7.9) (P = 0 005).
Table 1: Demographic and clinical characteristics of the two groups. Differences with a p value of <0.05 were considered statisticallysignificant (in bold).
Control group (average± SD) Glaucoma group (average± SD) P
Number 96 82
Gender (male/female) 33/63 47/35 0.146∗
Age (years) 44.26± 12.33 65.53± 10.37 <0.001∗∗BMO-MRW (OCT, μm) 333.04± 49.98 188.94± 75.21 <0.001∗∗BMO-RNFL (OCT 3.5mm circle, μm) 103.14± 11.22 70.59± 21.15 <0.001∗∗Average mean defect (dB) 0.35± 1.69 7.79± 7.53 <0.001∗∗Average sLV (dB) 1.86± 0.65 4.46± 2.53 <0.001∗∗∗Chi square test. ∗∗Student’s t-test. OCT: optical coherence tomography; dB: decibels; sLV: square root of the loss variance.
3Journal of Ophthalmology
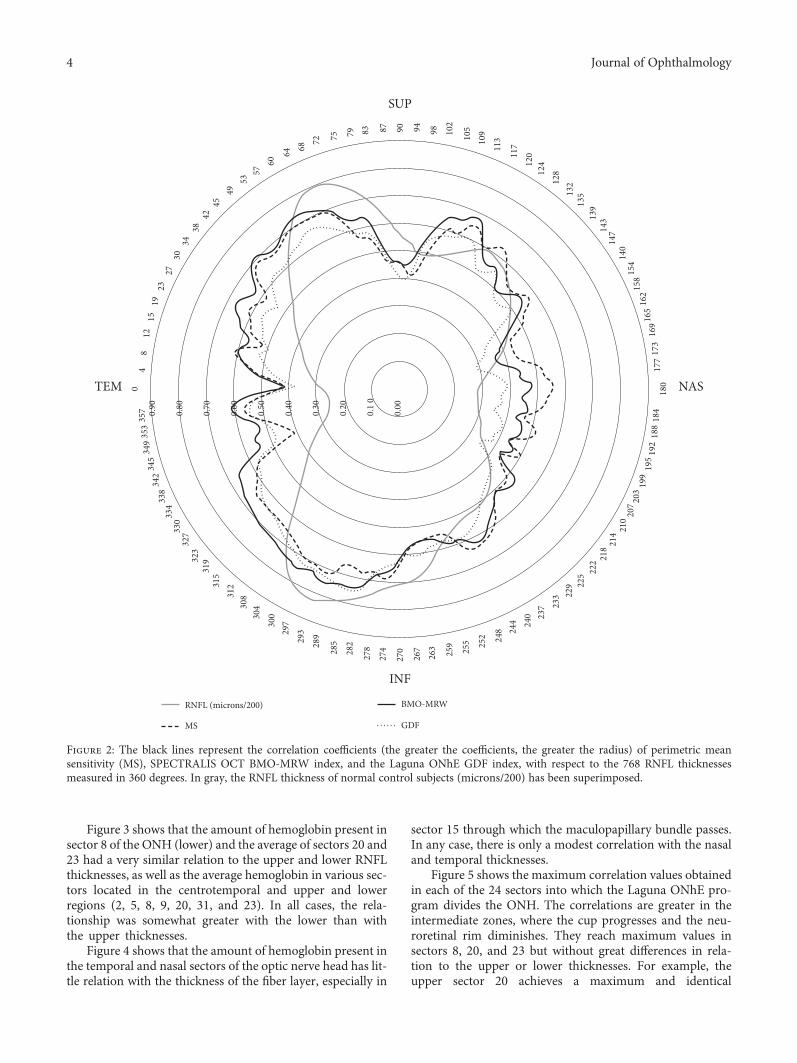
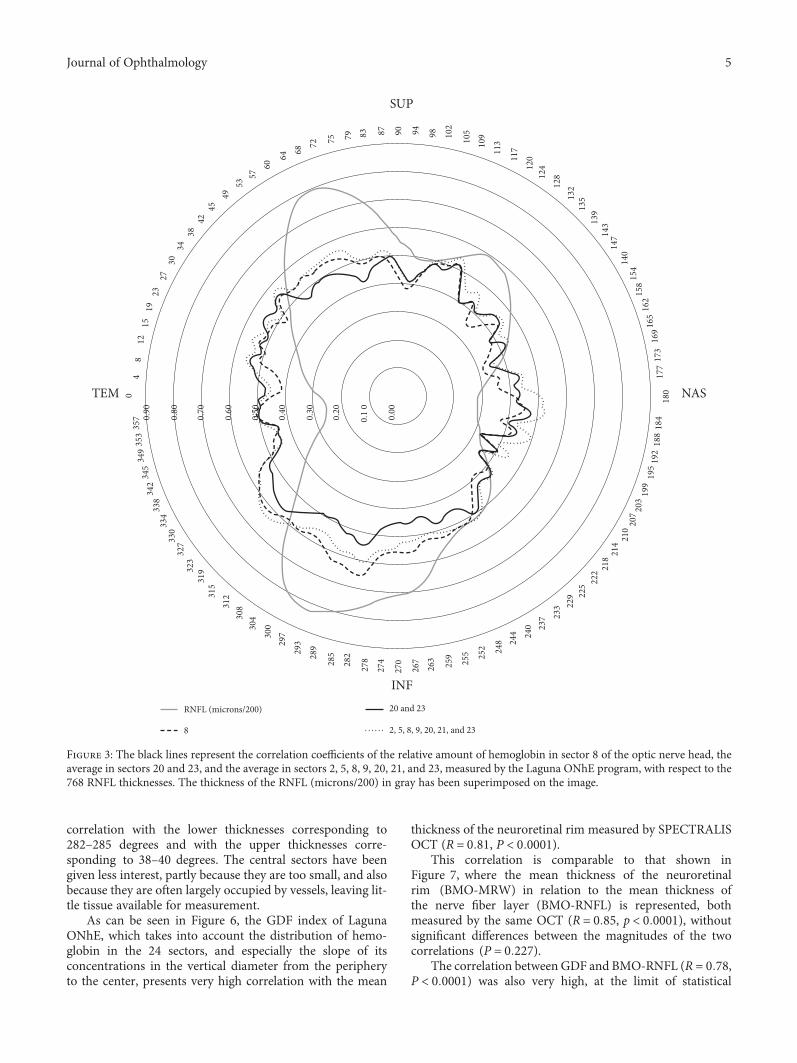
Figure 3 shows that the amount of hemoglobin present insector 8 of the ONH (lower) and the average of sectors 20 and23 had a very similar relation to the upper and lower RNFLthicknesses, as well as the average hemoglobin in various sec-tors located in the centrotemporal and upper and lowerregions (2, 5, 8, 9, 20, 31, and 23). In all cases, the rela-tionship was somewhat greater with the lower than withthe upper thicknesses.
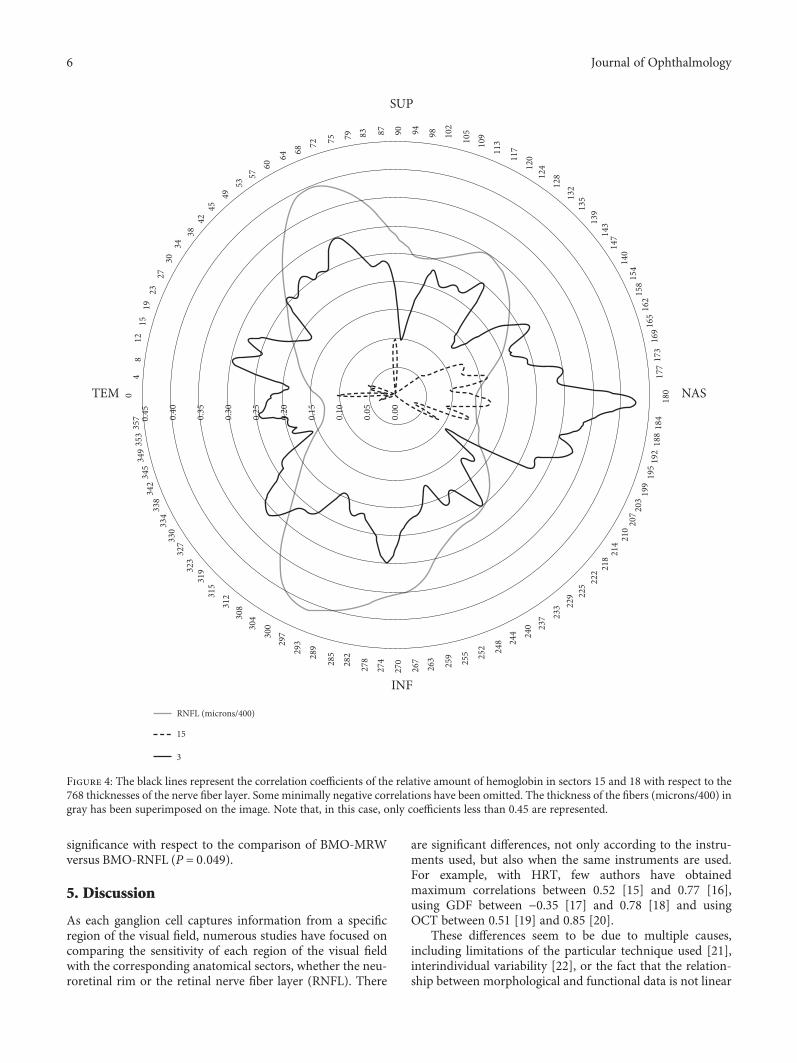
Figure 4 shows that the amount of hemoglobin present inthe temporal and nasal sectors of the optic nerve head has lit-tle relation with the thickness of the fiber layer, especially in
sector 15 through which the maculopapillary bundle passes.In any case, there is only a modest correlation with the nasaland temporal thicknesses.
Figure 5 shows the maximum correlation values obtainedin each of the 24 sectors into which the Laguna ONhE pro-gram divides the ONH. The correlations are greater in theintermediate zones, where the cup progresses and the neu-roretinal rim diminishes. They reach maximum values insectors 8, 20, and 23 but without great differences in rela-tion to the upper or lower thicknesses. For example, theupper sector 20 achieves a maximum and identical
SUP
NASTEM
INF
0.90
0.80
0.70
0.60
0.50
0.40
0.30
0.20
0.1
0
0.00
04
812
1519
2327
3034
3842
4549
5357
60
64 6872 75 79 83 87 90 94 98 10
2
105
109
113
117
120
124
128
132
135
139
143
147
140
154
158
162
165
169
173
177
180
184
188
192
195
199
203
207
210
214
218
225 22
2
229
233
237
244 24
0
248
252
255
259
263
267
270
274
27828
2
28528
929329
730030
430831
2
323
319
32733
0334
338
345
342
349
353
357
315
RNFL (microns/200)
MS
BMO-MRW
GDF
Figure 2: The black lines represent the correlation coefficients (the greater the coefficients, the greater the radius) of perimetric meansensitivity (MS), SPECTRALIS OCT BMO-MRW index, and the Laguna ONhE GDF index, with respect to the 768 RNFL thicknessesmeasured in 360 degrees. In gray, the RNFL thickness of normal control subjects (microns/200) has been superimposed.
4 Journal of Ophthalmology
correlation with the lower thicknesses corresponding to282–285 degrees and with the upper thicknesses corre-sponding to 38–40 degrees. The central sectors have beengiven less interest, partly because they are too small, and alsobecause they are often largely occupied by vessels, leaving lit-tle tissue available for measurement.
As can be seen in Figure 6, the GDF index of LagunaONhE, which takes into account the distribution of hemo-globin in the 24 sectors, and especially the slope of itsconcentrations in the vertical diameter from the peripheryto the center, presents very high correlation with the mean
thickness of the neuroretinal rim measured by SPECTRALISOCT (R = 0 81, P < 0 0001).
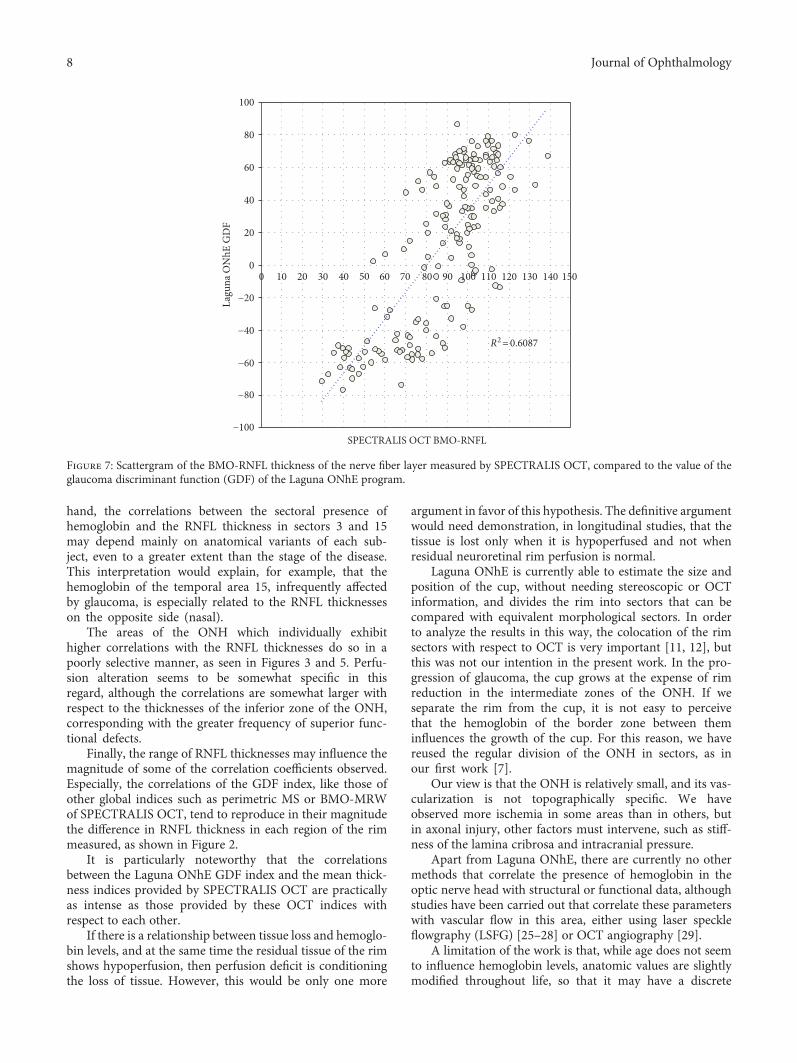
This correlation is comparable to that shown inFigure 7, where the mean thickness of the neuroretinalrim (BMO-MRW) in relation to the mean thickness ofthe nerve fiber layer (BMO-RNFL) is represented, bothmeasured by the same OCT (R = 0 85, p < 0 0001), withoutsignificant differences between the magnitudes of the twocorrelations (P = 0 227).
The correlation between GDF and BMO-RNFL (R = 0 78,P < 0 0001) was also very high, at the limit of statistical
SUP
NASTEM
INF
0.90
0.80
0.70
0.60
0.50
0.40
0.30
0.20
0.1
0
0.00
04
812
1519
2327
3034
3842
4549
5357
60
64 6872 75 79 83 87 90 94 98 10
2
105
109
113
117
120
124
128
132
135
139
143
147
140
154
158
162
165
169
173
177
180
184
188
192
195
199
203
207
210
214
218
225 22
2
229
233
237
244 24
0
248
252
255
259
263
267
270
274
27828
2
28528
929329
730030
430831
2
323
319
32733
0334
338
345
342
349
353
357
315
RNFL (microns/200)
8
20 and 23
2, 5, 8, 9, 20, 21, and 23
Figure 3: The black lines represent the correlation coefficients of the relative amount of hemoglobin in sector 8 of the optic nerve head, theaverage in sectors 20 and 23, and the average in sectors 2, 5, 8, 9, 20, 21, and 23, measured by the Laguna ONhE program, with respect to the768 RNFL thicknesses. The thickness of the RNFL (microns/200) in gray has been superimposed on the image.
5Journal of Ophthalmology
significance with respect to the comparison of BMO-MRWversus BMO-RNFL (P = 0 049).
5. Discussion
As each ganglion cell captures information from a specificregion of the visual field, numerous studies have focused oncomparing the sensitivity of each region of the visual fieldwith the corresponding anatomical sectors, whether the neu-roretinal rim or the retinal nerve fiber layer (RNFL). There
are significant differences, not only according to the instru-ments used, but also when the same instruments are used.For example, with HRT, few authors have obtainedmaximum correlations between 0.52 [15] and 0.77 [16],using GDF between −0.35 [17] and 0.78 [18] and usingOCT between 0.51 [19] and 0.85 [20].
These differences seem to be due to multiple causes,including limitations of the particular technique used [21],interindividual variability [22], or the fact that the relation-ship between morphological and functional data is not linear
SUP
NASTEM
INF
0.45 0.40
0.35
0.30
0.25
0.20
0.15
0.10
0.05
0.00
04
812
1519
2327
3034
3842
4549
5357
60
64 6872 75 79 83 87 90 94 98 10
2
105
109
113
117
120
124
128
132
135
139
143
147
140
154
158
162
165
169
173
177
180
184
188
192
195
199
203
207
210
214
218
225 22
2
229
233
237
244 24
0
248
252
255
259
263
267
270
274
27828
2
28528
929329
730030
430831
2
323
319
32733
0334
338
345
342
349
353
357
315
RNFL (microns/400)
15
3
Figure 4: The black lines represent the correlation coefficients of the relative amount of hemoglobin in sectors 15 and 18 with respect to the768 thicknesses of the nerve fiber layer. Some minimally negative correlations have been omitted. The thickness of the fibers (microns/400) ingray has been superimposed on the image. Note that, in this case, only coefficients less than 0.45 are represented.
6 Journal of Ophthalmology

but curvilinear [23]. Another factor described by our group isthat the correlation coefficients obtained were dependent onthe range of RNFL thicknesses at each point [24].
Several of these factors may serve to interpret the resultsof the correlations that we obtained in the present work
between the amount of hemoglobin and RNFL thicknesses.One of the problems mentioned above does not seem to haveany influence in this case, because we consistently observed alinear relationship between the morphological parametersand those obtained by measuring hemoglobin. On the other
45 135
TEM 0 NAS 180
SUP 90
INF 270
315 225
0.47
0.51
0.32
0.40
0.66
0.56
0.41 0.56
0.41 0.50
0.17 0.34 0.25 0.290.47 0.43
0.31 0.45
0.31 0.33
0.41 0.30
0.31 0.32
(19–23)
(38–40)(282–285)
(282–284)
(317–322)
(184–187)(187) (315–318) (182)
(283–287) (316–324)
(183–184)(181‒183)
(19–23) (273–275)
(23–30) (316–318)
Figure 5: Best correlation coefficients obtained in each sector of the optic nerve head and thicknesses specified by its angular position(degrees) of the circle of fiber thickness where they were obtained (below the correlations, in brackets).
R2=0.6496
100
80
60
40
20
Lagu
na O
NhE
GD
F
SPECTRALIS OCT BMO-MRW
00 50 100 150 200 250 300 350 400 450 500
‒20
‒40
‒60
‒80
‒100
Figure 6: Scattergram of the BMO-MRW thickness that SPECTRALIS OCT measures in the neuroretinal rim, compared to the value of theglaucoma discriminant function (GDF) of the Laguna ONhE program.
7Journal of Ophthalmology
hand, the correlations between the sectoral presence ofhemoglobin and the RNFL thickness in sectors 3 and 15may depend mainly on anatomical variants of each sub-ject, even to a greater extent than the stage of the disease.This interpretation would explain, for example, that thehemoglobin of the temporal area 15, infrequently affectedby glaucoma, is especially related to the RNFL thicknesseson the opposite side (nasal).
The areas of the ONH which individually exhibithigher correlations with the RNFL thicknesses do so in apoorly selective manner, as seen in Figures 3 and 5. Perfu-sion alteration seems to be somewhat specific in thisregard, although the correlations are somewhat larger withrespect to the thicknesses of the inferior zone of the ONH,corresponding with the greater frequency of superior func-tional defects.
Finally, the range of RNFL thicknesses may influence themagnitude of some of the correlation coefficients observed.Especially, the correlations of the GDF index, like those ofother global indices such as perimetric MS or BMO-MRWof SPECTRALIS OCT, tend to reproduce in their magnitudethe difference in RNFL thickness in each region of the rimmeasured, as shown in Figure 2.
It is particularly noteworthy that the correlationsbetween the Laguna ONhE GDF index and the mean thick-ness indices provided by SPECTRALIS OCT are practicallyas intense as those provided by these OCT indices withrespect to each other.
If there is a relationship between tissue loss and hemoglo-bin levels, and at the same time the residual tissue of the rimshows hypoperfusion, then perfusion deficit is conditioningthe loss of tissue. However, this would be only one more
argument in favor of this hypothesis. The definitive argumentwould need demonstration, in longitudinal studies, that thetissue is lost only when it is hypoperfused and not whenresidual neuroretinal rim perfusion is normal.
Laguna ONhE is currently able to estimate the size andposition of the cup, without needing stereoscopic or OCTinformation, and divides the rim into sectors that can becompared with equivalent morphological sectors. In orderto analyze the results in this way, the colocation of the rimsectors with respect to OCT is very important [11, 12], butthis was not our intention in the present work. In the pro-gression of glaucoma, the cup grows at the expense of rimreduction in the intermediate zones of the ONH. If weseparate the rim from the cup, it is not easy to perceivethat the hemoglobin of the border zone between theminfluences the growth of the cup. For this reason, we havereused the regular division of the ONH in sectors, as inour first work [7].
Our view is that the ONH is relatively small, and its vas-cularization is not topographically specific. We haveobserved more ischemia in some areas than in others, butin axonal injury, other factors must intervene, such as stiff-ness of the lamina cribrosa and intracranial pressure.
Apart from Laguna ONhE, there are currently no othermethods that correlate the presence of hemoglobin in theoptic nerve head with structural or functional data, althoughstudies have been carried out that correlate these parameterswith vascular flow in this area, either using laser speckleflowgraphy (LSFG) [25–28] or OCT angiography [29].
A limitation of the work is that, while age does not seemto influence hemoglobin levels, anatomic values are slightlymodified throughout life, so that it may have a discrete
R2 = 0.6087
100
80
60
40
20La
guna
ON
hE G
DF
SPECTRALIS OCT BMO-RNFL
00
−20
−40
−60
−80
−100
10 20 30 40 50 60 70 80 90 100 110 120 130 140 150
Figure 7: Scattergram of the BMO-RNFL thickness of the nerve fiber layer measured by SPECTRALIS OCT, compared to the value of theglaucoma discriminant function (GDF) of the Laguna ONhE program.
8 Journal of Ophthalmology
influence on the correlations observed. In this regard, thedata obtained in the present study are similar to thosereported by other authors [30–32].
6. Conclusions
From the results obtained in this work, we can conclude thathemoglobin concentrations in the superior and superotem-poral regions as well as in the inferior and inferotemporalregions of the ONH have an evident dependent relationshipwith the thinning of the RNFL, but without a close topo-graphic relationship region by region. The GDF index has avery high correlation with the mean thickness of the RNFLand the thickness of the neuroretinal rim in the ONH itself,indicating that perfusion and axonal atrophy are intimatelylinked to each other.
Conflicts of Interest
Marta Gonzalez-Hernandez andManuel Gonzalez de la Rosahave a proprietary interest in the Laguna ONhE patent.Jose Sigut Saavedra declare that there is no conflict of interestregarding the publication of this article.
Acknowledgments
This study is supported in part by Grant PI12/02307 of theInstituto de Salud Carlos III with FEDER funds. Translationfrom Spanish into English is credited to Michael McLean(in memoriam: this was his last translation).
References
[1] J. Flammer, I. O. Haefliger, S. Orgül, and T. Resink, “Vasculardysregulation: a principal risk factor for glaucomatousdamage?” Journal of Glaucoma, vol. 8, pp. 212–219, 1999.
[2] A. Harris, R. C. Sergott, G. L. Spaeth, J. L. Katz, J. A. Shoemaker,and B. J. Martin, “Color Doppler analysis of ocular vessel bloodvelocity in normal-tension glaucoma,” American Journal ofOphthalmology, vol. 118, pp. 642–649, 1994.
[3] J. B. Hickam, H. O. Sieker, and R. Frayser, “Studies of retinalcirculation and A-V oxygen difference in man,” Transactionsof the American Clinical and Climatological Association,vol. 71, pp. 34–44, 1959.
[4] Y. Jia, J. C. Morrison, J. Tokayer et al., “Quantitative OCTangiography of optic nerve head blood flow,” BiomedicalOptics Express, vol. 3, pp. 3127–3137, 2012.
[5] C. E. Riva, J. Grunwald, and S. H. Sinclair, “Laser Dopplermeasurement of relative blood velocity in the human opticnerve head,” Investigative Ophthalmology & Visual Science,vol. 22, pp. 241–248, 1982.
[6] T. Sugiyama, M. Araie, C. E. Riva, L. Schmetterer, and S. Orgul,“Use of laser speckle flowgraphy in ocular blood flowresearch,” Acta Ophthalmologica, vol. 88, pp. 723–729, 2010.
[7] M. Gonzalez de la Rosa, M. Gonzalez-Hernandez, J. Sigut et al.,“Measuring hemoglobin levels in the optic nerve head: com-parisons with other structural and functional parameters ofglaucoma,” Investigative Ophthalmology & Visual Science,vol. 54, pp. 482–489, 2013.
[8] I. Rodriguez Uña, C. D. Mendez Hernandez, F. Saenz-Frances,and F. J. Garcia, “Correlacion de la relacion excavacion/papila
medida mediante HRT-III, SD-OCT y el dispositivo de color-imetria fotográfica Laguna ONhE,” Archivos de la SociedadEspañola de Oftalmología, vol. 90, pp. 212–219, 2015.
[9] C. Mendez-Hernandez, J. Garcia-Feijoo, P. Arribas-Pardoet al., “Reproducibility of optic nerve head hemoglobin mea-sures,” Journal of Glaucoma, vol. 25, pp. 348–354, 2016.
[10] C. Mendez-Hernandez, I. Rodriguez-Uña, M. Gonzalez-de-laRosa, P. Arribas-Pardo, and J. Garcia-Feijoo, “Glaucoma diag-nostic capacity of optic nerve head haemoglobin measurescompared with spectral domain OCT and HRT III confocaltomography,” Acta Ophthalmologica, vol. 94, pp. 697–704,2016.
[11] C. Pena-Betancor, M. Gonzalez-Hernandez, F. Fumero-Batistaet al., “Estimation of the relative amount of hemoglobin in thecup and neuroretinal rim using stereoscopic color fundusimages,” Investigative Ophthalmology & Visual Science,vol. 56, pp. 1562–1568, 2015.
[12] E. Medina-Mesa, M. Gonzalez-Hernandez, J. Sigut et al.,“Estimating the amount of hemoglobin in the neuroretinalrim using color images and OCT,” Current Eye Research,vol. 41, pp. 798–805, 2016.
[13] M. Gonzalez de la Rosa, A. Martinez, M. Sanchez, C. Mesa, L.Cordoves, and M. J. Losada, “Accuracy of the tendencyoriented perimetry (TOP) in the Octopus 1-2-3 perimeter,”in Perimetry Update 1996/1997, M. Wall and J. Wild, Eds.,pp. 119–123, Kugler Publ, Amsterdam, 1997.
[14] M. Gonzalez de la Rosa, M. Gonzalez-Hernandez, C. Mendezet al., “Measuring hemoglobin levels in the optic nerve headfor glaucoma management,” in Glaucoma imaging, A.Ferreras, Ed., pp. 265–280, Springer, Heidelberg, New York,Dordrecht, London, 2016.
[15] S. Gardiner, C. A. Johnson, and G. A. Cioffi, “Evaluation ofthe structure-function relationship in glaucoma,” Investiga-tive Ophthalmology & Visual Science, vol. 46, pp. 3712–3717, 2005.
[16] N. J. Reus and H. G. Lemij, “Relationships between stan-dard automated perimetry, HRT confocal scanning laserophthalmoscopy, and GDx VCC scanning laser polarime-try,” Investigative Ophthalmology & Visual Science, vol. 46,pp. 4182–4188, 2005.
[17] M. Iester, A. Perdicchi, F. De Feo et al., “Comparisonbetween GDx VCC parameter and achromatic perimetryin glaucoma patients,” Journal of Glaucoma, vol. 15,pp. 281–285, 2006.
[18] T. A. Mai, N. J. Reus, and H. G. Lemij, “Structure-functionrelationship is stronger with enhanced corneal compensationthan with variable corneal compensation in scanning laserpolarimetry,” Investigative Ophthalmology & Visual Science,vol. 48, pp. 1651–1658, 2007.
[19] N. Nilforushan, N. Nassiri, S. Moghimi et al., “Structure-func-tion relationships between spectral-domain OCT and standardachromatic perimetry,” Investigative Ophthalmology & VisualScience, vol. 53, pp. 2740–2748, 2012.
[20] F. Aptel, R. Sayous, V. Fortoul, S. Beccat, and P. Denis,“Structure-function relationships using spectral-domainoptical coherence tomography: comparison with scanninglaser polarimetry,” American Journal of Ophthalmology,vol. 150, pp. 825–823, 2012.
[21] S. Graham, “Defining the structure/function relationship inglaucoma,” Clinical & Experimental Ophthalmology, vol. 40,pp. 337-338, 2012.
9Journal of Ophthalmology
[22] C. G. De Moraes, J. M. Liebmann, R. Ritch, and D. C. Hood,“Understanding disparities among diagnostic technologiesin glaucoma,” Archives of Ophthalmology, vol. 130, pp. 833–841, 2012.
[23] D. F. Garway-Heath, J. Caprioli, F. W. Fitzke, and R. A.Hitchings, “Scaling the hill of vision: the physiological rela-tionship between light sensitivity and ganglion cell numbers,”Investigative Ophthalmology & Visual Science, vol. 41,pp. 1774–1782, 2000.
[24] M. Gonzalez de la Rosa, “The existing controversy in today’sparadigm between functional and morphological analysis,” inGlaucoma Suspect Book, The Frontier, J. Jimenez-Roman andV. P. Costa, Eds., pp. 131–140, Elsevier, Mexico, 2015.
[25] S. Yokokura, N. Fuse, and T. Nakazawa, “Association betweenoptic nerve blood flow and objective examinations in glau-coma patients with generalized enlargement disc type,”Clinical Ophthalmology, vol. 5, pp. 1549–1556, 2011.
[26] N. Kiyota, Y. Shiga, H. Takahashi, and T. Nakazawa, “Largevessel area of the optic nerve head, measured with laser speckleflowgraphy, is significantly reduced in eyes with preperimetricglaucoma,” Clinical and Experimental Ophthalmology, vol. 43,pp. 841–843, 2015.
[27] Y. Shiga, H. Kunikata, N. Aizawa et al., “Optic nerve headblood flow, as measured by laser speckle flowgraphy, is signif-icantly reduced in preperimetric glaucoma,” Current eyeResearch, vol. 41, pp. 1447–1453, 2016.
[28] W. Kobayashi, H. Kunikata, K. Omodaka et al., “Correlation ofoptic nerve microcirculation with papillomacular bundlestructure in treatment naive normal tension glaucoma,” Jour-nal of Ophthalmology, vol. 2014, Article ID 468908, p. 9, 2014.
[29] X. Wang, C. Jiang, T. Ko et al., “Correlation between optic discperfusion and glaucomatous severity in patients with open-angle glaucoma: an optical coherence tomography angiogra-phy study,” Graefe's Archive for Clinical and ExperimentalOphthalmology, vol. 253, pp. 1557–1564, 2015.
[30] A. R. Celebi and G. E. Mirza, “Age-related change in retinalnerve fiber layer thickness measured with spectral domainoptical coherence tomography,” Investigative Ophthalmology& Visual Science, vol. 54, pp. 8095–8103, 2013.
[31] J. Y. Lee, Y. H. Hwang, S. M. Lee, and Y. Y. Kim, “Age andretinal nerve fiber layer thickness measured by spectraldomain optical coherence tomography,” Korean Journal ofOphthalmology, vol. 26, pp. 163–168, 2012.
[32] C. K. Leung, M. Yu, R. N. Weinreb et al., “Retinal nervefiber layer imaging with spectral-domain optical coherencetomography: a prospective analysis of age-related loss,”Ophthalmology, vol. 119, pp. 731–737, 2012.
10 Journal of Ophthalmology

Submit your manuscripts athttps://www.hindawi.com
Stem CellsInternational
Hindawi Publishing Corporationhttp://www.hindawi.com Volume 2014
Hindawi Publishing Corporationhttp://www.hindawi.com Volume 2014
MEDIATORSINFLAMMATION
of
Hindawi Publishing Corporationhttp://www.hindawi.com Volume 2014
Behavioural Neurology
EndocrinologyInternational Journal of
Hindawi Publishing Corporationhttp://www.hindawi.com Volume 2014
Hindawi Publishing Corporationhttp://www.hindawi.com Volume 2014
Disease Markers
Hindawi Publishing Corporationhttp://www.hindawi.com Volume 2014
BioMed Research International
OncologyJournal of
Hindawi Publishing Corporationhttp://www.hindawi.com Volume 2014
Hindawi Publishing Corporationhttp://www.hindawi.com Volume 2014
Oxidative Medicine and Cellular Longevity
Hindawi Publishing Corporationhttp://www.hindawi.com Volume 2014
PPAR Research
The Scientific World JournalHindawi Publishing Corporation http://www.hindawi.com Volume 2014
Immunology ResearchHindawi Publishing Corporationhttp://www.hindawi.com Volume 2014
Journal of
ObesityJournal of
Hindawi Publishing Corporationhttp://www.hindawi.com Volume 2014
Hindawi Publishing Corporationhttp://www.hindawi.com Volume 2014
Computational and Mathematical Methods in Medicine
OphthalmologyJournal of
Hindawi Publishing Corporationhttp://www.hindawi.com Volume 2014
Diabetes ResearchJournal of
Hindawi Publishing Corporationhttp://www.hindawi.com Volume 2014
Hindawi Publishing Corporationhttp://www.hindawi.com Volume 2014
Research and TreatmentAIDS
Hindawi Publishing Corporationhttp://www.hindawi.com Volume 2014
Gastroenterology Research and Practice
Hindawi Publishing Corporationhttp://www.hindawi.com Volume 2014
Parkinson’s Disease
Evidence-Based Complementary and Alternative Medicine
Volume 2014Hindawi Publishing Corporationhttp://www.hindawi.com