relationship between irisin concentration and serum ... · maria hernandez-trejo1, gerardo...
TRANSCRIPT

RESEARCH ARTICLE
Relationship between Irisin Concentration
and Serum Cytokines in Mother and Newborn
Maria Hernandez-Trejo1, Gerardo Garcia-Rivas2,3, Alejandro Torres-Quintanilla2,
Estibalitz Laresgoiti-Servitje4*
1 Neurobiology of Development, Instituto Nacional de Perinatologia, Mexico City, Mexico, 2 Catedra de
Cardiologia, Escuela Nacional de Medicina, Tecnologico de Monterrey, Monterrey, Mexico, 3 Centro de
Investigacion Biomedica, Hospital Zambrano-Hellion, Tecnologico de Monterrey, San Pedro Garza-Garcia,
Mexico, 4 Basic Medical Sciences, TEC-ABC School of Medicine, Tecnologico de Monterrey, Mexico City,
Mexico
Abstract
Introduction
Irisin is considered to be a myokine and adipokine that may also participate in reproductive
functions, as it increases significantly throughout pregnancy. However, the regulation of cir-
culating irisin and its relationship with other cytokines has not been assessed thus far in
pregnant women and their offspring.
Objective
The aim of this study was to evaluate differences in irisin and cytokine concentrations
between women at the end of pregnancy and their offspring, as well as the relationship
between maternal and newborn irisin and maternal and newborn biomarkers.
Methods
Twenty-eight mother/newborn pairs were included in this study. The following biomarkers
were evaluated in maternal venous and arterial umbilical cord blood samples: irisin, 27 cyto-
kine panel, total antioxidant capacity (TAC), total plasma protein, and free fatty acid
concentration.
Results
The newborns had significantly lower irisin concentrations compared to their mothers (p =
0.03), but this difference was present only in babies born from mothers without labor prior to
cesarean section delivery (p = 0.01). No significant differences in maternal and newborn iri-
sin concentrations were found between diabetic and non-diabetic mothers or between over-
weight/obese and normal weight mothers. A significant positive correlation was found
between TAC level and irisin concentration in newborns. Maternal and newborn interleukin
(IL)-1β, IL-1RA, IL-5, IL-7, and interferon gamma-induced protein (IP)-10 levels were signifi-
cantly positively correlated with irisin concentrations in both study groups. In addition, mater-
nal IL1β, IL-5, IL-7, and IP-10 levels positively predicted maternal irisin concentrations.
PLOS ONE | DOI:10.1371/journal.pone.0165229 November 9, 2016 1 / 13
a11111
OPENACCESS
Citation: Hernandez-Trejo M, Garcia-Rivas G,
Torres-Quintanilla A, Laresgoiti-Servitje E (2016)
Relationship between Irisin Concentration and
Serum Cytokines in Mother and Newborn. PLoS
ONE 11(11): e0165229. doi:10.1371/journal.
pone.0165229
Editor: Harald Staiger, Medical Clinic, University
Hospital Tuebingen, GERMANY
Received: April 19, 2016
Accepted: October 7, 2016
Published: November 9, 2016
Copyright: © 2016 Hernandez-Trejo et al. This is an
open access article distributed under the terms of
the Creative Commons Attribution License, which
permits unrestricted use, distribution, and
reproduction in any medium, provided the original
author and source are credited.
Data Availability Statement: The dataset that
supports the results presented in this manuscript
has been deposited in the Dataverse repository,
https://dataverse.harvard.edu/dataset.xhtml?
persistentId=doi:10.7910/DVN/Y87VEO.
Funding: This study was supported by the National
Institute of Perinatology, Mexico, Reg (384)
212250-22651 (Maria Hernandez-Trejo). Irisin
ELISA detection kits used in this study were
supported by CONACYT-Mexico grant 151136.The
funders had no role in study design, data collection
Furthermore, arterial cord blood TAC and IL-1β and IL1-RA levels positively predicted new-
born irisin concentrations. Multiple regression analyses showed that maternal IL-13 nega-
tively predicted offspring irisin levels (p = 0.03) and that maternal IL-1β positively predicted
newborn irisin concentrations (p = 0.046).
Conclusion
No evidence was found that serum irisin concentrations in mothers at pregnancy termination
or those of their newborns correlated with maternal body mass index, the presence of diabe-
tes mellitus, or free fatty acid levels. However, the results of this study indicated that cyto-
kines might predict irisin concentration in mothers and their offspring, although interactions
between irisin levels during pregnancy and the newborn have not yet been fully elucidated.
Introduction
In 2012, Bostrom et al. discovered irisin, a myokine capable of inducing fat browning and
increasing energy expenditure [1]. Some studies refer that this myokine is secreted after exer-
cise due to proteolytic cleavage of the membrane protein fibronectin-type III domain-contain-
ing protein 5 (FNDC5)[1–3]. Other researchers have only found an increase in irisin during
acute exercise in seniors[4]. Moreover, some authors have failed to demonstrate an effect of
exercise on irisin concentrations [5–7], indicating that the irisin-exercise relationship is not
completely understood.
Raschke et al. showed a mutation (ATG to ATA) in the conserved start codon of the
FNDC5 gene in humans that might account for a very low FNDC5 mRNA translation into
protein[7]. Even though irisin appears to have a non-canonical ATA translation start in
humans, the presence of circulating irisin has been confirmed by mass spectrometry [3]. Since
its discovery, extensive research has been carried out to understand the role of irisin in disor-
ders associated with insulin resistance, such as obesity and diabetes mellitus (DM) [6, 8, 9].
Pregnancy is known to be a state of progressive insulin resistance during which levels simi-
lar to those of DM patients are reached [10]. Circulating levels of irisin are also higher in preg-
nant women than in non-pregnant women [11]. Interestingly, irisin levels are lower in
pregnant women with gestational DM (GDM) compared to body mass index (BMI)-matched
glucose tolerant patients [12–14]. Maternal metabolic alterations can lead to complications
such as macrosomia in newborns, and recent reports have shown that newborn irisin levels
correlated with birthweight [15]. In addition, lower irisin levels have been found in cord blood
samples from newborns with intrauterine growth restriction, which may result in less brow-
ning of adipose tissue in these babies [16]. Thus, irisin might play an important role in the reg-
ulation of maternal–fetal glucose homeostasis.
Pregnancy is also associated with increased oxidative stress [17, 18]. It has been reported
that total antioxidant capacity (TAC) is lower during the first 30 weeks of pregnancy and
increases to normal levels after reaching 37 weeks of gestation or labor [17]. Irisin has been
shown to prevent oxidative stress in the liver through the inhibition of protein arginine
methyltransferase-3 [19]. However, whether irisin plays a role in the redox state during preg-
nancy is not known.
Furthermore, normal gestation has been described as an inflammatory state [20–22]. While
irisin has been labeled as a contraction-regulated myokine along with interleukin (IL)-6, IL-
Irisin and Cytokine Concentrations in Mother and Offspring
PLOS ONE | DOI:10.1371/journal.pone.0165229 November 9, 2016 2 / 13
and analysis, decision to publish, or preparation of
the manuscript.
Competing Interests: The authors have declared
that no competing interests exist.
15, and monocyte chemotactic protein 1 [23], unlike the others, it does not function as an
inflammatory cytokine and does not activate nuclear factor kappa B inflammatory pathways
[24]. In fact, it might actually have anti-inflammatory properties, as it can reduce the gene
expression of IL-6, tumor necrosis factor α, macrophage inflammatory protein (MIP)-1α, and
MIP-1β [25]. Nonetheless, whether irisin is associated with inflammatory markers during
pregnancy is unknown.
The aim of this study was to evaluate differences in irisin concentrations between women at
the end of pregnancy and their newborns, as well as the relationship between maternal and off-
spring irisin and maternal and newborn biomarkers.
Materials and Methods
This study was conducted at Instituto Nacional de Perinatologia, a third-level health care insti-
tution in Mexico City. The Research and Ethics Committees of the Instituto Nacional de Peri-
natologia "Isidro Espinosa de los Reyes" approved the study prior to patient enrollment.
Written informed consent was also obtained from all the participants. Upon admission to the
Labor and Delivery Unit, women who met the inclusion criteria and agreed to participate
signed an informed consent form. Only patients with single, non-complicated pregnancies
who had not received medication three weeks prior to delivery were enrolled in the study.
Twenty-eight women were recruited, and their obstetric outcomes and clinical and demo-
graphic data were retrieved from their medical records. Maternal blood was obtained by veni-
puncture prior to delivery, and neonatal blood was obtained after placental delivery using a
sterile method by umbilical cord arterial puncture. The blood was collected in heparinized,
mineral-free, BD Vacutainer brand tubes (NJ, USA), centrifuged at 3500 RPM, and the eryth-
rocytes and plasma were aliquoted in mineral-free vials. The samples were maintained under
refrigerated conditions at all times until stored in an ultra-freezer at -86˚C for further analysis.
Irisin, free fatty acid, TAC, plasma protein, and cytokine concentrations of all samples were
measured.
Irisin quantitation
Irisin levels were measured using a commercial human irisin enzyme-linked immunosorbent
assay (ELISA) kit (Phoenix Pharmaceuticals, Burlingame, CA, USA) according to the manu-
facturer’s instructions. The detection range was 0.07–1024.00 ng/mL. Each sample was assayed
in duplicate and the means were used for analysis. The intra- and interassay variation coeffi-
cients were 7.0% and 9.5%, respectively.
Cytokine quantitation
Cytokine concentrations in maternal and umbilical blood serum were measured using a
27-plex panel cytokine assay (Bio-Plex; Bio-Rad, CA, USA).
Plasma protein concentration
Plasma proteins were quantitated using Lowry’s method [26].
Total antioxidant capacity (TAC)
The cupric reducing antioxidant capacity spectrophotometric method was used to measure
TAC, which resulted in an absorbance at 450 nm [27].
Irisin and Cytokine Concentrations in Mother and Offspring
PLOS ONE | DOI:10.1371/journal.pone.0165229 November 9, 2016 3 / 13

Free fatty acid quantitation
Free fatty acid concentrations were assessed using the colorimetric method developed by Dun-
combe [28].
Statistical Analysis
SPSS software version 22 (IBM, Armonk, NY, USA) was used to conduct the statistical analy-
ses. Before executing the analyses, the assessment of univariate and multivariate outliers was
performed. Data was tested for univariate and multivariate normality, linearity, and homosce-
dasticity. No variables required transformation. The statistical analyses performed included
paired and independent samples Student’s t tests, Pearson’s correlations, and multiple linear
regression analyses. A probability of α error <0.05 was considered significant
Results
Descriptive Statistics
Twenty-eight mother/newborn pairs were included in this study. Maternal mean age was
30.29 years (standard deviation [SD] 7.93) and mean pre-pregnancy body mass index (BMI)
was 26.4 Kg/m2 (SD 5.2). Seventeen (60.7%) of the women enrolled in this study were obese or
overweight, with a pre-pregnancy BMI�25 kg/m2; 20 participants (71.4%) were overweight at
pregnancy termination. Anthropometric data of mothers and offspring are presented in
Table 1. Nine patients (32.1%) had carbohydrate intolerance, GDM, or DM during the gesta-
tional period. The newborns had a mean weight of 3,010 g (SD 341.91); 14 (50%) were female
and 14 (50%) were male. Irisin mean concentrations were 151.48 ng/mL (SD 134.5) in the
mothers and 79.45 ng/mL (SD 14.9) in the offspring.
Inferential statistics
Paired samples Student’s t tests evaluated differences in irisin concentrations between mater-
nal and umbilical cord blood samples. The newborns had significantly lower irisin concentra-
tions compared to their mothers (94.8±77.1 vs. 151.4±127.0, ng/mL, p<0.03), and this
Table 1. Women and offspring anthropometric data. n = 28.
Mean (SD) Rank
(min-max)
Maternal age (years) 30.3 (7.9) 16–43
Pregestational weight (Kg) 64.7 (11.7) 50–103
Pre-pregnancy BMI (Kg/m2) 26.4 (5.2) 19.5–44.5
Weight gained during pregnancy (Kg) 11.5 (6.2) -4.2–25
BMI at end of Gestation (Kg/m2) 31.2 (4.5) 23.8–42.7
Gestational age at birth (weeks) 38.0 (1.1) 34.3–42
Weight at birth (grams) 2898 (341) 2355–3765
Height at birth (cm) 48.4 (1.9) 45–52
Neonatal head circumference (cm) 34.4 (1.1) 32–36
Neonatal thoracic perimeter (cm) 31.9 (1.5) 28–35
Neonatal abdominal circumference (cm) 29.8 (1.6) 25.5–33
Neonatal ponderal Index (grams/cm3x100) 2.63 (0.24) 2.13–3.02
BMI = Body Mass Index
doi:10.1371/journal.pone.0165229.t001
Irisin and Cytokine Concentrations in Mother and Offspring
PLOS ONE | DOI:10.1371/journal.pone.0165229 November 9, 2016 4 / 13

difference was present only in babies born from mothers without labor prior to caesarean sec-
tion as shown by paired-samples student t test after data splitting by labor (87.4±73.1 vs. 157.3
±129.8, ng/mL, p<0.01,) (Fig 1A). The irisin levels of the neonates born with labor did not dif-
fer from the maternal concentrations (130.1±94.8 vs. 123.1±122.0, ng/mL, p<0.9).
It was also observed that labor increased irisin concentrations in umbilical arterial blood by
nearly 40%, although this difference was not significant (87.4±73.1 vs. 130.1±94.8, ng/mL,
p<0.2). This tendency was not observed in the maternal samples (Table 2).
As shown in Fig 1B, mothers with pre-pregnancy normal weights had significantly higher
irisin concentrations compared to their offspring (171.3±124.6 vs. 88.7±81.4 ng/mL, p<0.04);
this difference was not reflected in overweight mothers (135.8±137.2 vs. 81.6±65.5, ng/mL,
p<0.2). There were no differences in irisin concentrations between mothers and newborns
according to BMI at the end of pregnancy, GDM diagnosis, or offspring gender (Table 2).
Maternal and newborn clinical characteristics were compared between normal weight vs.
overweight and diabetic vs. non-diabetic mothers. Unpaired Student’s t tests were performed
to evaluate differences between those groups for the following parameters: maternal age,
weight gain during pregnancy, gestational age at birth, newborn length, head circumference,
thoracic perimeter, and abdominal circumference (Table 3). Diabetic mothers were nearly
nine years older than non-diabetic mothers (36.2±5.2 vs. 27.6±7.6 years, p<0.0.5). Weight
gained during pregnancy was greater when pre-pregnancy weight was normal compared to
overweight (15.6±5.3 vs. 9.0 ± 5.4 kg, p<0.003) and in non-diabetic vs. diabetic mothers (13.8
±5.5 vs. 7.2±5.1 kg, p<0.004). Other clinical parameters did not differ between the groups
studied (Table 3).
TAC was almost 50% higher in maternal samples than in cord blood samples (1.339±0.152
vs. 0.7067±0.428 μmol trolox equivalents/mL, p<0.000). These differences were also present
when analyzing TAC by pre-pregnancy and end of pregnancy BMI (data not shown). Mean
protein concentration was 64.77±6.54 mg/mL in the maternal samples and 26.1±13.3 mg/mL
in the newborn samples. Cord blood sample protein concentration was almost 60% lower
compared to that of the mother, which might explain the differences in TAC values.
To study whether irisin levels were dependent on other clinical variables or biomarkers,
multiple linear regression and Pearson’s correlation were used. Pearson’s correlation revealed
a significant positive correlation between offspring TAC and irisin concentrations. On the
other hand, maternal and newborn IL-1β, IL-1Ra, IL-5, IL-7, and interferon gamma-induced
Fig 1. Irisin maternal levels are different from newborn when delivered without labor or when pre-pregnancy BMI is normal. Serum irisin levels
of mothers and newborns according to (A) delivery with or without labor and to (B) pre-pregnancy weight status. Data are presented as mean ± SEM
and * p < 0.05 compared to newborn using paired-samples Student’s t-test.
doi:10.1371/journal.pone.0165229.g001
Irisin and Cytokine Concentrations in Mother and Offspring
PLOS ONE | DOI:10.1371/journal.pone.0165229 November 9, 2016 5 / 13
protein 10 had significant positive correlations with irisin concentrations in both study groups.
Cord blood IL-6, interferon γ, monocyte chemotactic and activating factor (MCAF), and Reg-
ulated on Activation Normal T-cell expressed and secreted cytokine (RANTES) had significant
positive correlations with offspring irisin concentrations, whereas maternal IL-10 correlated
positively with maternal irisin concentrations. Conversely, free fatty acid concentrations did
not correlate with irisin concentrations in mothers (r = 0.02, p = 0.8) or newborns (r = 0.34,
p = 0.06) (data not shown).
Multiple lineal regression analyses were performed to evaluate whether TAC or cytokines
predict maternal or offspring irisin concentrations. Four independent variables were entered
per analysis. The results indicated that maternal IL-1β, IL-5, IL-7, and IP-10 positively pre-
dicted maternal irisin concentrations and that arterial cord blood TAC, IL-1β, and IL1-RA,
positively predicted newborn irisin concentrations. On the other hand, newborn platelet-
derived growth factor, IL-7, and MCAF negatively predicted newborn irisin concentrations.
While cord blood TAC positively predicted newborn irisin concentrations, TAC did not pre-
dict maternal irisin levels. Table 4 shows Pearson’s r values, B coefficients, and significant val-
ues for regression analyses between maternal biomarkers and maternal irisin and between
newborn biomarkers and newborn irisin concentrations. Notably, total plasma protein levels
did not significantly predict or correlate with irisin concentrations in either the mothers or the
offspring.
Lastly, multiple regression analyses were carried out to assess whether maternal cytokine
concentrations predict newborn irisin concentrations. Significant results were found for IL-13,
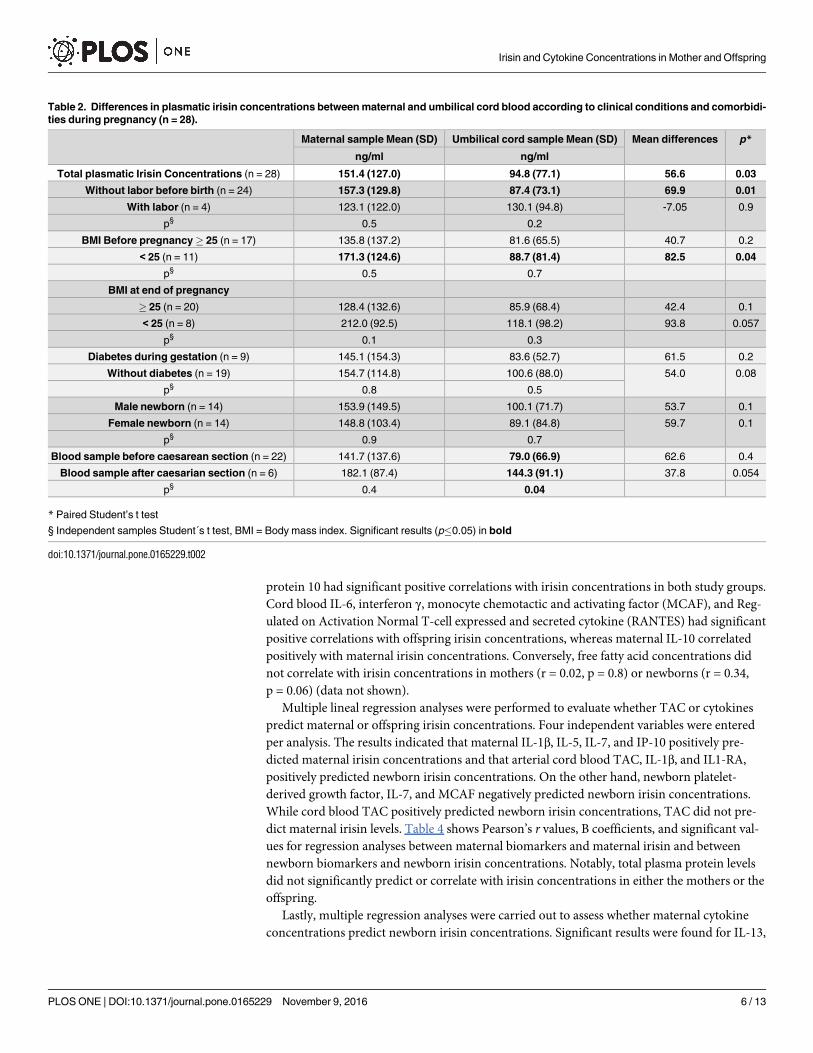
Table 2. Differences in plasmatic irisin concentrations between maternal and umbilical cord blood according to clinical conditions and comorbidi-
ties during pregnancy (n = 28).
Maternal sample Mean (SD) Umbilical cord sample Mean (SD) Mean differences p*
ng/ml ng/ml
Total plasmatic Irisin Concentrations (n = 28) 151.4 (127.0) 94.8 (77.1) 56.6 0.03
Without labor before birth (n = 24) 157.3 (129.8) 87.4 (73.1) 69.9 0.01
With labor (n = 4) 123.1 (122.0) 130.1 (94.8) -7.05 0.9
p§ 0.5 0.2
BMI Before pregnancy� 25 (n = 17) 135.8 (137.2) 81.6 (65.5) 40.7 0.2
< 25 (n = 11) 171.3 (124.6) 88.7 (81.4) 82.5 0.04
p§ 0.5 0.7
BMI at end of pregnancy
� 25 (n = 20) 128.4 (132.6) 85.9 (68.4) 42.4 0.1
< 25 (n = 8) 212.0 (92.5) 118.1 (98.2) 93.8 0.057
p§ 0.1 0.3
Diabetes during gestation (n = 9) 145.1 (154.3) 83.6 (52.7) 61.5 0.2
Without diabetes (n = 19) 154.7 (114.8) 100.6 (88.0) 54.0 0.08
p§ 0.8 0.5
Male newborn (n = 14) 153.9 (149.5) 100.1 (71.7) 53.7 0.1
Female newborn (n = 14) 148.8 (103.4) 89.1 (84.8) 59.7 0.1
p§ 0.9 0.7
Blood sample before caesarean section (n = 22) 141.7 (137.6) 79.0 (66.9) 62.6 0.4
Blood sample after caesarian section (n = 6) 182.1 (87.4) 144.3 (91.1) 37.8 0.054
p§ 0.4 0.04
* Paired Student’s t test
§ Independent samples Student´s t test, BMI = Body mass index. Significant results (p�0.05) in bold
doi:10.1371/journal.pone.0165229.t002
Irisin and Cytokine Concentrations in Mother and Offspring
PLOS ONE | DOI:10.1371/journal.pone.0165229 November 9, 2016 6 / 13

which negatively predicted offspring irisin levels (B = -11.79, p = 0.03), and maternal IL-1β,
which positively predicted offspring irisin concentrations (B = 160.74, p = 0.046).
Discussion
In accordance with previous reports, we found that irisin concentrations were lower in new-
borns compared with their mothers [29, 30]; however, this difference was not present in
mother–newborn pairs who did not go through labor (Fig 1A). In this regard, has been estab-
lished that irisin secretion is increased by exercise [1, 3]; therefore, the physical stress related to
labor [31], possibly mimicking physical activity, might explain the higher irisin levels in those
newborns.
Several groups have characterized irisin changes in pathological conditions such as obesity
and DM. It has been reported that serum irisin concentrations in non-pregnant obese patients
are elevated and positively correlated with BMI [32, 33]. In type 2 DM studies, studies have
reported that non-pregnant patients were found to have lower irisin levels, showing a potential
role in insulin resistance [6, 34, 35]. However, Al-Daghri et al. found significantly higher levels
of irisin in non-pregnant women with type II diabetes mellitus compared to controls and it
was not associated to the level of habitual physical activity in these patients [36]. Alterations in
circulating irisin during pregnancy are less clear. While two different groups found no correla-
tion between BMI and irisin in obese pregnant patients [11, 37], lower levels of irisin were
reported in GDM patients by two other studies [12, 30]. Another study found no difference in
circulating irisin between healthy and GDM pregnancies; however, irisin was independently
predicted by fasting glucose [38]. Similarly, Garces et al. found a positive linear correlation
between irisin and the homeostatic model assessment index for insulin resistance [11].
The results of the current study showed higher irisin levels in mothers compared to new-
borns in patients with healthy pre-pregnancy weights compared to overweight patients. In
Table 3. Differences in maternal and newborn characteristics between overweight and normal weight, and diabetic and non-diabetic mothers
(n = 28).
BMI Before
pregnancy�25
(n = 17)
BMI Before
pregnancy <25
(n = 11)
p Diabetic
Pregnancy
(n = 9)
Non Diabetic
Pregnancy
(n = 19)
p BMI�25at end
of pregnancy
(n = 20)
BMI >25 at end
of pregnancy
(n = 8)
p
Maternal age
(years)
31.9 28.3 0.2 36.2 27.6 0.05 30.7 30.1 0.8
(6.8) (9.4) (5.2) (7.6) (7.4) (9.6)
Weight gained
during pregnancy
(Kg)
9.0 15.6 0.003 7.2 13.8 0.004 12.2 9.8 0.3
(5.4) (5.3) (5.1) (5.5) (6.7) (4.6)
Gestational age at
birth (weeks)
37.6 38.3 0.2 37.6 38.2 0.1 38.0 37.6 0.7
(1.2) (0.7) (1.0) (1.1) (1.2) (0.7)
Weight at birth
(grams)
3020 2960 0.6 3148 2919 0.08 3028 2917 0.4
(373) (294) (348) (297) (325) (392)
Height at birth (cm) 48.6 48.1 0.5 48.7 48.3 0.6 48.6 48.0 0.1
(1.7) (2.2) (1.9) (1.9) (1.8) (2.1)
Head
circumference (cm)
34.5 34.3 0.6 34.9 34.2 0.1 34.6 33.8 0.058
(1.1) (1.2) (0.8) (1.2) (1.0) (1.3)
Thoracic perimeter
(cm)
31.8 32.1 0.6 32.5 31.6 0.1 32.0 31.8 0.7
(1.7) (1.2) (1.6) (1.4) (1.5) (1.6)
Abdominal
circumference (cm)
29.7 30.0 0.6 30.2 29.7 0.4 29.9 29.7 0.7
(1.6) (1.6) (1.4) (1.7) (1.7) (1.4)
Mean (SD) Independent samples Student’s t test. Significant results (p�0.05) in bold.
doi:10.1371/journal.pone.0165229.t003
Irisin and Cytokine Concentrations in Mother and Offspring
PLOS ONE | DOI:10.1371/journal.pone.0165229 November 9, 2016 7 / 13

accordance with previous reports [11, 37], there were no differences in maternal irisin concen-
trations related to BMI (Table 1). Our results are similar to those of Ebert et al. [38], as we
found no differences in irisin concentrations between pregnant women with and without
GDM or in their offspring. We also found no correlation between free fatty acids and irisin lev-
els in mothers and offspring. Likewise, Lopez-Legarrea et al. found no correlation between iri-
sin levels and free fatty acids [8], and Wang et al. provided evidence that a relatively higher
concentration of irisin had no effect on lipolysis in mature 3T3-L1 adipocytes [39].
The newborn irisin concentrations in our study were similar to those reported by Baka
et al. [15]. However, irisin levels did not correlate with newborn weight in this study, which
differed from the results of Cağlar et al. and Baka et al. [15, 29]. We also found no correlation
between umbilical artery irisin and gestational age, which is similar to the results of Ebert el al.
[29, 38]. Under normal conditions, arterial cord blood protein concentration may be around
Table 4. Multiple Regressions and Pearson Correlations between maternal and newborn Irisin (ng/mL) and maternal/offspring conditions (n = 28).
MULTIPLE LINEAL REGRESSIONS PEARSON CORRELATIONS
B/p* r/p*
Maternal Plasma Irisin Offspring Plasma Irisin Maternal Plasma Irisin Offspring Plasma Irisin
CLINICAL CHARACTERISTICS
Maternal age (years) -0.9 / 0.8 0.1 / 0.9 -0.02 / 0.9 0.09 / 0.6
BMI Before pregnancy (Kg/m2) 4.6 / 0.7 -14.2 / 0.09 0.1 / 0.5 -0.07 / 0.3
Weight gain during pregnancy (Kg) 0.4 / 0.9 -5.4 / 0.1 -0.07 / 0.7 -0.03 / 0.8
BMI at end of pregnancy (Kg/m2) -1.4 / 0.9 12.1 / 0.1 0.08 / 0.6 -0.04 / 0.8
Gestational age at birth (weeks) -22.7 / 0.3 -6.4 / 0.6 -0.1 / 0.4 0.03 / 0.8
Weight at birth (grams) -1 / 0.4 0.03 / 0.6 -.008 / 0.6 0.07 / 0.7
Height at birth (cm) -10.7 / 0.5 13.0 / 0.2 -0.1 / 0.5 0.02 / 0.2
Head circumference (cm) -35.1 / 0.3 -42.7 / 0.1 -0.2 / 0.2 -0.16 / 0.3
Thoracic perimeter (cm) -28.6 / 0.2 1.1 / 0.9 -0.2 / 0.2 0.02 /0.8
Abdominal circumference (cm) 33.9 / 0.1 14.7 / 0.2 0.05 / 0.7 0.2 / 0.2
Significant PLASMA OXIDATIVE BIOMARKERS
TAC (μmol of trolox/mL) -30.3 / 0.6 120.0 / 0.005 -0.1 / 0.3 0.6 / 0.000
PLASMA CYTOKINES & CHEMOKINES (ng/mL)
PDGF -0.02 / 0.4 -0.03 / 0.05 0.3 / .1 0.2 / 1
IL-1B 100.9 / 0.03 120.3 / 0.04 0.53 / 0.003 0.42 / 0.02
IL-1RA 0.4 / 0.8 0.5 / 0.01 0.46 / 0.01 0.45 / 0.01
IL-4 -4.2 / 0.2 -6.3 / 0.5 0.32 / 0.8 0.1 / 0.3
IL-5 32.2 / 0.008 19.1 / 0.1 0.45 / 0.01 0.47 / 0.09
IL-6 1.7 / 0.2 7.9 / 0.2 0.15 / 0.4 0.46 / 0.01
IL-7 22.3 / 0.04 -1.1 / 0.04 0.52 / 0.03 -0.41 / 0.02
IL-10 2.7 / 0.9 40.2 / 0.07 0.41 / 0.02 0.29 / 0.1
IL-13 4.3 / 0.4 8.9 / 0.1 0.2 / 0.2 -0.04 / 0.8
GCSF 1.4 / 0.2 -0.68 / 0.1 0.22 / 0.2 -0.25 / 0.1
IFN γ 0.03 / 0.9 0.5 / 0.06 0.34 / 0.06 0.43 / 0.01
IP-10 0.07 / 0.01 0.03 / 0.1 0.46 / 0.01 0.39 / 0.03
MCAF 0.4 / 0.8 -1.6 / 0.005 0.29 / 0.1 -0.48 / 0.008
MIP-1B 2.0 / 0.2 1.3 / 0.1 0.30 / 0.1 0.03 / 0.8
RANTES -0.08 / 0.1 -0.009 / 0.08 0.10 / 0.6 -0.37 / 0.04
* Significant results (p�0.05) in bold.
doi:10.1371/journal.pone.0165229.t004
Irisin and Cytokine Concentrations in Mother and Offspring
PLOS ONE | DOI:10.1371/journal.pone.0165229 November 9, 2016 8 / 13

28–53% lower than the concentration in maternal serum [40], which is similar to what was
found in the current study.
Several authors believe that newborn irisin may be maternally inherited [15, 41]. According
to Al Gadhri, irisin concentrations in the newborn are promoted by maternal factors that par-
ticipate in energy regulation, specifically, high-density lipoprotein cholesterol [41]. This bio-
marker was not evaluated in this study. Nonetheless, we found that newborn TAC and IL-1βpredicted and positively correlated with newborn irisin levels. While newborn IL-1β, MCAF,
and IL-7 negatively correlated with newborn irisin concentrations in our study, Al-Daghri
et al. found that newborn angiotensin II predicts irisin levels in the offspring [41].
We found that lower levels of maternal IL-13 are associated with higher offspring irisin con-
centrations. To our knowledge, there are no published studies on this subject, and we have no
clear explanation for it. IL-13 has IL-4-like activities and has been related to atopic disease
[42]. It is considered a Th2-type cytokine and, similar to IL-10, it may inhibit macrophage
activity [43]. This cytokine is produced in considerable amounts by the placenta during preg-
nancy, and lower IL-13 levels in the newborn have been related to increased risk of atopy [42].
IL-13 is also considered to be a myokine, and it might promote increased glucose uptake
and glucose oxidation [44, 45]. Contrary to meteorin-like myokine, a factor secreted in adipose
tissues and muscles after cold exposure exercise, irisin does not increase gene expression of IL-
13 or lead to alternative macrophage activation [46]. In the current study, maternal IL-13
inversely correlated with offspring irisin. Although irisin has not been associated with IL-1β in
previous studies, we found that maternal IL-1β positively predicted offspring irisin concentra-
tions. Irisin has mostly been associated with IL-6, IL-8, and IL-15 because contractile activity
might induce expression of these cytokines in skeletal muscle [47]; however, there is little
information regarding the relationship of irisin with other cytokines. Clearly, the relationship
between maternal cytokine concentrations and newborn irisin concentrations requires further
investigation.
This study has some limitations. First, due to the rigorous inclusion criteria, few patients
met the criteria for enrollment and, although we had significant results, we worked with a
small sample size. Certainly, a larger sample size could have increased the possibility of achiev-
ing significant results, especially in interactions that produced small effects.
It is noteworthy that contradictory findings have been reported regarding the nature and
concentration of serum FNDC5/Irisin [48] and several articles have not only questioned the
relevance of irisin in humans but the degree of shedding of soluble irisin as well [5]. Besides,
research in humans using recombinant irisin does not reflect the same functions that have
been reported in mice, especially regarding the brightening of adipocytes [7]. Some studies
have also raised doubt concerning irisin secretion by skeletal muscle cells [23] and others refer
that this myokine may be present in such low concentrations that may render a physiological
role for irisin very unlikely [49]. Additionally, the validity of the commercially available irisin
quantitation ELISA methods has been questioned, arguing that they may be reporting cross-
reacting antibodies and a potential null mutation on human FNDC5 [49, 50]. Because of the
possible deficiencies in irisin detection methods reported in previous studies [49], in this work
we used the irisin detection method whose antibody has been validated by three different
groups by immunohistochemistry [51–53], the commercial ELISA kit by Phoenix Pharmaceu-
ticals [54].
In spite of studies challenging the possible effects of irisin, several others support its physio-
logical roles. Recently, a paper using mass spectroscopy demonstrated that human irisin is
translated from a non-canonical start codon, it circulates in plasma and is regulated by aerobic
exercise [3]. Moreover, studies have shown that adipose tissue expresses and secretes irisin.
Interestingly, it may be increased in patients with metabolic disturbances, such as obesity; and
Irisin and Cytokine Concentrations in Mother and Offspring
PLOS ONE | DOI:10.1371/journal.pone.0165229 November 9, 2016 9 / 13

weight loss and fat mass reduction can be responsible for a decrease in FNDC5/irisin concen-
tration [48]. However, we did not find a correlation between irisin and BMI or the presence of
DM in this study. It is evident that further studies are warranted in order to clarify the contro-
versy that remains in the literature regarding FNDC5/irisin.
Conclusions
A growing body of evidence has revealed an important role for irisin in metabolism. However,
in the present study, we found no proof that serum irisin concentrations in mothers at preg-
nancy termination or in their newborns correlated with BMI, the presence of DM, levels of
free fatty acids, or the offspring’s gestational age or birth weight. Nonetheless, interesting find-
ings came about regarding the relationships between irisin and other biomarkers, such as TAC
and cytokines, the latter being relevant for fetal–placental development.
As irisin has recently been considered to be an adipo-myokine and it might be closely
related to some cytokines, it might be a participant in endocrine and immune system cross-
talk during pregnancy. Unfortunately, the mechanisms originating irisin production and its
interactions with other biomarkers during the gestational period and in the newborn still
remain unascertained.
Author Contributions
Conceptualization: MHT.
Formal analysis: MHT ELS.
Funding acquisition: MHT.
Investigation: MHT ATQ GGR.
Methodology: MHT ELS.
Resources: MHT GGR.
Writing – original draft: MHT ELS.
Writing – review & editing: MHT ELS GGR.
References
1. Bostrom P, Wu J, Jedrychowski MP, Korde A, Ye L, Lo JC, et al. A PGC1-alpha-dependent myokine
that drives brown-fat-like development of white fat and thermogenesis. Nature. 2012; 481(7382):463–8.
doi: 10.1038/nature10777 PMID: 22237023; PubMed Central PMCID: PMC3522098.
2. Huh JY, Mougios V, Kabasakalis A, Fatouros I, Siopi A, Douroudos II, et al. Exercise-Induced Irisin
Secretion Is Independent of Age or Fitness Level and Increased Irisin May Directly Modulate Muscle
Metabolism Through AMPK Activation. J Clin Endocrinol Metab. 2014; 99(11):E2154–E61. doi: 10.
1210/jc.2014-1437 PMID: 25119310.
3. Jedrychowski MP, Wrann CD, Paulo JA, Gerber KK, Szpyt J, Robinson MM, et al. Detection and Quan-
titation of Circulating Human Irisin by Tandem Mass Spectrometry. Cell Metab. 2015; 22(4):734–40.
doi: 10.1016/j.cmet.2015.08.001 PMID: 26278051; PubMed Central PMCID: PMC4802359.
4. Timmons JA, Baar K, Davidsen PK, Atherton PJ. Is irisin a human exercise gene? Nature. 2012; 488
(7413):E9–E10. doi: 10.1038/nature11364 PMID: 22932392
5. Erickson HP. Irisin and FNDC5 in retrospect: An exercise hormone or a transmembrane receptor? Adi-
pocyte. 2013; 2(4):289–93. doi: 10.4161/adip.26082. PMC3774709. PMID: 24052909
6. Kurdiova T, Balaz M, Vician M, Maderova D, Vlcek M, Valkovic L, et al. Effects of obesity, diabetes and
exercise on Fndc5 gene expression and irisin release in human skeletal muscle and adipose tissue: in
vivo and in vitro studies. J Physiol. 2014; 592(5):1091–107. doi: 10.1113/jphysiol.2013.264655 PMID:
24297848; PubMed Central PMCID: PMCPMC3948565.
Irisin and Cytokine Concentrations in Mother and Offspring
PLOS ONE | DOI:10.1371/journal.pone.0165229 November 9, 2016 10 / 13
7. Raschke S, Elsen M, Gassenhuber H, Sommerfeld M, Schwahn U, Brockmann B, et al. Evidence
against a Beneficial Effect of Irisin in Humans. PLoS One. 2013; 8(9):e73680. doi: 10.1371/journal.
pone.0073680 PMID: 24040023
8. Lopez-Legarrea P, de la Iglesia R, Crujeiras AB, Pardo M, Casanueva FF, Zulet MA, et al. Higher base-
line irisin concentrations are associated with greater reductions in glycemia and insulinemia after weight
loss in obese subjects. Nutr Diabetes. 2014; 4:e110. doi: 10.1038/nutd.2014.7 PMID: 24567125;
PubMed Central PMCID: PMCPMC3940831.
9. Park KH, Zaichenko L, Brinkoetter M, Thakkar B, Sahin-Efe A, Joung KE, et al. Circulating irisin in rela-
tion to insulin resistance and the metabolic syndrome. J Clin Endocrinol Metab. 2013; 98(12):4899–
907. doi: 10.1210/jc.2013-2373 PMID: 24057291; PubMed Central PMCID: PMC3849667.
10. Buchanan TA, Xiang AH. Gestational diabetes mellitus. J Clin Invest. 2005; 115(3):485–91. doi: 10.
1172/JCI24531 PMID: 15765129; PubMed Central PMCID: PMC1052018.
11. Garces MF, Peralta JJ, Ruiz-Linares CE, Lozano AR, Poveda NE, Torres-Sierra AL, et al. Irisin levels
during pregnancy and changes associated with the development of preeclampsia. J Clin Endocrinol
Metab. 2014; 99(6):2113–9. doi: 10.1210/jc.2013-4127 PMID: 24628554.
12. Yuksel MA, Oncul M, Tuten A, Imamoglu M, Acikgoz AS, Kucur M, et al. Maternal serum and fetal cord
blood irisin levels in gestational diabetes mellitus. Diabetes Res Clin Pract. 2014; 104(1):171–5. doi: 10.
1016/j.diabres.2013.12.025 PMID: 24447809.
13. Kuzmicki M, Telejko B, Lipinska D, Pliszka J, Szamatowicz M, Wilk J, et al. Serum irisin concentration in
women with gestational diabetes. Gynecol Endocrinol. 2014; 30(9):636–9. doi: 10.3109/09513590.
2014.920006 PMID: 24850254.
14. Zhao L, Li J, Li ZL, Yang J, Li ML, Wang GL. Circulating irisin is lower in gestational diabetes mellitus.
Endocr J. 2015; 62(10):921–6. doi: 10.1507/endocrj.EJ15-0230 PMID: 26228794.
15. Baka S, Malamitsi-Puchner A, Boutsikou T, Boutsikou M, Marmarinos A, Hassiakos D, et al. Cord blood
irisin at the extremes of fetal growth. Metabolism. 2015; 64(11):1515–20. doi: 10.1016/j.metabol.2015.
07.020 PMID: 26307660.
16. Briana D, Malamitsi-Puchner A, Boutsikou M, Baka S, Ristani A, Hassiakos D, et al. PS-042 Myokine Iri-
sin Is Down-regulated In Fetal Growth Restriction. Arch Dis Child. 2014; 99(Suppl 2):A126. doi: 10.
1136/archdischild-2014-307384.336
17. Hung TH, Lo LM, Chiu TH, Li MJ, Yeh YL, Chen SF, et al. A longitudinal study of oxidative stress and
antioxidant status in women with uncomplicated pregnancies throughout gestation. Reprod Sci. 2010;
17(4):401–9. doi: 10.1177/1933719109359704 PMID: 20167745.
18. Toescu V, Nuttall SL, Martin U, Kendall MJ, Dunne F. Oxidative stress and normal pregnancy. Clin
Endocrinol (Oxf). 2002; 57(5):609–13. PMID: 12390334.
19. Park MJ, Kim DI, Choi JH, Heo YR, Park SH. New role of irisin in hepatocytes: The protective effect of
hepatic steatosis in vitro. Cell Signal. 2015; 27(9):1831–9. doi: 10.1016/j.cellsig.2015.04.010 PMID:
25917316.
20. Hauguel-de Mouzon S, Guerre-Millo M. The placenta cytokine network and inflammatory signals. Pla-
centa. 2006; 27(8):794–8. doi: 10.1016/j.placenta.2005.08.009 PMID: 16242770.
21. Mor G, Cardenas I, Abrahams V, Guller S. Inflammation and pregnancy: the role of the immune system
at the implantation site. Ann N Y Acad Sci. 2011; 1221:80–7. doi: 10.1111/j.1749-6632.2010.05938.x
PMID: 21401634; PubMed Central PMCID: PMC3078586.
22. Pantham P, Aye IL, Powell TL. Inflammation in maternal obesity and gestational diabetes mellitus. Pla-
centa. 2015; 36(7):709–15. doi: 10.1016/j.placenta.2015.04.006 PMID: 25972077; PubMed Central
PMCID: PMC4466145.
23. Raschke S, Eckel J. Adipo-myokines: two sides of the same coin—mediators of inflammation and medi-
ators of exercise. Mediators Inflamm. 2013; 2013:320724. doi: 10.1155/2013/320724 PMID: 23861558;
PubMed Central PMCID: PMC3686148.
24. Vaughan RA, Gannon NP, Mermier CM, Conn CA. Irisin, a unique non-inflammatory myokine in stimu-
lating skeletal muscle metabolism. J Physiol Biochem. 2015; 71(4):679–89. doi: 10.1007/s13105-015-
0433-9 PMID: 26399516.
25. Dong J, Dong Y, Dong Y, Chen F, Mitch WE, Zhang L. Inhibition of myostatin in mice improves insulin
sensitivity via irisin-mediated cross talk between muscle and adipose tissues. Int J Obes (Lond). 2015.
doi: 10.1038/ijo.2015.200 PMID: 26435323.
26. Lowry OH, Rosebrough NJ, Farr AL, Randall RJ. Protein measurement with the Folin phenol reagent. J
Biol Chem. 1951; 193(1):265–75. PMID: 14907713.
27. Apak R, Guclu K, Ozyurek M, Karademir SE, Altun M. Total antioxidant capacity assay of human serum
using copper(II)-neocuproine as chromogenic oxidant: the CUPRAC method. Free Radic Res. 2005; 39
(9):949–61. doi: 10.1080/10715760500210145 PMID: 16087476.
Irisin and Cytokine Concentrations in Mother and Offspring
PLOS ONE | DOI:10.1371/journal.pone.0165229 November 9, 2016 11 / 13

28. Duncombe WG. The Colorimetric Micro-Determination of Non-Esterified Fatty Acids in Plasma. Clin
Chim Acta. 1964; 9:122–5. PMID: 14122498.
29. Caglar M, Goksu M, Isenlik BS, Yavuzcan A, Yilmaz M, Ustun Y, et al. Irisin in idiopathic foetal growth
restriction. J Endocrinol Invest. 2014; 37(7):619–24. doi: 10.1007/s40618-014-0078-5 PMID:
24789538.
30. Wawrusiewicz-Kurylonek N, Telejko B, Kuzmicki M, Sobota A, Lipinska D, Pliszka J, et al. Increased
Maternal and Cord Blood Betatrophin in Gestational Diabetes. PLoS One. 2015; 10(6):e0131171. doi:
10.1371/journal.pone.0131171 PMID: 26115519; PubMed Central PMCID: PMCPMC4483159.
31. Jones CM 3rd, Greiss FC Jr. The effect of labor on maternal and fetal circulating catecholamines. Am J
Obstet Gynecol. 1982; 144(2):149–53. Epub 1982/09/15. PMID: 7114122.
32. Stengel A, Hofmann T, Goebel-Stengel M, Elbelt U, Kobelt P, Klapp BF. Circulating levels of irisin in
patients with anorexia nervosa and different stages of obesity—correlation with body mass index. Pep-
tides. 2013; 39:125–30. doi: 10.1016/j.peptides.2012.11.014 PMID: 23219488.
33. Huh JY, Panagiotou G, Mougios V, Brinkoetter M, Vamvini MT, Schneider BE, et al. FNDC5 and irisin in
humans: I. Predictors of circulating concentrations in serum and plasma and II. mRNA expression and
circulating concentrations in response to weight loss and exercise. Metabolism. 2012; 61(12):1725–38.
doi: 10.1016/j.metabol.2012.09.002 PMID: 23018146; PubMed Central PMCID: PMC3614417.
34. Liu J- J, Wong MDS, Toy WC, Tan CSH, Liu S, Ng XW, et al. Lower circulating irisin is associated with
type 2 diabetes mellitus. Journal of Diabetes and Its Complications. 27(4):365–9. doi: 10.1016/j.
jdiacomp.2013.03.002 PMID: 23619195
35. Choi YK, Kim MK, Bae KH, Seo HA, Jeong JY, Lee WK, et al. Serum irisin levels in new-onset type 2
diabetes. Diabetes Res Clin Pract. 2013; 100(1):96–101. doi: 10.1016/j.diabres.2013.01.007 PMID:
23369227.
36. Al-Daghri NM, Alokail MS, Rahman S, Amer OE, Al-Attas OS, Alfawaz H, et al. Habitual physical activity
is associated with circulating irisin in healthy controls but not in subjects with diabetes mellitus type 2.
Eur J Clin Invest. 2015; 45(8):775–81. doi: 10.1111/eci.12468 PMID: 26011590
37. Erol O, Erkal N, Ellidag HY, Isenlik BS, Aydin O, Derbent AU, et al. Irisin as an early marker for predict-
ing gestational diabetes mellitus: a prospective study. J Matern Fetal Neonatal Med. 2016:1–6. doi: 10.
3109/14767058.2016.1142967 PMID: 26782983.
38. Ebert T, Stepan H, Schrey S, Kralisch S, Hindricks J, Hopf L, et al. Serum levels of irisin in gestational
diabetes mellitus during pregnancy and after delivery. Cytokine. 2014; 65(2):153–8. doi: 10.1016/j.cyto.
2013.11.009 PMID: 24355429.
39. Wang C, Wang L, Li W, Yan F, Tian M, Wu C, et al. Irisin has no effect on lipolysis in 3T3-L1 adipocytes
or fatty acid metabolism in HepG2 hepatocytes. Endocrine. 2015; 49(1):90–6. doi: 10.1007/s12020-
014-0458-9 PMID: 25326905.
40. Perkins SL, Livesey JF, Belcher J. Reference intervals for 21 clinical chemistry analytes in arterial and
venous umbilical cord blood. Clin Chem. 1993; 39(6):1041–4. PMID: 8504535.
41. Al-Daghri NM, Al-Attas OS, Alokail MS, Alkharfy KM, Yousef M, Vinodson B, et al. Maternal inheritance
of circulating irisin in humans. Clin Sci (Lond). 2014; 126(12):837–44. doi: 10.1042/CS20130426 PMID:
24397868.
42. Williams TJ, Jones CA, Miles EA, Warner JO, Warner JA. Fetal and neonatal IL-13 production during
pregnancy and at birth and subsequent development of atopic symptoms. J Allergy Clin Immunol. 2000;
105(5):951–9. doi: 10.1067/mai.2000.106211 PMID: 10808176.
43. Sykes L, MacIntyre DA, Yap XJ, Teoh TG, Bennett PR. The Th1:th2 dichotomy of pregnancy and pre-
term labour. Mediators Inflamm. 2012; 2012:967629. doi: 10.1155/2012/967629 PMID: 22719180;
PubMed Central PMCID: PMCPMC3376783.
44. Eckardt K, Gorgens SW, Raschke S, Eckel J. Myokines in insulin resistance and type 2 diabetes. Diabe-
tologia. 2014; 57(6):1087–99. doi: 10.1007/s00125-014-3224-x PMID: 24676645.
45. Jiang LQ, Franck N, Egan B, Sjogren RJ, Katayama M, Duque-Guimaraes D, et al. Autocrine role of
interleukin-13 on skeletal muscle glucose metabolism in type 2 diabetic patients involves microRNA let-
7. Am J Physiol Endocrinol Metab. 2013; 305(11):E1359–66. doi: 10.1152/ajpendo.00236.2013 PMID:
24105413.
46. Rao RR, Long JZ, White JP, Svensson KJ, Lou J, Lokurkar I, et al. Meteorin-like is a hormone that regu-
lates immune-adipose interactions to increase beige fat thermogenesis. Cell. 2014; 157(6):1279–91.
doi: 10.1016/j.cell.2014.03.065 PMID: 24906147; PubMed Central PMCID: PMCPMC4131287.
47. Pedersen BK, Akerstrom TC, Nielsen AR, Fischer CP. Role of myokines in exercise and metabolism. J
Appl Physiol (1985). 2007; 103(3):1093–8. doi: 10.1152/japplphysiol.00080.2007 PMID: 17347387.
48. Crujeiras AB, Pardo M, Casanueva FF. Irisin: ‘fat’ or artefact. Clin Endocrinol (Oxf). 2015; 82(4):467–
74. doi: 10.1111/cen.12627 PMID: 25287317
Irisin and Cytokine Concentrations in Mother and Offspring
PLOS ONE | DOI:10.1371/journal.pone.0165229 November 9, 2016 12 / 13

49. Albrecht E, Norheim F, Thiede B, Holen T, Ohashi T, Schering L, et al. Irisin–a myth rather than an exer-
cise-inducible myokine. Sci Rep. 2015; 5:8889. doi: 10.1038/srep08889 http://www.nature.com/articles/
srep08889—supplementary-information. PMID: 25749243
50. Erickson HP. Irisin and FNDC5 in retrospect: An exercise hormone or a transmembrane receptor? Adi-
pocyte. 2013; 2(4):289–93. doi: 10.4161/adip.26082 PMID: 24052909; PubMed Central PMCID:
PMC3774709.
51. Dun SL, Lyu R-M, Chen Y-H, Chang J-K, Luo JJ, Dun NJ. Irisin-immunoreactivity in neural and non-
neural cells of the rodent. Neuroscience. 2013; 240:155–62. doi: 10.1016/j.neuroscience.2013.02.050.
PMC3637839. PMID: 23470775
52. Aydin S, Kuloglu T, Aydin S, Kalayci M, Yilmaz M, Cakmak T, et al. A comprehensive immunohisto-
chemical examination of the distribution of the fat-burning protein irisin in biological tissues. Peptides.
2014; 61:130–6. http://dx.doi.org/10.1016/j.peptides.2014.09.014. doi: 10.1016/j.peptides.2014.09.014
PMID: 25261800
53. Bakal U, Aydin S, Sarac M, Kuloglu T, Kalayci M, Artas G, et al. Serum, Saliva, and Urine Irisin with and
Without Acute Appendicitis and Abdominal Pain. Biochemistry Insights. 2016; 9(5695-BCI-Serum,-
Saliva,-and-Urine-Irisin-with-and-Without-Acute-Appendicitis-an.pdf):11–7. doi: 10.4137/BCI.S39671
PMID: 27330302
54. Phoenix Pharmaceuticals I. Irisin—Proteins, antibodies and immunoassay kits for irisin on functional
study and irisin biomarkers exploration. Available from: http://www.phoenixpeptide.com/catalog/
pnxfoget.php?id=pnxnews_000000744&title=none.
Irisin and Cytokine Concentrations in Mother and Offspring
PLOS ONE | DOI:10.1371/journal.pone.0165229 November 9, 2016 13 / 13