relations and functions. a relation is _____________________________...
TRANSCRIPT

Relations and Functions

A relation is _____________________________________________________________________.

There are four ways to represent a relation:
ORDERED PAIRS{(1, 5), (2, 3), (3, 2), (4, 1)}
TABLE OF VALUES GRAPH MAPPING DIAGRAM
ç

Examples1. Express the relation {(1, 3), (2, 4), (3, 5)} as a table, graph, and mapping diagram.
ç

Examples2. Express the relation as a set of ordered pairs,
a graph, and mapping diagram.
ç

The domain of a relation is _________________________________________________________________.
The range of a relation is ___________________________________________________________________.

ExamplesDetermine the domain and range for each relation.3. 4. 5.
D: ________ D: _________ D: _________ R: ________ R: _________ R: _________

The function is ___________________________________________________________________________.
ExamplesDetermine the domain and range for each relation. Then determine whether the relation is a function.6. {(3, -2), (5, -1), (4, 0), (3, 1)}
D: ____________________
R: ____________________
Function? _____________

ExamplesDetermine the domain and range for each relation. Then determine whether the relation is a function.7. 8.
D: ___________ D: _____________
R: ___________ R: _____________
Function? _____ Function? _______

The vertical line test is ___________________________________________________________________.
ExamplesUse the vertical line test to determine whether the graph shows a function. 9. 10. 11.

Putting It All TogetherDetermine the domain and range for each relation. Then determine whether the relation is a function.12. 13. 14.
D: ________ D: ________ D: ________
R: ________ R: ________ R: ________
Function? __ Function? __ Function? __

Graphing Functions

1) Graph the function for the given domain: x – 3y = -6; D: {-3, 0, 3, 6}
Step 1: ________________________________________________________
Step 2: ________________________________
Step 3: ___________________________________
x y

2) Graph the function for the given domain: f(x) = x2 - 3; D: {-2, -1, 0, 1, 2}
**Reminder**___________________________________________________
x y

3) Graph the function for the given domain: f(x) =|x|; D: {-2, -1, 0, 1, 2}
x y

4) Graph the function for the given domain: -2x + y = 3; D: {-5, -3, 1, 4}
x y

5) Graph the function for the given domain: f(x) = x2 + 2; D: {-3, -1, 0, 1, 3}
x y

We are not always given a specific set of domain values. When that is the case, we assume that the domain is _________________________________. In other words, ________________________________________________________________________________________________________________________________________________________________________________
6) Graph the function -x + 2y = 6
x y

7) Graph the function g(x) =|x|+ 2
x y

8) Graph the function y = x2
x y

Finding Values Using Graphs9) Use the graph of the function f(x) = x + 4 to find the value of f(x) when x = -4
Check:
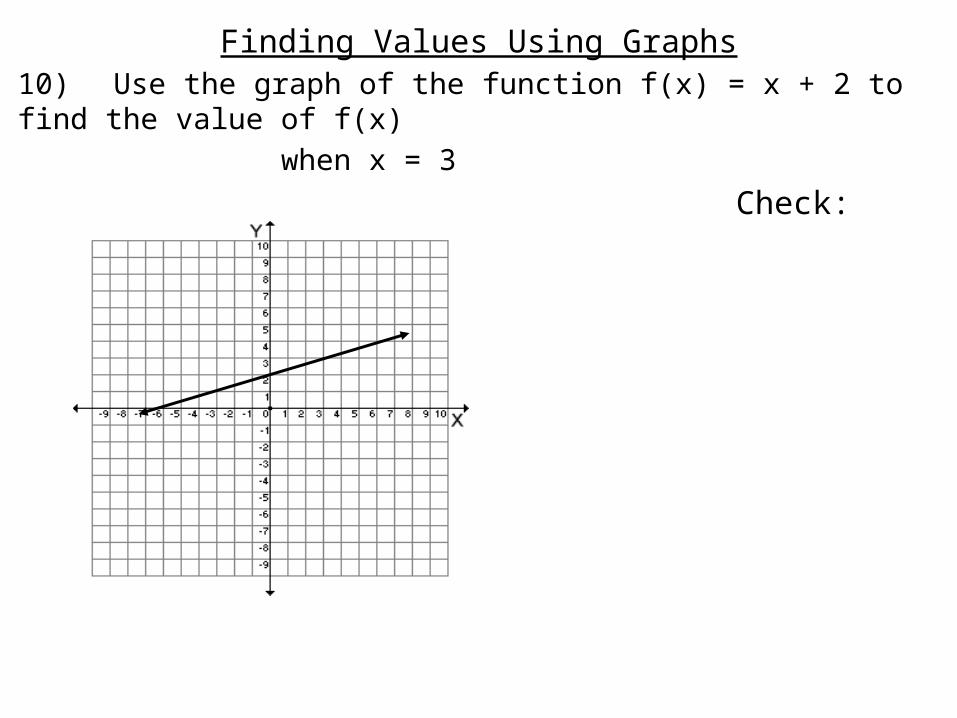
Finding Values Using Graphs10) Use the graph of the function f(x) = x + 2 to find the value of f(x) when x = 3
Check:

Word Problem: A mouse can run 3.5 meters per second. The function y = 3.5x describes the distance in meters the mouse can run in x seconds. Graph the function then use the graph to estimate how many meters a mouse can run in 2.5 seconds.
x y