relating foam and interfacial rheological properties of β ... · view journal. the lm dilational...
TRANSCRIPT
Soft Matter
PAPER
Publ
ishe
d on
06
Oct
ober
201
4. D
ownl
oade
d by
KIT
on
03/1
1/20
14 1
3:35
:57.
View Article OnlineView Journal
Relating foam an
Department of Chemical Engineering, Ka
Karlsruhe, Germany. E-mail: norbert.willenb
Cite this: DOI: 10.1039/c4sm01972e
Received 3rd September 2014Accepted 6th October 2014
DOI: 10.1039/c4sm01972e
www.rsc.org/softmatter
This journal is © The Royal Society of
d interfacial rheological propertiesof b-lactoglobulin solutions
M. Lexis and N. Willenbacher*
We have determined bulk rheology of b-lactoglobulin (BLG) foams and surface viscoelasticity of
corresponding protein solutions by varying pH as well as type, valency and concentration of the added
salt in a wide range. Foam rheology was characterized by the storage modulus G0, the apparent yield
stress sy, and the critical strain gc,foam defining the cessation of the linear viscoelastic response. These
quantities were determined at gas volume fractions f between 82% and 96%. Surface viscoelasticity was
characterized in shear and dilation, corresponding shear and dilational moduli G 0i , E0 as well as the critical
stress sc,surface and strain gc,surface marking the onset of non-linear response in oscillatory surface shear
experiments were determined at fixed frequency. Beyond the widely accepted assumption that G0 and syare solely determined by the Laplace pressure within the droplets and the gas volume fraction we have
found that both quantities strongly depend on corresponding interfacial properties. G0 increases linearly
with G 0i and even stronger with E0, sy varies proportional to sc,surface and gc,foam scales linearly with
gc,surface. Furthermore, deviations from these simple scaling laws with significantly higher reduced G0 and
sy values are observed only for foams at pH 5 and when a trivalent salt was added. Then also the
dependence of these quantities on f is unusually weak and we attribute these findings to protein
aggregation and structure formation across the lamellae than the dominating bulk rheology.
1. Introduction
Foams that are stabilized by proteins play an important role inthe food industry. The aerated structure gives a special look,mouthfeel and taste to the product which is well accepted by thecustomers. The foam structure consisting of jammed gasbubbles is responsible for the peculiar rheological behavior.Under low stresses the bubble network is able to store energy.The bubbles get deformed but do not move past each other.Hence, in this regime the elastic properties dominate. When acertain stress, called yield stress, is exceeded, the bubbles startsliding past each other and the foam as a whole ows easily likea liquid. Foam properties like stability and rheology areimportant issues not only for the end product but also duringprocessing, where transport, heating and mixing take place.Understanding and controlling the parameters inuencingfoam properties are of great interest in food technology andmany studies in this regard have been established. It is wellknown that the gas volume fraction, bubble size distributionand surface tension are the most important parameters thatinuence elastic properties and yield stress of so-called liquidfoams including low viscosity of the continuous phase (eqn (1)and (2)).1–5 The latter was found to be additionally affected bythe liquid viscosity.6,7 In eqn (1) and (2), the predictions of the
rlsruhe Institute of Technology, 76131
Chemistry 2014
storage modulus and yield stress initially proposed by Masonet al. and extended in our previous study are shown.
G0 ¼ a
�s
r32
�fðf� fcÞ (1)
sy ¼ k
�s
r32
��hL
hW
�0:3
ðf� fcÞ2 (2)
where s is the surface tension, r32 the Sauter mean radius, f thegas volume fraction, and fc represents the maximum packingfraction of the bubbles before they start to deform into non-spherical shapes. The latter has usually been an estimated valuebut can also be calculated from the measured bubble sizedistribution, as we have proposed recently.7 The prediction ofthe yield stress includes an empirically determined factor forthe (weak) contribution of the liquid viscosity, where hL is thecontinuous phase viscosity and hw the water viscosity under thesame conditions. This phenomenological extension of themodel equation proposed by Mason et al.1,2 has been derivedfrom measurements on foams made from casein, whey proteinisolate and a mixture of synthetic surfactants. The solventviscosity was varied using different water–glycerol mixtures andsugar solutions.8 Each equation includes a numerical pre-factor, k and a, respectively. Values between 0.5 and 1 have beenused for these constants so far in the literature without furtherdiscussion.1,2,5 In a recent study we found k values between 1and 7 and a values varying between 2 and 22.
Soft Matter
Soft Matter Paper
Publ
ishe
d on
06
Oct
ober
201
4. D
ownl
oade
d by
KIT
on
03/1
1/20
14 1
3:35
:57.
View Article Online
The lm dilational modulus is dened by E ¼ �Adp/dln Awherep is the surface pressure, and A is the area of the lm. Themodulus E is thus a measure of the resistance of a lm tochange in its area. The surface shear rheology gives informationabout the resistance of an adsorbed layer at the interfaceagainst shear. Hence, it is sensitive to the structural state of theadsorbed molecules. From a colloidal view a surface elasticmodulus arises either from attractive interactions betweenneighboring particles or particles caged at high packingdensity.9 From interfacial oscillatory shear measurementsanother quantity can be extracted, the critical shear stresssc,surface which denotes the end of the linear viscoelastic regime.For s > sc,surface the deformation response becomes non-linearindicating a structural change in the surface layer.10 Surfaceshear rotational experiments also show yielding behavior forseveral protein solutions which was investigated by Martinet al.11 They came to the conclusion that the critical shear stressindeed induces a fracture within the protein lm and cantherefore be regarded as an intrinsic property of the proteinlayers. A higher critical stress represents a higher strength of theprotein layer.
Surface rheology has been mainly discussed in terms offoam formation and stability.12–16 Little is known so far aboutthe correlation between foam rheology and the surfaceviscoelasticity of corresponding protein solutions althoughthese features must be coupled since shearing a foaminduces stretching and compression of the lamellae andhence the surfactant layer at the air liquid interface. Thegroup of Cohen-Addad has thoroughly investigated the linearviscoelastic response G* of surfactant foams in a broadfrequency range. Based on the model of Princen17 they haveproposed a relationship between G*(u) and the complexangular modulus A*(u) determined from dynamic compres-sion tests of two adjacent bubbles connected by a singlelamella. The quantity A*(u) is further assumed to beproportional to the dilational modulus E* ¼ E0 + iE00. Inparticular, they could show that the fast relaxation processesobserved in foams are determined by the surfactant transportwithin the liquid lms.18 The frequency uc characterizing theonset of this scaling regime is assumed to be proportional tothe ratio of the dilational modulus E0 and the effectiveinterfacial viscosity including the surface viscosity E0 0/uc, thesolution viscosity and the lamellar thickness as well as thebubble diameter. Different scaling laws relating uc to thefoammodulus G are proposed for rigid and mobile interfacesand these scaling laws are conrmed experimentally for twodifferent types of surfactant foams.19 Deviations from thesimple G* � u1/2 scaling are observed for foams made fromsurfactants providing very rigid interfaces (E*z 102 Pa).20 Sofar, a systematic comparison between foam plateau modulusand interfacial shear or dilational moduli for protein foamsis missing.
The viscous stress in continuously sheared foams scales withthe capillary number Ca as sv� Can and the exponent n dependson surface mobility and viscoelasticity. For rigid interfaces n ¼1/4 and for mobile interfaces n ¼ 1/2 have been predictedtheoretically and conrmed experimentally.21–23
Soft Matter
A direct empirical correlation between the yield stress andthe interfacial dilation modulus E0 of whey protein foams madeat different pH, concentration and valency of added salt hasbeen proposed by Davis et al.24 However, they did not take intoaccount the effect of bubble size (distribution) and gas volumefraction on sy, although pH and ionic strength are known toaffect the absolute value of this quantity substantially. Dimi-trova and Leal-Calderon25 reported a correlation between shearmodulus of concentrated emulsions stabilized by differentproteins and dilational moduli of the corresponding proteinsolutions. But it should be noted that their E0 values were takenfrom the literature probably determined at protein concentra-tion, pH and ionic strength conditions different from thoserelevant for the probed emulsions. Finally, it should bementioned that also for particle stabilized so-called Pickeringemulsions the modulus G0 is not only determined by theinterfacial tension between the liquid phases but also by anelastic contribution resulting from the attractive interactionamong the stabilizing particles.26
In this study we attempt to directly correlate the surface andfoam rheological properties of b-lactoglobulin (BLG) solutions.Therefore, the interfacial layer properties were systematicallychanged by varying the ionic strength, the type of salt and thesolution pH. We propose a unique relationship between foammodulus G0 and interfacial moduli G 0
i or E0, between the foamyield stress sy and the critical stress or strain at which aninterfacial layer structure breaks down. We demonstrate thevalidity of this correlation in a wide range of gas volume frac-tions irrespective of bubble size distribution and Laplace pres-sure. Finally we discuss the limitation of this approach in termsof structure formation across lamellae induced under certainconditions of ionic strength, ion valency and pH.
2. Experimental details2.1 Solution preparation and measurements
Solutions of 1 wt% b-lactoglobulin (BLG, used as received) wereprepared by dissolving the protein powder kindly provided bythe group of Ulrich Kulozik (University of Munich, Germany) inultrapure water (Millipore, 18 MU). Variation of pH was ach-ieved by adding appropriate amounts of NaOH or HCl (CarlRoth 1 N standard solutions), respectively. Ionic strength wasvaried by adding NaCl (99.5%, Roth Chemicals) between 10 and100 mM. The inuence of ion type and valency was investigatedby the addition of 50 mM KCl, LiCl, NH4Cl (99%, Roth Chem-icals), CaCl2 (98%, Roth Chemicals) or NdCl3 (99.9%, AlfaAesar).
The surface tension of all solutions was measured by thependant drop method (Kruss, DSA 100) at 21 �C and a drop ageof 30 min as described elsewhere.7
The liquid viscosities were measured with an Ares rotationalrheometer (TA Instruments) using Couette geometry (17/16.5mm). All solutions showed Newtonian behavior in the range ofimposed shear rates _g ¼ 10–1000 s�1 with viscosities between0.94 and 1.1 mPas.
Interfacial dilational elasticities were determined at 21 �Cand a drop age of 30 min using the oscillating bubble method
This journal is © The Royal Society of Chemistry 2014
Paper Soft Matter
Publ
ishe
d on
06
Oct
ober
201
4. D
ownl
oade
d by
KIT
on
03/1
1/20
14 1
3:35
:57.
View Article Online
(Kruss, DSA 100). The oscillations were generated by using apiezo pump that pulsed with a frequency of 0.1 Hz and ampli-tude of 0.3. The amplitude resulted in drop deformationbetween 2 and 3%, depending on the drop volume. As the dropwas generated manually it was not possible to keep the volumefor every measurement exactly the same. Oscillatory deforma-tion was applied for a time period of 100 s and 1200 pictureswere analyzed to calculate E* ¼ E0 + iE00.
Interfacial shear viscoelastic properties were determined at25 �C and a surface age of 30 min with a stress controlledrotational rheometer (TA Instruments, DHR3) using the doublewall ring geometry (Dring ¼ 70 mm). Details about thismeasuring geometry can be found in.27 The viscoelastic prop-erties were recorded at a frequency of 0.7 Hz and a deformationamplitude of 1%, which did not exceed the linear viscoelasticregime of any sample solution. From these measurements wehave determined the surface elastic modulus G 0
i . Measurementswith increasing deformation amplitude allowed for the deter-mination of the width of linear viscoelastic regime (LVE). Whenthe non-linear deformation response sets in, G 0
i starts todecrease and the end of the LVE was determined to reach whenG 0i ¼ 0.9*G 0
iLVE. At this point the critical deformation gc,surface
and shear stress sc,surface were extracted.It should be noted that we have characterized the interfacial
rheology of protein solutions at the same concentration atwhich foam preparation and foam rheology was done. This is incontrast to many other studies on interfacial rheology whereexperiments were done at much lower concentration ofamphiphiles in order to ensure a monolayer of the surfaceactive ingredient at the air/water interface. But one has to beaware that the structure of an interfacial layer, especially in thecase of proteins, can substantially change with concentrationand a correlation of foam and interfacial rheology can only beexpected if the interfacial layer is the same in both sets ofexperiments. However, multiple layers of proteins may bepresent at the surface, i.e. the thickness of the layer may not benegligible. Therefore, the measured quantities E0, G 0
i have to betreated as apparent values.
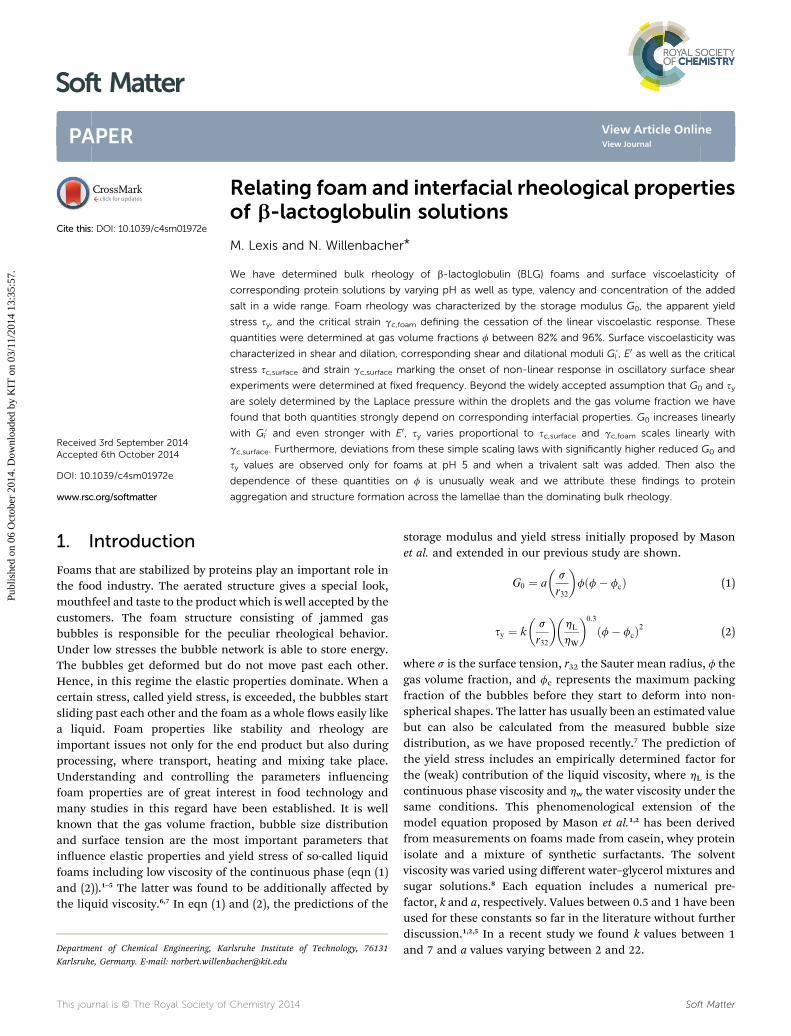
Fig. 1 Drainage velocity of the protein foams with different ionicstrengths (a) or pH (b). Data were calculated from the time period inwhich each foam drained from 85% to 86% gas volume fraction.
2.2 Foam preparation and measurements
The protein solutions were preheated to 50 �C in a water bath toobtain foams that are stable enough for reproducible rheolog-ical measurements. The increase in temperature speeds upadsorption kinetics but does not affect the protein structure.Foams were produced using a glass lter fused in a glass pipe asdescribed elsewhere7 and nitrogen was purged through thepores at _V ¼ 60 ml min�1. As soon as the foam reached thecolumn height the nitrogen ow was stopped and recording ofthe foam age was started.
The time-dependent gas volume fraction was determinedusing a conductivity electrode with an integrated temperaturesensor (WTW, Cond 340i) as described in a previous study.7 Themeasuring gap of the electrode had a length of 2 cm. The foamvolume within the gap is similar to that we have used forrheological characterization. Hence, the measured conductivityis an appropriate average value. Conductivity measurements
This journal is © The Royal Society of Chemistry 2014
were performed in a region of the foam column close to thatfrom where the samples for rheological measurements weretaken.
Fig. 1 shows the drainage velocity for the protein foams withdifferent ionic strengths and different pH. Increasing theamount of NaCl leads to slower liquid drainage. This can beattributed to the reduced electrostatic repulsion between theproteins leading to closer protein packing and increased prob-ability of aggregation. Such protein aggregates are able to plugthe junctions of the Plateau borders so that the drainage of theliquid is slowed down. Moreover, the surface mobility can havean inuence on foam drainage.28,29 As the interface is supposedto become more rigid with increasing ionic strength (at leastupon addition of 20 mM as discussed in Section 3.1.4) thismight be an additional reason for the slower drainage. The pHdependent drainage velocity shows a minimum at pH 5. This isvery close to the isoelectric point (IEP) where the protein netcharge is close to zero and therefore, aggregates plugging theliquid channels occur more frequently. Higher distance to theIEP increases the protein solubility and at the same time thedrainage velocity.
The bubble size distribution was determined by takingpictures with an endoscopic CCD camera (Lumenera LU 160,resolution 1392 � 1040) that was placed inside the foam. TheSauter mean radius r32 was extracted from image analysis usingthe soware iPS (Visiometrics, Germany).
Foam rheological measurements were carried out withRheoscope 1 (Thermosher, Germany) using parallel plategeometry with a diameter of 60 mm. The surfaces were coveredwith sandpaper to minimize wall slip effects and the gap was setto 6 mm. The measurement time was 60 s in order to limit timedependent changes in the foam structure. Each foaming systemwas measured at different foam ages and hence, different gasvolume fractions f between 82 and 94%.
The apparent yield stress was determined from steady shearmeasurements where increasing stresses were applied.Depending on the foam composition the initial stresses were setbetween 3 and 5 Pa and the nal stresses between 50 and 125Pa. As already extensively discussed in ref. 7 the apparent yieldstress is independent of the start and end point of the stressramp experiment as well as on the number of data points taken.In particular, it was shown that the sample deformation within
Soft Matter

Fig. 2 Oscillatory shear experiments at a fixed frequency f ¼ 1 Hz butvarying stress amplitude for BLG foams (f ¼ 89%) at different ionicstrengths of NaCl.
Soft Matter Paper
Publ
ishe
d on
06
Oct
ober
201
4. D
ownl
oade
d by
KIT
on
03/1
1/20
14 1
3:35
:57.
View Article Online
the gap is non-uniform when the yield point is exceeded. Wehave assumed that this effect is weak just around the yieldpoint, and experiments that determined sy and gc were highlyreproducible but the parameters should be treated as apparentvalues.
The moduli G0 and G00 of the foam were determined fromoscillatory shear measurements by varying the stress amplitudeat a frequency f ¼ 1 Hz. The moduli did not show frequencydependence between 0.01 and 10 Hz. Hence, the measured G0-value in the linear viscoelastic regime is called plateau modulusG0. The deformation amplitude that decreased G0 down to0.9*G0 was taken as critical deformation gc,foam. It is worthnoting that this critical deformation at which non-lineardeformation sets in is well below the yield point gy at whichbubbles start to ow past each other. This yielding occurs at thestress or deformation amplitude at which G0 ¼ G0 0.7
3. Results and discussion3.1 Variation of ionic strength
3.1.1 Foam and solution properties. In Table 1 the values ofthe surface tension measured aer 30 minutes surface aging,the mean Sauter radii of the foam bubbles and the range of gasvolume fractions where foam rheology measurements tookplace are shown. The surface tension does not signicantlychange with the addition of NaCl to the protein solutions. Theinitial mean bubble size decreases when adding 50 mM salt butdoes not change upon further addition of NaCl.
3.1.2 Oscillatory shear measurements. In Fig. 2 oscillatoryshear stress amplitude sweeps are shown for the BLG foamswith different ionic strengths at similar gas volume fraction f
¼ 89%. For all foams G0 and G0 0 stay nearly constant at lowstresses in the linear viscoelastic regime. G0 is always muchhigher than G0 0 and when G0 increases, G0 0 also increases. All G0
curves (Fig. 2a) show a decrease before they cross the G0 0 curve(intersections marked with crosses) with a negative slopeincreasing with increasing ionic strength. In the same stressamplitude range the G0 0 values (Fig. 2b) also show interestingbehavior. For the foams without salt and with 10 mM NaCl thecurves go through a local minimum and a subsequent localmaximum just before crossing the G0 curve. For higher ionicstrengths the minimum in G0 0 essentially vanishes and thecurves just exhibit a pronounced maximum which is shied tohigher stress amplitude values with increasing ionic strength.Such peaks have already been found for surfactant foams withgas volume fractions higher than 74%.30 The foams with lowergas volume fractions did not show this maximum which was
Table 1 Surface tension of the protein solutions after 30 minutes surfacewhere the rheological measurements took place. The maximum error is
Ionic strength/mM 0 10 20 30
s/mN m�1 51.5 50 49.5 49r32/mm 110–154 114 121 124f/% 87–96 89 89 89
Soft Matter
explained by the occurrence of plastic deformation prior toyielding. Other studies31,32 consider the point, where dissipa-tion is maximal, as the transition point from elastic to viscousbehavior, hence as the yield point. The simultaneous decreaseof G0 and G00 for salt concentrations up to 30 mM indicates agradual structure break down. Video recordings of shearedfoams reveal that the bubbles start to slide past each other, i.e.the foam yields, when the maximum in G00 or the crossover ofG0 and G0 0 is reached as also reported in earlier studies.31,32
Similar behavior has been reported for whey protein isolatefoams7 and was explained as follows: in several studies BLGhas been found to form aggregates in thin liquid lms that areable to “glue” the surfaces together.33,34 The simultaneousdecrease of both moduli was interpreted as a gradualdestruction of the intralamellar protein networks before thebubbles start to move past each other. But there is no directexperimental proof for this intralamellar network and astructural break down might also occur within the interfacewhere the proteins form aggregated networks due to dominantattractive interactions. This network structure seems to befully developed at high ionic strengths (80 mM, 100 mM) andthen provides a uniform rigid surface layer stabilizing thefoam and leading to a sharp decay of G0 and G0 0 and a welldened yield point. At lower ionic strength the moduli decaysimultaneously in a broad range of stress amplitude valuesbetween the onset of non-linear deformation and nalyielding. The extended range between the LVE regime and theyield point is attributed to a gradual breakdown of the non-uniform, imperfect network structure within the interface(and/or across the lamellae) supposed to be present at lowerionic strength when attractive interactions are partly balancedby electrostatic repulsion.
aging, bubble radii and gas volume fractions in the range of foam agesthe standard deviation of three measurements at a given ionic strength
50 80 100 Max. error/%
.6 50.1 49.5 49.9 178–175 80–140 77–145 1486–93 85–93 84–91 1
This journal is © The Royal Society of Chemistry 2014
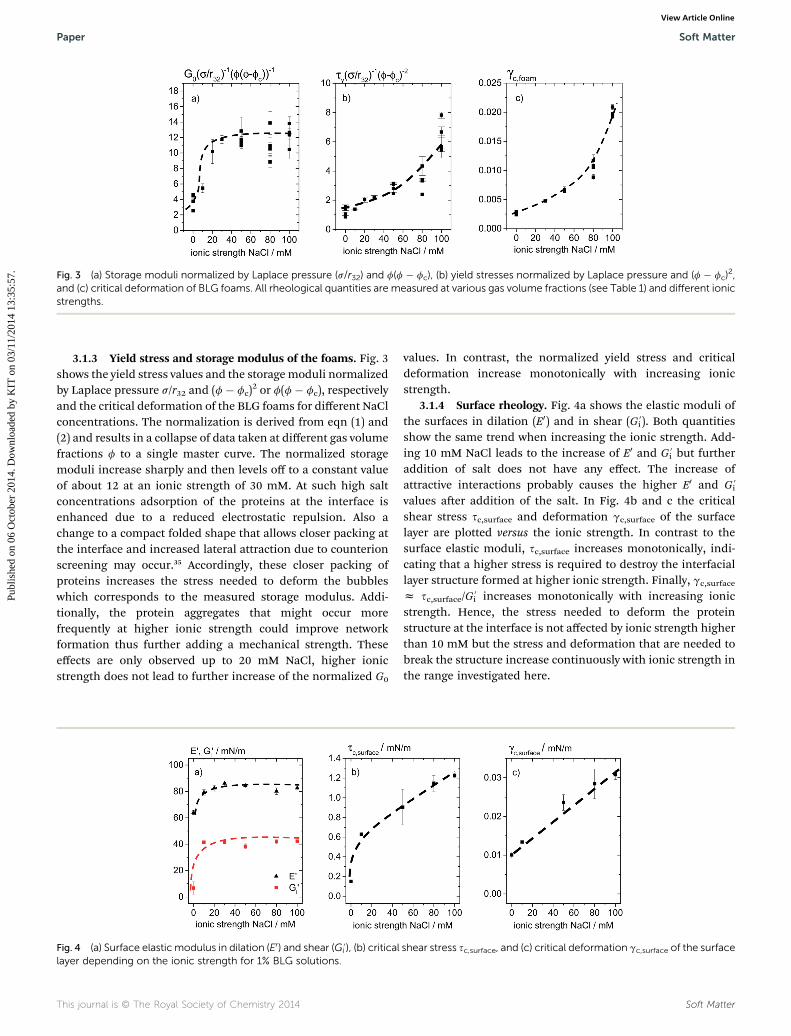
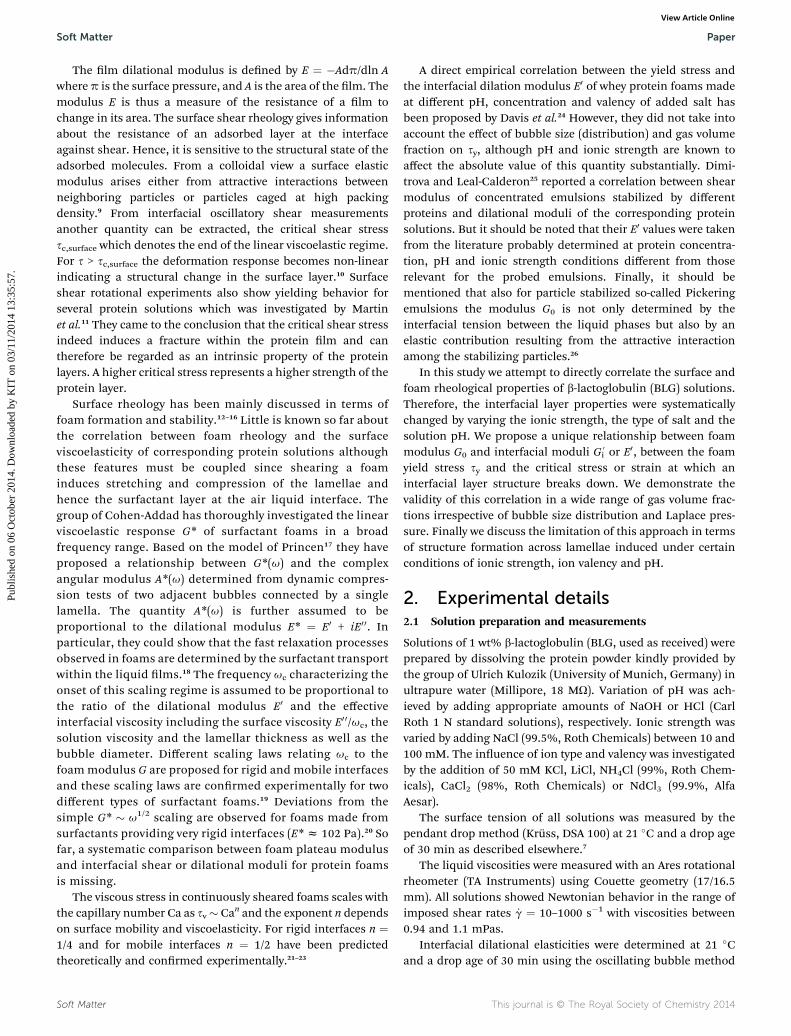
Fig. 3 (a) Storage moduli normalized by Laplace pressure (s/r32) and f(f � fc), (b) yield stresses normalized by Laplace pressure and (f � fc)2,
and (c) critical deformation of BLG foams. All rheological quantities are measured at various gas volume fractions (see Table 1) and different ionicstrengths.
Paper Soft Matter
Publ
ishe
d on
06
Oct
ober
201
4. D
ownl
oade
d by
KIT
on
03/1
1/20
14 1
3:35
:57.
View Article Online
3.1.3 Yield stress and storage modulus of the foams. Fig. 3shows the yield stress values and the storagemoduli normalizedby Laplace pressure s/r32 and (f� fc)
2 or f(f� fc), respectivelyand the critical deformation of the BLG foams for different NaClconcentrations. The normalization is derived from eqn (1) and(2) and results in a collapse of data taken at different gas volumefractions f to a single master curve. The normalized storagemoduli increase sharply and then levels off to a constant valueof about 12 at an ionic strength of 30 mM. At such high saltconcentrations adsorption of the proteins at the interface isenhanced due to a reduced electrostatic repulsion. Also achange to a compact folded shape that allows closer packing atthe interface and increased lateral attraction due to counterionscreening may occur.35 Accordingly, these closer packing ofproteins increases the stress needed to deform the bubbleswhich corresponds to the measured storage modulus. Addi-tionally, the protein aggregates that might occur morefrequently at higher ionic strength could improve networkformation thus further adding a mechanical strength. Theseeffects are only observed up to 20 mM NaCl, higher ionicstrength does not lead to further increase of the normalized G0
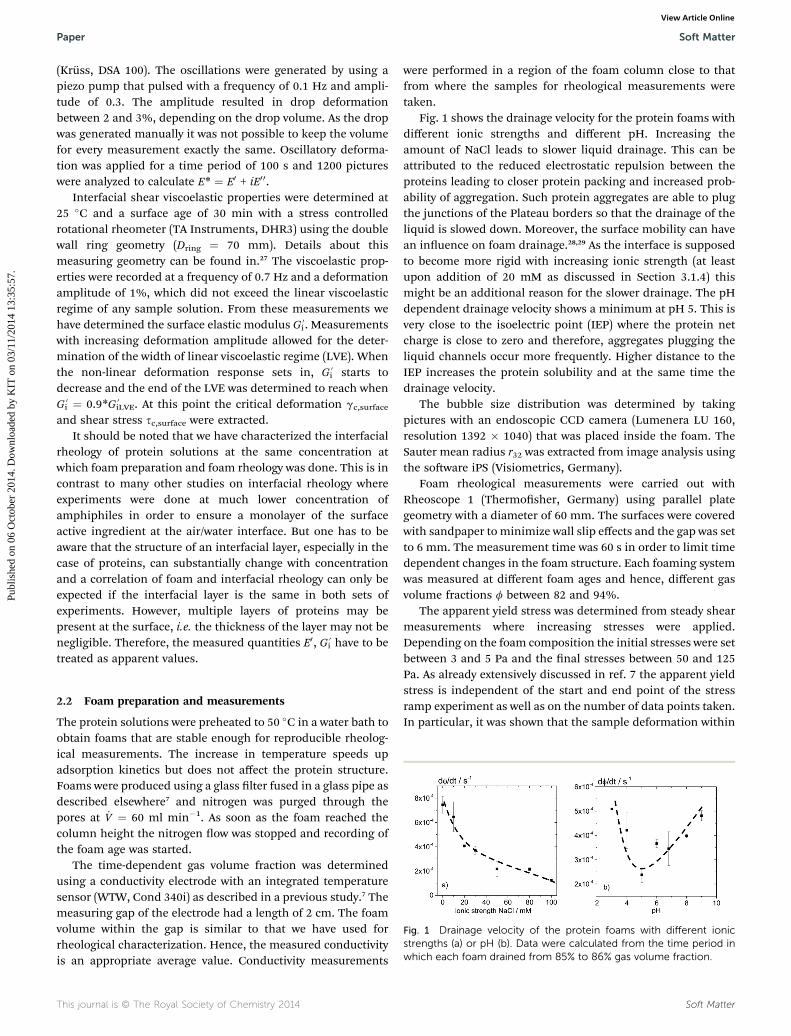
Fig. 4 (a) Surface elastic modulus in dilation (E0) and shear (G 0i ), (b) critical
layer depending on the ionic strength for 1% BLG solutions.
This journal is © The Royal Society of Chemistry 2014
values. In contrast, the normalized yield stress and criticaldeformation increase monotonically with increasing ionicstrength.
3.1.4 Surface rheology. Fig. 4a shows the elastic moduli ofthe surfaces in dilation (E0) and in shear (G 0
i ). Both quantitiesshow the same trend when increasing the ionic strength. Add-ing 10 mM NaCl leads to the increase of E0 and G 0
i but furtheraddition of salt does not have any effect. The increase ofattractive interactions probably causes the higher E0 and G 0
i
values aer addition of the salt. In Fig. 4b and c the criticalshear stress sc,surface and deformation gc,surface of the surfacelayer are plotted versus the ionic strength. In contrast to thesurface elastic moduli, sc,surface increases monotonically, indi-cating that a higher stress is required to destroy the interfaciallayer structure formed at higher ionic strength. Finally, gc,surface
z sc,surface/G0i increases monotonically with increasing ionic
strength. Hence, the stress needed to deform the proteinstructure at the interface is not affected by ionic strength higherthan 10 mM but the stress and deformation that are needed tobreak the structure increase continuously with ionic strength inthe range investigated here.
shear stress sc,surface, and (c) critical deformation gc,surface of the surface
Soft Matter

Table 2 Surface tension of the protein solutions with different kinds of salt after 30 minutes surface aging. Bubble radii and gas volume fractionswere determined at various times in the range of foam ages where the rheological measurements took place. In all cases the salt concentrationwas chosen as 50 mM. The standard deviation of three measurements performed at a constant foam age and for a given kind of salt wascalculated. The maximum standard deviation obtained from data for different foam ages and kinds of salt is listed here as maximum error
NH4Cl KCl LiCl CaCl2 NdCl3 Max. error/%
s/mN m�1 46.6 48.7 47.5 47.1 48.7 2r32/mm 93–183 84–175 93–145 105–278 220–270 10f/% 86–92 82–90 84–90 84–91 92–95 1fc 71.5 71.3 70.7 73.0 84.9 4
Soft Matter Paper
Publ
ishe
d on
06
Oct
ober
201
4. D
ownl
oade
d by
KIT
on
03/1
1/20
14 1
3:35
:57.
View Article Online
3.2 Variation of the kind and the valency of the cation
3.2.1 Foam and solution properties. Table 2 shows thecharacteristic properties of the solutions and foams preparedwith 50 mM salt of different types and valencies. The surfacetension is not signicantly affected by the kind of added salt,whereas the initial bubble radii and the bubble size distributionincrease with the valency of the cation. Especially when 50 mMNdCl3 were added, the foams possess comparably big bubbleswith a broad size distribution as reected by the high fc value.7
This is most likely due to the occurrence of aggregated proteinsas a consequence of the strongly suppressed electrostaticrepulsion in the presence of trivalent ions. More and/or biggerprotein clusters result in lower affinity of the proteins to adsorbat the interface. Hence, not all arising bubbles can be imme-diately stabilized what leads to an overall increase of the bubblesize and a broader distribution.
3.2.2 Yield stress and storage modulus of the foams.Fig. 5a–c show the reduced storage moduli, reduced yieldstresses and gc,foam data, respectively for the different saltsadded. No difference is observed for the foams made fromsolutions including different monovalent salts. The addition ofthe divalent salt CaCl2 leads to lower values in reduced G0 but tohigher values in reduced sy and gc,foam compared to themonovalent salts. In particular, for the latter the difference isvery pronounced. Each ion behaves differently when cominginto contact with the protein. It is a balance between binding tothe protein and preferential hydration (exclusion of the saltfrom the protein surface) of the protein.36,37 Ca2+ is known to
Fig. 5 (a) Reduced storage moduli, (b) reduced yield stresses and (c) crit50 mM salt solution measured at different gas volume fractions f (see T
Soft Matter
bind very strongly to BLG which could lead to conformationalchanges of the protein resulting in an increase of the hydro-phobic surface area leading to stronger protein–protein inter-actions. Also, the formation of ionic bridges cross-linking theproteinmolecules is likely to occur.38,39 The results for the foamsmade from BLG solutions with 50 mMNdCl3 also differ stronglyfrom those obtained for foams including monovalent ions. Forboth, the reduced G0 and sy, we have found very high values,whereas gc,surface is not signicantly higher than for themonovalent ions. The reason for the high sy and G0 values isagain attributed to aggregation of proteins resulting from theirlow solubility at this high ionic strength. This is supported bythe turbidity of the solutions observed aer adding the salt. Themechanism that causes these high values of the rheologicalparameters is presumably again the formation of a structureacross the lamellae. The reduced sy values additionally vary withgas volume fraction f. In fact, the f-dependent sy for thesefoams is lower than that predicted by eqn (2). We assume thatthe network structure is not destroyed as long as s < sy as it wasthe case for the foams investigated in ref. 7, but additionallycontributes to the high yield stress. At lower f and thereforethicker lamellae the protein network spanning the lamellae isexpected to have more inuence and hence causes high yieldstress values leading to the unexpected weak variation of sy withf. This phenomenon does not show up in the critical defor-mation of the foams. Finally, the different effects of divalentCa2+ and trivalent Nd3+ on foam rheology clearly demonstratethat the corresponding protein structure and packing isstrongly affected by the type and valency of the added ions.
ical deformation for foams made from 1% BLG dissolved in an aqueousable 2). For each salt f increases from left to right.
This journal is © The Royal Society of Chemistry 2014

Fig. 6 (a) Surface elastic modulus in dilation (E0) and shear (G 0i ), (b) critical shear stress sc,surface and (c) critical deformation gc,surface of the surface
layer for 1% BLG solutions containing 50 mM salt of different types and valency.
Paper Soft Matter
Publ
ishe
d on
06
Oct
ober
201
4. D
ownl
oade
d by
KIT
on
03/1
1/20
14 1
3:35
:57.
View Article Online
3.2.3 Surface rheology. In Fig. 6a–c the surface moduli E0
and G 0i , the critical deformation of the surface layer gc,surface and
the critical stress of the surface layer sc,surface are shown for theprotein solutions containing different salts. The results showsimilarities to those found for the foams (Section 3.2.2).Monovalent ions affect E0, G 0
i , gc,surface and sc,surface in a similarway. CaCl2 increases gc,surface and sc,surface but not the surfaceelastic moduli. The stronger binding of Ca2+, as described inSection 3.2.2 may also explain why the critical stress anddeformation needed to break the protein structure is higherwith Ca2+ than for other ions. The solutions containing NdCl3show the highest E0 and G 0
i values but low gc,surface values similarto the monovalent case and sc,surface is in between the values forthe monovalent ions and Ca2+. In general, the effect of di- andtrivalent ions on interfacial rheology is much less pronouncedthan on foam rheology. This strongly suggests that foamrheology in these cases is strongly determined by the structureformation across the lamellae.
3.3 Variation of pH
3.3.1 Foam and solution properties. Table 3 shows thecharacteristic properties of the BLG foams and solutions atdifferent pH. The initial average bubble sizes and bubble sizedistributions (fc ¼ 71.5 � 1.9 for all foams) are practicallyindependent of pH. The surface tension varies with a minimumat pH 5 as already found in ref. 24 and 39.
3.3.2 Oscillatory shear stress amplitude sweeps. In Fig. 7oscillatory shear stress amplitude sweeps for foams at pH valuesbetween 3 and 8 are shown. Interestingly, the curves possessdifferent shapes at different pH. At and below the IEP (zpH 5)
Table 3 Surface tension of the protein solutions at various pH after 30 mof foam ages where the rheological measurements took place. Themaxima given pH
pH 3 4 5 6
s/mN m�1 47.6 48.3 45.5 48.9r32/mm 104–109 118 93.8–145 102F/% 86–88 88 84–91 89
This journal is © The Royal Society of Chemistry 2014
G0 and G0 0 are almost constant before crossing (at pH 3 thefoams are very unstable and therefore the moduli slightlydecrease). The curves obtained at pH above the IEP can bedivided into four regimes. Aer a short linear viscoelasticregime, both moduli decrease simultaneously, then G0 0
increases again before the moduli cross over and nally bothdecrease again. The simultaneous decrease of G0 and G0 0 indi-cates a gradual structural break down as described in Section3.1.2.
3.3.3 Yield stress and storage modulus of the foams. InFig. 8 the plateau moduli and yield stresses of BLG foams atvarious gas volume fractions normalized by the Laplace pres-sure as well as the critical deformation are shown depending onthe pH. Around the isoelectric point the foams exhibit themaximum yield stress, elastic modulus and critical deforma-tion. Low pH, especially pH 3, leads to very unstable foams thatpossess very low elasticity and yield stress whereas foams athigh pH are fairly stable. This behavior has already beenreported in ref. 39 and was explained by conformationalchanges of the protein structure at different pH. Also, differentelectrostatic interactions between the proteins due to thechange in their net charge across the IEP occur. At pH 5 the netcharge vanishes which was shown to lead to thick disorderedprotein layers at the surface. The proteins also tend to aggregateat the isoelectric point. Once trapped in a foam lamella theseprotein clusters presumably support the network formationacross two adjacent surfaces and give additional mechanicalstrength to the foam structure resulting in such high values forstorage modulus and yield stress. In ref. 7 the proposed networkformation in whey protein isolate foam lamellae was found to
inutes surface aging, bubble radii and gas volume fractions in the rangeum error is themaximum standard deviation of threemeasurements at
6.8 8 9 Max. error/%
51.5 52.2 52.0 1110–154 103 106–175 787–96 88 87–94 0.4
Soft Matter

Fig. 7 Oscillatory shear measurements with varying stress amplitudeof BLG foams at different pH: (a) storage modulus G0 and (b) lossmodulus G0 0 versus the stress amplitude at a fixed frequency f ¼ 1 Hz.The intersection of G0 and G0 0 is marked with crosses.
Soft Matter Paper
Publ
ishe
d on
06
Oct
ober
201
4. D
ownl
oade
d by
KIT
on
03/1
1/20
14 1
3:35
:57.
View Article Online
increase G0 but did not affect the yield stress. From oscillatoryamplitude sweeps it could be concluded that the whey proteinnetwork is destroyed at s< sy, as it is the case for every pH s 5.This suggests the existence of weak, non-uniform networksgradually destroyed as the stress amplitude increases. At pH 5the destruction of the protein network seems to go along withyielding of the foam indicating a strong uniformly collapsingstructure. Above pH 6.8 all three foam rheological parametersdo not signicantly depend on pH.
3.3.4 Surface rheology. Fig. 9a shows the pH dependence ofthe surface elastic moduli in shear and dilation for the 1% BLGsolutions. Both moduli increase up to pH 6 followed by a localminimum around pH 7. The minimum probably arises becausethis is the natural pH of the solution and no ions are added toadjust the pH. The maximum change in the ionic strength dueto adjusting pH is approximately 10 mM and according toFig. 4a this corresponds to a drastic increase in G 0
i as well as E0.Against expectation, the surface moduli do not show amaximum around the IEP as it has been reported for variousproteins including BLG in several studies of interfacial shear41–44
and dilational properties.24,40,45 But it should be noted that theprotein concentration used in those studies is much lower (atleast 5–10 times) than the concentration used here which was
Fig. 8 (a) Storage moduli normalized by Laplace pressure (s/r32) and f(fand (c) critical deformation of BLG foams. All rheological quantities are m
Soft Matter
chosen to be that high to meet the conditions used for foampreparation and foam rheology measurement. Burgess et al.35
have also worked with high protein concentrations of BSA andHIgG similar to the concentrations used in this study andmeasured surface shear elasticities as a function of pH.Surprisingly, they found a minimum in G 0
i at the IEP andexplained this phenomenon by low protein–protein interactionsdue to a compact shape of the proteins. This explanation is indisagreement with the other studies mentioned above whichconclude a strong attraction among proteins at the IEP. Theyattributed the attractive interactions to close and effectivecontacts among proteins because of the low net charge.24,35 Weassume that the difference in the reported results arises mainlyfrom different protein concentrations. Exceeding a criticalprotein concentration results in the formation of multilayers atthe surface. Wustneck46 measured surface elastic properties ofgelatin layers and found the elastic modulus to decrease at acertain concentration that he attributed to the onset of multi-layer formation. Also, the formation of protein aggregates,which becomes more signicant as the protein concentrationincreases, can lead to a decrease in the surface elasticity as wediscussed extensively in a previous study.7 The reason for thelower values at pH 3 compared to the values at pH 6.8 despitethe same distance to the isoelectric point is differences in theprotein structure and hydrophobicity as already discussed inref. 24 and 40.
3.4 Correlation between interfacial and foam rheology
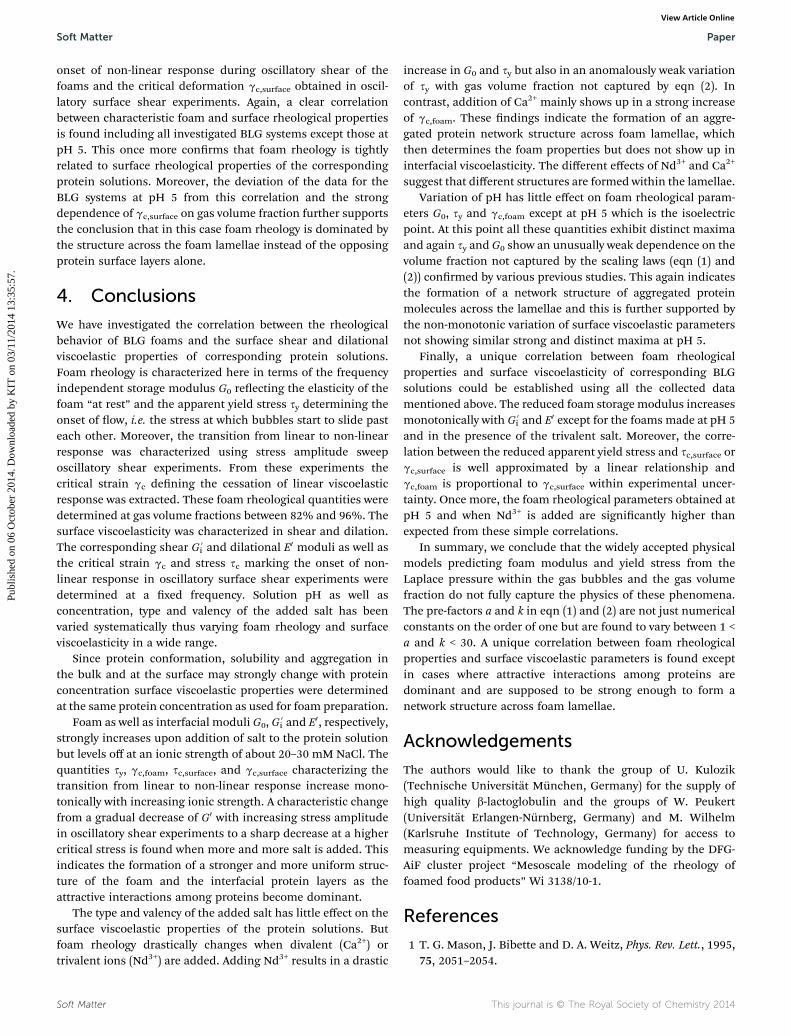
In Fig. 10 the normalized storage moduli of all foams investi-gated in this study are plotted versus the surface elastic moduliG 0i and E0. Additionally, data points for whey protein isolate
foams (0.1% and 1%) and 3% casein foams (data taken from ref.7) are included. A clear correlation is observed between thenormalized foam moduli and surface moduli of the corre-sponding protein solutions except for the 1% BLG solutions atpH 5 and with NdCl3 as well as the 1% WPI solution. Therelationship between G0 and G 0
i is obviously linear whereas ourdata suggest a stronger quadratic or cubed dependence of G0 onE0. These ndings directly demonstrate that surface elasticity is
� fc), (b) yield stresses normalized by Laplace pressure and (f � fc),2
easured at various gas volume fractions (see Table 3) and different pH.
This journal is © The Royal Society of Chemistry 2014
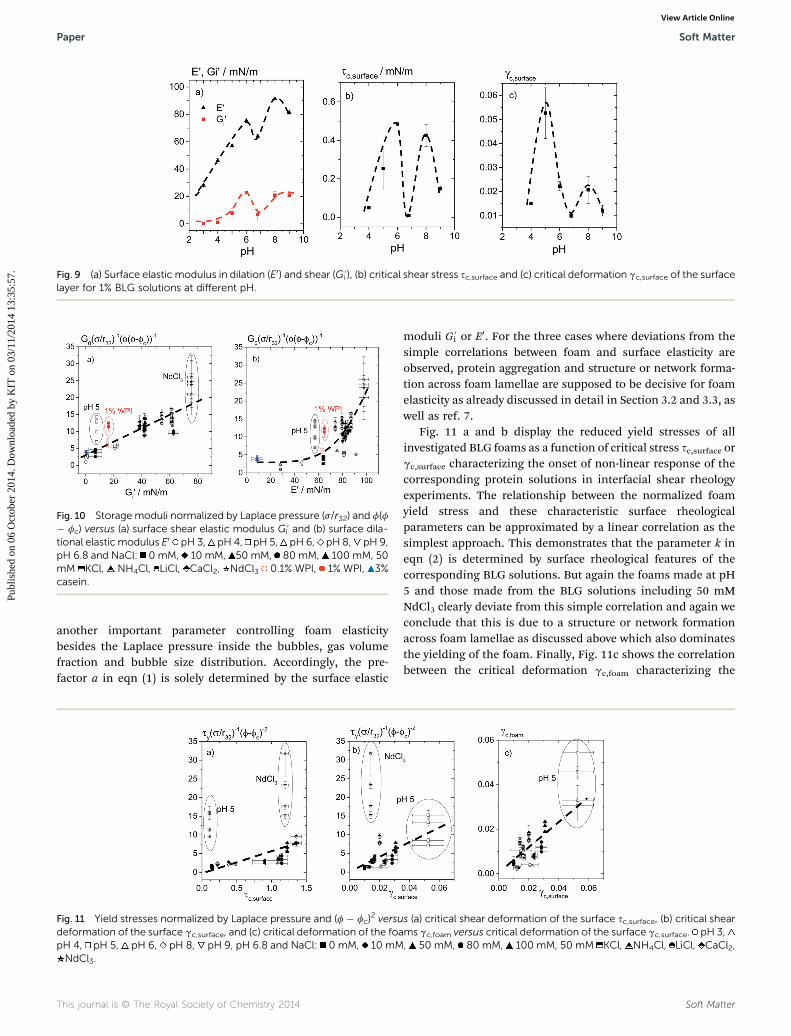
Fig. 9 (a) Surface elastic modulus in dilation (E0) and shear (G 0i ), (b) critical shear stress sc,surface and (c) critical deformation gc,surface of the surface
layer for 1% BLG solutions at different pH.
Fig. 10 Storage moduli normalized by Laplace pressure (s/r32) and f(f� fc) versus (a) surface shear elastic modulus G 0
i and (b) surface dila-tional elastic modulus E0 pH 3, pH 4, pH 5, pH 6, pH 8, pH 9,pH 6.8 and NaCl: 0 mM, 10 mM, 50 mM, 80 mM, 100 mM, 50mM KCl, NH4Cl, LiCl, CaCl2, NdCl3 0.1% WPI, 1% WPI, 3%casein.
Paper Soft Matter
Publ
ishe
d on
06
Oct
ober
201
4. D
ownl
oade
d by
KIT
on
03/1
1/20
14 1
3:35
:57.
View Article Online
another important parameter controlling foam elasticitybesides the Laplace pressure inside the bubbles, gas volumefraction and bubble size distribution. Accordingly, the pre-factor a in eqn (1) is solely determined by the surface elastic
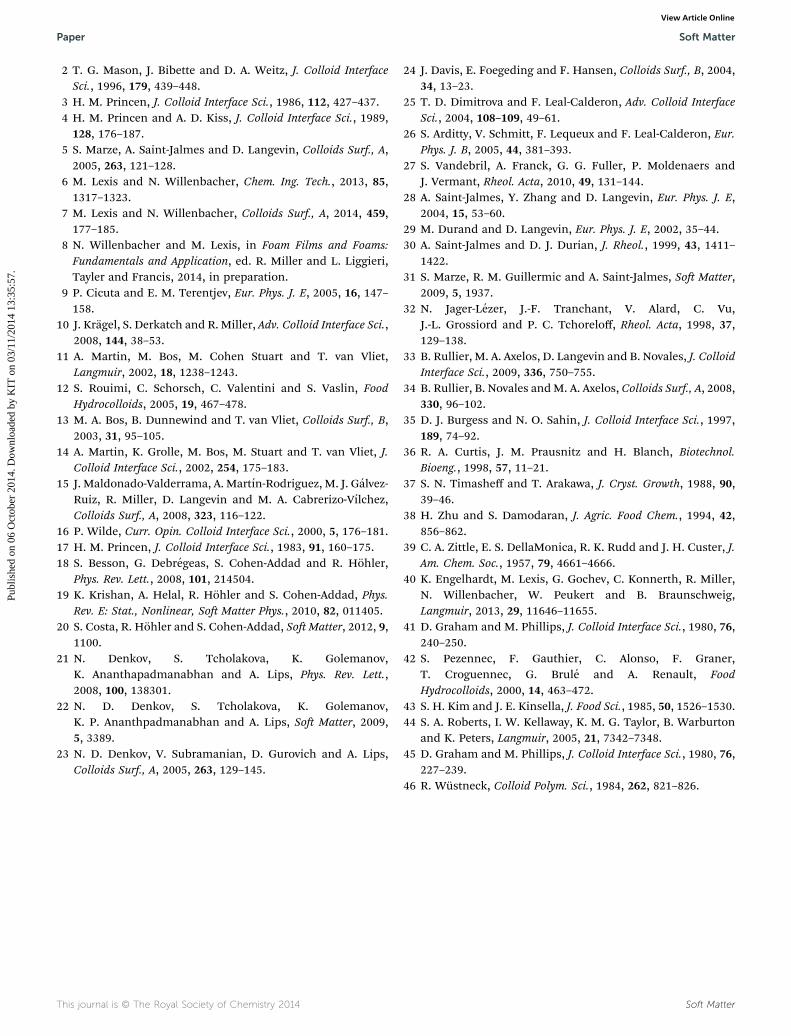
Fig. 11 Yield stresses normalized by Laplace pressure and (f � fc)2 versu
deformation of the surface gc,surface, and (c) critical deformation of the foapH 4, pH 5, pH 6, pH 8, pH 9, pH 6.8 and NaCl: 0 mM, 10 mMNdCl3.
This journal is © The Royal Society of Chemistry 2014
moduli G 0i or E0. For the three cases where deviations from the
simple correlations between foam and surface elasticity areobserved, protein aggregation and structure or network forma-tion across foam lamellae are supposed to be decisive for foamelasticity as already discussed in detail in Section 3.2 and 3.3, aswell as ref. 7.
Fig. 11 a and b display the reduced yield stresses of allinvestigated BLG foams as a function of critical stress sc,surface orgc,surface characterizing the onset of non-linear response of thecorresponding protein solutions in interfacial shear rheologyexperiments. The relationship between the normalized foamyield stress and these characteristic surface rheologicalparameters can be approximated by a linear correlation as thesimplest approach. This demonstrates that the parameter k ineqn (2) is determined by surface rheological features of thecorresponding BLG solutions. But again the foams made at pH5 and those made from the BLG solutions including 50 mMNdCl3 clearly deviate from this simple correlation and again weconclude that this is due to a structure or network formationacross foam lamellae as discussed above which also dominatesthe yielding of the foam. Finally, Fig. 11c shows the correlationbetween the critical deformation gc,foam characterizing the
s (a) critical shear deformation of the surface sc,surface, (b) critical shearms gc,foam versus critical deformation of the surface gc,surface. pH 3,, 50 mM, 80 mM, 100 mM, 50 mM KCl, NH4Cl, LiCl, CaCl2,
Soft Matter
Soft Matter Paper
Publ
ishe
d on
06
Oct
ober
201
4. D
ownl
oade
d by
KIT
on
03/1
1/20
14 1
3:35
:57.
View Article Online
onset of non-linear response during oscillatory shear of thefoams and the critical deformation gc,surface obtained in oscil-latory surface shear experiments. Again, a clear correlationbetween characteristic foam and surface rheological propertiesis found including all investigated BLG systems except those atpH 5. This once more conrms that foam rheology is tightlyrelated to surface rheological properties of the correspondingprotein solutions. Moreover, the deviation of the data for theBLG systems at pH 5 from this correlation and the strongdependence of gc,surface on gas volume fraction further supportsthe conclusion that in this case foam rheology is dominated bythe structure across the foam lamellae instead of the opposingprotein surface layers alone.
4. Conclusions
We have investigated the correlation between the rheologicalbehavior of BLG foams and the surface shear and dilationalviscoelastic properties of corresponding protein solutions.Foam rheology is characterized here in terms of the frequencyindependent storage modulus G0 reecting the elasticity of thefoam “at rest” and the apparent yield stress sy determining theonset of ow, i.e. the stress at which bubbles start to slide pasteach other. Moreover, the transition from linear to non-linearresponse was characterized using stress amplitude sweeposcillatory shear experiments. From these experiments thecritical strain gc dening the cessation of linear viscoelasticresponse was extracted. These foam rheological quantities weredetermined at gas volume fractions between 82% and 96%. Thesurface viscoelasticity was characterized in shear and dilation.The corresponding shear G 0
i and dilational E0 moduli as well asthe critical strain gc and stress sc marking the onset of non-linear response in oscillatory surface shear experiments weredetermined at a xed frequency. Solution pH as well asconcentration, type and valency of the added salt has beenvaried systematically thus varying foam rheology and surfaceviscoelasticity in a wide range.
Since protein conformation, solubility and aggregation inthe bulk and at the surface may strongly change with proteinconcentration surface viscoelastic properties were determinedat the same protein concentration as used for foam preparation.
Foam as well as interfacial moduli G0, G0i and E0, respectively,
strongly increases upon addition of salt to the protein solutionbut levels off at an ionic strength of about 20–30 mM NaCl. Thequantities sy, gc,foam, sc,surface, and gc,surface characterizing thetransition from linear to non-linear response increase mono-tonically with increasing ionic strength. A characteristic changefrom a gradual decrease of G0 with increasing stress amplitudein oscillatory shear experiments to a sharp decrease at a highercritical stress is found when more and more salt is added. Thisindicates the formation of a stronger and more uniform struc-ture of the foam and the interfacial protein layers as theattractive interactions among proteins become dominant.
The type and valency of the added salt has little effect on thesurface viscoelastic properties of the protein solutions. Butfoam rheology drastically changes when divalent (Ca2+) ortrivalent ions (Nd3+) are added. Adding Nd3+ results in a drastic
Soft Matter
increase in G0 and sy but also in an anomalously weak variationof sy with gas volume fraction not captured by eqn (2). Incontrast, addition of Ca2+ mainly shows up in a strong increaseof gc,foam. These ndings indicate the formation of an aggre-gated protein network structure across foam lamellae, whichthen determines the foam properties but does not show up ininterfacial viscoelasticity. The different effects of Nd3+ and Ca2+
suggest that different structures are formed within the lamellae.Variation of pH has little effect on foam rheological param-
eters G0, sy and gc,foam except at pH 5 which is the isoelectricpoint. At this point all these quantities exhibit distinct maximaand again sy and G0 show an unusually weak dependence on thevolume fraction not captured by the scaling laws (eqn (1) and(2)) conrmed by various previous studies. This again indicatesthe formation of a network structure of aggregated proteinmolecules across the lamellae and this is further supported bythe non-monotonic variation of surface viscoelastic parametersnot showing similar strong and distinct maxima at pH 5.
Finally, a unique correlation between foam rheologicalproperties and surface viscoelasticity of corresponding BLGsolutions could be established using all the collected datamentioned above. The reduced foam storage modulus increasesmonotonically with G 0
i and E0 except for the foams made at pH 5and in the presence of the trivalent salt. Moreover, the corre-lation between the reduced apparent yield stress and sc,surface orgc,surface is well approximated by a linear relationship andgc,foam is proportional to gc,surface within experimental uncer-tainty. Once more, the foam rheological parameters obtained atpH 5 and when Nd3+ is added are signicantly higher thanexpected from these simple correlations.
In summary, we conclude that the widely accepted physicalmodels predicting foam modulus and yield stress from theLaplace pressure within the gas bubbles and the gas volumefraction do not fully capture the physics of these phenomena.The pre-factors a and k in eqn (1) and (2) are not just numericalconstants on the order of one but are found to vary between 1 <a and k < 30. A unique correlation between foam rheologicalproperties and surface viscoelastic parameters is found exceptin cases where attractive interactions among proteins aredominant and are supposed to be strong enough to form anetwork structure across foam lamellae.
Acknowledgements
The authors would like to thank the group of U. Kulozik(Technische Universitat Munchen, Germany) for the supply ofhigh quality b-lactoglobulin and the groups of W. Peukert(Universitat Erlangen-Nurnberg, Germany) and M. Wilhelm(Karlsruhe Institute of Technology, Germany) for access tomeasuring equipments. We acknowledge funding by the DFG-AiF cluster project “Mesoscale modeling of the rheology offoamed food products” Wi 3138/10-1.
References
1 T. G. Mason, J. Bibette and D. A. Weitz, Phys. Rev. Lett., 1995,75, 2051–2054.
This journal is © The Royal Society of Chemistry 2014
Paper Soft Matter
Publ
ishe
d on
06
Oct
ober
201
4. D
ownl
oade
d by
KIT
on
03/1
1/20
14 1
3:35
:57.
View Article Online
2 T. G. Mason, J. Bibette and D. A. Weitz, J. Colloid InterfaceSci., 1996, 179, 439–448.
3 H. M. Princen, J. Colloid Interface Sci., 1986, 112, 427–437.4 H. M. Princen and A. D. Kiss, J. Colloid Interface Sci., 1989,128, 176–187.
5 S. Marze, A. Saint-Jalmes and D. Langevin, Colloids Surf., A,2005, 263, 121–128.
6 M. Lexis and N. Willenbacher, Chem. Ing. Tech., 2013, 85,1317–1323.
7 M. Lexis and N. Willenbacher, Colloids Surf., A, 2014, 459,177–185.
8 N. Willenbacher and M. Lexis, in Foam Films and Foams:Fundamentals and Application, ed. R. Miller and L. Liggieri,Tayler and Francis, 2014, in preparation.
9 P. Cicuta and E. M. Terentjev, Eur. Phys. J. E, 2005, 16, 147–158.
10 J. Kragel, S. Derkatch and R. Miller, Adv. Colloid Interface Sci.,2008, 144, 38–53.
11 A. Martin, M. Bos, M. Cohen Stuart and T. van Vliet,Langmuir, 2002, 18, 1238–1243.
12 S. Rouimi, C. Schorsch, C. Valentini and S. Vaslin, FoodHydrocolloids, 2005, 19, 467–478.
13 M. A. Bos, B. Dunnewind and T. van Vliet, Colloids Surf., B,2003, 31, 95–105.
14 A. Martin, K. Grolle, M. Bos, M. Stuart and T. van Vliet, J.Colloid Interface Sci., 2002, 254, 175–183.
15 J. Maldonado-Valderrama, A. Martın-Rodriguez, M. J. Galvez-Ruiz, R. Miller, D. Langevin and M. A. Cabrerizo-Vılchez,Colloids Surf., A, 2008, 323, 116–122.
16 P. Wilde, Curr. Opin. Colloid Interface Sci., 2000, 5, 176–181.17 H. M. Princen, J. Colloid Interface Sci., 1983, 91, 160–175.18 S. Besson, G. Debregeas, S. Cohen-Addad and R. Hohler,
Phys. Rev. Lett., 2008, 101, 214504.19 K. Krishan, A. Helal, R. Hohler and S. Cohen-Addad, Phys.
Rev. E: Stat., Nonlinear, So Matter Phys., 2010, 82, 011405.20 S. Costa, R. Hohler and S. Cohen-Addad, SoMatter, 2012, 9,
1100.21 N. Denkov, S. Tcholakova, K. Golemanov,
K. Ananthapadmanabhan and A. Lips, Phys. Rev. Lett.,2008, 100, 138301.
22 N. D. Denkov, S. Tcholakova, K. Golemanov,K. P. Ananthpadmanabhan and A. Lips, So Matter, 2009,5, 3389.
23 N. D. Denkov, V. Subramanian, D. Gurovich and A. Lips,Colloids Surf., A, 2005, 263, 129–145.
This journal is © The Royal Society of Chemistry 2014
24 J. Davis, E. Foegeding and F. Hansen, Colloids Surf., B, 2004,34, 13–23.
25 T. D. Dimitrova and F. Leal-Calderon, Adv. Colloid InterfaceSci., 2004, 108–109, 49–61.
26 S. Arditty, V. Schmitt, F. Lequeux and F. Leal-Calderon, Eur.Phys. J. B, 2005, 44, 381–393.
27 S. Vandebril, A. Franck, G. G. Fuller, P. Moldenaers andJ. Vermant, Rheol. Acta, 2010, 49, 131–144.
28 A. Saint-Jalmes, Y. Zhang and D. Langevin, Eur. Phys. J. E,2004, 15, 53–60.
29 M. Durand and D. Langevin, Eur. Phys. J. E, 2002, 35–44.30 A. Saint-Jalmes and D. J. Durian, J. Rheol., 1999, 43, 1411–
1422.31 S. Marze, R. M. Guillermic and A. Saint-Jalmes, So Matter,
2009, 5, 1937.32 N. Jager-Lezer, J.-F. Tranchant, V. Alard, C. Vu,
J.-L. Grossiord and P. C. Tchoreloff, Rheol. Acta, 1998, 37,129–138.
33 B. Rullier, M. A. Axelos, D. Langevin and B. Novales, J. ColloidInterface Sci., 2009, 336, 750–755.
34 B. Rullier, B. Novales andM. A. Axelos, Colloids Surf., A, 2008,330, 96–102.
35 D. J. Burgess and N. O. Sahin, J. Colloid Interface Sci., 1997,189, 74–92.
36 R. A. Curtis, J. M. Prausnitz and H. Blanch, Biotechnol.Bioeng., 1998, 57, 11–21.
37 S. N. Timasheff and T. Arakawa, J. Cryst. Growth, 1988, 90,39–46.
38 H. Zhu and S. Damodaran, J. Agric. Food Chem., 1994, 42,856–862.
39 C. A. Zittle, E. S. DellaMonica, R. K. Rudd and J. H. Custer, J.Am. Chem. Soc., 1957, 79, 4661–4666.
40 K. Engelhardt, M. Lexis, G. Gochev, C. Konnerth, R. Miller,N. Willenbacher, W. Peukert and B. Braunschweig,Langmuir, 2013, 29, 11646–11655.
41 D. Graham and M. Phillips, J. Colloid Interface Sci., 1980, 76,240–250.
42 S. Pezennec, F. Gauthier, C. Alonso, F. Graner,T. Croguennec, G. Brule and A. Renault, FoodHydrocolloids, 2000, 14, 463–472.
43 S. H. Kim and J. E. Kinsella, J. Food Sci., 1985, 50, 1526–1530.44 S. A. Roberts, I. W. Kellaway, K. M. G. Taylor, B. Warburton
and K. Peters, Langmuir, 2005, 21, 7342–7348.45 D. Graham and M. Phillips, J. Colloid Interface Sci., 1980, 76,
227–239.46 R. Wustneck, Colloid Polym. Sci., 1984, 262, 821–826.
Soft Matter