reinsurance of longevity : risk transfer and capital
TRANSCRIPT
Reinsurance of longevity : risk transfer and capital management solutions
Daria Ossipova Kachakhidze Centre R&D Longevity-Mortality
Beijing, September 6, 2013

2
Plan
1 Longevity risk. Where reinsurance can help?
2 Ways to cover longevity risk: depending on your needs...
3 Reinsurance solutions: some examples and where the price come from.
3
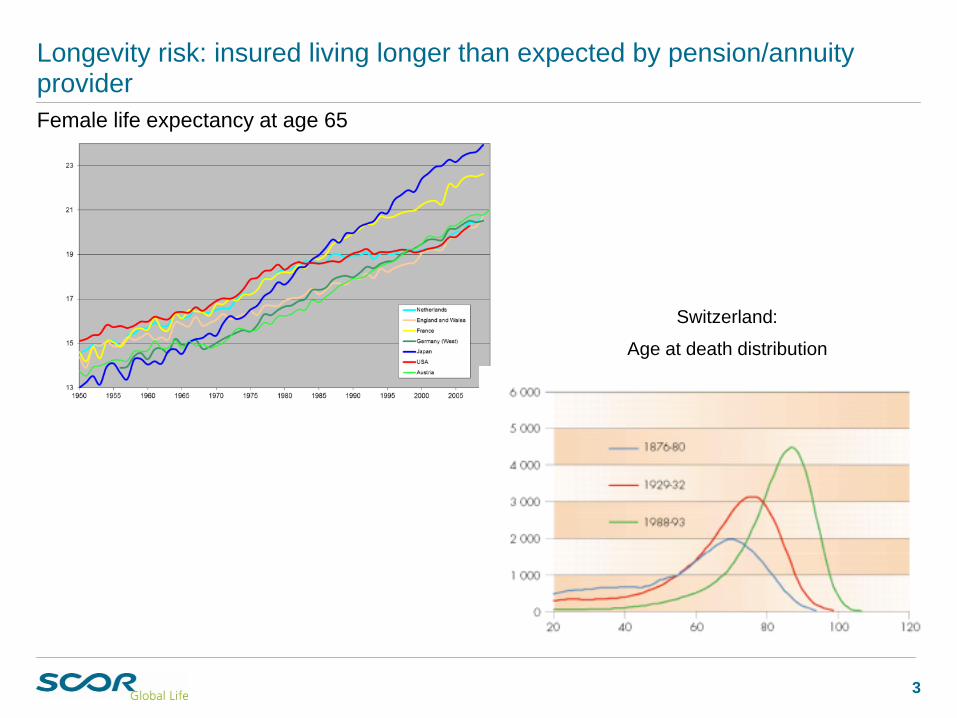
Longevity risk: insured living longer than expected by pension/annuity provider
3
Female life expectancy at age 65
Switzerland:
Age at death distribution
4
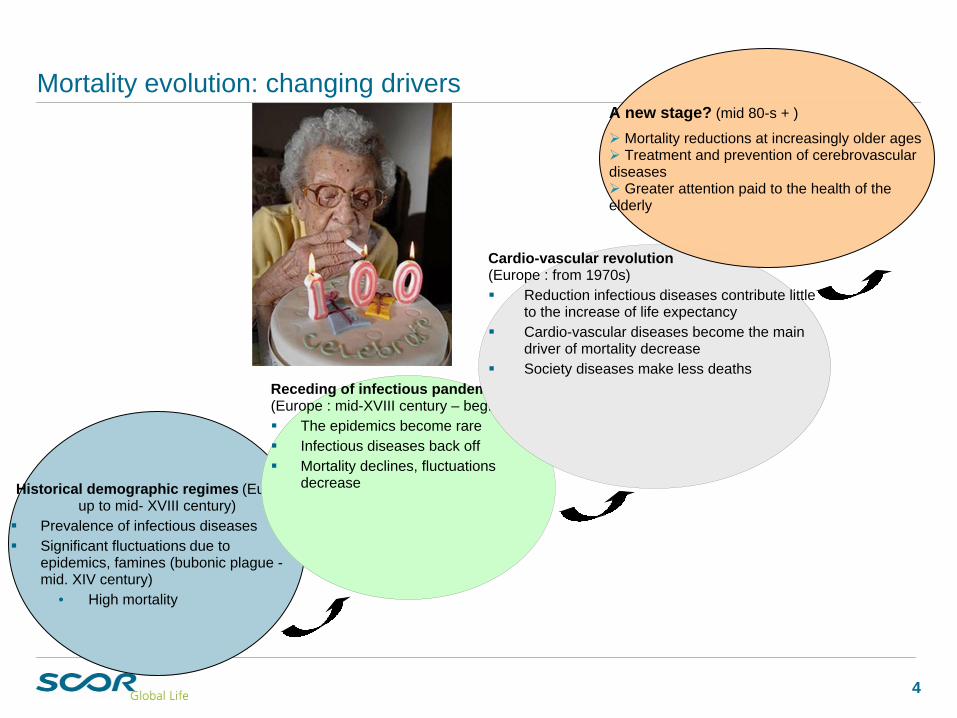
Mortality evolution: changing drivers
Historical demographic regimes (Europe: up to mid- XVIII century)
Prevalence of infectious diseasesSignificant fluctuations due to epidemics, famines (bubonic plague - mid. XIV century)
High mortality •
Receding of infectious pandemics (Europe : mid-XVIII century – beg. 1960’s)
The epidemics become rareInfectious diseases back offMortality declines, fluctuations decrease
Cardio-vascular revolution (Europe : from 1970s)
Reduction infectious diseases contribute little to the increase of life expectancy Cardio-vascular diseases become the main driver of mortality decrease Society diseases make less deaths
A new stage? (mid 80-s + )
Mortality reductions at increasingly older ages Treatment and prevention of cerebrovascular
diseases Greater attention paid to the health of the
elderly
5
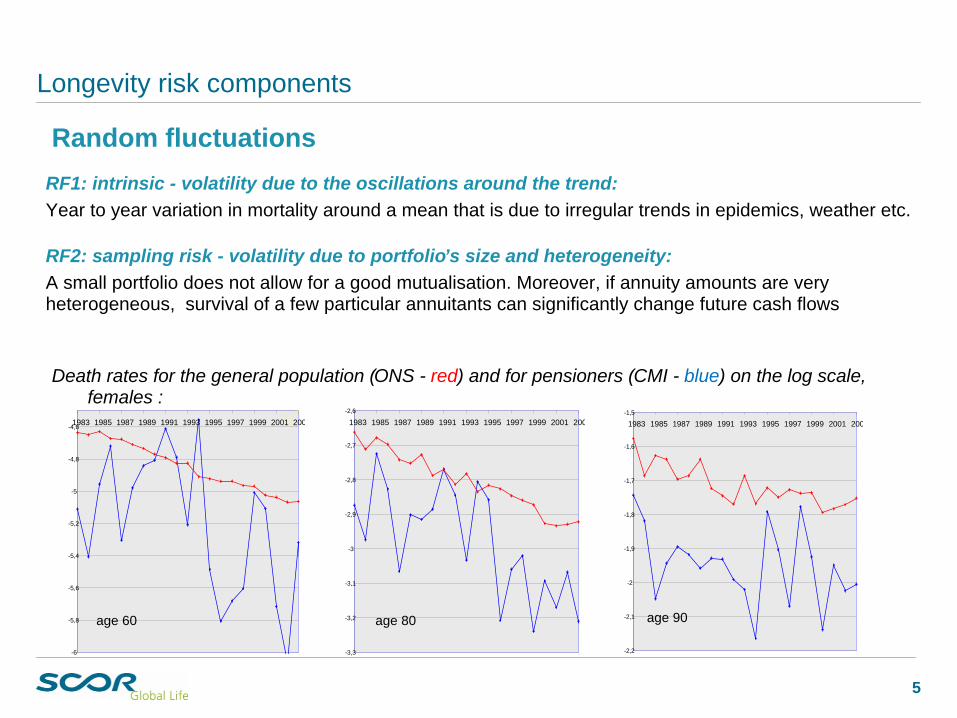
Longevity risk components
RF1: intrinsic - volatility due to the oscillations around the trend:Year to year variation in mortality around a mean that is due to irregular trends in epidemics, weather etc.
RF2: sampling risk - volatility due to portfolio’s size and heterogeneity:A small portfolio does not allow for a good mutualisation. Moreover, if annuity amounts are very heterogeneous, survival of a few particular annuitants can significantly change future cash flows
5-6
-5,8
-5,6
-5,4
-5,2
-5
-4,8
-4,61983 1985 1987 1989 1991 1993 1995 1997 1999 2001 2003
-3,3
-3,2
-3,1
-3
-2,9
-2,8
-2,7
-2,6
1983 1985 1987 1989 1991 1993 1995 1997 1999 2001 2003
-2,2
-2,1
-2
-1,9
-1,8
-1,7
-1,6
-1,5
1983 1985 1987 1989 1991 1993 1995 1997 1999 2001 2003
Death rates for the general population (ONS - red) and for pensioners (CMI - blue) on the log scale, females :
age 60 age 80 age 90
Random fluctuations
6
Longevity risk components
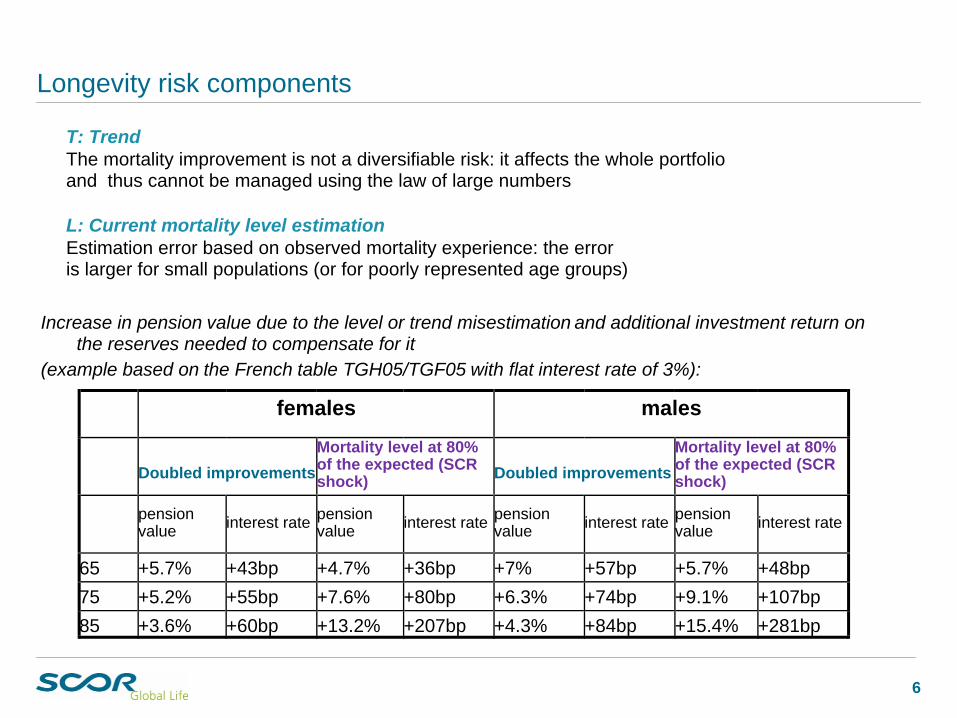
T: TrendThe mortality improvement is not a diversifiable risk: it affects the whole portfolio and thus cannot be managed using the law of large numbers
L: Current mortality level estimationEstimation error based on observed mortality experience: the error is larger for small populations (or for poorly represented age groups)
6
females males
Doubled improvements Mortality level at 80% of the expected (SCR shock) Doubled improvements
Mortality level at 80% of the expected (SCR shock)
pension value interest rate pension
value interest rate pension value interest rate pension
value interest rate
65 +5.7% +43bp +4.7% +36bp +7% +57bp +5.7% +48bp75 +5.2% +55bp +7.6% +80bp +6.3% +74bp +9.1% +107bp85 +3.6% +60bp +13.2% +207bp +4.3% +84bp +15.4% +281bp
Increase in pension value due to the level or trend misestimation and additional investment return on the reserves needed to compensate for it
(example based on the French table TGH05/TGF05 with flat interest rate of 3%):
7
Longevity risk components
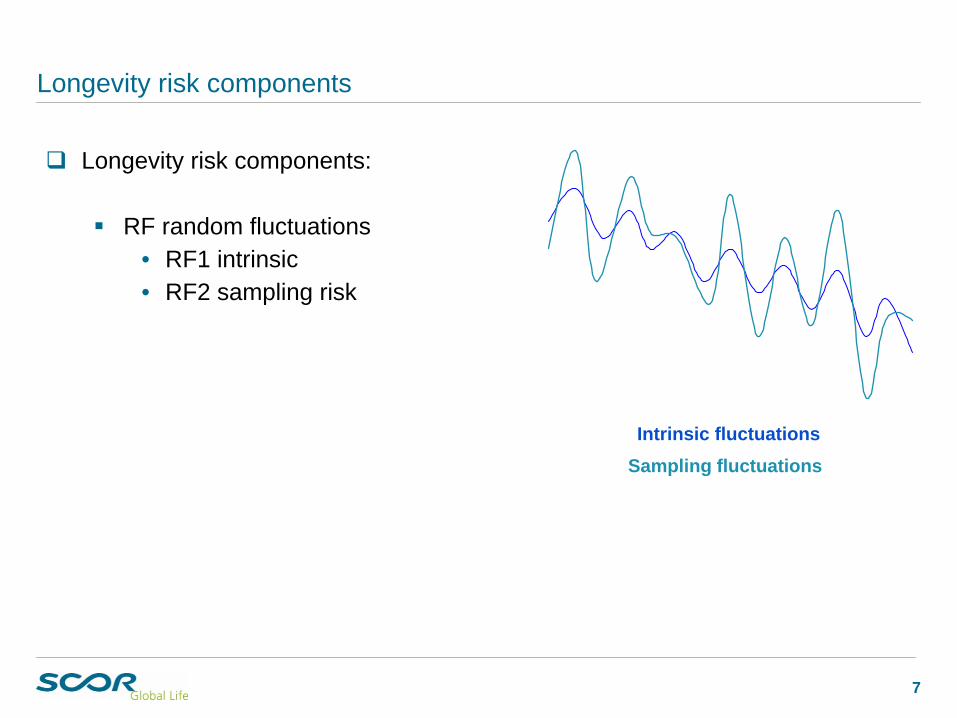
Longevity risk components:
RF random fluctuations RF1 intrinsic•RF2 sampling risk•
Sampling fluctuationsIntrinsic fluctuations
8
Longevity risk components
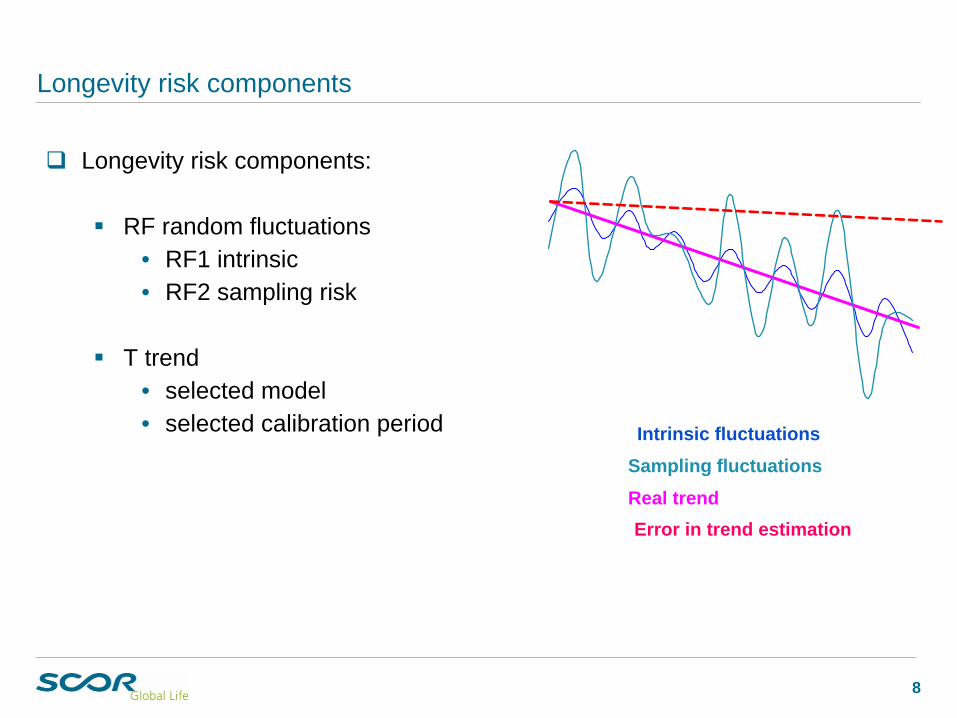
Longevity risk components:
RF random fluctuations RF1 intrinsic•RF2 sampling risk•
T trend selected model •selected calibration period•
Real trendError in trend estimation
Sampling fluctuationsIntrinsic fluctuations
9
Longevity risk components
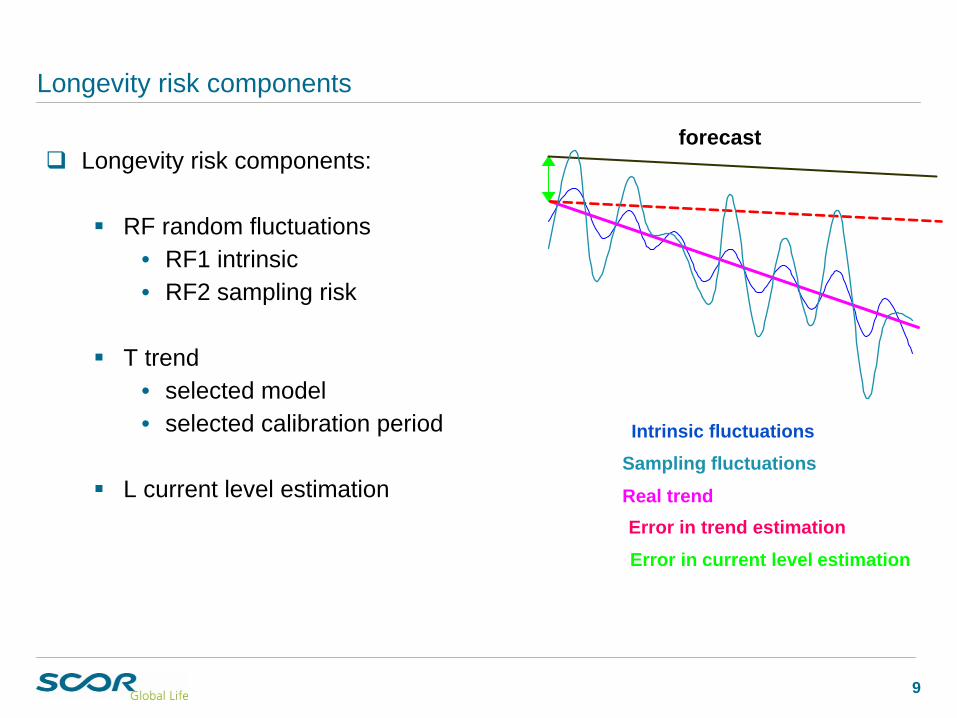
Longevity risk components:
RF random fluctuations RF1 intrinsic•RF2 sampling risk•
T trend selected model •selected calibration period•
L current level estimation
Error in current level estimation
Real trendError in trend estimation
Sampling fluctuationsIntrinsic fluctuations
forecast
10
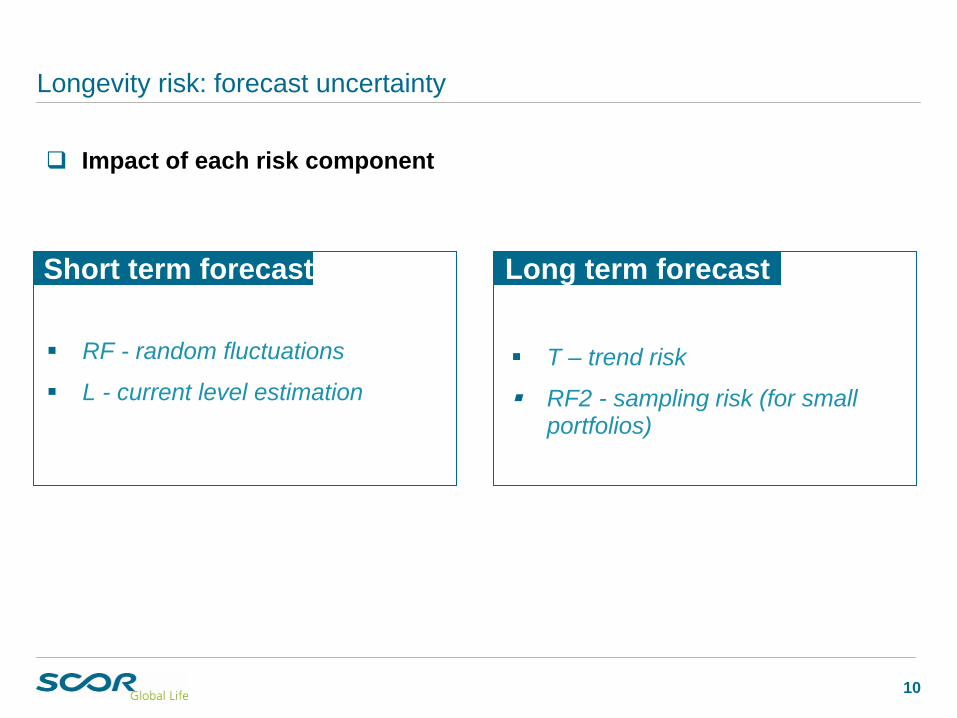
Longevity risk: forecast uncertainty
RF - random fluctuations
L - current level estimation
Short term forecast Long term forecast
T – trend risk
RF2 - sampling risk (for small portfolios)
Impact of each risk component
11
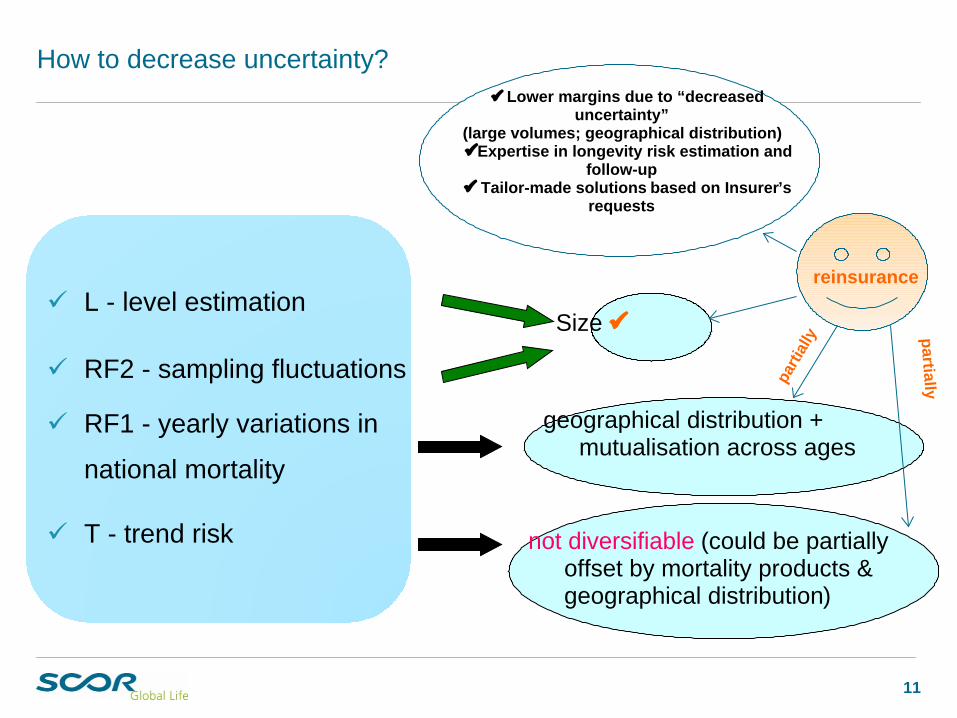
How to decrease uncertainty?
L - level estimation
RF2 - sampling fluctuations
RF1 - yearly variations in
national mortality
T - trend risk
Size
geographical distribution + mutualisation across ages
not diversifiable (could be partially offset by mortality products & geographical distribution)
reinsurance
parti
ally
Lower margins due to “decreased uncertainty”
(large volumes; geographical distribution)Expertise in longevity risk estimation and
follow-up Tailor-made solutions based on Insurer’s
requests
partially

12
Plan
1 Longevity risk. Where reinsurance can help?
2 Ways to cover longevity risk: depending on your needs...
3 Reinsurance solutions: some examples and where the price come from.
13
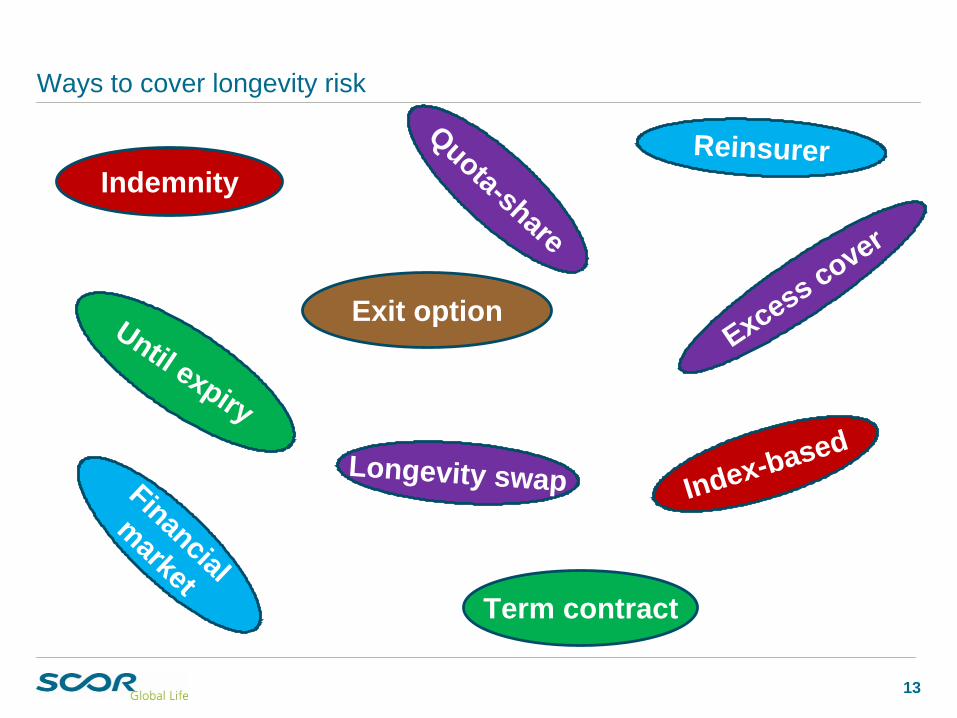
Ways to cover longevity risk
Indemnity
Index-based
Quota-share
Longevity swap
Excess cover
Reinsurer
Financial
marketTerm contract
Until expiry
Exit option
14
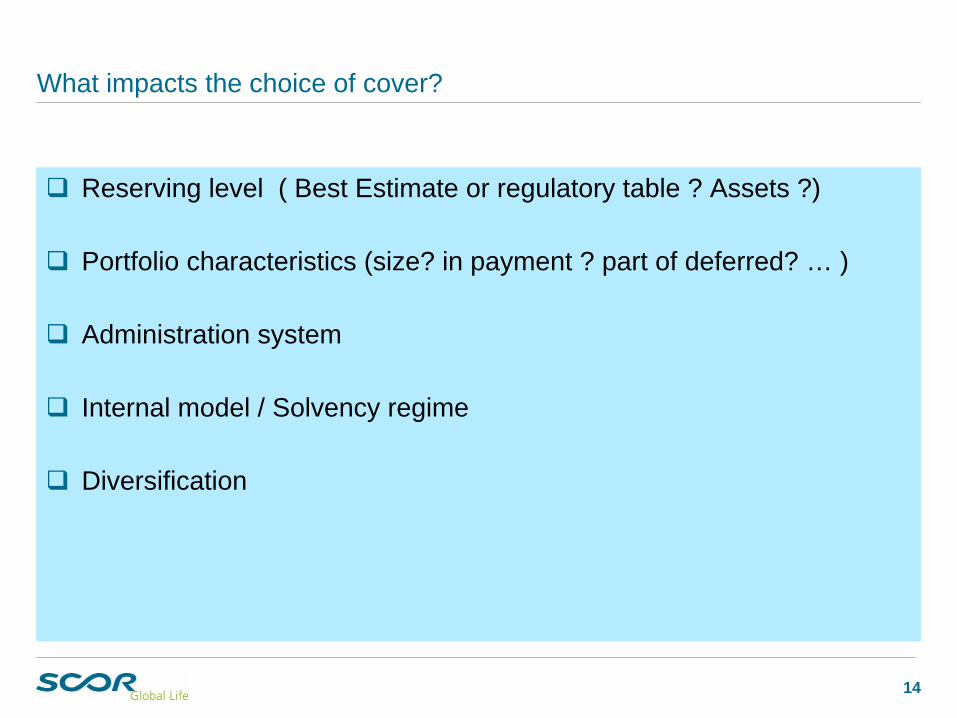
What impacts the choice of cover?
Reserving level ( Best Estimate or regulatory table ? Assets ?)
Portfolio characteristics (size? in payment ? part of deferred? … )
Administration system
Internal model / Solvency regime
Diversification
15
Two categories of longevity hedge:
15
Indemnity
reflects actual longevity experience of the insured portfolio –
Based on actual payments made to annuitants!
16
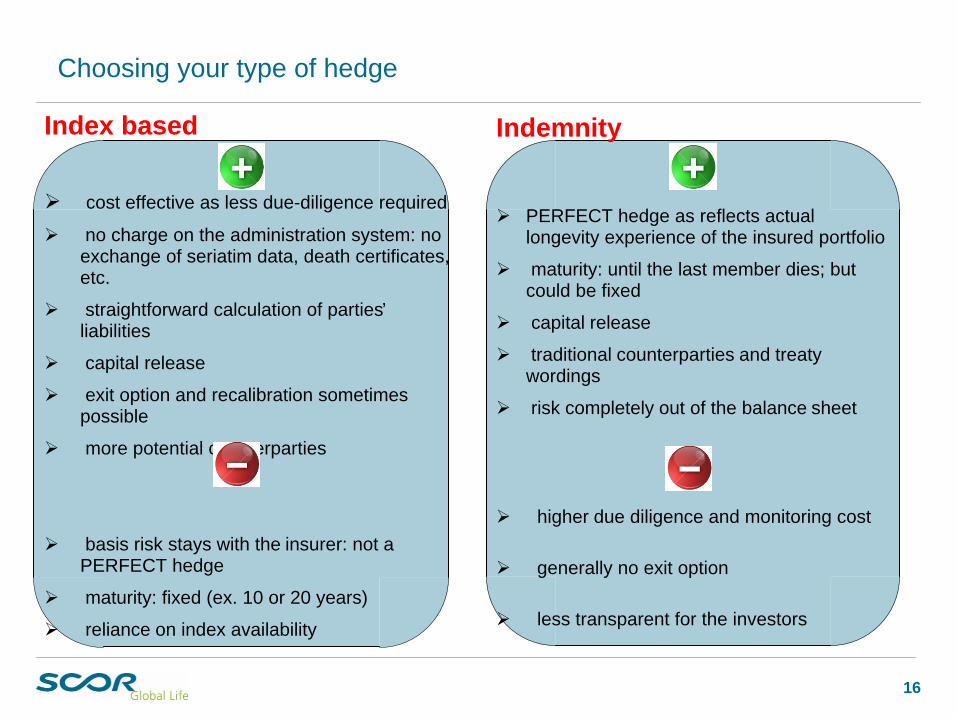
Choosing your type of hedge
16
Index based
cost effective as less due-diligence required
no charge on the administration system: no exchange of seriatim data, death certificates, etc.
straightforward calculation of parties’ liabilities
capital release
exit option and recalibration sometimes possible
more potential counterparties
basis risk stays with the insurer: not a PERFECT hedge
maturity: fixed (ex. 10 or 20 years)
reliance on index availability
Indemnity
PERFECT hedge as reflects actual longevity experience of the insured portfolio
maturity: until the last member dies; but could be fixed
capital release
traditional counterparties and treaty wordings
risk completely out of the balance sheet
higher due diligence and monitoring cost
generally no exit option
less transparent for the investors
17
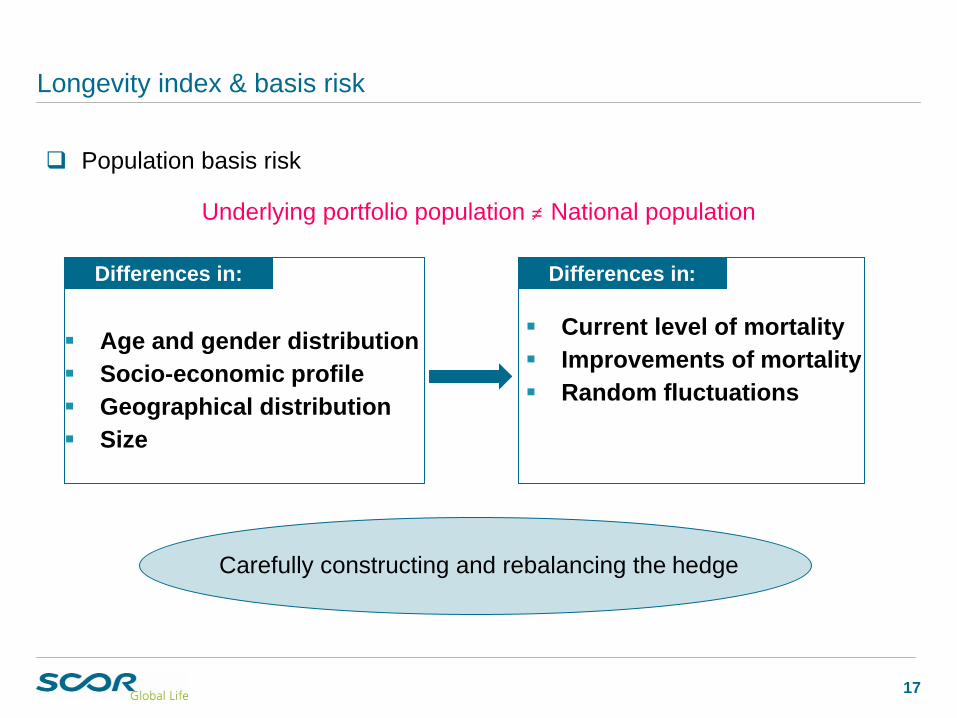
Longevity index & basis risk
Population basis risk
Underlying portfolio population ≠ National population
Differences in:
Age and gender distributionSocio-economic profileGeographical distributionSize
Differences in:
Current level of mortalityImprovements of mortalityRandom fluctuations
Carefully constructing and rebalancing the hedge
18
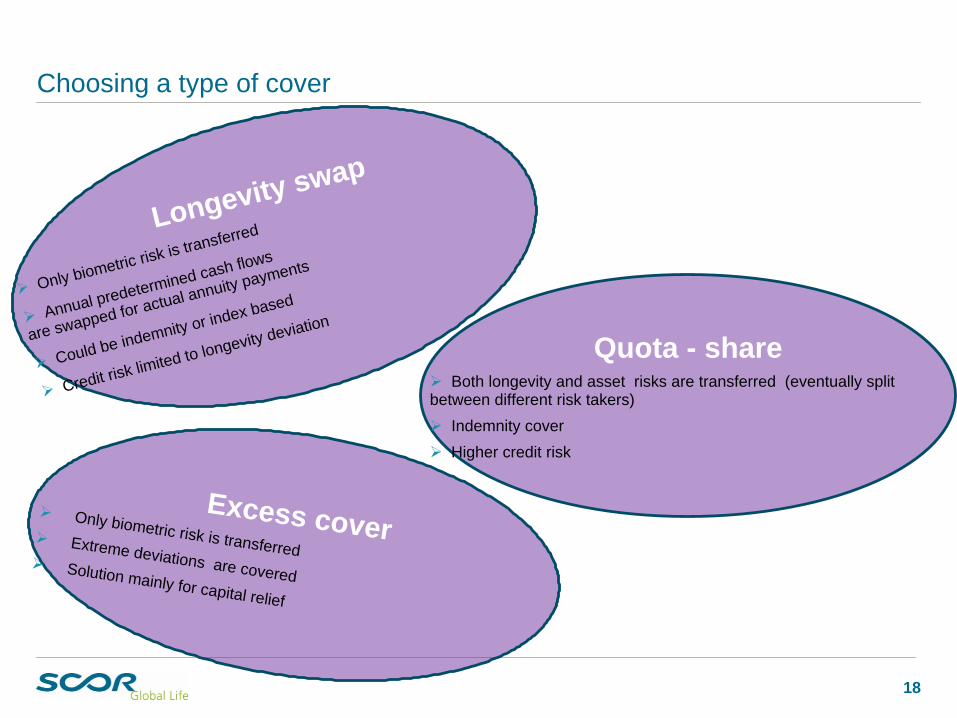
Choosing a type of cover
Quota - share Both longevity and asset risks are transferred (eventually split
between different risk takers) Indemnity cover
Higher credit risk
Longevity swap
Only biometric risk is transferred
Annual predetermined cash flows
are swapped for actual annuity payments
Could be indemnity or index based
Credit risk limited to longevity deviation
Excess cover Only biometric risk is transferred
Extreme deviations are covered
Solution mainly for capital relief
19
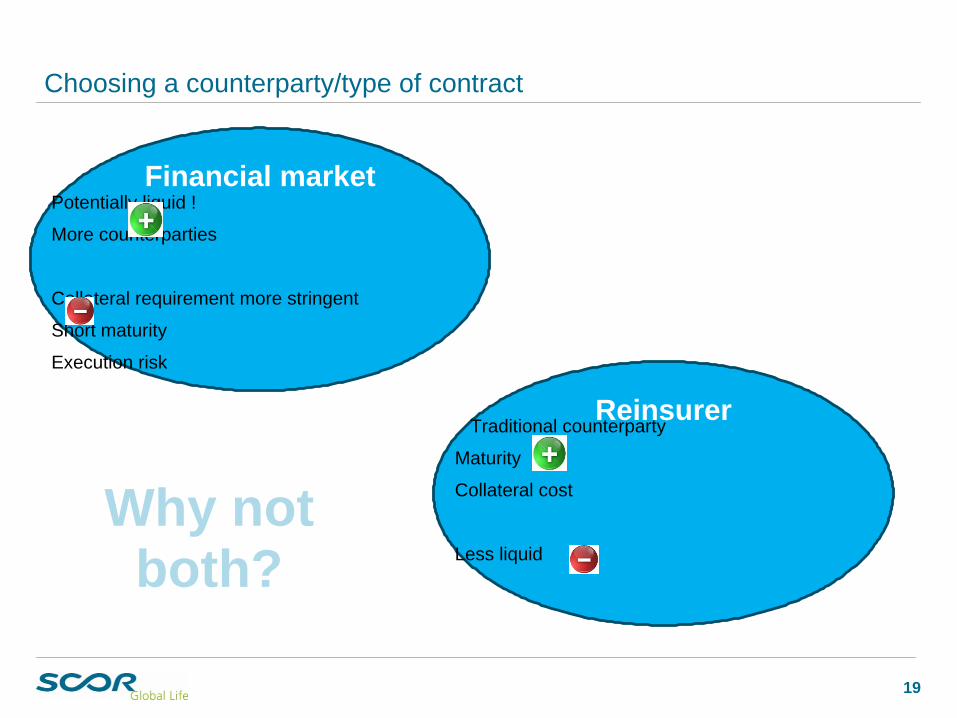
Choosing a counterparty/type of contract
Financial marketPotentially liquid !
More counterparties
Collateral requirement more stringent
Short maturity
Execution risk
Reinsurer Traditional counterparty
Maturity
Collateral cost
Less liquid
Why not both?

20
Plan
1 Longevity risk. Where reinsurance can help?
2 Ways to cover longevity risk: depending on your needs...
3 Reinsurance solutions: some examples and where the price come from.
21
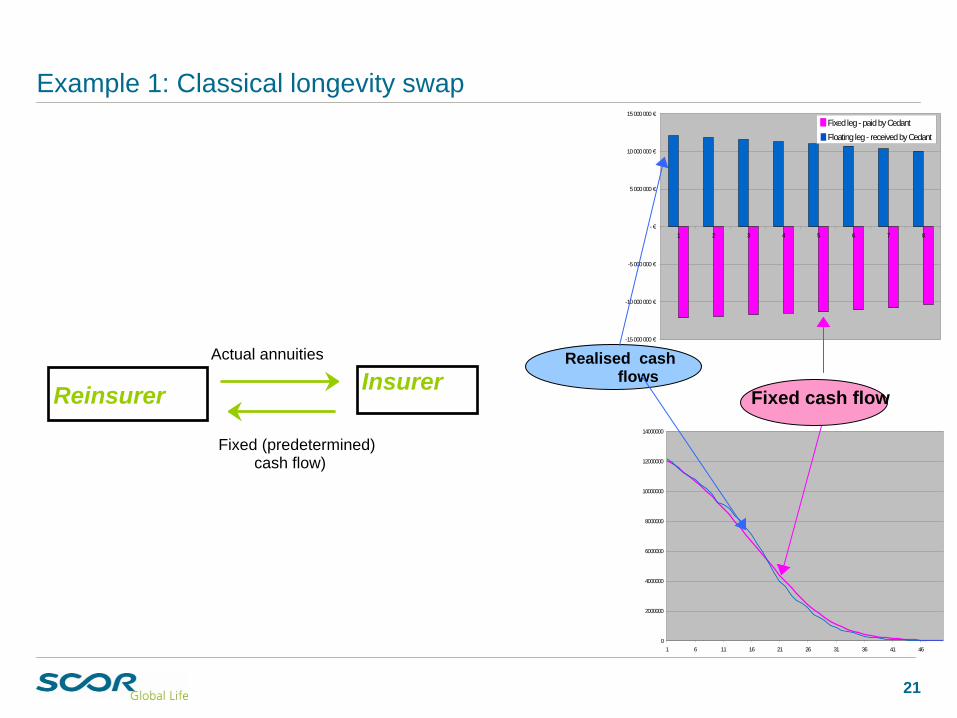
Example 1: Classical longevity swap
21
Actual annuities
Fixed (predetermined) cash flow)
InsurerReinsurer
0
2000000
4000000
6000000
8000000
10000000
12000000
14000000
1 6 11 16 21 26 31 36 41 46
-15 000 000 €
-10 000 000 €
-5 000 000 €
- €
5 000 000 €
10 000 000 €
15 000 000 €
1 2 3 4 5 6 7 8
Fixed leg - paid by CedantFloating leg - received by Cedant
Fixed cash flow
Realised cash flows
22
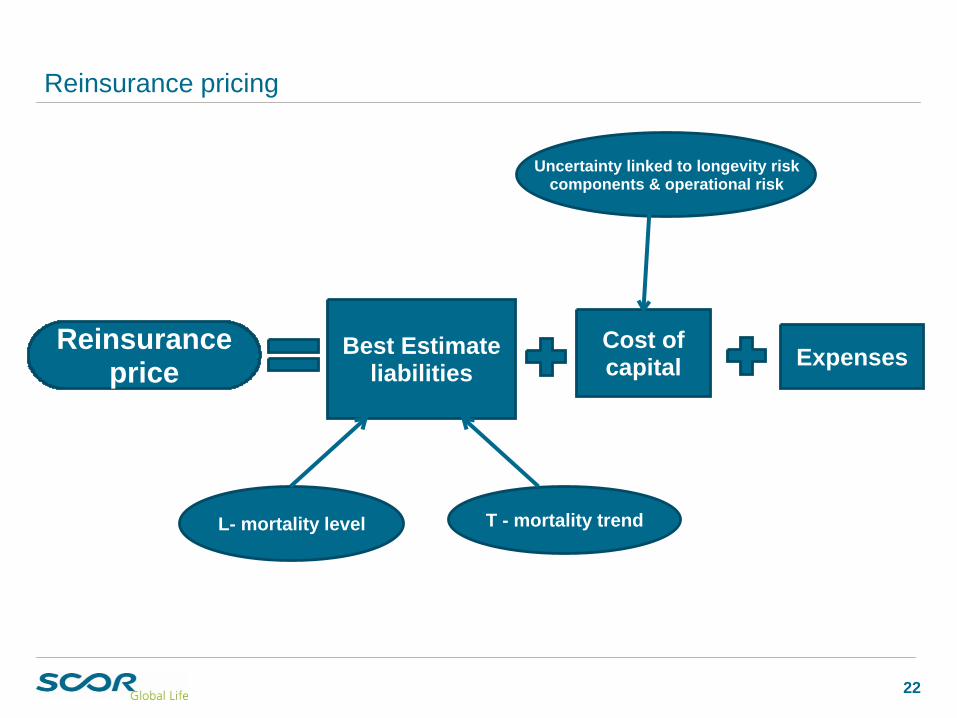
Reinsurance pricing
Reinsurance price
Best Estimate liabilities
Cost of capital Expenses
L- mortality level T - mortality trend
Uncertainty linked to longevity risk components & operational risk
23
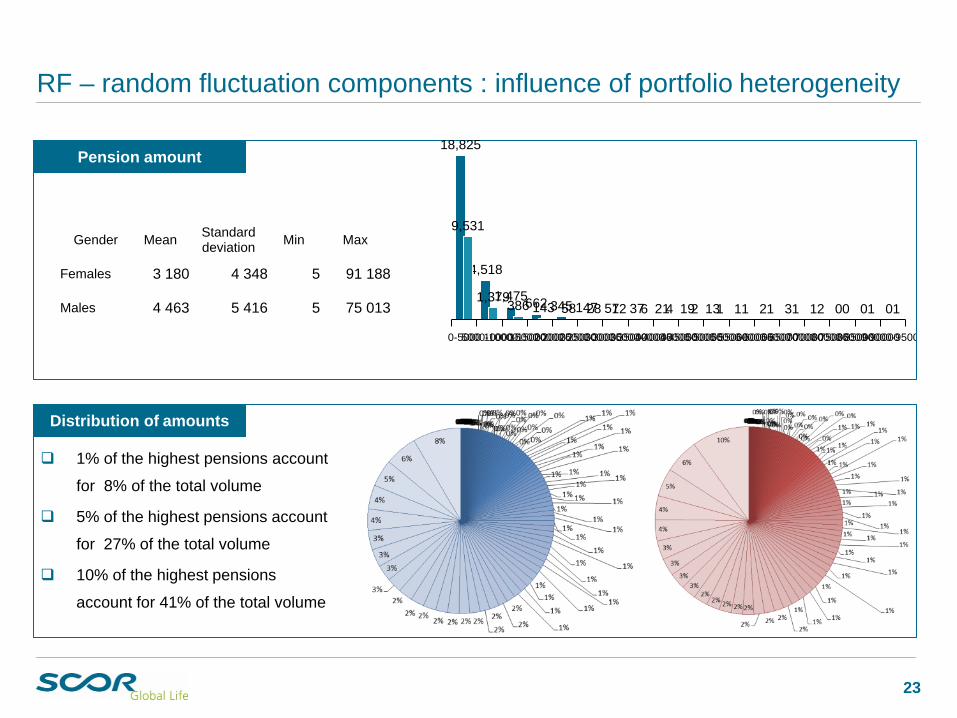
RF – random fluctuation components : influence of portfolio heterogeneity
Pension amount
Distribution of amounts
18,825
4,518
1,475662 345 147 57 37 21 19 13 1 2 3 1 0 0 0
9,531
1,379386 143 58 28 12 6 4 2 1 1 1 1 2 0 1 1
0-50005000-1000010000-1500015000-2000020000-2500025000-3000030000-3500035000-4000040000-4500045000-5000050000-5500055000-6000060000-6500065000-7000070000-7500080000-8500085000-9000090000-95000
Gender Mean Standard deviation Min Max
Females 3 180 4 348 5 91 188
Males 4 463 5 416 5 75 013
1% of the highest pensions account
for 8% of the total volume
5% of the highest pensions account
for 27% of the total volume
10% of the highest pensions
account for 41% of the total volume
24
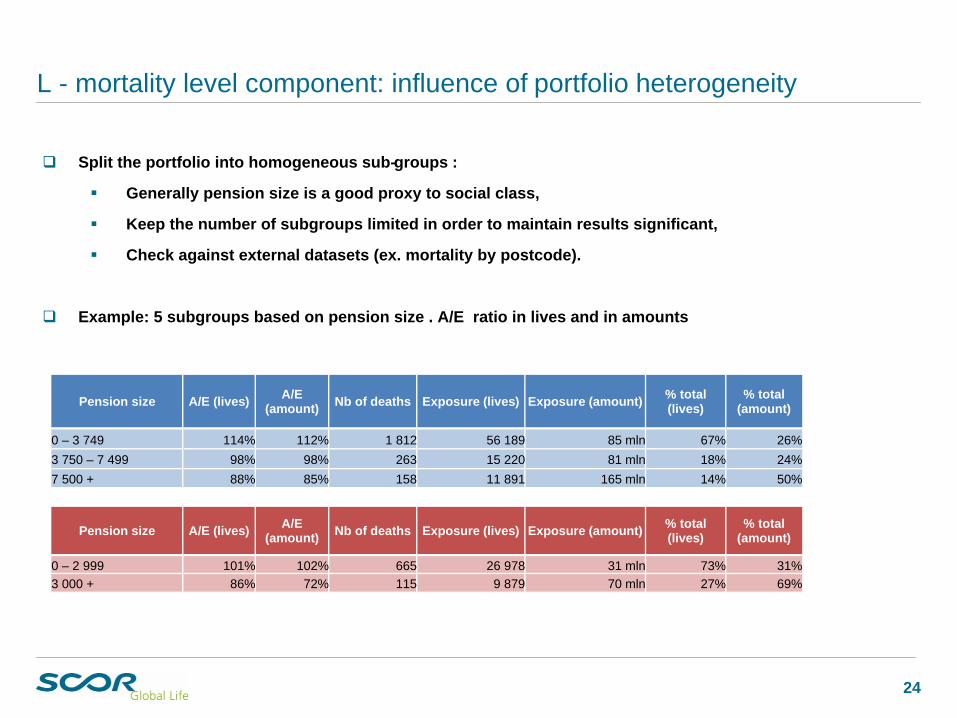
Split the portfolio into homogeneous sub-groups :
Generally pension size is a good proxy to social class,
Keep the number of subgroups limited in order to maintain results significant,
Check against external datasets (ex. mortality by postcode).
Example: 5 subgroups based on pension size . A/E ratio in lives and in amounts
L - mortality level component: influence of portfolio heterogeneity
Pension size A/E (lives) A/E (amount) Nb of deaths Exposure (lives) Exposure (amount) % total
(lives)% total
(amount)
0 – 3 749 114% 112% 1 812 56 189 85 mln 67% 26%3 750 – 7 499 98% 98% 263 15 220 81 mln 18% 24%7 500 + 88% 85% 158 11 891 165 mln 14% 50%
Pension size A/E (lives) A/E (amount) Nb of deaths Exposure (lives) Exposure (amount) % total
(lives)% total
(amount)
0 – 2 999 101% 102% 665 26 978 31 mln 73% 31%3 000 + 86% 72% 115 9 879 70 mln 27% 69%
25
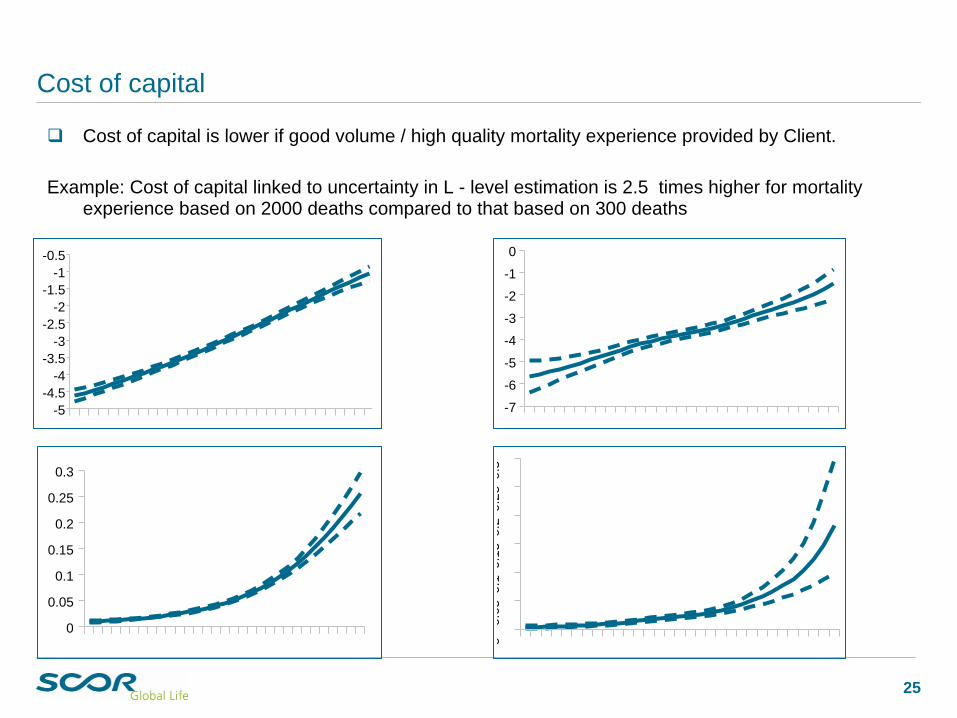
Cost of capital
Cost of capital is lower if good volume / high quality mortality experience provided by Client.
Example: Cost of capital linked to uncertainty in L - level estimation is 2.5 times higher for mortality experience based on 2000 deaths compared to that based on 300 deaths
-5-4.5
-4-3.5
-3-2.5
-2-1.5
-1-0.5
-7
-6
-5
-4
-3
-2
-1
0
00.
050.
10.
150.
20.
250.
3
0
0.05
0.1
0.15
0.2
0.25
0.3
26
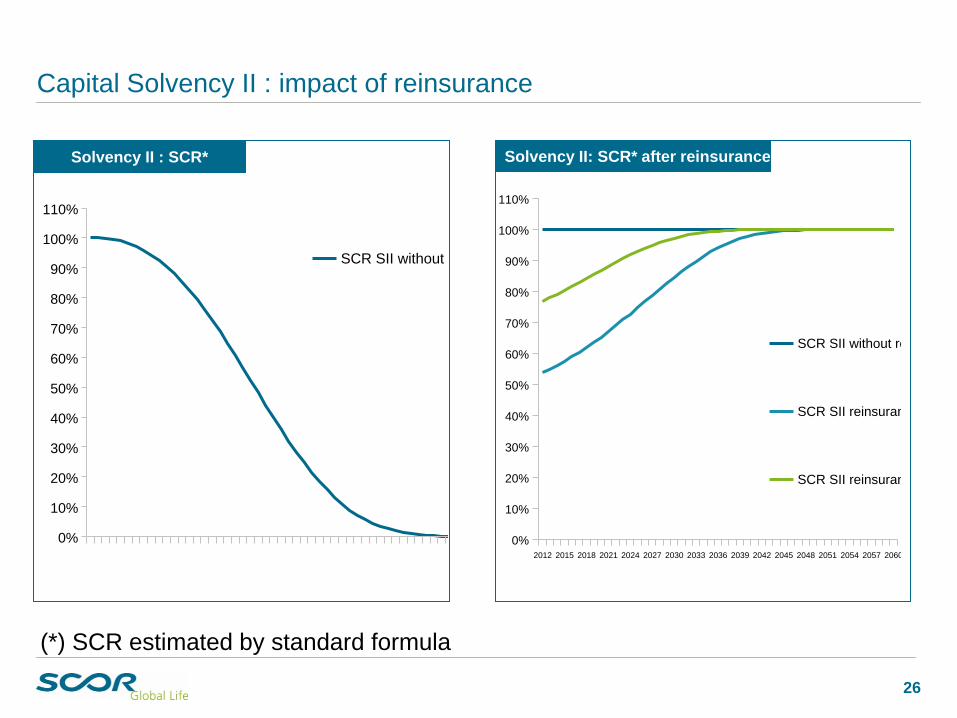
Capital Solvency II : impact of reinsurance
Solvency II : SCR* Solvency II: SCR* after reinsurance
(*) SCR estimated by standard formula
0%
10%
20%
30%
40%
50%
60%
70%
80%
90%
100%
110%
SCR SII without reinsurance
2012 2015 2018 2021 2024 2027 2030 2033 2036 2039 2042 2045 2048 2051 2054 2057 20600%
10%
20%
30%
40%
50%
60%
70%
80%
90%
100%
110%
SCR SII without reinsurance
SCR SII reinsurance 75+
SCR SII reinsurance 80+
27
Insurer’s obligations
In order to propose the best price through limiting the operational risk for the reinsurer : strict requirements on the administration (especially if insurer keeps a very small retention)
Certificates of existence and death certificatesFinancial penaltiesRight to auditList of data provided to SGL at outset and monthlyControl of paymentsTermination rights due to persistent administrative breaches.....
28
Example 2: Index based solution for capital optimisation
29
Example 2: Index based solution for capital optimisation
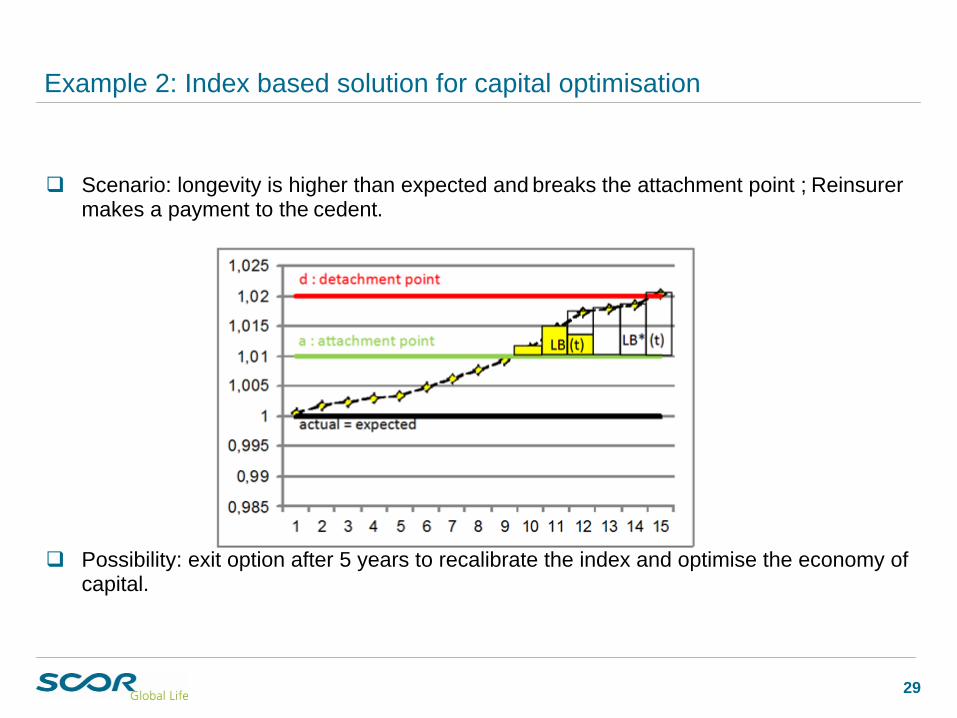
Scenario: longevity is higher than expected and breaks the attachment point ; Reinsurer makes a payment to the cedent.
Possibility: exit option after 5 years to recalibrate the index and optimise the economy of capital.
30
Example 3: Index-based solution for optimising capital through diversification
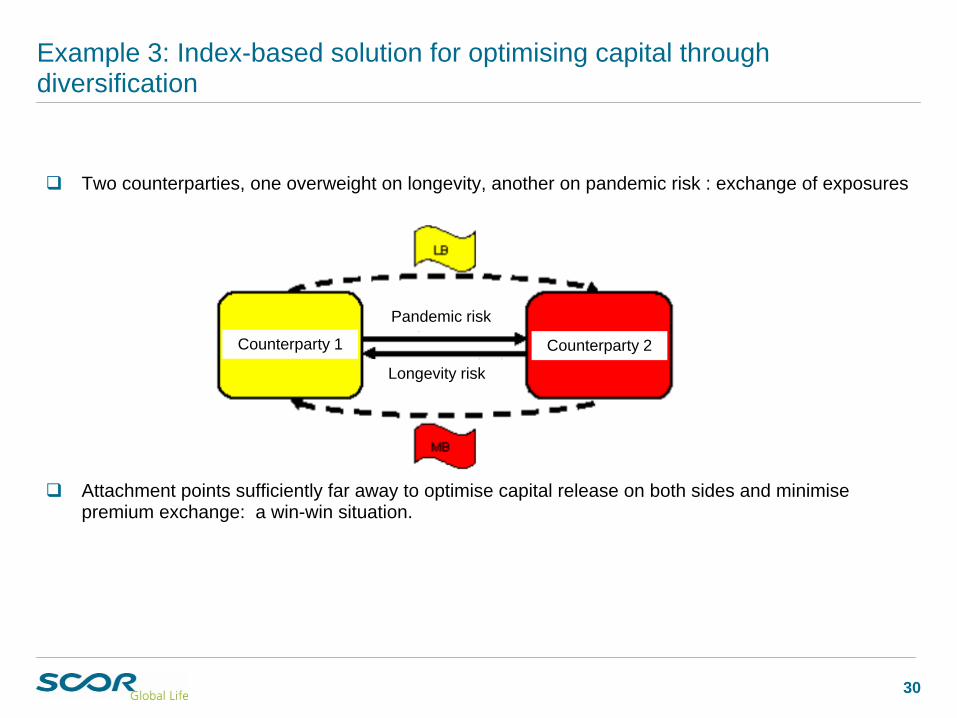
Two counterparties, one overweight on longevity, another on pandemic risk : exchange of exposures
Attachment points sufficiently far away to optimise capital release on both sides and minimise premium exchange: a win-win situation.
Pandemic risk
Longevity risk
Counterparty 2Counterparty 1
31
Scor Global Life added value
Solutions tailored to your specific requirements
Mortality analysis and forecasting
Advise on claims payment monitoring
High level expertise thanks to our R&D Centre on Longevity & Mortality
Insurance

32
Thank you for your attention !