reid c05 149-182hr.qxd 9/3/09 5:15 pm page 149 total...
TRANSCRIPT

149
Total QualityManagement
5Total QualityManagement
C H A P T E R
Defining Quality 150
Cost of Quality 153
The Evolution of Total Quality Management(TQM) 154
The Philosophy of TQM 159
Quality Awards and Standards 171
Why TQM Efforts Fail 174
Total Quality Management (TQM) within OM:How It All Fits Together 174
Total Quality Management (TQM) across theOrganization 175
WHAT’S IN FOR ME?OM
ACC FIN MKT OM HRM MIS
Before studying this chapter you should know or, if necessary, review
1. Trends in total quality management (TQM), Chapter 1, p. 15–16.
2. Quality as a competitive priority, Chapter 2, p. 38.
After studying this chapter you should be able to
Explain the meaning of total quality management (TQM).
Identify costs of quality.
Describe the evolution of TQM.
Identify key leaders in the field of quality and their contributions.
Identify features of the TQM philosophy.
Describe tools for identifying and solving quality problems.
Describe quality awards and quality certifications.7
6
5
4
3
2
1
LEARNING OBJECTIVES
CHAPTER OUTLINE
reid_c05_149-182hr.qxd 9/3/09 5:15 PM Page 149

150 • CHAPTER 5 TOTAL QUALITY MANAGEMENT
Everyone has had experiences of poor quality when
dealing with business organizations. These experiences
might involve an airline that has lost a passenger’s luggage,
a dry cleaner that has left clothes wrinkled or stained, poor
course offerings and scheduling at your college, a pur-
chased product that is damaged or broken, or a pizza de-
livery service that is often late or delivers the wrong order.
The experience of poor quality is exacerbated when em-
ployees of the company either are not empowered to cor-
rect quality inadequacies or do not seem willing to do so.
We have all encountered service employees who do not
seem to care. The consequences of such an attitude are lost
customers and opportunities for competitors to take ad-
vantage of the market need.
Successful companies understand the powerful impact customer-defined quality
can have on business. For this reason, many competitive firms continually increase
their quality standards. For example, Ford Motor Company’s focus on quality im-
provements has led to new levels of customer satisfaction with vehicle quality. Ford
focused on tightening already strict standards in their production process and imple-
menting a quality program called Six Sigma. This enabled Ford to be tied with Toyota
as the industry leader in 2009.
In this chapter you will learn that making quality a priority means putting cus-
tomer needs first. It means meeting and exceeding customer expectations by involving
everyone in the organization through an integrated effort. Total quality management(TQM) is an integrated organizational effort designed to improve quality at every
level. In this chapter you will learn about the philosophy of TQM, its impact on orga-
nizations, and its impact on your life. You will learn that TQM is about meeting qual-
ity expectations as defined by the customer; this is called customer-defined quality.
However, defining quality is not as easy as it may seem, because different people have
different ideas of what constitutes high quality. Let’s begin by looking at different ways
in which quality can be defined.
Jose Luis Pelaez Inc/GettyImages, Inc.
� Total quality management(TQM)An integrated effortdesigned to improve qualityperformance at every levelof the organization.
� Customer-defined qualityThe meaning of quality asdefined by the customer.
DEFINING QUALITYThe definition of quality depends on the point of view of the people defining it.Most consumers have a difficult time defining quality, but they know it when theysee it. For example, although you probably have an opinion as to which manufac-turer of athletic shoes provides the highest quality, it would probably be difficult foryou to define your quality standard in precise terms. Also, your friends may havedifferent opinions regarding which athletic shoes are of highest quality. The diffi-culty in defining quality exists regardless of product, and this is true for both manu-facturing and service organizations. Think about how difficult it may be to definequality for products such as airline services, child day-care facilities, college classes,or even OM textbooks. Further complicating the issue is that the meaning of qualityhas changed over time.
reid_c05_149-182hr.qxd 9/3/09 5:15 PM Page 150

Today, there is no single, universal definition of quality. Some people view quality as“performance to standards.” Others view it as “meeting the customer’s needs” or “satis-fying the customer.” Let’s look at some of the more common definitions of quality.
● Conformance to specifications measures how well the product or servicemeets the targets and tolerances determined by its designers. For example, thedimensions of a machine part may be specified by its design engineers as3 � 0.05 inches. This would mean that the target dimension is 3 inches, but thedimensions can vary between 2.95 and 3.05 inches. Similarly, the wait for hotelroom service may be specified as 20 minutes, but there may be an acceptabledelay of an additional 10 minutes. Also, consider the amount of light deliveredby a 60-watt light bulb. If the bulb delivers 50 watts, it does not conform tospecifications. As these examples illustrate, conformance to specification is di-rectly measurable, though it may not be directly related to the consumer’s ideaof quality.
● Fitness for use focuses on how well the product performs its intended functionor use. For example, a Mercedes-Benz and a Jeep Cherokee both meet a fitnessfor use definition if one considers transportation as the intended function.However, if the definition becomes more specific and assumes that the intendeduse is for transportation on mountain roads and carrying fishing gear, the JeepCherokee has a greater fitness for use. You can also see that fitness for use is auser-based definition in that it is intended to meet the needs of a specific usergroup.
● Value for price paid is a definition of quality that consumers often use for prod-uct or service usefulness. This is the only definition that combines economicswith consumer criteria; it assumes that the definition of quality is price sensitive.For example, suppose that you wish to sign up for a personal finance seminarand discover that the same class is being taught at two different colleges at signif-icantly different tuition rates. If you take the less expensive seminar, you will feelthat you have received greater value for the price.
● Support services provided are often how the quality of a product or service isjudged. Quality does not apply only to the product or service itself; it also ap-plies to the people, processes, and organizational environment associated withit. For example, the quality of a university is judged not only by the quality ofstaff and course offerings but also by the efficiency and accuracy of processingpaperwork.
● Psychological criteria is a subjective definition that focuses on the judgmentalevaluation of what constitutes product or service quality. Different factors con-tribute to the evaluation, such as the atmosphere of the environment or the per-ceived prestige of the product. For example, a hospital patient may receive averagehealthcare, but a very friendly staff may leave the impression of high quality. Simi-larly, we commonly associate certain products with excellence because of theirreputation; Rolex watches and Mercedes-Benz automobiles are examples.
Differences between Manufacturing and Service OrganizationsDefining quality in manufacturing organizations is often different than it is for serviceorganizations. Manufacturing organizations produce a tangible product that can beseen, touched, and directly measured. Examples include cars, CD players, clothes,computers, and food items. Therefore, quality definitions in manufacturing usuallyfocus on tangible product features.
DEFINING QUALITY • 151
� Conformance tospecificationsHow well a product orservice meets the targets andtolerances determined by itsdesigners.
� Fitness for useA definition of quality thatevaluates how well theproduct performs for itsintended use.
� Value for price paidQuality defined in terms ofproduct or service usefulnessfor the price paid.
� Support servicesQuality defined in terms ofthe support provided afterthe product or service ispurchased.
� Psychological criteriaA way of defining qualitythat focuses on judgmentalevaluations of whatconstitutes product orservice excellence.
reid_c05_149-182hr.qxd 9/3/09 5:15 PM Page 151

152 • CHAPTER 5 TOTAL QUALITY MANAGEMENT
The most common quality definition in manufacturing is conformance, which isthe degree to which a product characteristic meets preset standards. Other commondefinitions of quality in manufacturing include performance, such as acceleration of avehicle; reliability, meaning that the product will function as expected without failure;features, the extras that are included beyond the basic characteristics; durability, theexpected operational life of the product; and serviceability, how readily a product canbe repaired. The relative importance of these definitions is based on the preferences ofeach individual customer. It is easy to see how different customers can have differentdefinitions in mind when they speak of high product quality.
In contrast to manufacturing, service organizations produce a product that is in-tangible. Usually, the complete product cannot be seen or touched. Rather, it is experi-enced. Examples include delivery of healthcare, the experience of staying at a vacationresort, and learning at a university. The intangible nature of the product makes defin-ing quality difficult. Also, since a service is experienced, perceptions can be highly sub-jective. In addition to tangible factors, quality of services is often defined by perceptualfactors. These include responsiveness to customer needs, courtesy and friendliness ofstaff, promptness in resolving complaints, and atmosphere. Other definitions of qualityin services include time, the amount of time a customer has to wait for the service; andconsistency, the degree to which the service is the same each time. For these reasons,defining quality in services can be especially challenging. Dimensions of quality formanufacturing versus service organizations are shown in Table 5-1.
Today’s customers demand andexpect high quality. Companiesthat do not make quality a pri-ority risk long-run survival.World-class organizations suchas General Electric and Mo-torola attribute their success tohaving one of the best qualitymanagement programs in theworld. These companies weresome of the first to implementa quality program called Six
Sigma, where the level of defects is reduced to approximately 3.4 parts per million. Toachieve this level, everyone in the company is trained in quality. For example, individ-uals highly trained in quality improvement principles and techniques receive a desig-nation called “Black Belt.” The full-time job of Black Belts is to identify and solvequality problems. In fact, Motorola was one of the first companies to win the presti-
Dimensions of Qualityfor Manufacturing versusService Organizations
TABLE 5-1
Phot
oDis
c, I
nc./
Gett
y Im
ages
LINKS TO PRACTICE
General ElectricCompany
www.ge.com
Motorola, Inc.www.motorola.com
reid_c05_149-182hr.qxd 9/3/09 5:15 PM Page 152
gious Malcolm Baldrige National Quality Award in 1988 due to its high focus on qual-ity. Both GE and Motorola have had a primary goal of achieving total customer satis-faction. To this end, the efforts of these organizations have included eliminatingalmost all defects from products, processes, and transactions. Both companies con-sider quality to be the critical factor that has resulted in significant increases in salesand market share, as well as cost savings in the range of millions of dollars.
COST OF QUALITY • 153
COST OF QUALITY
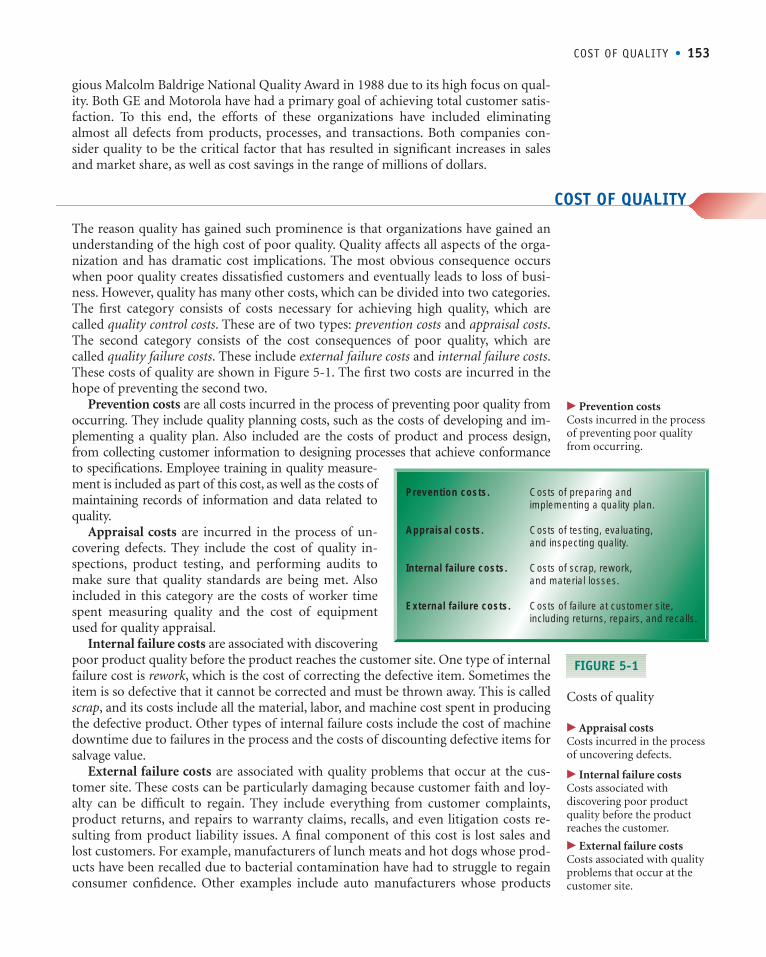
The reason quality has gained such prominence is that organizations have gained anunderstanding of the high cost of poor quality. Quality affects all aspects of the orga-nization and has dramatic cost implications. The most obvious consequence occurswhen poor quality creates dissatisfied customers and eventually leads to loss of busi-ness. However, quality has many other costs, which can be divided into two categories.The first category consists of costs necessary for achieving high quality, which arecalled quality control costs. These are of two types: prevention costs and appraisal costs.The second category consists of the cost consequences of poor quality, which arecalled quality failure costs. These include external failure costs and internal failure costs.These costs of quality are shown in Figure 5-1. The first two costs are incurred in thehope of preventing the second two.
Prevention costs are all costs incurred in the process of preventing poor quality fromoccurring. They include quality planning costs, such as the costs of developing and im-plementing a quality plan. Also included are the costs of product and process design,from collecting customer information to designing processes that achieve conformanceto specifications. Employee training in quality measure-ment is included as part of this cost, as well as the costs ofmaintaining records of information and data related toquality.
Appraisal costs are incurred in the process of un-covering defects. They include the cost of quality in-spections, product testing, and performing audits tomake sure that quality standards are being met. Alsoincluded in this category are the costs of worker timespent measuring quality and the cost of equipmentused for quality appraisal.
Internal failure costs are associated with discoveringpoor product quality before the product reaches the customer site. One type of internalfailure cost is rework, which is the cost of correcting the defective item. Sometimes theitem is so defective that it cannot be corrected and must be thrown away. This is calledscrap, and its costs include all the material, labor, and machine cost spent in producingthe defective product. Other types of internal failure costs include the cost of machinedowntime due to failures in the process and the costs of discounting defective items forsalvage value.
External failure costs are associated with quality problems that occur at the cus-tomer site. These costs can be particularly damaging because customer faith and loy-alty can be difficult to regain. They include everything from customer complaints,product returns, and repairs to warranty claims, recalls, and even litigation costs re-sulting from product liability issues. A final component of this cost is lost sales andlost customers. For example, manufacturers of lunch meats and hot dogs whose prod-ucts have been recalled due to bacterial contamination have had to struggle to regainconsumer confidence. Other examples include auto manufacturers whose products
Costs of quality
FIGURE 5-1
Prevention costs. Costs of preparing and implementing a quality plan.
Appraisal costs. Costs of testing, evaluating, and inspecting quality.
Internal failure costs. Costs of scrap, rework, and material losses.
External failure costs. Costs of failure at customer site, including returns, repairs, and recalls.
� Prevention costsCosts incurred in the processof preventing poor qualityfrom occurring.
� Appraisal costsCosts incurred in the processof uncovering defects.
� Internal failure costsCosts associated withdiscovering poor productquality before the productreaches the customer.
� External failure costsCosts associated with qualityproblems that occur at thecustomer site.
reid_c05_149-182hr.qxd 9/3/09 5:15 PM Page 153

154 • CHAPTER 5 TOTAL QUALITY MANAGEMENT
Cost of defects
FIGURE 5-2
have been recalled due to major malfunctions such as problematic braking systemsand airlines that have experienced a crash with many fatalities. External failure cansometimes put a company out of business almost overnight.
Companies that consider quality important invest heavily in prevention and ap-praisal costs in order to prevent internal and external failure costs. The earlier defectsare found, the less costly they are to correct. For example, detecting and correcting de-fects during product design and product production is considerably less expensivethan when the defects are found at the customer site. This is shown in Figure 5-2.
External failure costs tend to be particularly high for service organizations. The rea-son is that with a service the customer spends much time in the service delivery system,and there are fewer opportunities to correct defects than there are in manufacturing.Examples of external failure in services include overbooking airline flights, long delaysin airline service, and lost luggage.
Location of Defect
Cos
t of D
efec
t
ProductDesign
ProductProduction
CustomerSite
THE EVOLUTION OF TOTAL QUALITY MANAGEMENT (TQM)The concept of quality has existed for many years, though its meaning has changedand evolved over time. In the early twentieth century, quality management meant in-specting products to ensure that they met specifications. In the 1940s, during WorldWar II, quality became more statistical in nature. Statistical sampling techniques wereused to evaluate quality, and quality control charts were used to monitor the produc-tion process. In the 1960s, with the help of so-called quality gurus, the concept tookon a broader meaning. Quality began to be viewed as something that encompassedthe entire organization, not only the production process. Since all functions were re-sponsible for product quality and all shared the costs of poor quality, quality was seenas a concept that affected the entire organization.
The meaning of quality for businesses changed dramatically in the late 1970s. Be-fore then quality was still viewed as something that needed to be inspected and cor-rected. However, in the 1970s and 1980s, many U.S. industries lost market share toforeign competition. In the auto industry, manufacturers such as Toyota and Hondabecame major players. In the consumer goods market, companies such as Toshiba andSony led the way. These foreign competitors were producing lower-priced productswith considerably higher quality.
FINMKT ACC
reid_c05_149-182hr.qxd 9/3/09 5:15 PM Page 154

To survive, companies had to make major changes in their quality programs. Manyhired consultants and instituted quality training programs for their employees. A newconcept of quality was emerging. One result was that quality began to have a strategicmeaning. Today, successful companies understand that quality provides a competitiveadvantage. They put the customer first and define quality as meeting or exceeding cus-tomer expectations.
Since the 1970s, competition based on quality has grown in importance and hasgenerated tremendous interest, concern, and enthusiasm. Companies in every line ofbusiness are focusing on improving quality in order to be more competitive. In manyindustries quality excellence has become a standard for doing business. Companiesthat do not meet this standard simply will not survive. As you will see later in thechapter, the importance of quality is demonstrated by national quality awards andquality certifications that are coveted by businesses.
The term used for today’s new concept of quality is total quality management orTQM. Figure 5-3 presents a time line of the old and new concepts of quality. You can seethat the old concept is reactive, designed to correct quality problems after they occur.The new concept is proactive, designed to build quality into the product and process de-sign. Next, we look at the individuals who have shaped our understanding of quality.
Quality GurusTo fully understand the TQM movement, we need to look at the philosophies of no-table individuals who have shaped the evolution of TQM. Their philosophies andteachings have contributed to our knowledge and understanding of quality today.Table 5-2 summarizes their individual contributions.
Walter A. Shewhart Walter A. Shewhart was a statistician at Bell Labs during the1920s and 1930s. Shewhart studied randomness and recognized that variability existedin all manufacturing processes. He developed quality control charts that are used toidentify whether the variability in the process is random or due to an assignable cause,such as poor workers or miscalibrated machinery. He stressed that eliminating vari-ability improves quality. His work created the foundation for today’s statistical processcontrol, and he is often referred to as the “grandfather of quality control.”
W. Edwards Deming W. Edwards Deming is often referred to as the “father of qual-ity control.” He was a statistics professor at New York University in the 1940s. AfterWorld War II, he assisted many Japanese companies in improving quality. The Japan-ese regarded him so highly that in 1951 they established the Deming Prize, an annualaward given to firms that demonstrate outstanding quality. It was almost 30 years be-fore American businesses began adopting Deming’s philosophy.
Time line showing thedifferences between oldand new concepts ofquality
FIGURE 5-3
THE EVOLUTION OF TOTAL QUALITY MANAGEMENT (TQM) • 155
TIME:Early1900s 1940s 1960s 1980s and Beyond
FOCUS: Inspection Statisticalsampling
Organizationalquality focus
Customer-driven quality
Old Concept of Quality:Inspect for quality after production.
New Concept of Quality:Build quality into the process.Identify and correct causes of
quality problems.
reid_c05_149-182hr.qxd 9/3/09 5:15 PM Page 155

A number of elements of Deming’s philosophy depart from traditional notions ofquality. The first is the role management should play in a company’s qualityimprovement effort. Historically, poor quality was blamed on workers—on their lackof productivity, laziness, or carelessness. However, Deming pointed out that only 15percent of quality problems are actually due to worker error. The remaining 85 percentare caused by processes and systems, including poor management. Deming said that itis up to management to correct system problems and create an environment that pro-motes quality and enables workers to achieve their full potential. He believed that man-agers should drive out any fear employees have of identifying quality problems and thatnumerical quotas should be eliminated. Proper methods should be taught, and detect-ing and eliminating poor quality should be everyone’s responsibility.
Deming outlined his philosophy on quality in his famous “14 Points.” These pointsare principles that help guide companies in achieving quality improvement. The prin-ciples are founded on the idea that upper management must develop a commitmentto quality and provide a system to support this commitment that involves all employ-ees and suppliers. Deming stressed that quality improvements cannot happen withoutthe organizational change that comes from upper management.
Joseph M. Juran After W. Edwards Deming, Dr. Joseph M. Juran is considered tohave had the greatest impact on quality management. Juran originally worked in thequality program at Western Electric, a former equipment division of AT&T. He be-came better known in 1951 after the publication of his book Quality Control Hand-book. In 1954, he went to Japan to work with manufacturers and teach classes onquality. Though his philosophy is similar to Deming’s, there are some differences.Whereas Deming stressed the need for an organizational “transformation,” Juran be-lieved that implementing quality initiatives should not require such a dramatic changeand that quality management should be embedded in the organization.
One of Juran’s significant contributions was his focus on the definition of qualityand the cost of quality. Juran is credited with defining quality as fitness for use rather
156 • CHAPTER 5 TOTAL QUALITY MANAGEMENT
Quality Gurus and TheirContributions
TABLE 5-2
reid_c05_149-182hr.qxd 9/3/09 5:15 PM Page 156

than simply conformance to specifications. As we have learned in this chapter, defin-ing quality as fitness for use takes into account customer intentions for use of theproduct, instead of focusing only on technical specifications. Juran is also creditedwith developing the concept of cost of quality, which allows us to measure quality indollar terms rather than on the basis of subjective evaluations.
Juran is well known for originating the idea of the quality trilogy: quality planning,quality control, and quality improvement. The first part of the trilogy, quality plan-ning, is necessary so that companies identify their customers, product requirements,and overriding business goals. Processes should be set up to ensure that the qualitystandards can be met. The second part of the trilogy, quality control, stresses the regu-lar use of statistical control methods to ensure that quality standards are met and toidentify variations from the standards. The third part of the quality trilogy is qualityimprovement. According to Juran, quality improvements should not be justbreakthroughs, but continuous as well. Together with Deming, Juran stressed that toimplement continuous improvement, workers need to have training in proper meth-ods on a regular basis.
Armand V. Feigenbaum Another quality leader is Armand V. Feigenbaum, who in-troduced the concept of total quality control. In his 1961 book Total Quality Control, heoutlined his quality principles in 40 steps. Feigenbaum took a total system approach toquality. He promoted the idea of a work environment where quality developments areintegrated throughout the entire organization, where management and employees havea total commitment to improve quality, and where people learn from each other’s suc-cesses. This philosophy was adapted by the Japanese and termed “company-wide qual-ity control.”
Philip B. Crosby Philip B. Crosby is another recognized guru of TQM. He workedin the area of quality for many years, first at Martin Marietta and then, in the 1970s, asthe vice president for quality at ITT. He developed the phrase “Do it right the firsttime” and the notion of zero defects, arguing that no amount of defects should be con-sidered acceptable. He scorned the idea that a small number of defects is a normalpart of the operating process because systems and workers are imperfect. Instead, hestressed the idea of prevention.
To promote his concepts, Crosby wrote a book titled Quality Is Free, which waspublished in 1979. He became famous for coining the phrase “quality is free” andfor pointing out the many costs of quality, which include not only the costs ofwasted labor, equipment time, scrap, rework, and lost sales but also organizationalcosts that are hard to quantify. Crosby stressed that efforts to improve quality morethan pay for themselves because these costs are prevented. Therefore, quality isfree. Like Deming and Juran, Crosby stressed the role of management in the qualityimprovement effort and the use of statistical control tools in measuring and moni-toring quality.
Kaoru Ishikawa Kaoru Ishikawa is best known for the development of quality toolscalled cause-and-effect diagrams, also called fishbone or Ishikawa diagrams. These di-agrams are used for quality problem solving, and we will look at them in detail later inthe chapter. He was the first quality guru to emphasize the importance of the “internalcustomer,” the next person in the production process. He was also one of the first tostress the importance of total company quality control, rather than just focusing onproducts and services.
Dr. Ishikawa believed that everyone in the company needed to be united with ashared vision and a common goal. He stressed that quality initiatives should be
THE EVOLUTION OF TOTAL QUALITY MANAGEMENT (TQM) • 157
reid_c05_149-182hr.qxd 9/3/09 5:15 PM Page 157

pursued at every level of the organization and that all employees should be involved.Dr. Ishikawa was a proponent of implementation of quality circles, which are smallteams of employees who volunteer to solve quality problems.
Genichi Taguchi Dr. Genichi Taguchi is a Japanese quality expert known for his workin the area of product design. He estimates that as much as 80 percent of all defectiveitems are caused by poor product design. Taguchi stresses that companies should focustheir quality efforts on the design stage, as it is much cheaper and easier to makechanges during the product design stage than later during the production process.
Taguchi is known for applying a concept called design of experiment to product de-sign. This method is an engineering approach based on developing robust design, adesign that results in products that can perform over a wide range of conditions. Theidea is that it is easier to design a product that can perform over a wide range of envi-ronmental conditions than it is to control the environmental conditions.
Taguchi has also had a large impact on today’s view of the costs of quality. Hepointed out that the traditional view of costs of conformance to specifications isincorrect and proposed a different way to look at these costs. Let’s briefly look atDr. Taguchi’s view of quality costs.
Recall that conformance to specification specifies a target value for the productwith specified tolerances, say 5.00 � 0.20. According to the traditional view of confor-mance to specifications, losses in terms of cost occur if the product dimensions falloutside of the specified limits. This is shown in Figure 5-4. However, Dr. Taguchinoted that from the customer’s view there is little difference whether a product fallsjust outside or just inside the control limits. He pointed out that there is a muchgreater difference in the quality of the product between making the target and beingnear the control limit. He also stated that the smaller the variation around the target,the better the quality. Based on this, he proposed the following: as conformance valuesmove away from the target, loss increases as a quadratic function. The Taguchi lossfunction is shown in Figure 5-5. According to the function, smaller differences fromthe target result in smaller costs: the larger the differences, the larger the cost. TheTaguchi loss function has had a significant impact on changing views of quality cost.
158 • CHAPTER 5 TOTAL QUALITY MANAGEMENT
Target5.00
tolerances
Cost
0.480 0.520
Loss LossNo Loss
Target5.00
tolerances
0.480 0.520
Loss Loss
Traditional view of the cost ofnonconformance
FIGURE 5-4
Taguchi view of the cost ofnonconformance—the Taguchi loss function
FIGURE 5-5
� Robust designA design that results in aproduct that can performover a wide range ofconditions.
� Taguchi loss functionCosts of quality increase as aquadratic function asconformance values moveaway from the target.
reid_c05_149-182hr.qxd 9/3/09 5:15 PM Page 158

THE PHILOSOPHY OF TQM
THE PHILOSOPHY OF TQM • 159
What characterizes TQM is the focus on identifying root causes of quality problemsand correcting them at the source, as opposed to inspecting the product after it hasbeen made. Not only does TQM encompass the entire organization but it stresses thatquality is customer driven. TQM attempts to embed quality in every aspect of the or-ganization. It is concerned with the technical aspects of quality as well as the involve-ment of people in quality, such as customers, company employees, and suppliers. Herewe look at the specific concepts that make up the philosophy of TQM. These conceptsand their main ideas are summarized in Table 5-3.
Customer FocusThe first, and overriding, feature of TQM is the company’s focus on its customers.Quality is defined as meeting or exceeding customer expectations. The goal is tofirst identify and then meet customer needs. TQM recognizes that a perfectly pro-duced product has little value if it is not what the customer wants. Therefore, we cansay that quality is customer driven. However, it is not always easy to determine whatthe customer wants because tastes and preferences change. Also, customer expecta-tions often vary from one customer to the next. For example, in the auto industrytrends change relatively quickly, from small cars to sports utility vehicles and backto small cars. The same is true in the retail industry, where styles and fashion areshort-lived. Companies need to continually gather information by means of focusgroups, market surveys, and customer interviews in order to stay in tune with whatcustomers want. They must always remember that they would not be in business ifit were not for their customers.
Continuous ImprovementAnother concept of the TQM philosophy is the focus on continuous improvement.Traditional systems operated on the assumption that once a company achieved a cer-tain level of quality, it was successful and needed to make no further improvements.
Concepts of the TQMPhilosophy
TABLE 5-3
� Continuous improvement A philosophy of never-endingimprovement.
MKT HRM
reid_c05_149-182hr.qxd 9/3/09 5:15 PM Page 159

We tend to think of improvement in terms of plateaus that are to be achieved, such aspassing a certification test or reducing the number of defects to a certain level. Tradi-tionally, for American managers change involves large magnitudes, such as major or-ganizational restructuring. The Japanese, on the other hand, believe that the best andmost lasting changes come from gradual improvements. To use an analogy, they be-lieve that it is better to take frequent small doses of medicine than to take one largedose. Continuous improvement, called kaizen by the Japanese, requires that the com-pany continually strive to be better through learning and problem solving. Because wecan never achieve perfection, we must always evaluate our performance and take mea-sures to improve it.
Now let’s look at two approaches that can help companies with continuous improve-ment: the plan–do–study–act (PDSA) cycle and benchmarking.
The Plan–Do–Study–Act Cycle The plan–do–study–act (PDSA) cycle describesthe activities a company needs to perform in order to incorporate continuous im-provement in its operation. This cycle, shown in Figure 5-6, is also referred to as theShewhart cycle or the Deming wheel. The circular nature of this cycle shows that con-tinuous improvement is a never-ending process. Let’s look at the specific steps in thecycle.
● Plan The first step in the PDSA cycle is to plan. Managers must evaluate thecurrent process and make plans based on any problems they find. They need todocument all current procedures, collect data, and identify problems. This infor-mation should then be studied and used to develop a plan for improvement aswell as specific measures to evaluate performance.
● Do The next step in the cycle is implementing the plan (do). During the imple-mentation process managers should document all changes made and collect datafor evaluation.
● Study The third step is to study the data collected in the previous phase. Thedata are evaluated to see whether the plan is achieving the goals established in theplan phase.
● Act The last phase of the cycle is to act on the basis of the results of the firstthree phases. The best way to accomplish this is to communicate the results toother members of the company and then implement the new procedure if it hasbeen successful. Note that this is a cycle; the next step is to plan again. After wehave acted, we need to continue evaluating the process, planning, and repeatingthe cycle again.
160 • CHAPTER 5 TOTAL QUALITY MANAGEMENT
Plan
Study
Act Do
The plan–do–study–act cycle
FIGURE 5-6
� Plan–do–study–act(PDSA) cycleA diagram that describes theactivities that need to beperformed to incorporatecontinuous improvementinto the operation.
� KaizenA Japanese term thatdescribes the notion of acompany continually strivingto be better through learningand problem solving.
reid_c05_149-182hr.qxd 9/3/09 5:15 PM Page 160
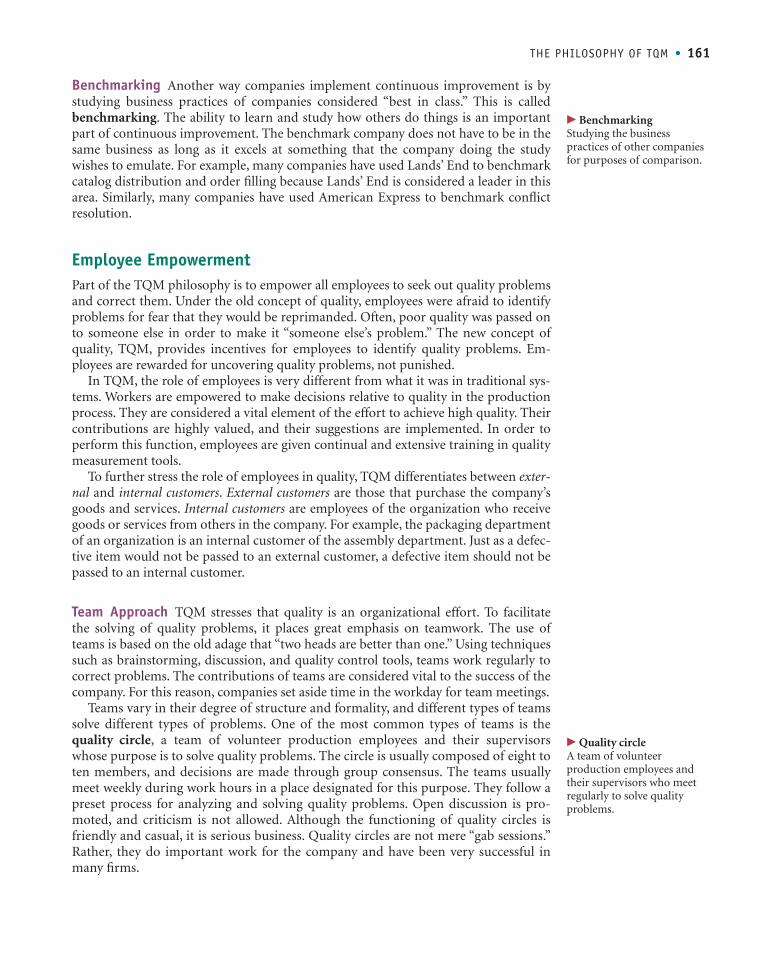
Benchmarking Another way companies implement continuous improvement is bystudying business practices of companies considered “best in class.” This is calledbenchmarking. The ability to learn and study how others do things is an importantpart of continuous improvement. The benchmark company does not have to be in thesame business as long as it excels at something that the company doing the studywishes to emulate. For example, many companies have used Lands’ End to benchmarkcatalog distribution and order filling because Lands’ End is considered a leader in thisarea. Similarly, many companies have used American Express to benchmark conflictresolution.
Employee EmpowermentPart of the TQM philosophy is to empower all employees to seek out quality problemsand correct them. Under the old concept of quality, employees were afraid to identifyproblems for fear that they would be reprimanded. Often, poor quality was passed onto someone else in order to make it “someone else’s problem.” The new concept ofquality, TQM, provides incentives for employees to identify quality problems. Em-ployees are rewarded for uncovering quality problems, not punished.
In TQM, the role of employees is very different from what it was in traditional sys-tems. Workers are empowered to make decisions relative to quality in the productionprocess. They are considered a vital element of the effort to achieve high quality. Theircontributions are highly valued, and their suggestions are implemented. In order toperform this function, employees are given continual and extensive training in qualitymeasurement tools.
To further stress the role of employees in quality, TQM differentiates between exter-nal and internal customers. External customers are those that purchase the company’sgoods and services. Internal customers are employees of the organization who receivegoods or services from others in the company. For example, the packaging departmentof an organization is an internal customer of the assembly department. Just as a defec-tive item would not be passed to an external customer, a defective item should not bepassed to an internal customer.
Team Approach TQM stresses that quality is an organizational effort. To facilitatethe solving of quality problems, it places great emphasis on teamwork. The use ofteams is based on the old adage that “two heads are better than one.” Using techniquessuch as brainstorming, discussion, and quality control tools, teams work regularly tocorrect problems. The contributions of teams are considered vital to the success of thecompany. For this reason, companies set aside time in the workday for team meetings.
Teams vary in their degree of structure and formality, and different types of teamssolve different types of problems. One of the most common types of teams is thequality circle, a team of volunteer production employees and their supervisorswhose purpose is to solve quality problems. The circle is usually composed of eight toten members, and decisions are made through group consensus. The teams usuallymeet weekly during work hours in a place designated for this purpose. They follow apreset process for analyzing and solving quality problems. Open discussion is pro-moted, and criticism is not allowed. Although the functioning of quality circles isfriendly and casual, it is serious business. Quality circles are not mere “gab sessions.”Rather, they do important work for the company and have been very successful inmany firms.
� Quality circleA team of volunteerproduction employees andtheir supervisors who meetregularly to solve qualityproblems.
THE PHILOSOPHY OF TQM • 161
� BenchmarkingStudying the businesspractices of other companiesfor purposes of comparison.
reid_c05_149-182hr.qxd 9/3/09 5:15 PM Page 161

The importance of exceptionalquality is demonstrated by TheWalt Disney Company in theoperation of its theme parks.The focus of the parks is cus-tomer satisfaction. This is ac-complished through meticulousattention to every detail, withparticular focus on the role ofemployees in service delivery.Employees are viewed as themost important organizational
resource, and great care is taken in employee hiring and training. All employees arecalled “cast members,” regardless of whether they are janitors or performers. They areextensively trained in customer service, communication, and quality awareness. Contin-ual monitoring of quality is considered important, and employees meet regularly inteams to evaluate their effectiveness. All employees are shown how the quality of theirindividual jobs contributes to the success of the park.
Use of Quality ToolsYou can see that TQM places a great deal of responsibility on all workers. If employeesare to identify and correct quality problems, they need proper training. They need tounderstand how to assess quality by using a variety of quality control tools, how to in-terpret findings, and how to correct problems. In this section we look at seven differ-ent quality tools, often called the seven tools of quality control (Figure 5-7). They areeasy to understand, yet extremely useful in identifying and analyzing quality prob-lems. Sometimes workers use only one tool at a time, but often a combination of toolsis most helpful.
Cause-and-Effect Diagrams Cause-and-effect diagrams identify potential causesof particular quality problems. They are often called fishbone diagrams because theylook like the bones of a fish (Figure 5-8). The “head” of the fish is the quality problem,such as damaged zippers on a garment or broken valves on a tire. The diagram isdrawn so that the “spine” of the fish connects the “head” to the possible cause of theproblem. These causes could be related to the machines, workers, measurement, sup-pliers, materials, and many other aspects of the production process. Each of these pos-sible causes can then have smaller “bones” addressing specific issues that relate to eachcause. For example, a problem with machines could be due to a need for adjustment,old equipment, or tooling problems. Similarly, a problem with workers could be re-lated to lack of training, poor supervision, or fatigue.
Cause-and-effect diagrams are problem-solving tools commonly used by qualitycontrol teams. Specific causes of problems can be explored through brainstorming.The development of a cause-and-effect diagram requires the team to think through allthe possible causes of poor quality.
Flowcharts A flowchart is a schematic diagram of the sequence of steps involved inan operation or process. It provides a visual tool that is easy to use and understand. Byseeing the steps involved in an operation or process, everyone develops a clear pictureof how the operation works and where problems could arise.
162 • CHAPTER 5 TOTAL QUALITY MANAGEMENT
� Cause-and-effect diagramA chart that identifiespotential causes of particularquality problems.
� FlowchartA schematic of the sequenceof steps involved in anoperation or process.
Andr
ew R
oss/
AFP/
Gett
y Im
ages
, In
c.
LINKS TO PRACTICE
The Walt DisneyCompany
www.disney.com
reid_c05_149-182hr.qxd 9/3/09 5:15 PM Page 162
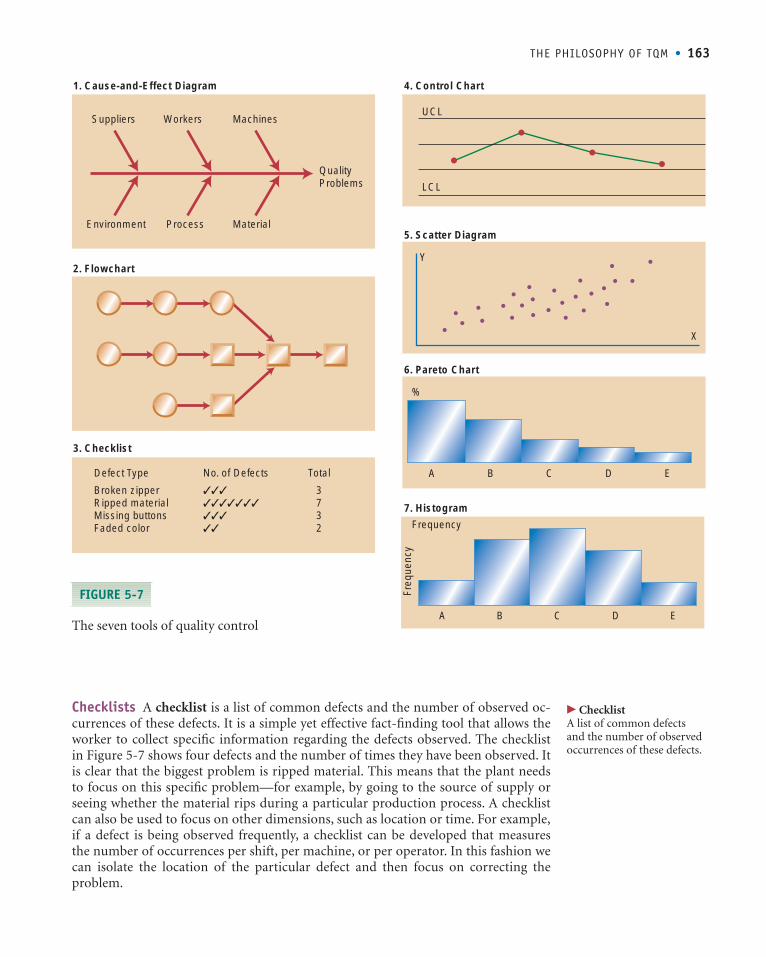
Checklists A checklist is a list of common defects and the number of observed oc-currences of these defects. It is a simple yet effective fact-finding tool that allows theworker to collect specific information regarding the defects observed. The checklistin Figure 5-7 shows four defects and the number of times they have been observed. Itis clear that the biggest problem is ripped material. This means that the plant needsto focus on this specific problem—for example, by going to the source of supply orseeing whether the material rips during a particular production process. A checklistcan also be used to focus on other dimensions, such as location or time. For example,if a defect is being observed frequently, a checklist can be developed that measuresthe number of occurrences per shift, per machine, or per operator. In this fashion wecan isolate the location of the particular defect and then focus on correcting theproblem.
THE PHILOSOPHY OF TQM • 163
Suppliers
Environment
Workers
Process
Machines
Material
Quality Problems
1. Cause-and-Effect Diagram 4. Control Chart
5. Scatter Diagram
6. Pareto Chart
2. Flowchart
3. Checklist
Defect Type
Broken zipperRipped materialMissing buttonsFaded color
3732
No. of Defects Total
UCL
LCL
Y
X
A B C D E
%
7. Histogram
A B C D E
Frequency
Freq
uenc
y
The seven tools of quality control
FIGURE 5-7
� ChecklistA list of common defects and the number of observedoccurrences of these defects.
reid_c05_149-182hr.qxd 9/3/09 5:15 PM Page 163

Control Charts Control charts are a very important quality control tool. We willstudy the use of control charts at great length in the next chapter. These charts areused to evaluate whether a process is operating within expectations relative to somemeasured value such as weight, width, or volume. For example, we could measure theweight of a sack of flour, the width of a tire, or the volume of a bottle of soft drink.When the production process is operating within expectations, we say that it is “incontrol.”
To evaluate whether or not a process is in control, we regularly measure the variableof interest and plot it on a control chart. The chart has a line down the center repre-senting the average value of the variable we are measuring. Above and below the cen-ter line are two lines, called the upper control limit (UCL) and the lower control limit(LCL). As long as the observed values fall within the upper and lower control limits,the process is in control and there is no problem with quality. When a measured ob-servation falls outside of these limits, there is a problem.
Scatter Diagrams Scatter diagrams are graphs that show how two variables are re-lated to one another. They are particularly useful in detecting the amount of correla-tion, or the degree of linear relationship, between two variables. For example,increased production speed and number of defects could be correlated positively; asproduction speed increases, so does the number of defects. Two variables could also becorrelated negatively, so that an increase in one of the variables is associated with a de-crease in the other. For example, increased worker training might be associated with adecrease in the number of defects observed.
The greater the degree of correlation, the more linear are the observations in thescatter diagram. On the other hand, the more scattered the observations in the dia-gram, the less correlation exists between the variables. Of course, other types of rela-tionships can also be observed on a scatter diagram, such as an inverted �. This maybe the case when one is observing the relationship between two variables such as oven
164 • CHAPTER 5 TOTAL QUALITY MANAGEMENT
A general cause-and-effect (fishbone) diagram
FIGURE 5-8
� Control chartsCharts used to evaluatewhether a process isoperating within setexpectations.
� Scatter diagramsGraphs that show how twovariables are related to eachother.
Environment Processes Materials
Suppliers
late deliveries
Workers Machines
Quality Problem
training
ability
supervision
experience
maintenance
calibration
type
age
temperature process design
material grade
type
poor qualitymanagement
out of specification
poor product designdust
lighting
ventilation
out of spec material
defects
reid_c05_149-182hr.qxd 9/3/09 5:15 PM Page 164

temperature and number of defects, since temperatures below and above the idealcould lead to defects.
Pareto Analysis Pareto analysis is a technique used to identify quality problemsbased on their degree of importance. The logic behind Pareto analysis is that only afew quality problems are important, whereas many others are not critical. The tech-nique was named after Vilfredo Pareto, a nineteenth-century Italian economist whodetermined that only a small percentage of people controlled most of the wealth. Thisconcept has often been called the 80–20 rule and has been extended to many areas. Inquality management the logic behind Pareto’s principle is that most quality problemsare a result of only a few causes. The trick is to identify these causes.
One way to use Pareto analysis is to develop a chart that ranks the causes of poorquality in decreasing order based on the percentage of defects each has caused. For ex-ample, a tally can be made of the number of defects that result from different causes,such as operator error, defective parts, or inaccurate machine calibrations. Percentagesof defects can be computed from the tally and placed in a chart like the one shown inFigure 5-7. We generally tend to find that a few causes account for most of the defects.
Histograms A histogram is a chart that shows the frequency distribution of ob-served values of a variable. We can see from the plot what type of distribution a par-ticular variable displays, such as whether it has a normal distribution and whether thedistribution is symmetrical.
In the food service industry the use ofquality control tools is important inidentifying quality problems. Grocerystore chains, such as Kroger and Meijer,must record and monitor the quality ofincoming produce, such as tomatoesand lettuce. Quality tools can be used toevaluate the acceptability of productquality and to monitor product qualityfrom individual suppliers. They can alsobe used to evaluate causes of quality problems, such as long transit time or poor re-frigeration. Similarly, restaurants use quality control tools to evaluate and monitor thequality of delivered goods, such as meats, produce, or baked goods.
Product DesignQuality Function Deployment A critical aspect of building quality into a product isto ensure that the product design meets customer expectations. This typically is not aseasy as it seems. Customers often speak in everyday language. For example, a productcan be described as “attractive,” “strong,” or “safe.” However, these terms can have verydifferent meaning to different customers. What one person considers to be strong, an-other may not. To produce a product that customers want, we need to translate cus-tomers’ everyday language into specific technical requirements. However, this canoften be difficult. A useful tool for translating the voice of the customer into specifictechnical requirements is quality function deployment (QFD). Quality function de-ployment is also useful in enhancing communication between different functions,such as marketing, operations, and engineering.
� HistogramA chart that shows thefrequency distribution ofobserved values of a variable.
� Quality functiondeployment (QFD)A tool used to translate thepreferences of the customerinto specific technicalrequirements.
THE PHILOSOPHY OF TQM • 165
� Pareto analysisA technique used to identifyquality problems based ontheir degree of importance.
LINKS TO PRACTICE
The Kroger Companywww.kroger.com
Meijer Stores LimitedPartnershipwww.meijer.com
�AP
/Wid
e W
orld
Pho
tos
reid_c05_149-182hr.qxd 9/3/09 5:15 PM Page 165

QFD enables us to view the relationships among the variables involved in the de-sign of a product, such as technical versus customer requirements. This can help usanalyze the big picture—for example, by running tests to see how changes in certaintechnical requirements of the product affect customer requirements. An example is anautomobile manufacturer evaluating how changes in materials affect customer safetyrequirements. This type of analysis can be very beneficial in developing a product de-sign that meets customer needs, yet does not create unnecessary technical require-ments for production.
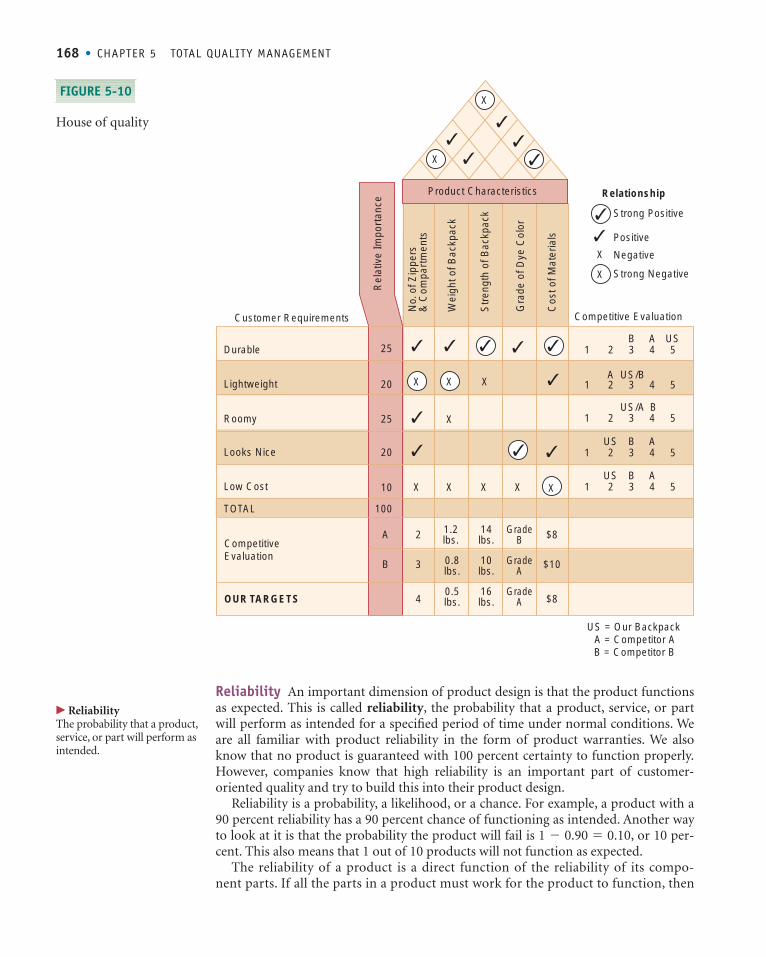
QFD begins by identifying important customer requirements, which typicallycome from the marketing department. These requirements are numerically scoredbased on their importance, and scores are translated into specific product characteris-tics. Evaluations are then made of how the product compares with its main competi-tors relative to the identified characteristics. Finally, specific goals are set to address theidentified problems. The resulting matrix looks like a picture of a house and is oftencalled the house of quality.
We will consider the example of manufacturing a backpack to show how we woulduse QFD. We will start with a relationship matrix that ties customer requirements toproduct characteristics, shown in Figure 5-9.
● Customer Requirements Remember that our goal is to make a product thatthe customer wants. Therefore, the first thing we need to do is survey our cus-tomers to find out specifically what they would be looking for in a product—inthis case, a backpack for students. To find out precisely what features students
166 • CHAPTER 5 TOTAL QUALITY MANAGEMENT
Relationship matrix
FIGURE 5-9
Customer Requirements
Durable
Lightweight
Roomy
Looks Nice
Low Cost
No.
of Z
ippe
rs&
Com
part
men
ts
Wei
ght o
f Bac
kpac
k
Str
engt
h of
Bac
kpac
k
Gra
de o
f Dye
Col
or
Cos
t of M
ater
ials
X
XX X
X
X X
X X
Product Characteristics
Competitive Evaluation
B A
B
US
B AUS
US/A
A US/B
1 2 3 4 5
1 2 3 4 5
1 2 3 4 5
1 2 3 4 5
B AUS1 2 3 4 5
25
20
25
20
10
Rel
ativ
e Im
port
ance
X
Relationship
Strong Positive
Positive
Negative
Strong NegativeX
US = Our Backpack A = Competitor A B = Competitor B
TOTAL 100
MKT
reid_c05_149-182hr.qxd 9/3/09 5:15 PM Page 166
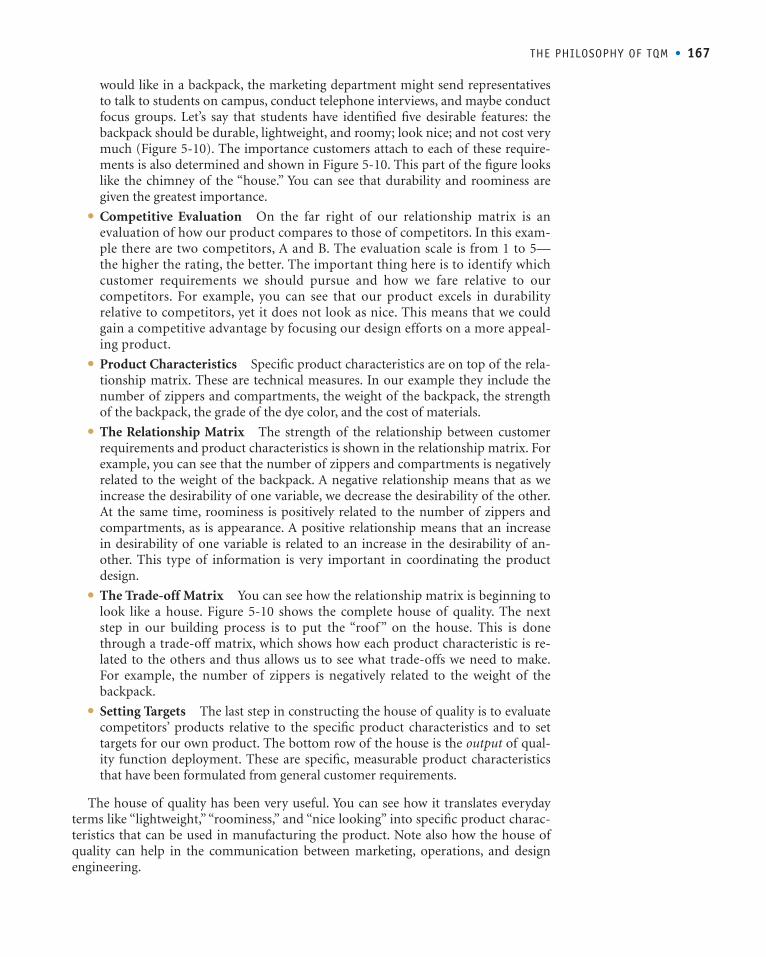
would like in a backpack, the marketing department might send representativesto talk to students on campus, conduct telephone interviews, and maybe conductfocus groups. Let’s say that students have identified five desirable features: thebackpack should be durable, lightweight, and roomy; look nice; and not cost verymuch (Figure 5-10). The importance customers attach to each of these require-ments is also determined and shown in Figure 5-10. This part of the figure lookslike the chimney of the “house.” You can see that durability and roominess aregiven the greatest importance.
● Competitive Evaluation On the far right of our relationship matrix is anevaluation of how our product compares to those of competitors. In this exam-ple there are two competitors, A and B. The evaluation scale is from 1 to 5—the higher the rating, the better. The important thing here is to identify whichcustomer requirements we should pursue and how we fare relative to ourcompetitors. For example, you can see that our product excels in durabilityrelative to competitors, yet it does not look as nice. This means that we couldgain a competitive advantage by focusing our design efforts on a more appeal-ing product.
● Product Characteristics Specific product characteristics are on top of the rela-tionship matrix. These are technical measures. In our example they include thenumber of zippers and compartments, the weight of the backpack, the strengthof the backpack, the grade of the dye color, and the cost of materials.
● The Relationship Matrix The strength of the relationship between customerrequirements and product characteristics is shown in the relationship matrix. Forexample, you can see that the number of zippers and compartments is negativelyrelated to the weight of the backpack. A negative relationship means that as weincrease the desirability of one variable, we decrease the desirability of the other.At the same time, roominess is positively related to the number of zippers andcompartments, as is appearance. A positive relationship means that an increasein desirability of one variable is related to an increase in the desirability of an-other. This type of information is very important in coordinating the productdesign.
● The Trade-off Matrix You can see how the relationship matrix is beginning tolook like a house. Figure 5-10 shows the complete house of quality. The nextstep in our building process is to put the “roof” on the house. This is donethrough a trade-off matrix, which shows how each product characteristic is re-lated to the others and thus allows us to see what trade-offs we need to make.For example, the number of zippers is negatively related to the weight of thebackpack.
● Setting Targets The last step in constructing the house of quality is to evaluatecompetitors’ products relative to the specific product characteristics and to settargets for our own product. The bottom row of the house is the output of qual-ity function deployment. These are specific, measurable product characteristicsthat have been formulated from general customer requirements.
The house of quality has been very useful. You can see how it translates everydayterms like “lightweight,” “roominess,” and “nice looking” into specific product charac-teristics that can be used in manufacturing the product. Note also how the house ofquality can help in the communication between marketing, operations, and designengineering.
THE PHILOSOPHY OF TQM • 167
reid_c05_149-182hr.qxd 9/3/09 5:15 PM Page 167
Reliability An important dimension of product design is that the product functionsas expected. This is called reliability, the probability that a product, service, or partwill perform as intended for a specified period of time under normal conditions. Weare all familiar with product reliability in the form of product warranties. We alsoknow that no product is guaranteed with 100 percent certainty to function properly.However, companies know that high reliability is an important part of customer-oriented quality and try to build this into their product design.
Reliability is a probability, a likelihood, or a chance. For example, a product with a90 percent reliability has a 90 percent chance of functioning as intended. Another wayto look at it is that the probability the product will fail is 1 � 0.90 � 0.10, or 10 per-cent. This also means that 1 out of 10 products will not function as expected.
The reliability of a product is a direct function of the reliability of its compo-nent parts. If all the parts in a product must work for the product to function, then
168 • CHAPTER 5 TOTAL QUALITY MANAGEMENT
� ReliabilityThe probability that a product,service, or part will perform asintended.
House of quality
FIGURE 5-10
Customer Requirements
Durable
Lightweight
Roomy
Looks Nice
Low Cost
TOTAL
No.
of Z
ippe
rs
& C
ompa
rtm
ents
Wei
ght o
f Bac
kpac
k
Str
engt
h of
Bac
kpac
k
Gra
de o
f Dye
Col
or
Cos
t of M
ater
ials
X
X X
X
X X
X
X
X
Relationship
Strong Positive
Positive
Negative
Strong Negative
Competitive Evaluation
B A
B
US
B AUS
US/A
A US/B
1 2 3 4 5
1 2 3 4 5
1 2 3 4 5
1 2 3 4 5
B AUS1 2 3 4 5
25
20
25
20
10
Rel
ativ
e Im
port
ance
100
X
X
X
US = Our Backpack A = Competitor A B = Competitor B
A Grade B
B
Competitive Evaluation
OUR TARGETS
2
3
4
$8
$10
$8
1.2 lbs.
14 lbs.
Grade A
0.8 lbs.
10 lbs.
Grade A
0.5 lbs.
16 lbs.
Product Characteristics
X
reid_c05_149-182hr.qxd 9/3/09 5:15 PM Page 168

Notice in the example that the reliability of the “system” is lower than that of indi-vidual components. The reason is that all the components in a series, as in the exam-ple, must function for the product to work. If only one component doesn’t work, theentire product doesn’t work. The more components a product has, the lower its relia-bility. For example, a system with five components in series, each with a reliability of0.90, has a reliability of only (0.90)(0.90)(0.90)(0.90)(0.90) � (0.90)5 � 0.59.
The failure of certain products can be very critical. One way to increase product re-liability is to build redundancy into the product design in the form of backup parts.Consider the blackout during the summer of 2003, when most of the northeasternpart of the United States was out of power for days. Critical facilities, such as hospitals,immediately switched to backup power generators that are available when the mainsystems fail. Consider other critical systems, such as the navigation system of anaircraft, systems that operate nuclear power plants, the space shuttle, or even thebraking system of your car. What gives these systems such high reliability is theredundancy built into the product design that serves to increase reliability.
Redundancy is built into the system by placing components in parallel so thatwhen one component fails the other component takes over. In this case, the reliabilityof the system is computed by adding the reliability of the first component to the relia-bility of the second (backup) component, multiplied by the probability of needing thebackup. The equation is as follows:
Notice that if the reliability of the first component is 0.90, the probability of needing asecond component is equal to the first component failing, which is (1 � 0.90) � 0.10.Now let’s look at an example.
Rs � �Reliabilityof 1st
component�� ��Reliabilityof 2nd
component�� �Probabilityof needing2nd component��
THE PHILOSOPHY OF TQM • 169
EXAMPLE 5.1
ComputingProductReliability
Assume that a product has two parts, both of which must work for the product to function. Part 1 has areliability of 80 percent and part 2 has a reliability of 90 percent. Compute the reliability of the product.
• Before You Begin: Remember that the reliability of the system is simply the product ofthe individual reliabilities.
• Solution:The reliability of the product is
R � (0.80)(0.90) � 0.72
Part 1 Part 2
0.80 0.90
the reliability of the system is computed as the product of the reliabilities of the in-dividual components:
where Rs � reliability of the product or systemR1...n � reliability of components 1 through n
Rs � (R1)(R2)(R3) . . . (Rn)
reid_c05_149-182hr.qxd 9/3/09 5:15 PM Page 169

Process ManagementAccording to TQM, a quality product comes from a quality process. This means thatquality should be built into the process. Quality at the source is the belief that it is farbetter to uncover the source of quality problems and correct it than to discard defectiveitems after production. If the source of the problem is not corrected, the problem willcontinue. For example, if you are baking cookies you might find that some of the cook-ies are burned. Simply throwing away the burned cookies will not correct the problem.You will continue to have burned cookies and will lose money when you throw themaway. It will be far more effective to see where the problem is and correct it. For exam-ple, the temperature setting may be too high; the pan may be curved, placing somecookies closer to the heating element; or the oven may not be distributing heat evenly.
Quality at the source exemplifies the difference between the old and new conceptsof quality. The old concept focused on inspecting goods after they were produced orafter a particular stage of production. If an inspection revealed defects, the defectiveproducts were either discarded or sent back for reworking. All this cost the companymoney, and these costs were passed on to the customer. The new concept of qualityfocuses on identifying quality problems at the source and correcting them.
In Chapter 6 we will learn how to monitor process quality using quality tools, suchas control charts.
Managing Supplier QualityTQM extends the concept of quality to a company’s suppliers. Traditionally, companiestended to have numerous suppliers who engaged in competitive price bidding. Whenmaterials arrived, they were inspected for quality. TQM views this practice as contribut-ing to poor quality and wasted time and cost. The philosophy of TQM extends the con-cept of quality to suppliers and ensures that they engage in the same quality practices. Ifsuppliers meet preset quality standards, materials do not have to be inspected upon ar-rival. Today, many companies have a representative residing at their supplier’s location,thereby involving the supplier in every stage from product design to final production.
170 • CHAPTER 5 TOTAL QUALITY MANAGEMENT
� Quality at the sourceThe belief that it is best touncover the source of qualityproblems and eliminate it.
EXAMPLE 5.2
ComputingProduct
Reliability withRedundancy
Two power generators provide electricity to a facility’s main and backup generator. The main gener-ator has a reliability of 0.95 and the backup a reliability of 0.90. What is the reliability of the system?
• Before You Begin: Notice in this problem that redundancy has been added to the systemin the form of a backup component. Remember to draw the backup in parallel to the originalcomponent and compute the total reliability accordingly.
• Solution:The system can be represented in the following way
The reliability of the system is
Rs � 0.95 � [(0.90) � (1 � 0.95)] � 0.995
Original0.95
Backup 0.90
reid_c05_149-182hr.qxd 9/3/09 5:15 PM Page 170

QUALITY AWARDS AND STANDARDS
QUALITY AWARDS AND STANDARDS • 171
Malcolm Baldrige National Quality Award criteria
FIGURE 5-11
� Malcolm BaldrigeNational Quality AwardAn award given annually tocompanies that demonstratequality excellence andestablish best practicestandards in industry.
The Ritz-Carlton is oneof the past winners of theMalcolm BaldrigeNational Quality Award.
Before You Go On
Today’s concept of quality, called total quality management (TQM), focuses on building quality into the process,as opposed to simply inspecting for poor quality after production. TQM is customer driven and encompassesthe entire company. Before you go on, you should know the four categories of quality costs. These are preventionand appraisal costs, which are costs that are incurred to prevent poor quality, and internal and external failurecosts, which are costs that the company hopes to prevent. You should understand the evolution of TQM and thenotable individuals who have shaped our knowledge of quality. Last, you should know the seven concepts of theTQM philosophy: customer focus, continuous improvement, employee empowerment, use of quality tools, productdesign, process management, and managing supplier quality.
The Malcolm Baldrige National Quality Award (MBNQA)The Malcolm Baldrige National Quality Award was established in 1987 when Con-gress passed the Malcolm Baldrige National Quality Improvement Act. The award isnamed after the former Secretary of Commerce Malcolm Baldrige, and is intended toreward and stimulate quality initiatives. It is designed to recognize companies that es-tablish and demonstrate high-quality standards and is given to no more than two com-panies in each of three categories: manufacturing, service, and small business. Pastwinners include Motorola Corporation, Xerox, FedEx, 3M, IBM, and the Ritz-Carlton.
To compete for the Baldrige Award, companies must submit a lengthy application,which is followed by an initial screening. Companies that pass this screening move tothe next step, in which they undergo a rigorous evaluation process conducted by certi-fied Baldrige examiners. The examiners conduct site visits and examine numerouscompany documents. They base their evaluation on seven categories, which are shownin Figure 5-11. Let’s look at each category in more detail.
The first category is leadership. Examiners consider commitment by top management,their effort to create an organizational climate devoted to quality, and their active involve-ment in promoting quality. They also consider the firm’s orientation toward meeting cus-tomer needs and desires, as well as those of the community and society as a whole.
1 Leadership
2 Strategic Planning
3 Customer and Market Focus
4 Information and Analysis
5 Human Resource Focus
6 Process Management
7 Business Results
TOTAL POINTS
Categories
120
85
85
90
85
85
450
1000
Points
Alex
ande
r Ru
sche
/dpa
/Lan
dov
LLC
reid_c05_149-182hr.qxd 9/3/09 5:16 PM Page 171
The second category is strategic planning. The examiners look for a strategic planthat has high-quality goals and specific methods for implementation. The next cate-gory, customer and market focus, addresses how the company collects market and cus-tomer information. Successful companies should use a variety of tools toward thisend, such as market surveys and focus groups. The company then needs to demon-strate how it acts on this information.
The fourth category is information and analysis. Examiners evaluate how the com-pany obtains data and how it acts on the information. The company needs to demon-strate how the information is shared within the company as well as with other parties,such as suppliers and customers.
The fifth and sixth categories deal with management of human resources and man-agement of processes, respectively. These two categories together address the issues ofpeople and process. Human resource focus addresses issues of employee involvement.This entails continuous improvement programs, employee training, and functioningof teams. Employee involvement is considered a critical element of quality. Similarly,process management involves documentation of processes; use of tools for quality im-provement, such as statistical process control; and the degree of process integrationwithin the organization.
The last Baldrige category receives the highest points and deals with business results.Numerous measures of performance are considered, from percentage of defectiveitems to financial and marketing measures. Companies need to demonstrate progres-sive improvement in these measures over time, not just a one-time improvement.
The Baldrige criteria have evolved from simple award criteria to a general frame-work for quality evaluation. Many companies use these criteria to evaluate their ownperformance and set quality targets even if they are not planning to formally competefor the award.
The Deming PrizeThe Deming Prize is a Japanese award given to companies to recognize their efforts inquality improvement. The award is named after W. Edwards Deming, who visitedJapan after World War II upon the request of Japanese industrial leaders and engi-neers. While there, he gave a series of lectures on quality. The Japanese considered himsuch an important quality guru that they named the quality award after him.
The award has been given by the Union of Japanese Scientists and Engineers(JUSE) since 1951. Competition for the Deming Prize was opened to foreign com-panies in 1984. In 1989, Florida Power & Light was the first U.S. company to receivethe award.
ISO 9000 StandardsIncreases in international trade during the 1980s led to the development of universalstandards of quality. Universal standards were seen as necessary in order for compa-nies to be able to objectively document their quality practices around the world. Thenin 1987 the International Organization for Standardization published its first set ofstandards for quality management, called ISO 9000. The purpose of the InternationalOrganization for Standardization (ISO) is to establish agreement on internationalquality standards. It currently has members from 91 countries, including the UnitedStates. It created ISO 9000 to develop and promote international quality standards.ISO 9000 consists of a set of standards and a certification process for companies. ISO9000 certification demonstrates that companies have met the standards. The standardsare applicable to all types of companies and have gained global acceptance. In many
172 • CHAPTER 5 TOTAL QUALITY MANAGEMENT
� Deming PrizeA Japanese award given tocompanies to recognize effortsin quality improvement.
� ISO 9000A set of international qualitystandards and a certificationdemonstrating thatcompanies have met all thestandards specified.
HRM
reid_c05_149-182hr.qxd 9/3/09 5:16 PM Page 172

industries ISO certification has become a requirement for doing business. Also, ISO9000 standards have been adopted by the European Community as a standard forcompanies doing business in Europe.
In December 2000 the first major changes to ISO 9000 were made, introducing thefollowing three new standards:
● ISO 9000:2000, Quality Management Systems—Fundamentals and Standards:Provides the terminology and definitions used in the standards. It is the startingpoint for understanding the system of standards.
● ISO 9001:2000, Quality Management Systems—Requirements: This is the standardfor the certification of a firm’s quality management system. It is used to demonstratethe conformity of quality management systems to meet customer requirements.
● ISO 9004:2000, Quality Management Systems—Guidelines for Performance: Pro-vides guidelines for establishing a quality management system. It focuses notonly on meeting customer requirements but also on improving performance.
These three standards are the most widely used and apply to the majority of compa-nies. However, ten more published standards and guidelines exist as part of the ISO9000 family of standards.
To receive ISO certification, a company must provide extensive documentation of itsquality processes. This includes methods used to monitor quality, methods and fre-quency of worker training, job descriptions, inspection programs, and statistical processcontrol tools used. High-quality documentation of all processes is critical. The companyis then audited by an ISO 9000 registrar, who visits the facility to make sure the companyhas a well-documented quality management system and that the process meets the stan-dards. If the registrar finds that all is in order, certification is received. Once a company iscertified, it is registered in an ISO directory that lists certified companies. The entireprocess can take 18 to 24 months and can cost anywhere from $10,000 to $30,000. Com-panies have to be recertified by ISO every three years.
One of the shortcomings of ISO certification is that it focuses only on the processused and conformance to specifications. In contrast to the Baldrige criteria, ISO certi-fication does not address questions about the product itself and whether it meets cus-tomer and market requirements. Today there are over 40,000 companies that are ISOcertified. In fact, certification has become a requirement for conducting business inmany industries.
ISO 14000 StandardsThe need for standardization of quality created an impetus for the development ofother standards. In 1996, the International Standards Organization introduced stan-dards for evaluating a company’s environmental responsibility. These standards,termed ISO 14000, focus on three major areas:
● Management systems standards measure systems development and integrationof environmental responsibility into the overall business.
● Operations standards include the measurement of consumption of natural re-sources and energy.
● Environmental systems standards measure emissions, effluents, and other wastesystems.
With greater interest in green manufacturing and more awareness of environmen-tal concerns, ISO 14000 may become an important set of standards for promoting en-vironmental responsibility.
QUALITY AWARDS AND STANDARDS • 173
� ISO 14000A set of internationalstandards and a certificationfocusing on a company’senvironmental responsibility.
reid_c05_149-182hr.qxd 9/3/09 5:16 PM Page 173
WHY TQM EFFORTS FAIL
174 • CHAPTER 5 TOTAL QUALITY MANAGEMENT
In this chapter we have discussed the meaning of TQM and the great benefits that canbe attained through its implementation. Yet there are still many companies that at-tempt a variety of quality improvement efforts and find that they have not achievedany or most of the expected outcomes. The most important factor in the success orfailure of TQM efforts is the genuineness of the organization’s commitment. Often,companies look at TQM as another business change that must be implemented due tomarket pressure without really changing the values of their organization. Recall thatTQM is a complete philosophy that has to be embraced with true belief, not merelip service. Looking at TQM as a short-term financial investment is a sure recipe forfailure.
Another mistake is the view that the responsibility for quality and elimination ofwaste lies with employees other than top management. It is a “let the workers do it”mentality. A third common mistake is over- or underreliance on statistical process con-trol (SPC) methods. SPC is not a substitute for continuous improvement, teamwork,and a change in the organization’s belief system. However, SPC is a necessary tool foridentifying quality problems. Some common causes for TQM failure are
● Lack of a genuine quality culture
● Lack of top management support and commitment
● Over- and underreliance on statistical process control (SPC) methods
Companies that have attained the benefits of TQM have created a quality cul-ture. These companies have developed processes for identifying customer-definedquality. In addition, they have a systematic method for listening to their customers,collecting and analyzing data pertaining to customer problems, and makingchanges based on customer feedback. You can see that in these companies there is asystematic process for prioritizing customer needs that encompasses the entireorganization.
TOTAL QUALITY MANAGEMENT (TQM) WITHIN OM: HOW IT ALL FITS TOGETHER
Implementing total quality management requires broad and sweeping changesthroughout a company. It also affects all other decisions within operations manage-ment. The decision to implement total quality management concepts throughout thecompany is strategic in nature. It sets the direction for the firm and the level of com-mitment. For example, some companies may choose to directly compete on quality,whereas others may just want to be as good as the competition. It is operations strat-egy that then dictates how all other areas of operations management will support thiscommitment.
The decision to implement TQM affects areas such as product design (Chapter 3),which needs to incorporate customer-defined quality. Processes are then redesigned inorder to produce products with higher quality standards. Job design (Chapter 11) isaffected, as workers need to be trained in quality tools and become responsible forrooting out quality problems. Also, supply chain management (Chapter 4) is affectedas the commitment to quality translates into partnering with suppliers. As you cansee, virtually every aspect of the operations function must change to support the com-mitment to total quality management.
reid_c05_149-182hr.qxd 9/3/09 5:16 PM Page 174

TOTAL QUALITY MANAGEMENT (TQM) ACROSS THE ORGANIZATION
TOTAL QUALITY MANAGEMENT (TQM) ACROSS THE ORGANIZATION • 175
As we have seen, total quality management impacts every aspect of the organization.Every person and every function is responsible for quality and is affected by poorquality. For example, recall that Motorola implemented its Six Sigma concept not onlyin the production process but also in the accounting, finance, and administrativeareas. Similarly, ISO 9000 standards do not apply only to the production process—they apply equally to all departments of the company. A company cannot achieve highquality if its accounting is inaccurate or the marketing department is not workingclosely with customers. TQM requires the close cooperation of different functions inorder to be successful. In this section we look at the involvement of these other func-tions in TQM.
Marketing plays a critical role in the TQM process by providing key inputs thatmake TQM a success. Recall that the goal of TQM is to satisfy customer needs by pro-ducing the exact product that customers want. Marketing’s role is to understand thechanging needs and wants of customers by working closely with them. This requires asolid identification of target markets and an understanding of whom the product isintended for. Sometimes, apparently small differences in product features can result inlarge differences in customer appeal. Marketing needs to accurately pass customer in-formation along to operations, and operations needs to include marketing in anyplanned product changes.
Finance is another major participant in the TQM process because of the greatcost consequences of poor quality. General definitions of quality need to be translatedinto specific dollar terms. This serves as a baseline for monitoring the financial impactof quality efforts and can be a great motivator. Recall the four costs of quality dis-cussed earlier. The first two costs, prevention and appraisal, are preventive costs; theyare intended to prevent internal and external failure costs. Not investing enough inpreventive costs can result in failure costs, which can hurt the company. On the otherhand, investing too much in preventive costs may not yield added benefits. Financialanalysis of these costs is critical. You can see that finance plays a large role in evaluat-ing and monitoring the financial impact of managing the quality process. This in-cludes costs related to preventing and eliminating defects, training employees,reviewing new products, and all other quality efforts.
Accounting is important in the TQM process because of the need for exact cost-ing. TQM efforts cannot be accurately monitored and their financial contribution as-sessed if the company does not have accurate costing methods.
Engineering efforts are critical in TQM because of the need to properly translatecustomer requirements into specific engineering terms. Recall the process we fol-lowed in developing quality function deployment (QFD). It was not easy to translatea customer requirement such as “a good-looking backpack” into specific terms suchas materials, weight, color grade, size, and number of zippers. We depend on engi-neering to use general customer requirements in developing technical specifications,identifying specific parts and materials needed, and identifying equipment thatshould be used.
Purchasing is another important part of the TQM process. Whereas marketing isbusy identifying what the customers want and engineering is busy translating thatinformation into technical specifications, purchasing is responsible for acquiringthe materials needed to make the product. Purchasing must locate sources of sup-ply, ensure that the parts and materials needed are of sufficiently high quality, andnegotiate a purchase price that meets the company’s budget as identified byfinance.
FIN
MKT
ACC
reid_c05_149-182hr.qxd 9/3/09 5:16 PM Page 175