regulatory consideration of bioavailability for metals: simplification of input parameters for the...
TRANSCRIPT

Regulatory Consideration of Bioavailability for Metals:Simplification of Input Parameters for the Chronic CopperBiotic Ligand ModelAdam Peters,*y Graham Merrington,y Karel de Schamphelaere,z and Katrien Delbeke§ywca environment, Ltd., Brunel House, Volunteer Way, Faringdon, Oxfordshire, SN7 7YR, United KingdomzDepartment of Applied Ecology and Environmental Biology, Gent University, Gent, Belgium§European Copper Institute, Brussels, Belgium
(Submitted 27 July 2010; Returned for Revision 19 October 2010; Accepted 5 November 2010)
ABSTRACTThe chronic Cu biotic ligandmodel (CuBLM) provides ameans by which the bioavailability of Cu can be taken into account in
assessing the potential chronic risks posed by Cu at specific freshwater locations. One of the barriers to the widespread
regulatory applicationof theCuBLM is theperceived complexity of the approachwhen compared to the current systems that are
in place in many regulatory organizations. The CuBLM requires 10 measured input parameters, although some of these have a
relatively limited influence on the predicted no-effect concentration (PNEC) for Cu. Simplification of the input requirements of
the CuBLM is proposed by estimating the concentrations of the major ions Mg2þ, Naþ, Kþ, SO2-4 , Cl�, and alkalinity from Ca
concentrations. A series of relationships between log10 (Ca,mg l�1) and log10 (major ion,mg l�1) was established from surface
watermonitoringdata for Europe, and applied in thepredictionof Cu PNECvalues for someUK freshwatermonitoringdata. The
use of default values for major ion concentrations was also considered, and both approaches were compared to the use of
measured major ion concentrations. Both the use of fixed default major ion concentrations, and major ion concentrations
estimated fromCa concentrations, providedCuPNECpredictionswhichwere ingoodagreementwith the results of calculations
using measured data. There is a slight loss of accuracy when using estimates of major ion concentrations compared to using
measured concentration data, although to a lesser extent than when fixed default values are applied. The simplifications
proposed provide a practical evidence-based methodology to facilitate the regulatory implementation of the CuBLM. Integr
Environ Assess Manag 2011;7:437–444. � 2011 SETAC
Keywords: Copper Biotic ligand model Environmental regulation
INTRODUCTIONBiotic ligand models (BLMs) provide a potential means by
which to take account of the effect of water chemistry on thetoxicity of some metals (Niyogi and Wood 2004). Use ofBLMs reduces the incidence of false positives as well as falsenegatives when assessing compliance against an environ-mental quality standard (known as a water quality standardin North America). Such an approach allows those locationswhich are most sensitive to particular metals, and those forwhich the risks of ecotoxicity are greatest, to be identified andprioritized for further action (Van Sprang et al. 2009).Previous approaches to deriving environmental quality stand-ard values used by regulatory regimes in the UK (HMSO1989) and elsewhere (e.g., Canada, CCREM 1987) haveapplied corrections for metal toxicity on the basis of waterhardness. The limitations of hardness-based corrections inproviding robust ecological metrics of potential risks fromchronic exposures of Cu and Zn are well known (ECI 2008;The Netherlands 2008).
BLMs consider the distribution of a toxic metal betweenvarious different chemical species, such as free metal ions,
inorganic complexes and complexes with organic ligands (DiToro et al. 2001; Santore et al. 2001). These differentchemical species can have different availabilities to aquaticorganisms. The BLMs also take account of competitiveinteractions between the toxic metal ion and other cationsat the site of toxic action. The site of toxic action is usuallyconsidered to be a ligand in the gill of the organism, the‘‘biotic ligand.’’ The toxicity is related to the amount of metalwhich is bound to the biotic ligand, with different thresholdconcentrations being applicable to different organisms. Thechronic CuBLM software package (ECI 2008) incorporateschronic Cu bioavailability models (De Schamphelaere andJanssen, 2004a,b; De Schamphelaere and Janssen 2006),which have been successfully validated for a wide range ofnatural surface waters types (ECI 2008) and which have alsobeen validated against other organisms (De Schamphelaereet al. 2006; ECI 2008).
One of the difficulties in implementing BLMs withinregulatory compliance assessment systems is the amount ofinformation which is required for making BLM calculations,and environmental regulators may feel that the inputrequirements of the CuBLM are too onerous for its routineimplementation to be practical in compliance assessment.The chronic CuBLM calculates the predicted no-effectconcentration (PNEC) for Cu as a function of water qualitycharacteristics. The chronic CuBLM (ECI 2008) requires 10input parameters: Temperature, pH, dissolved organic carbon(DOC), Ca2þ, Mg2þ, Naþ, Kþ, SO2-
4 , Cl�, and alkalinity
Integrated Environmental Assessment and Management — Volume 7, Number 3—pp. 437–444� 2011 SETAC 437
* To whom correspondence may be addressed:
Published online in 16 November 2010 in Wiley Online Library
(wileyonlinelibrary.com).
DOI: 10.1002/ieam.159
Health
&Eco
logica
lRisk

(there are also inputs for Cu, percent humic acid, and sulfidealthough they are not used in the speciation calculations).Although some of these input parameters (such as SO2-
4
and Cl�) may be fixed to a single ‘‘default’’ value withoutsignificantly affecting the PNEC, others (such as Naþ andalkalinity) may have an influence on the resulting PNEC(Environment Agency 2007).
Figure 1 shows the effect of some of the input parameterson the value of the PNEC predicted by the CuBLM for aparticular water chemistry. In these simulations, the startingchemistry was a water with the following characteristics,pH 7.56, DOC 0.8mg l�1, Ca2þ 14.6mg l�1, Mg2þ
2.5mg l�1, Naþ 3.2mg l�1, Kþ 0.9mg l�1, SO2-4
5.1mg l�1, Cl� 6.4mg l�1 and alkalinity 0.7mg l�1. Eachparameter was varied individually whereas the other param-eters were kept at constant values for these calculations, inorder to demonstrate the effect of the individual parameterson the PNEC. DOC was varied between 0.8 and9.8mg l�1, Naþ and Mg2þ between 5 and 50mg l�1,and Ca2þ, Cl�, and alkalinity were varied between 10 and100mg l�1 in the simulations.
DOC and Naþ are the only parameters for whichincreasing concentrations result in increased PNEC values,and DOC is clearly the most influential parameter in terms ofthe Cu PNEC. Increases in Ca2þ, Mg2þ, alkalinity, and Cl�
concentrations all result in a reduction in the Cu PNEC,although the change due to Cl� is very small. The relativechange in the PNEC value resulting from the changes to inputconcentrations considered here are in the range of 30 to 40%for Ca2þ, Mg2þ, Naþ, and alkalinity, but is <10% for Cl�. A
10-fold increase in DOC concentration results in approx-imately a 5-fold increase in the PNEC under these conditions.It is important to note that increases in Ca2þ concentrationsdo not result in increases in the chronic PNEC value for Cu,although this would be expected from the hardness relation-ships currently used by several regulatory regimes.
Previous compliance assessment approaches for waterquality standards with hardness corrections required informa-tion on only the water hardness in addition to the metalexposure concentration. Therefore, many of these additionalparameters have not been measured routinely. Although it ispossible that default values could be used for some of theinput parameters, this could result in the water chemistry forthe prediction substantially differing from that of the waterfor which the prediction is made. It is therefore important toensure that any pragmatic simplifications to BLMs thatpromote their wider use are not to the detriment of theirscientific basis.
The aim of this study is to establish a means of simplifyingthe input requirements of the CuBLM in a scientificallyjustifiable and transparent way to facilitate the use of thesemodels in regulatory compliance assessment. The use ofdefault input parameters for some, or all, of the major ionsrequired for BLM calculations is possible, and this approach istested against a method of estimating input data for major ionconcentrations. Reducing the set of required input parame-ters, by estimating likely values of some of the less importantparameters from measurements of other parameters, isconsidered to be a practical approach to simplifying the datainput requirements of the CuBLM. The current version of an
Figure 1. Variation in the Cu PNEC value (mg l�1, as dissolved Cu) predicted by the CuBLMas a result of changes in input concentrations of DOC, Ca2þ, Mg2þ, Naþ,alkalinity and Cl� (all expressed in mg l�1, alkalinity as mg l�1 CaCO3).
438 Integr Environ Assess Manag 7, 2011—A Peters et al.

Excel1-based user-friendly ZnBLM (version 4, InternationalZinc Association) takes a similar approach, by estimatingmajor ion concentrations from either a Ca2þ or hardnessconcentration input. We will describe the effect of theseestimates on model performance when deriving a PNEC, andassess potential uncertainties. We contextualize these uncer-tainties by considering their impact on environmentalprotection and regulatory compliance in relation to theEuropean Union’s Water Framework Directive.
METHODS
Data selection
A data set of water quality information was collected fromexisting data sets across Europe for use when calculating Cutoxicity thresholds for European waters under the ExistingSubstances Regulations (EC 793/93) voluntary risk assess-ment of Cu and Cu compounds (Van Sprang et al. 2008).These data are referred to as the SWAD (Surface WAterDatabase) data set.
Water data from the SWAD data set were collated forinstances in which the alkalinity was measured, rather thancalculated, and for which there were also measurementsreported for Ca2þ, Mg2þ, Naþ, Kþ, SO2-
4 , and Cl�. The dataused in this analysis from each region are identified below.The only regions which are well represented from this data setare the UK and Sweden, with limited data from Spain. Thenumber of samples available for each region is shown inTable 1, with all of the required parameters available.Measured alkalinity data were not available for the majorityof the regions, and these data were therefore not included inthe analysis.
A total of 4657 matched data were used to compile thecomplete data set (Van Sprang et al. 2008). This data set wasfurther split to remove UK data from the SWAD data set,with the UK and non-UK subsets analyzed independently.The assessment of the 2 separate subsets of data wasundertaken in order to assess whether there was a noticeabledifference between the UK conditions and those of otherEuropean countries, because UK data accounted for >68% ofthe complete data set.
Data from 10 major Scottish rivers were provided by theScottish Environment Protection Agency from their Harmon-ised Monitoring Database. Data for 356 samples withmatched data for the parameters of interest and conductivity
were obtained. Some data from the USA was obtained fromthe Los Alamos National Laboratory Database (http://wqdbworld.lanl.gov/), and matched data for the parametersof interest were found for 250 samples. The spatial coverageof this data set is unclear, but is assumed to be relativelylimited. All concentrations are in mg l�1 unless otherwisestated.
Matched concentration data for the relevant parameterswere log10-transformed and analyzed by linear regressionanalysis (log[ion]¼ aþ b.(log[Ca2þ])) using R (version 2.9.1;http://cran.r-project.org), where Ca2þ and other ion concen-trations are in units of mg l�1, except alkalinity which isreported as mg CaCO3 L�1.
RESULTS
Range of concentrations of Ca and major ions
The 5th, 10th, 90th, and 95th percentiles of thedistribution of Ca2þ concentrations for each data set areprovided in Table 2. Although most of the data sets cover aconsiderable range of Ca2þ concentrations, the data fromboth Scotland and the USA are limited to only relativelylow Ca2þ concentrations (90th percentile approximately35mg (Ca2þ) l�1). This may have implications for theapplicability of regressions derived from these data sets tomore diverse conditions. The concentration ranges of theother major ions followed a similar pattern to the rangeof Ca2þ concentrations in all of the data sets.
Summary of relationships between Ca and other major ions
Linear relationships between log10 (Ca2þ, mg l�1) andlog10 (major ion, mg l�1) were derived for each data set orsubset, and statistically significant relationships (p< 0.001)were observed in all cases, except for the US data set. Thecorrelation coefficients (r2) obtained are shown in Table 3 foreach parameter and data set that was assessed. Similarrelationships used to establish correlations between Ca2þ
and other major ions for the Excel1-based user-friendlyZnBLM (these relationships use units of equiv l�1) are alsoincluded. Correlation coefficients >0.7 are highlighted in boldtype and those <0.4 are italicized. The predictive capabilitiesof the regressions derived from different data sets vary widelyfor the estimation of major ion concentrations from Ca2þ
concentrations. In some cases, most of the required param-eters would be expected to be predicted reliably, for example
Table 1. Number of samples available for each region from theSWAD database
Region (or source) Number of matched samples
Elbe 1
Spain 48
Sweden 1012
United Kingdom 3194
The Netherlands 216
FOREGS 186
Total 4657
Table 2. Ca concentration range for the datasets analyzed (mg l–1)
Percentile SWAD Non-UK UK Scotland US
5 2.4 1.3 8.5 1.6 7.5
10 3.7 2.0 11.8 2.0 8.8
25 12.4 3.1 31.2 3.2 11.7
50 54.0 6.9 83.1 7.6 18.9
75 102.0 44.5 111.0 14.2 26.5
90 122.0 83.8 125.0 34.1 36.5
95 131.2 110.3 133.0 41.6 45.5
Simplification of input parameters for the copper BLM— Integr Environ Assess Manag 7, 2011 439

for the non-UK data subset, whereas in other cases, such asthe US data, reliable predictions for most of the parameterswould not be expected due to poor correlation coefficients.
The slope coefficients (b) obtained for each regression areshown in Table 4, and intercept coefficients (a) in Table 5.The slope coefficients obtained for Mg2þ, Naþ, and Kþ fromthe UK data are slightly lower than those for other parts ofEurope, although Sweden is the region best representedwithin the other European data.
It is recommended that the more reliable relationships (i.e.,those with higher correlation coefficients) are preferred overless reliable ones, although for estimates of major ionconcentrations to have broad applicability the data sets fromwhich they are derived should be as extensive as possible.Sodium and alkalinity have the greatest influence on thePNEC values predicted by the CuBLM and therefore a greateremphasis should be placed on the reliable estimation of these(Comber et al. 2008). The SWAD data set showed significant(p< 0.001) correlation coefficients of >0.6 for all 6 of theparameters considered here. This data set also has the greatestcoverage of European conditions. Although heavily biasedtoward the UK and Sweden, it also includes data from Spainand The Netherlands and the FOREGS (www.gsf.fi/foregs/geochem) monitoring program.
Comparisons of estimates using relationships derived fromdifferent data sets
Figure 2 shows the prediction of Mg2þ, Naþ, Cl�, andalkalinity concentrations, derived from the relationships
with Ca2þ, for each of the 6 data sets (or subsets) consideredabove. The relationships are plotted for the approximaterange of Ca2þ concentrations of the data set from which theyare derived. The relationships derived from the variousdifferent data sets and subsets for the estimation of majorion concentrations from Ca2þ concentrations are generallyvery similar, with the exception of the alkali metals (Na andK) when the US data set is used. The US data set is relativelysmall (n¼ 250) and the relationships derived from it have apoor predictive capacity compared to the other data sets,although for other parameters the predictions are broadlycomparable.
The use of the regressions developed from the completeSWAD data set for the prediction of major ion concentrationinput data in the CuBLM is assessed below. The data set fromwhich the regressions are derived is considered as being morebroadly representative of a wider range of conditions than theother data sets.
Influence of simplified input parameters on the perfor-mance of the CuBLM
Two additional data sets, both of which included acomplete suite of water quality parameters, were alsoidentified. The first set of data (n¼ 35) was from a study onupland streams within a limited geographic area (Environ-ment Agency 2008). The second set (n¼ 112) was providedby the Environment Agency of England and Wales (BruceBrown, Environment Agency, Bristol, UK, personal commu-nication) and covers a range of water types throughout the
Table 3. Correlation coefficients (r2) for relationships between log10 (Ca, mg/L) and log10 (ion, mg/L) for the datasets analyzed (mg CaCO3/Lfor alkalinity)
Dataset Mg2R NaR KR SO42� Cl� Alkalinity Na
ECI 0.6288 0.6948 0.6987 0.7748 0.7125 0.7307 4657
Non-UK 0.887 0.7185 0.7181 0.7892 0.7304 0.5667 1463
UK 0.2383 0.4342 0.4596 0.5776 0.4808 0.8439 3194
Scotland 0.8639 0.6357 0.7825 0.7353 0.3873 0.9211 356
US 0.5464 0.3437 0.2508 0.2086 0.2568 0.2595 250
ZnBLMb 0.4978 0.2572 0.4186 0.6219 0.3103 0.9215 85
aValues of >0.7 are identified in bold type, and values of <0.4 are italicized. N indicates the number of samples in the dataset.bRelationships for the ZnBLM are based on units of meq l�1, rather than mg l�1.
Table 4. Slope coefficients for relationships between log10 (Ca, mg/L) and log10 (ion, mg/L) for the datasets analyzed (mg CaCO3/L foralkalinity)
Dataset Mg2R NaR KR SO42� Cl� Alkalinity Na
ECI 0.611 0.707 0.669 0.954 0.718 1.044 4657
Non-UK 0.819 0.807 0.785 1.058 0.863 1.107 1463
UK 0.386 0.489 0.464 0.743 0.450 0.900 3194
Scotland 0.929 0.609 0.777 1.057 0.444 1.045 356
US 0.774 1.182 0.684 0.767 1.311 0.574 250
ZnBLM b 0.454 0.519 0.500 0.707 0.602 0.894 85
aN indicates the number of samples in the dataset.bRelationships for the ZnBLM are based on units of meq l�1, rather than mg l�1.
440 Integr Environ Assess Manag 7, 2011—A Peters et al.

UK. PNEC calculations were made using the CuBLM forboth of these data sets, using measured water chemistry data,default values for water chemistry (Table 6), and also waterchemistry data predicted from the reported Ca2þ concen-trations, based on relationships derived from the SWAD dataset. DOC was assumed to comprise 50% active fulvic acidavailable for Cu binding, and 50% inactive material. Acomparison of the PNEC values, expressed as dissolved(operationally defined as 0.45mm filtered) Cu concentrations,predicted using the measured major ion concentrations andestimated major ion concentrations for the EnvironmentAgency (2008) data set (n¼ 35) is shown in Figure 3, and forthe larger Environment Agency monitoring data set (n¼ 112)in Figure 4.
The Cu PNEC values calculated using either default majorion concentrations (Table 6), or by estimating themfrom Ca2þ concentrations, are closely comparable to thosecalculated using measured data for the individual parameters,and in all cases were within a factor of 2 of the true result.The use of default values for these parameters tends to resultin slightly lower accuracy than the use of estimatedconcentrations, although the difference is relatively small.The overall root mean squared error of the predictions for the2 test data sets combined is 2.26mg (Cu) l�1, for the PNECpredictions using estimated major ion concentrations, and4.64mg (Cu) l�1, for predictions using fixed default major ionconcentrations. The larger Environment Agency monitoringdata set (n¼ 112), with broader coverage of the UK, appears
to show a slight tendency toward overestimation of Cu PNECvalues when the PNEC is low (less than approximately5mg l�1), regardless of whether default or estimated major ionconcentrations are used (Figure 4). This may reflect theimportance of the inorganic chemical conditions in caseswhere DOC concentrations are low, and Cu bioavailability isconsequently high. The smaller Environment Agency (2008)data set (n¼ 35, Figure 3) does not show such a tendency foroverestimation of low PNEC values, and this may reflectdifferences in the range and types of water bodies includedwithin the 2 data sets. There is a general tendency towardunderestimation of the Cu PNEC at higher PNEC values inthis data set, and this tendency is increased by the use ofdefault, rather than estimated, major ion concentrations.
CONCLUSIONSThere is some loss of accuracy involved in using estimates
of major ion concentrations for BLM-based Cu PNECcalculations, although this must be considered alongsidepotential increases in efficiency where large numbers of sitesor samples must be processed. An important possiblealternative to using either measured or estimated concen-trations of major ions is to set the concentrations of the majorions to an arbitrary default value. The use of default valuesprovides a more precautionary estimate of the PNEC, whichis considerably reduced by the use of estimated concen-trations of major ion concentrations. The use of estimatedmajor ion concentrations in performing CuBLM calculationsprovides an increase in the accuracy of the PNEC predictionswhen compared to using default values, and requiresconsiderably less monitoring effort than the use of measuredconcentrations. The root mean squared error in the predic-tions of Cu PNEC values for all of the testing data whenmajor ion concentrations were estimated from Ca2þ concen-trations (2.3mg l�1), using the approach outlined here, is halfof that when the fixed default values were used as inputs formajor ion concentrations (4.6mg l�1).
These findings suggest that the relationships derived fromthe full SWAD data set (Figure 5) can be used to provide apractical means of improving CuBLM calculations in caseswhere measured data are unavailable and default valueswould typically be applied. It also reduces the need tomonitor for such a wide range of supporting parameters,which may be important if BLM principles are to be adoptedinto regulatory compliance assessment regimes. Because of
Table 6. Default concentrations for major ions used in CuBLMcalculations
Major ion Concentration (mg l–1)
Mg 0.3 � Ca
Na 3
K 1
SO4 10
Cl 10
Alkalinity a 50
aAlkalinity given as mg CaCO3/L.
Table 5. Intercept coefficients for relationships between log10 (Ca, mg/L) and log10 (ion, mg/L) for the datasets analyzed (mg CaCO3/L foralkalinity)
Dataset Mg2R NaR KR SO42� Cl� Alkalinity Na
ECI �0.275 0.103 �0.539 �0.077 0.276 0.188 4657
Non-UK �0.485 �0.056 �0.698 �0.234 0.072 0.085 1463
UK 0.114 0.505 �0.166 0.310 0.767 0.454 3194
Scotland �0.482 0.339 �0.667 �0.201 0.689 0.353 356
US �0.377 �0.114 �0.133 0.044 �0.492 1.111 250
ZnBLM b �2.120 �1.733 �2.764 �1.288 �1.513 �0.288 85
aN indicates the number of samples in the dataset.bRelationships for the ZnBLM are based on units of meq l�1, rather than mg l�1.
Simplification of input parameters for the copper BLM— Integr Environ Assess Manag 7, 2011 441
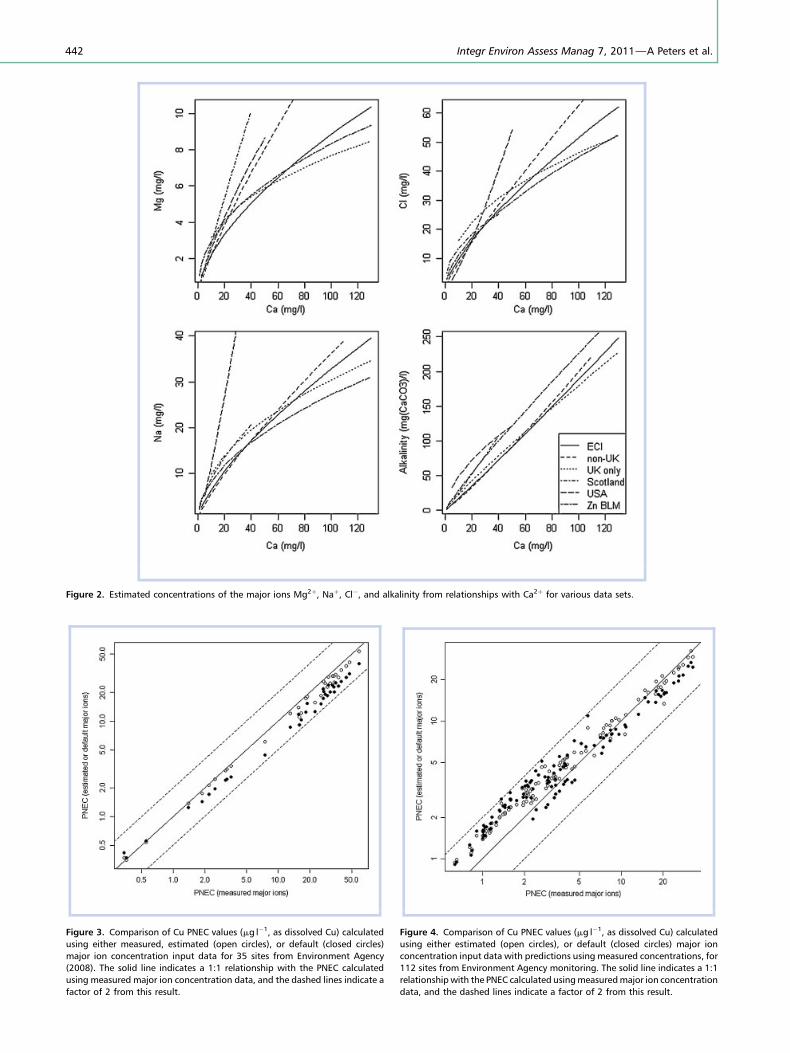
Figure 3. Comparison of Cu PNEC values (mg l�1, as dissolved Cu) calculated
using either measured, estimated (open circles), or default (closed circles)
major ion concentration input data for 35 sites from Environment Agency
(2008). The solid line indicates a 1:1 relationship with the PNEC calculated
using measured major ion concentration data, and the dashed lines indicate a
factor of 2 from this result.
Figure 4. Comparison of Cu PNEC values (mg l�1, as dissolved Cu) calculated
using either estimated (open circles), or default (closed circles) major ion
concentration input data with predictions using measured concentrations, for
112 sites from Environment Agency monitoring. The solid line indicates a 1:1
relationshipwith the PNEC calculated usingmeasuredmajor ion concentration
data, and the dashed lines indicate a factor of 2 from this result.
Figure 2. Estimated concentrations of the major ions Mg2þ, Naþ, Cl�, and alkalinity from relationships with Ca2þ for various data sets.
442 Integr Environ Assess Manag 7, 2011—A Peters et al.

the importance of Naþ and alkalinity in Cu bioavailability,relative to the other major ion concentrations which could beestimated using the relationships established here, the use ofmeasured data for both Naþ and alkalinity where suchinformation is available is recommended. The application ofsimilar regression approaches on a more localized basis mayprovide some improvement in accuracy, with a limitedadditional input of resources, and may be especially usefulin areas where local geological conditions result in waterchemistries that differ significantly from those reflected in thedata sets analyzed here.
Acknowledgment—This work was funded by the EuropeanCopper Institute. Thanks to the Environment Agency ofEngland and Wales for the provision of data for validationtesting.
REFERENCES[CCREM] Canadian Council of Resource and Environment Ministers. 1987.
Canadian Water Quality Guidelines. Ottawa, ON, Canada: Task Force on
Water Quality Guidelines of the Council of Resource. and Environment
Ministers, Environment Canada.
Comber S, Merrington G, Sturdy L, Delbeke K, van Assche F. 2008. Copper and zinc
water quality standards under the EU Water Framework Directive: The use of a
tiered approach to estimate the levels of failure. Sci Total Environ 403:12–22.
De Schamphelaere KAC, Janssen CR. 2004a. Development and field validation of a
biotic ligand model predicting chronic copper toxicity to Daphnia magna.
Environ Toxicol Chem 23:1365–1375.
De Schamphelaere KAC, Janssen CR. 2004b. Effects of dissolved organic carbon
concentration and source, pH, andwater hardness on chronic toxicity of copper
to Daphnia magna. Environ Toxicol Chem 23:1115–1122.
De Schamphelaere KAC, Janssen CR. 2006. Bioavailability models for predicting
copper toxicity to freshwater green micro-algae as a function of water
chemistry. Environ Sci Technol 40:4514–4522.
De Schamphelaere KAC, Heijerick DG, Janssen CR. 2006. Cross-phylum comparison
of a chronic biotic ligand model to predict chronic toxicity of copper to a
freshwater rotifer, Brachionus calyciflorus (Pallas). Ecotoxicol Environ Saf
63:189–195.
Di Toro DM, Allen HE, Bergman HL, Meyer JS, Paquin PR, Santore RC. 2001. Biotic
ligand model of the acute toxicity of metals. 1 Technical basis. Environ Toxicol
Chem 20:2383–2396.
[ECI] European Copper Institute. 2008. European Union risk assessment report on
copper, copper(II) sulfate pentahydrate, copper(I) oxide, copper(II) oxide,
dicopper chloride trihydroxide. Voluntary risk assessment, February 2008.
Figure 5. Plots of log10 (Camg l�1) against log10 (major ion concentration mg l�1) for Mg2þ, Naþ, Kþ, SO2-4 , Cl�, and alkalinity (asmg l�1 CaCO3) from the ECI
data set, showing linear regression lines for each parameter.
Simplification of input parameters for the copper BLM— Integr Environ Assess Manag 7, 2011 443

[cited 2011 February]. Available from: http://echa.europa.eu/chem_data/
transit_measures/vrar_en.asp
Environment Agency. 2007. Tiered approach to the assessment of metal
compliance in surface waters. Science Report SC050054/SR. UK
Environment Agency, Bristol, UK.
Environment Agency. 2008. Environmental Quality Standards for tracemetals in the
aquatic environment. Science Report SC030194/SR. UK Environment Agency,
Bristol, UK.
[HMSO] Her Majesty’s Stationery Office. 1989. Statutory Instrument 1989 No.
2286. Water, England and Wales. The Surface Waters (Dangerous Substances)
(Classification) Regulations 1989, Her Majesty’s Stationery Office, London, UK.
Niyogi S, Wood CM. 2004. Biotic ligand model, a flexible tool for developing site-
specific water quality guidelines for metals. Environ Sci Technol 38:6177–6192.
Santore RC, Di Toro DM, Paquin PR, Allen HE, Meyer JS. 2001. Biotic ligandmodel of
the acute toxicity of metals. 2 Application to acute copper toxicity in freshwater
fish and Daphnia. Environ Toxicol Chem 20:2397–2402.
The Netherlands. 2008. European Union risk assessment report on zinc metal,
zinc(II) chloride, zinc sulphate, zinc distearate, zinc oxide, trizinc
bis(orthophosphate). Prepared by The Dutch National Institute for Public
Health and the Environment (RIVM), on behalf of the European Union.
Van Sprang PA, Verdonck FAM, Van Assche F, Regoli L, De Schamphelaere KAC.
2009. Environmental risk assessment of zinc in European freshwaters: a critical
appraisal. Sci Total Environ 407:5373–5391.
Van Sprang P, Vangheluwe M, Van Hyfte A, Heijerick D, Vandenbroele M, Verdonck
F, Oorts K, Long K. 2008. Risk Characterisation. Chapter 3.3 in European Copper
Institute, 2008. p 70–92.
444 Integr Environ Assess Manag 7, 2011—A Peters et al.