regulation of+ inflammatory+ and lipid metabolism+ genes+ ... · regulation of+ inflammatory+ and...
TRANSCRIPT
1
Regulation of inflammatory and lipid metabolism genes by eicosapentaenoic acid-‐rich oil. Peter J. Gillies1§, Sujata K. Bhatia1†, Leigh A Belcher2, Daniel B. Hannon3, Jerry T. Thompson3 and John P. Vanden Heuvel3,4,*
1Central Research and Development, DuPont Experimental Station, E328/140B, PO Box 80328, Wilmington, DE 19880, USA; 2 DuPont Industrial Biosciences, Experimental Station E356 PO Box 80328, Wilmington, DE 19880 3 Department of Veterinary and Biomedical Sciences and Center for Molecular Toxicology and Carcinogenesis, 325 Life Sciences Building, Penn State University, University Park, PA 16802, USA.; 4INDIGO Biosciences, Inc., 1981 Pine Hall Road, State College, PA 16801.
§Present Address: Institute for Food, Nutrition and Health, Rutgers University, 63 Dudley Road New Brunswick, NJ 08901, USA †Present Address: Harvard School of Engineering and Applied Sciences Pierce Hall 29 Oxford Street Cambridge MA 02138
Abbreviated Title: Effect of EPA Rich Oil on Gene Expression
*Corresponding Author Jack Vanden Heuvel, PhD, Professor of Molecular Toxicology, Penn State University, 325 Life Sciences Building, University Park, PA 16802, T: (814) 863-‐8532, F: (814) 863-‐1696, [email protected]
by guest, on July 18, 2018w
ww
.jlr.orgD
ownloaded from
2
Abstract Omega-‐3 polyunsaturated fatty acids (ω3-‐PUFAs), eicosapentaenoic acid (EPA) and docosahexaenoic acid (DHA), are associated with prevention of various aspects of metabolic syndrome. In the present studies, the effects of oil rich in EPA on gene expression and activation of nuclear receptors was examined and compared to other ω3-‐PUFAs. The EPA-‐rich oil (EO) altered the expression of fatty acid metabolism genes in THP-‐1 cells including stearoyl CoA desaturase (SCD) and fatty acid desaturase 1 and 2 (FASDS1 and 2). Other ω3-‐PUFAs resulted in a similar gene expression response for a subset of genes involved in lipid metabolism and inflammation. In reporter assays, EO activated human PPARα and PPARβ/γ with minimal effects on PPARγ, LXR, RXR, FXR and RARγ; these effects were similar to that observed for purified EPA. When serum from a six week clinical intervention with dietary supplements containing olive oil (control), DHA or two levels of EPA were applied to THP-‐1 cells, the expression of SCD and FADS2 decreased in the cells treated with serum from the ω3-‐PUFA supplemented individuals. Taken together these studies indicate regulation of gene expression by the EPA-‐rich oil that is consistent with treating aspects of dyslipidemia and inflammation.
Supplemental Key Words: Omega-‐3 Polyunsaturated Fatty Acids; Steroyl CoA Desaturase; Fatty Acid Desaturase; Peroxisome Proliferator-‐Activated Receptor; Nuclear Receptors.
by guest, on July 18, 2018w
ww
.jlr.orgD
ownloaded from

3
Introduction
Cardiovascular disease (CVD) is the leading cause of death in industrialized countries and is of rising concern worldwide. The relationship between CVD and diet has been studied for nearly one hundred years, essentially since the first observation of high fat and cholesterol diets producing atherosclerosis in rabbits (1, 2). Diets rich in ω3 polyunsaturated fatty acids (ω3-‐PUFAs) such as alpha linolenic acid (ALA), eicosapentaenoic acid (EPA) and docosahexaenoic acid (DHA) are associated with decreased incidence and severity of several chronic diseases including CVD and cancer. At least some of the beneficial effects of these dietary fatty acids are via metabolites such as prostaglandins, leukotrienes, thromboxanes and resolvins. The effects of ω3-‐PUFAs are in contrast to fatty acids that differ mainly in position of the double bonds in the acyl chain, such as linoleic acid and arachidonic acid (ω6-‐PUFAs) and their corresponding metabolites. PUFAs in general are important for maintaining membrane integrity and as precursors to bioactive prostaglandins which regulate inflammation, blood clotting and lipid metabolism. Thus, it is necessary to have diets sufficient in PUFAs (ω3 and ω6) to maintain a variety of biological processes. Positive effects of diets high in ω-‐3 fatty acids include reducing abdominal fat, preventing cardiac arrhythmia, lowering serum triacylglycerol levels, decreasing thrombosis and improving endothelial function. As noted in Hu and Willett (3), several studies have shown association of fish intake and/or flaxseed oil (high in ALA) with decreased fatalities from CVD. Importantly, blood levels of EPA and DHA are strongly associated with decreased risk of death, myocardial infarction and stroke (3). In addition to playing a major role in CVD, chronic inflammation is a contributor to many human diseases. Omega-‐3 PUFAs play an important role in the regulation of inflammation by decreasing the production of inflammatory eicosanoids, cytokines, and reactive oxygen species and the expression of adhesion molecules (4, 5). EPA and DHA supplementation has proven effective in decreasing intestinal damage and improving gut histology in inflammatory bowel disease (6, 7). Fish oil supplementation decreases joint pain, number of tender and swollen joints, duration of morning stiffness and, as a result, decreased use of non-‐steroidal anti-‐inflammatory drugs (8). Proteins of the nuclear receptor (NR) superfamily act as intracellular transcription factors that directly regulate gene expression in response to lipophilic molecules (9-‐12). They affect a wide variety of functions, including fatty acid metabolism, inflammatory responses, cancer, reproductive development, and detoxification of foreign substances. Several NRs respond to dietary lipids and include the fatty acid receptors peroxisome proliferator-‐activated receptors (PPARs), liver X receptors (LXRs), retinoid X receptor (RXRs) and farnesoid X receptor (FXR). This particular subset of proteins may be considered constituents of a large group of NRs, the “metabolic nuclear receptors” which act as overall sensors of metabolic intermediates, xenobiotics and compounds in the diet and allow cells to respond to environmental changes by inducing the appropriate metabolic genes and pathways (9, 12). The goals of the present study were to use multiple approaches to examine the effects of ω-‐3 PUFAs on gene expression in macrophages and to extrapolate these
by guest, on July 18, 2018w
ww
.jlr.orgD
ownloaded from
4
findings to a clinical study examining a dietary supplement enriched in EPA. Altered gene expression by several ω3-‐PUFAs was examined in a commonly employed human macrophage cell line (differentiated THP-‐1 cells), proceeded by an inflammatory challenge (lipopolysaccharide (LPS) stimulation). In addition, nuclear receptor activity profiling was employed to compare potential molecular targets of n3-‐PUFAs. Together, these studies show differences in gene expression patterns and NR specificity among the ω3-‐PUFAs. Also, genes that are particularly sensitive to ω3-‐PUFA were identified that could aid in examining the clinical effectiveness of dietary supplements.
by guest, on July 18, 2018w
ww
.jlr.orgD
ownloaded from

5
Methods
Chemicals Alpha linolenic acid (ALA), Steariodonic Acid (SDA), Eicosapentaenoic acid (EPA), Docosapentaenoic acid (DPA) and Docosahexaenoic acid (DHA) were purchased from Sigma-‐Aldrich (St. Louis, MO). FBS was purchased from HyClone (Logan, UT). Geneticin was purchased from Invitrogen (Grand Island, NY). The EPA-‐rich oil (triglyceride form) used in this study is a proprietary product manufactured under contract and was provided by the study sponsor DuPont Applied Biosciences, Wilmington, DE. DuPont has developed an oleaginous yeast that produces an oil rich in EPA at 35% of fatty acid content and linoleic acid at 20% of content and which is low in all other fatty acids (<7%).
Preparation of BSA conjugated fatty acids Due to the aqueous insolubility, all free fatty acids were conjugated to fatty acid-‐free bovine serum albumin (BSA) for treatments (molar ratio of 4:1 fatty acid:BSA). The EPA-‐rich oil was saponified and fatty acids extracted as described previously {Torres 2001}. Molecular weight of EO was determined by average of the components and estimated at 290 g/mol. Fatty acids were weighed and dissolved in ethanol as a stock concentration of 0.5 M. A total of 32 μl stock solution was transferred to a brown glass vial and dried under argon while equal volume of ethanol was dried in another vial as a vehicle control. A total of 132 μl of 0.15 M KOH was added to both vials, vortexed, and incubated for 1 h at 70°C under argon. Following the incubation, 2 ml of filter-‐sterilized BSA (2 mM) in PBS was added to the fatty acids and the vehicle control to achieve a final concentration of 8 mM. The pH was adjusted to 7.2 to 7.4. The BSA-‐conjugated fatty acid and its BSA control were stored at –20 °C under argon until use.
Cell Culture and Treatments THP-‐1 (Homo sapiens monocyte) cells were obtained from the American Type Culture Collection (ATCC; Rockville, MD) and cultured in RPMI 1640 with 10% heat inactivated FBS, 50 μM 2-‐mercaptoethanol, 1 mM sodium pyruvate, and antibiotics. These cells were seeded in 24-‐well plates at a density of 3×10⁵/well and differentiated into macrophages with 100 nmol/L phorbol 12-‐myristate 13-‐acetate (Sigma) for 48 hours. For in vitro treatment experiments, THP-‐1 cells were grown to 75% confluency and treated with 0, 1, 10 and 100 µM of the EPA enriched oil or fatty acids as BSA conjugates. Eighteen hours after treatment, the cells will be stimulated with 10 ng/mL LPS for 6 hr. For ex vivo experiments, THP-‐1 cells were cultured as described above and treated with 10% (v/v) human serum from individual subjects for 18 hours, after which the cells were stimulated with LPS for 6 hr.
RNA extraction, reverse transcription, real time PCR Total RNA was isolated by Qiagen RNeasy Mini Kit (Qiagen, Valencia, CA) according to the manufacturer’s instructions. The total RNA was reverse transcribed using the ABI High Capacity cDNA archive kit (Applied Biosystems, Foster City, CA). Standard curves were made using serial dilutions from pooled cDNA samples. Real-‐time polymerase
by guest, on July 18, 2018w
ww
.jlr.orgD
ownloaded from
6
chain reaction (PCR) was performed with the use of the SYBR Green PCR Master Mix (Applied Biosystems) according to the manufacturer’s protocol and amplified on the ABI Prism 7000 Sequence Detection System. Detailed information on primer sequences is provided in Supplementary Materials and Methods.
Microarray Experiments and Statistical Analysis THP-‐1 cells were treated with EPA-‐rich oil at three concentrations (1, 10 and 100 μM) or control (BSA) for 16 hours followed by stimulation with LPS for 6 hr. RNA was extracted using Qiagen RNeasy and quality assessed by RNA Nano Chips on the Agilent Bioanalyzer. Each sample was labeled using the Affymetrix IVT Express Kit according to the manufacturer’s protocol. The GeneChip Human Genome U133A 2.0 (Affymterix), representing 14,500 well-‐characterized genes, was hybridized with the labeled RNA using GeneChip Hybridization Wash and Stain Kit (#702232) in the Affymetrix GeneChip Hybridization Oven 640, according to the manufacturer’s instructions. Following hybridization the arrays were washed and stained using the Affymetrix GeneChip Fluidics Station 450 according to the manufacturer’s protocol and scanned using the GeneChip Scanner 3000 7G. The scanned image file (DAT) and the intensity data (CEL) was imported into GeneSpring 10.0 (Agilent Technologies). The Robust Multi-‐array Average (RMA) was used to normalize the data (22,277 entities) and filtered on expression (>20% percentile in at least 1 of 12 samples, 18,497 entities). The twelve slides were grouped based on dose (four doses; 0, 1, 10, 100 µM, n=3 per dose) and one-‐way ANOVA with asymptotic p-‐value and Benjamini-‐Hochberg multiple corrections was performed. At a p-‐value of 0.01, a total of 798 entities were significantly regulated, of which 58 exhibited expression differences of 2-‐fold when compared to the control group. The group of genes was examined by hierarchical clustering using complete linkage analysis of the normalized data (JMP 7.0 , SAS Institute, Cary, NC).
Nuclear Receptor Reporter Assays Human PPARα, PPARβ/δ, PPARγ, LXRβ, RXRα and FXR reporter assay systems were purchased from INDIGO Biosciences, Inc. (State College, PA). Assays were performed according to the manufacturer’s instructions.
Effects of omega-‐3 fatty acid supplementation, ex vivo. Serum samples for ex vivo studies were collected from subjects enrolled in a double-‐blinded, placebo-‐controlled, parallel design study of 121 subjects randomized into 4 treatment groups. There were 26,27, 29, and 28 completers in the placebo olive oil group, low dose EPA group (600 mg/day), high dose EPA group (1800 mg/day) and the DHA group (600 mg/day) respectively. Of the completing subjects, the mean age was 52 years, 67% were male, 33% were female (all post-‐menopausal), 70% were white, 26% were black, 3% were Asian and 1% were Hispanic. The mean body mass index of the group was 27.4 kg/m2.The human protocol was approved by Schulman Associates Institutional Review Board, Cincinnati, OH. This study was registered at ClinicalTrials.gov as NCT00988585, and was given the identification number DuPont-‐0609. Study capsules were manufactured under contract and were provided by the study sponsor DuPont Applied Biosciences, Wilmington, DE. DuPont has developed an oleaginous yeast that
by guest, on July 18, 2018w
ww
.jlr.orgD
ownloaded from

7
produces an oil rich in EPA at 38% of fatty acid content and linoleic acid at 20% of content and which is low in all other fatty acids (<7%). At the time of the enrollment visit all qualifying and consenting subjects were randomly allocated into a protocol where they were required to take two 1 gram capsules three times daily which contained a total of either: 1) 6 g/day of olive oil placebo, 2) 600 mg/day of eicosapentaenoic acid (EPA)/day and 4.42 g/day of olive oil, 3) 1800 mg of EPA/day and 1.26 g/day of olive oil, and 4) 600 mg of DHA/day. The olive oil placebo, the low dose EPA oil, the high dose EPA oil, and the DHA oil supplements in total mg contained: oleic acid 3,954, 2,906, 852, and 145 mg; palmitic acid 696, 542, 218, and 187 mg; stearic acid 26.1, 26.4, 25.7 and 0.0 mg, myristic acid 0, 1.8, 3.0, and 223 mg, linoleic acid 92.3, 120.9, 176.0 and 0.0 mg, alpha linolenic acid 5.6, 14.6, 31.8 and 0.0 mg, EPA 0.0, 627, 1869, and 1.73 mg, and DHA 0.0, 0.0, 4.8 and 600 mg, respectively. (See Supplemental Table 2 for additional details). Over the entire 42 days the study subjects were expected to have consumed a total of 252 capsules. Compliance was calculated as a percentage of consumed capsule count/expected capsule count based on the number of days the subject was in the study.
At the time of the enrollment visit all qualifying and consenting subjects were randomly allocated into four treatment groups described above. Subjects were asked to fast for 12 hour prior to blood draws that occurred prior to intervention (baseline) and after six weeks of consuming the capsules. Serum was prepared and frozen until examined. THP-‐1 cells were cultured and treated with serum obtained from the clinical study diluted in media (10% v/v, (13)) for 16 hours followed by treatment with LPS for 6 hr. RNA was extracted and quantitative PCR performed as described above.
Specialized Laboratory Measures Using plasma aliquots, frozen at -‐80 degrees C and never thawed, obtained at the baseline and 6 week visits we carried out a wide variety of biochemical assays. Total cholesterol, triglyceride, and HDL cholesterol were measured as previously described (14). Direct LDL cholesterol and small dense LDL cholesterol levels were measured using kits obtained from Denka-‐Seiken Corporation, Tokyo, Japan) (15). Triglyceride-‐rich lipoprotein (TRL) cholesterol was calculated by subtraction of direct LDL and HDL cholesterol values from total cholesterol. Analysis of the fatty acid profile of total serum phospholipids were determined at Nutrasource Diagnostics, Guelph, Canada in a blinded fashion as described (16, 17) Serum was subjected to Folch extraction, and phospholipids were separated by thin layer chromatography. Fatty acid methyl esters were prepared from the phospholipid fraction and measured on a Varian 3400 gas-‐liquid chromatograph using a 60-‐meter DB-‐23 capillary column (0.32mm internal diameter).
Statistical Analysis One-‐way ANOVA, followed by Dunnett’s post-‐hoc test, was used to test the difference between treatments (P < .05). The values were expressed as mean ± SEM. All data analyses were performed by JMP 7.0 (SAS Institute, Cary, NC) and data plotted by Prism 5.01 (GraphPad Software, Inc., San Diego, CA).
by guest, on July 18, 2018w
ww
.jlr.orgD
ownloaded from

8
Results
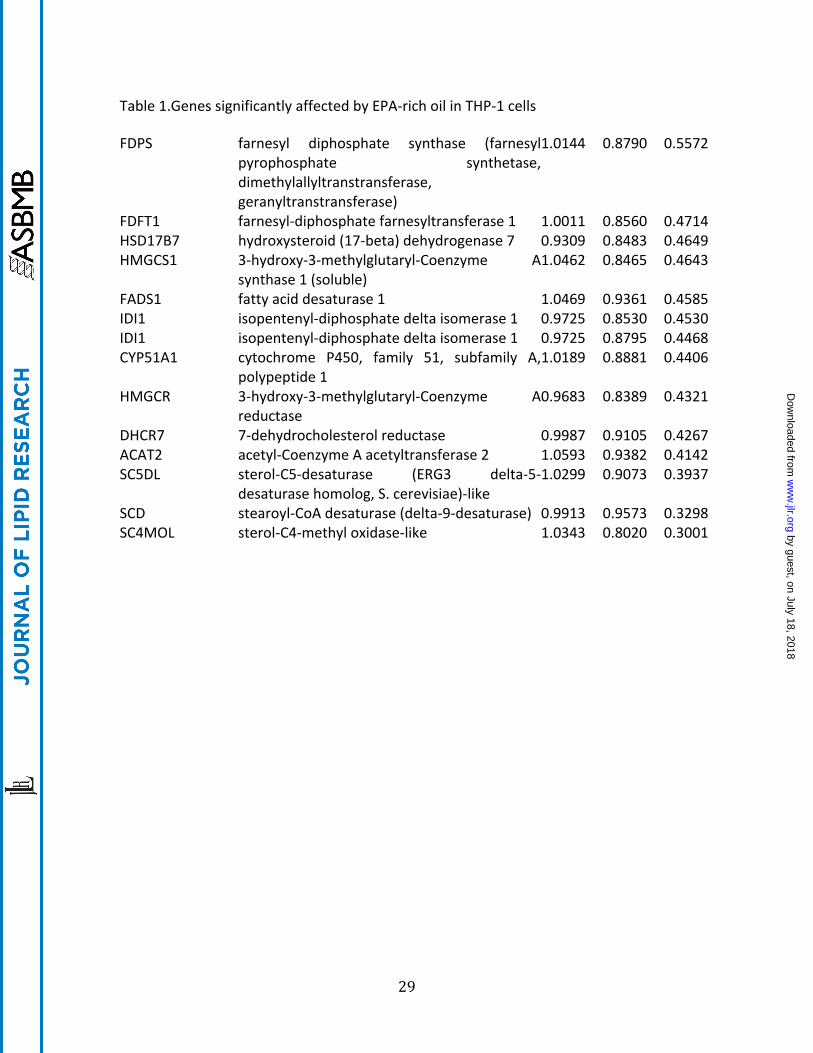
Comprehensive Analysis of Gene Expression. The design of the present experiments was aimed to understand the anti-‐inflammatory effects of ω3-‐PUFA oil and to identify sensitive biomarkers for subsequent studies. The THP-‐1 monocytes were treated with EPA-‐rich oil (EO) for 16 hr followed by stimulation with LPS and the RNA was used to examine gene expression via high-‐density microarray. A total of 798 genes were significantly regulated (corrected p-‐value 0.01) by EO in a dose-‐dependent manner as assessed by One-‐way ANOVA, of which 58 were 2-‐fold different than control at a minimum of one dose of EO (Table 1 and Figure 1). The dose-‐dependent regulation of gene expression followed three predominant trends: genes that are increased at the highest dose of EO (i.e. PLAU, TGFβ1, COL10A); genes that are decreased at the highest dose of EO (i.e. SCD1, CYP51A, IDI1, ACAT2) and; genes that are decreased at low doses but increased at high doses of EO (i.e. ILF3, SLC16A3)(Figure 1). The predominant function of EO regulated genes was steroid, sterol, lipid isoprenoid biosynthesis and metabolism (Supplemental Table 2). This subset of genes was examined for common transcriptional regulators using Ingenuity Pathway Analysis (IPA 9.0, Ingenuity Systems, Inc., Redwood City, CA) as shown in Supplemental Figure 1. Several nuclear receptors including the peroxisome proliferator-‐activated receptors (PPARs) and the Liver X receptors (LXRs), as well as the nuclear factor κB complex (NFκB), were implicated in the gene expression patterns observed.
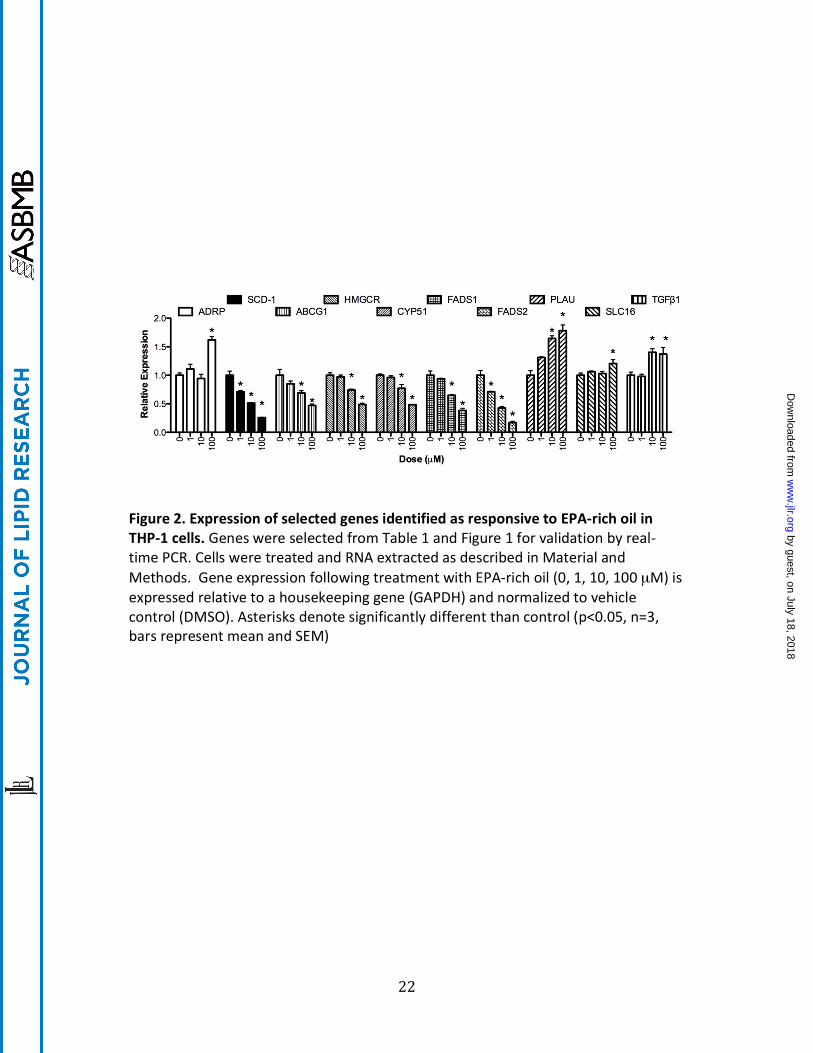
Quantitative real-‐time PCR was used to confirm a subset of transcripts identified by the microarray experiments. Care was taken to choose genes that were both increased and decreased by EO treatment as well as those with known biological functions. In addition, since the desire was to find sensitive biomarkers of EO response, genes that were significantly affected at the 1 µM EO in the microarray experiment were of particular interest. As shown in Figure 2, all genes studied were significantly regulated by EPA oil, albeit to a different extent and with varying potency. Some mRNAs such as ADRP and SLC16A were induced only at the highest concentration of EO (100 µM) whereas SCD-‐1 and FADS2 were significantly repressed at the lowest dose (1 µM). Transcripts for ABCG1, HMCGR, CYP51, FADS1, PLAU and TGFβ2 showed intermediate sensitivity with significant alterations in quantity starting at 10 µM EO.
Structure Activity Relationships The genes regulated by EPA-‐rich oil were compared to that of an equal dose (100 µM) of ω-‐3 PUFAs, α-‐linolenic acid (ALA), docasahexaenoic acid (DHA), docasapentaenoic acid (DPA), eicasopentaenoic acid (EPA) and stearidonic acid (SDA). THP-‐1 cells were treated with the fatty acids and subsequently stimulated with LPS or control. Figure 3 depicts the effects of ω-‐3 PUFA treatment on the LPS-‐stimulated cells. The repression of gene expression for SCD-‐1, ABCG1, HMGCR, CYP51, FADS1 and 2 was similar among the fatty acids and EO in that all treatments significantly decreased mRNA amounts. Similarly, PLAU mRNA was induced by EO and the fatty acids examined. ADRP mRNA was increased by DHA and DPA and was not affected by other ω-‐3 PUFAs whereas TGFβ1 mRNA was increased by EO, DPA and EPA treatment. The effects of EO
by guest, on July 18, 2018w
ww
.jlr.orgD
ownloaded from

9
(1, 10 and 100 µM) and ω-‐3 PUFAs at 100 µM with or without LPS stimulation on gene expression is shown in Supplemental Figure 1. In general, the alterations in gene expression were more evident in the LPS-‐treated THP-‐1 cells, due in part to higher variability in the unstimulated cells.
Transcription Factor Profiling The subset of genes regulated by EO in the microarray experiments was examined for common transcriptional regulators using Ingenuity Pathway Analysis (IPA 9.0, Ingenuity Systems, Inc., Redwood City, CA; Supplemental Figure 2). Several nuclear receptors (NRs) were identified as being transcriptional regulators of EO-‐responsive genes including liver-‐X-‐receptor (LXR) α and β (NR1H3 and 2), glucocorticoid receptor (GR, NR3C1), thyroid hormone receptor β (TRβ), peroxisome proliferator-‐activated receptor (PPAR) α and γ (NR1C1 and 3) and estrogen receptor (ER) α (NR3B1). These ligand-‐activated transcription factors and several others identified or speculated to be fatty acid receptors were examined in whole cell receptors assays for regulation by EO. Significant dose-‐response regulation by EO of the PPARs (α, β/δ and γ), retinoid-‐X-‐receptor β (RXRβ), farnesoid X receptor (FXR) and retinoic acid receptor γ (RARγ) was seen (Figure 4). In contrast, ERα, ERβ, LXRα, LXRβ, TRα, vitamin D receptor (VDR), and constitutive androstane receptor, variant 3 (CAR3) activity was not affected by EPA oil treatment (data not shown). PPARα (10-‐fold) and PPARβ/δ (13-‐fold) were the most activated by EO, followed by RXRα (6-‐fold), RARγ (3-‐fold) and FXR (2-‐fold). The dose-‐response activation of these six nuclear receptors was examined for ω-‐3 PUFAs (Supplemental Figure 3), and the activation in comparison to EO at the 100 µM concentration is shown in Figure 5. PPARα was responsive to all fatty acids examined with activation of approximately 10-‐fold. The largest response observed was for EPA activation of PPARβ/δ (35-‐fold). PPARγ showed a distinct preference for DHA and DPA relative to the other fatty acids. EPA-‐rich oil was the most efficacious activator of FXR, albeit only a 2-‐fold activation.
Effects of ω-‐3 PUFAs on gene expression ex vivo
The hypothesis tested herein was that bioactive molecules are present in human serum following supplementation with EPA that affects gene expression. Studies performed in vitro indicated that FADS2 and SCD1 are sensitive to EO and individual ω3-‐PUFAs and those were chosen for these studies along with two inflammatory genes (IL1α and IL6) that are affected in vitro and in vivo by fatty acids. Serum from baseline and following 6 weeks of dietary supplementation was used as a treatment medium (10% v/v) for LPS stimulated THP-‐1 cells. As shown in Figure 6, the general trend is for a decrease expression of IL1α, IL6, FADS2 and SCD1 mRNA in THP-‐1 cells treated with serum obtained from the ω3-‐PUFA supplemented individuals compared to the olive oil administered group; the differences were significant for serum from the DHA treated individuals.
Alteration in serum fatty acid profile and correlation to ex vivo gene expression
by guest, on July 18, 2018w
ww
.jlr.orgD
ownloaded from

10
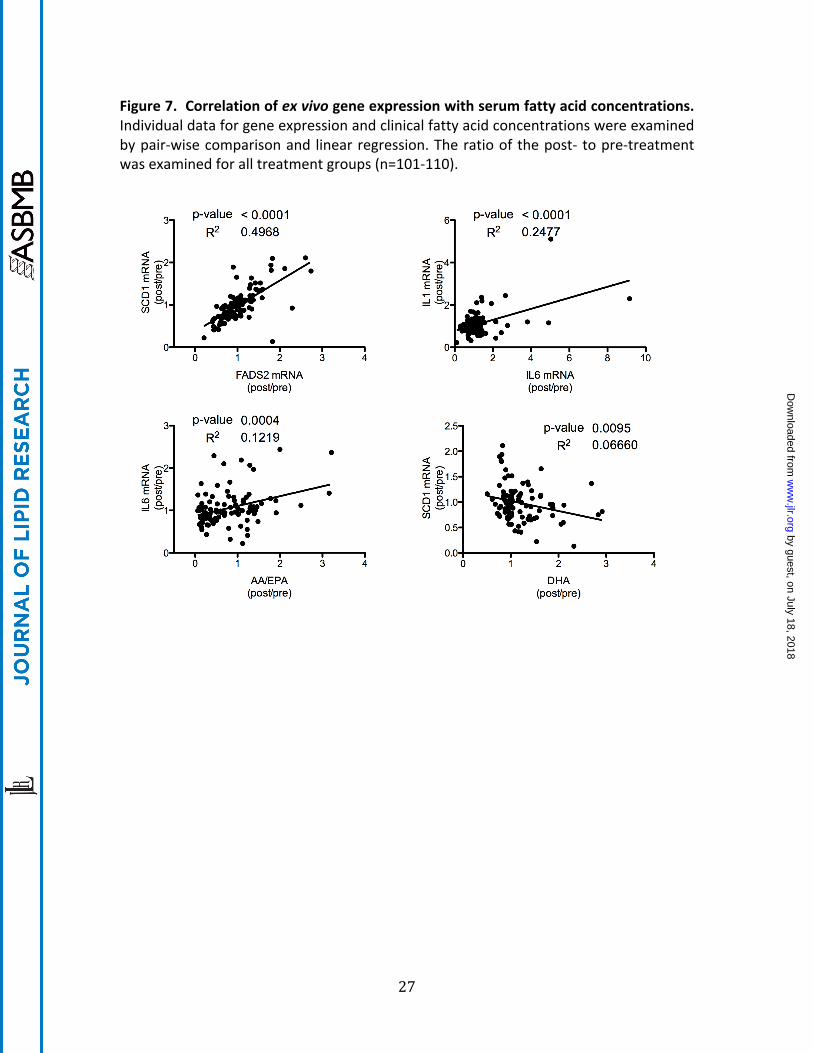
The effects of supplementation with EPA and DHA on serum fatty acid profile is shown in Table 2. The placebo control had no effect on absolute or relative ω3-‐PUFA levels. The lower dose of EPA resulted in significant increases in total ω-‐3 and ω3/ω6 and EPA and decreased arachidonic acid (AA)/EPA ratio. When the dose of EPA was increased, in addition to the previously observed effects, the total AA and the SCD18 index (ratio of 18:1(n-‐9)/18:0) decreased. DHA administration increased total ω3, ω3/ω6 and DHA while decreasing AA/DHA, AA, EPA, SCD18 index as well as SCD16 (ratio of 16:1(n-‐7)/16:0). In order to examine potential mediators for the ex vivo observations, the gene expression values were correlated with each other and with the serum fatty acid profile (see Supplemental Table 4 and Supplemental Figure 4 for more details). As shown in Figure 7, SCD1 and FADS2 mRNA alterations as well as IL6 and IL1 mRNA changes were significantly correlated. In addition, the ratio of AA to EPA correlated with IL6 mRNA and serum DHA affected SCD1 mRNA expression ex vivo.
by guest, on July 18, 2018w
ww
.jlr.orgD
ownloaded from

11
Discussion Animal experiments and human studies have shown that ω3-‐PUFAs regulate genes in various tissues including adipose tissue and peripheral blood mononuclear cells (PBMCs). There have been several comprehensive analysis of transcription responses to ω3-‐PUFAs including in PBMC following fish oil supplementation (18), in adipose tissue following a high PUFA diet in human (19) and mice (20), in breast cancer cell lines treated with EPA and DHA (21), and colon cancer cells treated with DHA (22), to name a few. In the present studies, the model system was biased to examine the anti-‐inflammatory responses of ω3-‐PUFAs by using a human monocytic cell line challenged with LPS. Despite this choice of model, many of the genes regulated by EO were involved in cholesterol, sterol and lipid metabolism. This is consistent with clinical observations whereby the predominant effect of ω3-‐PUFA dietary supplementation is the lowering of circulating triglyceride levels (23-‐26). In fact, the lipid lowing effect is often seen in the absence of an anti-‐inflammatory response (27). In general, the favorable effects of 3-‐PUFAs mainly results from the combined effects of decreased expression of lipogenesis related genes and stimulation of fatty acid oxidation transcripts. Fish oil decreases expression of sterol response element binding protein-‐1c (SREBP-‐1c) (28), a key enzyme in controlling lipogenesis. Other lipogenic genes are decreased by ω3-‐PUFAs including fatty acid synthase (FAS), malic enzyme and glucose-‐6-‐phosphate dehydrogenase (G6PD) (11). In the liver, several genes involved in fatty acid metabolism are increased by PUFAs including apolipoproteins AI and AII A (ApoAI, AII), acyl-‐CoA synthetase, acyl-‐CoA oxidase (ACO), liver fatty acid–binding protein (L-‐FABP), carnitine palmitoyl transferase (CPT-‐1), and cytochrome P450 4A1 (CYP4A1) (11). Although the genomic response to EO in THP-‐1 cells showed a preponderance of lipid metabolism genes, the pathways affected were generally lipogenic genes and were decreased upon treatment. This pattern is more reminiscent of the response of adipocytes (29) than of hepatocytes to ω3-‐PUFA treatment.
Fatty acid elongation and desaturation are two key metabolic routes for the synthesis of saturated, monounsaturated, and polyunsaturated fatty acids. Of these, fatty acid desaturases have received considerable attention for their regulation by hormones and nutrients and their capacity to generate specific unsaturated fatty acids. One of these enzymes, stearoyl-‐CoA desaturase-‐1 (SCD-‐1, delta 9 desaturase (D9D)), has emerged as a key enzyme in the control of whole body lipid composition (30). Although oleate is found ubiquitously throughout the body, endogenously derived oleate from SCD is special in terms of its preferential trafficking through acyl-‐coenzyme A:diacylglycerol acyltransferase 2 and driving TG synthesis. Omega-‐3 fatty acids decrease SCD-‐1 mRNA expression in liver and this effect is correlated with decreased circulating TG (31). In addition, decreased SCD-‐1 expression in macrophages by ALA is associated with increased cholesterol efflux (32), a beneficial response in terms of reverse cholesterol transport. Delta-‐5 Desaturase (D5D, Fatty acid desaturase 2 (FADS1)) and Delta-‐6 desaturase (D5D, FADS2) are the key enzymes for the synthesis of PUFAs such as arachidonic acid and DHA. Elovl-‐1 (Ssc1) and Elovl-‐6 (LCE, FACE, rElo2) elongate saturated and monounsaturated fatty acids. Omega-‐3 PUFAs decease the expression of
by guest, on July 18, 2018w
ww
.jlr.orgD
ownloaded from

12
D6D and D5D (decreased levels of PUFAs increases their expression) as well as Elovl-‐6; however, the conversion of ALA to longer chain PUFAs is regulated by substrate levels to a greater extent than expression of the synthetic enzymes (33). Nonetheless, the repression of FADS1 and FADS2 as well as SCD1 in macrophages are among the most sensitive biomarkers for EO response.
The sensitivity of FADS2 and SCD1 to EO treatment in vitro made them likely choices for examination in the ex vivo experiments. In addition, the inflammatory markers interleukin 1 and 6 (IL1 and IL6) are typically decreased by ω3-‐PUFA treatment in vitro and in vivo (34, (27).). In these studies, serum from individuals given various supplements were used as a treatment to THP-‐1 cells; this approach has been used previously by our laboratory and others as a means to assess alterations in circulating bioactive molecules following a treatment or diet (13, 36-‐38). The expression on these genes would be expected to be lower following administration of serum to THP-‐1 cells from the 6 week treatment with EO compared to serum taken at baseline. In fact, there is a dose-‐dependent trend for decreased ex vivo expression of FADS2 and SCD1, although it only reached statistical significance in the DHA group. The individual’s ex vivo SCD1 and FADS2 response are significantly correlated, as are the IL1 and IL6 responses. In contrast, the FADS2 and SCD1 responses were not indicative of changes in interleukin expression (Supplemental Table 4). This may be reflective of similar mechanisms of gene expression for SCD1 and FADS2 that differs from IL1 and 6. Of note is the fact the one’s serum DHA change (post treatment/pre-‐treatment) is inversely associated with the ex vivo SCD-‐1 mRNA (post/pre). Similarly, the change in ratio of AA to EPA in the serum is correlated with the ex vivo expression of IL1 and IL6. Principal Component Analysis (PCA) of the individual post-‐/pre-‐treatment values for the fatty acid concentration as well as the ex vivo gene expression showed a similar observation with AA/EPA being more associated with IL1 and IL6 mRNA whereas AA/DHA clustered with SCD1, FADS2 as well as the SCD16 and 18 ratios (Supplemental Figure 4). Together, this data shows that altering DHA and EPA concentrations may impact different endpoints preferentially.
Often the biological responses of the predominant ω3-‐PUFAs, ALA, EPA and DHA, are considered to be equivalent or interchangeable, although it is generally held that the marine based fatty acids are more beneficial than their plant based counterparts (5, 39). In the present studies, the altered gene expression of a small subset of genes (Figure 3) suggests that they do in fact lead to similar genomics responses in vitro. However, more comprehensive analysis of gene expression following treatment with ω3-‐PUFAs shows that there are subsets of genes that are affected by particular fatty acid structures, in particular at higher doses (Vanden Heuvel, unpublished results). This may be the result of differential metabolism of ALA, EPA and DHA to various bioactive molecules and/or interaction with specific transcription factors, enzymes and receptors. In addition, as mentioned above, the ex vivo studies suggest that serum from individuals on the EO supplements differed than those from DHA supplemented cohorts, further illustrating that these two ω3-‐PUFAs are similar but are not fully interchangeable.
by guest, on July 18, 2018w
ww
.jlr.orgD
ownloaded from
13
Of the several identified fatty acid receptors, perhaps the family that can best explain the effects of ω3-‐PUFAs are the PPARs. The PPARs exist as three subtypes (α, β and γ) that vary in expression, ligand recognition and biological function. PPARα was the first transcription factor identified as a prospective fatty acid receptor (reviewed in (40-‐42)) and is involved in fatty acid transport, fatty acid binding proteins, fatty acyl CoA synthesis, microsomal, peroxisomal and mitochondrial fatty acid oxidation, ketogenesis and fatty acid desaturation. PPARβ/δ is ubiquitously expressed and is often found in higher abundance than PPARα or γ. Examination of the PPARβ/δ null mice has shown a role for this NR in development, myelination of the corpus callosum, lipid metabolism, and epidermal cell proliferation (43). PPARγ is expressed in many tissues including adipose, muscle, vascular cells, macrophages and epithelial cells of the mammary gland, prostate and colon (reviewed in (44)). Activated PPARγ induces LPL and fatty acid transporters (CD36), and enhances adipocyte differentiation, as well as inhibits cytokine and cylcooxygenase 2 (COX-‐2) expression. The EPA enriched oil and individual ω3-‐PUFAs activated PPARα to a similar extent, with little distinction. In fact, this NR is activated by ω6-‐PUFAs (45), and metabolites of fatty acids including epoxyeicosatrienoic acids (EETs), hydroxyepoxyeicosatrienoic acids (HETEs) (46), Leukotriene B4 (LTB4) (47), and Prostaglandins PGD2 (48). The least studied member of the PPAR family, PPARβ/δ, was preferentially activated by EPA and showed the highest level of activation of any NR by EO. ALA was the weakest activator of PPARβ/δ among the ω3-‐PUFAs with induction similar to the ω6-‐PUFA linoleic acid (not shown). Prostaglandin A1 (PGA1), PGD2 and PGD1 can activate PPARβ/δ in reporter assays (48). 15-‐HETE and the toxic lipid 4-‐hydroxynonenol (4-‐HNE) are also a PPARβ/δ activators (49). PPARγ has received considerable attention as a target of anti-‐diabetic and –inflammatory drugs. This NR was only marginally affected by EO and ω3-‐PUFAs, with the noted exception of DPA and DHA. Interestingly, the 5-‐lipoxygenase metabolite of DHA (4-‐hydroxy DHA) (50) and the COX-‐2 metabolites electrophilic oxo-‐derivatives (EFOX) (51), are a more potent PPARγ activators than the parent fatty acid and may be responsible for effects of this ω3-‐PUFA on angiogenesis and inflammation. Less distinctive structure activity relationships were noted for RXRα, a previously noted DHA receptor (52), and RARγ, a heretofore-‐unidentified fatty acid receptor. The differences in gene expression and transcription factor activation among the ω3-‐PUFA family can explain some of the differences in potency of biological and therapeutic responses and can point to specific recommendations for the individual fatty acids. For example, EPA may be of more benefit for diseases with a PPARβ/δ etiology whereas DHA is more amenable for PPARγ related therapies. This is especially important since genetic modification has been used to develop a new generation of plants (eg, corn and soy-‐beans) that produce seeds with a modified fatty acid profile for use as dietary supplements with specific health benefits in mind.
Taken together, these studies have shown that the EPA-‐rich oil alters gene expression in a human monocytic cell line, consistent with altered lipid metabolism and inflammation. This particular dietary supplement contrasts others on the market that
by guest, on July 18, 2018w
ww
.jlr.orgD
ownloaded from

14
are rich in other ω3-‐PUFAs such as DHA, SDA and ALA. Most of the responses observed for each ω3-‐PUFA supplement are similar and have beneficial properties against many aspects of metabolic syndrome. However, due in part to specificity of nuclear receptor activation as well as differential metabolism, each ω3-‐PUFA and corresponding supplement or diet must be considered a unique entity. Evidence is provided that EPA-‐rich oils may preferentially affect PPARβ/δ associated therapies, while DHA and other ω3-‐PUFA supplementation have their own subset of benefits. Hence, additional research is warranted to provide recommendations of ω3-‐PUFA supplements for specific outcomes.
by guest, on July 18, 2018w
ww
.jlr.orgD
ownloaded from

15
Acknowledgements This work was conducted under a contract between DuPont Inc. and Indigo Biosciences, Inc. JVH is an employee of Penn State University and has a financial stake with Indigo Biosciences, Inc. which may constitute a conflict of interest.
by guest, on July 18, 2018w
ww
.jlr.orgD
ownloaded from
16
References 1. Renaud S., and D. Lanzmann-‐Petithory. 2001. Coronary heart disease: dietary links and pathogenesis. Public Health Nutr 4:459-‐474.
2. Willett W. C. 2007. The role of dietary n-‐6 fatty acids in the prevention of cardiovascular disease. J Cardiovasc Med (Hagerstown) 8 Suppl 1:S42-‐S45.
3. Hu F. B., and W. C. Willett. 2002. Optimal diets for prevention of coronary heart disease. JAMA 288:2569-‐2578.
4. Calder P. C. 2003. N-‐3 polyunsaturated fatty acids and inflammation: from molecular biology to the clinic. Lipids 38:343-‐352.
5. Simopoulos A. P. 2002. Omega-‐3 fatty acids in inflammation and autoimmune diseases. J Am Coll Nutr 21:495-‐505.
6. Calder P. C. 2008. Polyunsaturated fatty acids, inflammatory processes and inflammatory bowel diseases. Mol Nutr Food Res 52:885-‐897.
7. Wild G. E., L. Drozdowski, C. Tartaglia, M. T. Clandinin, and A. B. R. Thomson. 2007. Nutritional modulation of the inflammatory response in inflammatory bowel disease-‐-‐from the molecular to the integrative to the clinical. World J Gastroenterol 13:1-‐7.
8. James M., S. Proudman, and L. Cleland. 2010. Fish oil and rheumatoid arthritis: past, present and future. Proc Nutr Soc 69:316-‐323.
9. Schulman I. G. 2010. Nuclear receptors as drug targets for metabolic disease. Adv Drug Deliv Rev 62:1307-‐1315.
10. Beaven S. W., and P. Tontonoz. 2006. Nuclear receptors in lipid metabolism: targeting the heart of dyslipidemia. Annu Rev Med 57:313-‐329.
11. Sampath H., and J. M. Ntambi. 2005. Polyunsaturated fatty acid regulation of genes of lipid metabolism. Annu Rev Nutr 25:317-‐340.
12. Francis G. A., E. Fayard, F. Picard, and J. Auwerx. 2003. Nuclear receptors and the control of metabolism. Annu Rev Physiol 65:261-‐311.
13. Zhang J., J. A. Grieger, P. M. Kris-‐Etherton, J. T. Thompson, P. J. Gillies, J. A. Fleming, and J. P. Vanden Heuvel. 2011. Walnut oil increases cholesterol efflux through inhibition of stearoyl CoA desaturase 1 in THP-‐1 macrophage-‐derived foam cells. Nutr Metab (Lond) 8:61.
14. Otokozawa S., M. Ai, B. F. Asztalos, C. C. White, S. Demissie-‐Banjaw, L. A. Cupples, K. Nakajima, P. W. F. Wilson, and E. J. Schaefer. 2010. Direct assessment of plasma low density lipoprotein and high density lipoprotein cholesterol levels and coronary heart disease: results from the Framingham Offspring Study. Atherosclerosis 213:251-‐255.
by guest, on July 18, 2018w
ww
.jlr.orgD
ownloaded from

17
15. Ai M., S. Otokozawa, B. F. Asztalos, Y. Ito, K. Nakajima, C. C. White, L. A. Cupples, P. W. Wilson, and E. J. Schaefer. 2010. Small dense LDL cholesterol and coronary heart disease: results from the Framingham Offspring Study. Clin Chem 56:967-‐976.
16. Dewailly E., C. Blanchet, S. Gingras, S. Lemieux, and B. J. Holub. 2002. Cardiovascular disease risk factors and n-‐3 fatty acid status in the adult population of James Bay Cree. Am J Clin Nutr 76:85-‐92.
17. Asztalos B. F., L. A. Cupples, S. Demissie, K. V. Horvath, C. E. Cox, M. C. Batista, and E. J. Schaefer. 2004. High-‐density lipoprotein subpopulation profile and coronary heart disease prevalence in male participants of the Framingham Offspring Study. Arterioscler Thromb Vasc Biol 24:2181-‐2187.
18. Bouwens M., O. van de Rest, N. Dellschaft, M. G. Bromhaar, L. C. P. G. M. de Groot, J. M. Geleijnse, M. Müller, and L. A. Afman. 2009. Fish-‐oil supplementation induces antiinflammatory gene expression profiles in human blood mononuclear cells. Am J Clin Nutr 90:415-‐424.
19. Radonjic M., M. J. van Erk, W. J. Pasman, H. M. Wortelboer, H. F. J. Hendriks, and B. van Ommen. 2009. Effect of body fat distribution on the transcription response to dietary fat interventions. Genes Nutr 4:143-‐149.
20. Flachs P., O. Horakova, P. Brauner, M. Rossmeisl, P. Pecina, N. Franssen-‐van Hal, J. Ruzickova, J. Sponarova, Z. Drahota, C. Vlcek, J. Keijer, J. Houstek, and J. Kopecky. 2005. Polyunsaturated fatty acids of marine origin upregulate mitochondrial biogenesis and induce beta-‐oxidation in white fat. Diabetologia 48:2365-‐2375.
21. Hammamieh R., N. Chakraborty, S. -‐A. Miller, E. Waddy, M. Barmada, R. Das, S. A. Peel, A. A. Day, and M. Jett. 2007. Differential effects of omega-‐3 and omega-‐6 Fatty acids on gene expression in breast cancer cells. Breast Cancer Res Treat 101:7-‐16.
22. Narayanan B. A., N. K. Narayanan, and B. S. Reddy. 2001. Docosahexaenoic acid regulated genes and transcription factors inducing apoptosis in human colon cancer cells. Int J Oncol 19:1255-‐1262.
23. Duda M. K., K. M. O'Shea, and W. C. Stanley. 2009. omega-‐3 polyunsaturated fatty acid supplementation for the treatment of heart failure: mechanisms and clinical potential. Cardiovasc Res 84:33-‐41.
24. Tanaka N., X. Zhang, E. Sugiyama, H. Kono, A. Horiuchi, T. Nakajima, H. Kanbe, E. Tanaka, F. J. Gonzalez, and T. Aoyama. 2010. Eicosapentaenoic acid improves hepatic steatosis independent of PPARα activation through inhibition of SREBP-‐1 maturation in mice. Biochem Pharmacol 80:1601-‐1612.
by guest, on July 18, 2018w
ww
.jlr.orgD
ownloaded from
18
25. Kjaer M. A., A. Vegusdal, T. Gjøen, A. C. Rustan, M. Todorcević, and B. Ruyter. 2008. Effect of rapeseed oil and dietary n-‐3 fatty acids on triacylglycerol synthesis and secretion in Atlantic salmon hepatocytes. Biochim Biophys Acta 1781:112-‐122.
26. Skulas-‐Ray A. C., S. G. West, M. H. Davidson, and P. M. Kris-‐Etherton. 2008. Omega-‐3 fatty acid concentrates in the treatment of moderate hypertriglyceridemia. Expert Opin Pharmacother 9:1237-‐1248.
27. Skulas-‐Ray A. C., P. M. Kris-‐Etherton, W. S. Harris, J. P. Vanden Heuvel, P. R. Wagner, and S. G. West. 2010. Dose-‐response effects of omega-‐3 fatty acids on triglycerides, inflammation, and endothelial function in healthy persons with moderate hypertriglyceridemia. Am J Clin Nutr :243-‐252.
28. Ide T. 2005. Interaction of fish oil and conjugated linoleic acid in affecting hepatic activity of lipogenic enzymes and gene expression in liver and adipose tissue. Diabetes 54:412-‐423.
29. Muhlhausler B. S., R. Cook-‐Johnson, M. James, D. Miljkovic, E. Duthoit, and R. Gibson. 2010. Opposing effects of omega-‐3 and omega-‐6 long chain polyunsaturated Fatty acids on the expression of lipogenic genes in omental and retroperitoneal adipose depots in the rat. J Nutr Metab 2010.
30. Cohen P., and J. M. Friedman. 2004. Leptin and the control of metabolism: role for stearoyl-‐CoA desaturase-‐1 (SCD-‐1). J Nutr 134:2455S-‐2463S.
31. Velliquette R. A., P. J. Gillies, P. M. Kris-‐Etherton, J. W. Green, G. Zhao, and J. P. Vanden Heuvel. 2009. Regulation of human stearoyl-‐CoA desaturase by omega-‐3 and omega-‐6 fatty acids: Implications for the dietary management of elevated serum triglycerides. J Clin Lipidol 3:281-‐288.
32. Zhang J., P. M. Kris-‐Etherton, J. T. Thompson, D. B. Hannon, P. J. Gillies, and J. P. Vanden Heuvel. 2011. Alpha-‐linolenic acid increases cholesterol efflux in macrophage-‐derived foam cells by decreasing stearoyl CoA desaturase 1 expression: evidence for a farnesoid-‐X-‐receptor mechanism of action. J Nutr Biochem .
33. Tu W. C., R. J. Cook-‐Johnson, M. J. James, B. S. Mühlhäusler, and R. A. Gibson. 2010. Omega-‐3 long chain fatty acid synthesis is regulated more by substrate levels than gene expression. Prostaglandins Leukot Essent Fatty Acids 83:61-‐68.
34. Zhao G., T. D. Etherton, K. R. Martin, J. P. Vanden Heuvel, P. J. Gillies, S. G. West, and P. M. Kris-‐Etherton. 2005. Anti-‐inflammatory effects of polyunsaturated fatty acids in THP-‐1 cells. Biochem Biophys Res Commun 336:909-‐917.
35. Skulas-‐Ray A. C., P. M. Kris-‐Etherton, W. S. Harris, J. P. Vanden Heuvel, P. R. Wagner, and S. G. West. 2011. Dose-‐response effects of omega-‐3 fatty acids on triglycerides, inflammation, and endothelial function in healthy persons with moderate hypertriglyceridemia. Am J Clin Nutr 93:243-‐252.
by guest, on July 18, 2018w
ww
.jlr.orgD
ownloaded from

19
36. Jenkins D. J., C. W. Kendall, E. Vidgen, S. Agarwal, A. V. Rao, R. S. Rosenberg, E. P. Diamandis, R. Novokmet, C. C. Mehling, T. Perera, L. C. Griffin, and S. C. Cunnane. 1999. Health aspects of partially defatted flaxseed, including effects on serum lipids, oxidative measures, and ex vivo androgen and progestin activity: a controlled crossover trial. Am J Clin Nutr 69:395-‐402.
37. Henning S. M., W. Aronson, Y. Niu, F. Conde, N. H. Lee, N. P. Seeram, R. P. Lee, J. Lu, D. M. Harris, A. Moro, J. Hong, L. Pak-‐Shan, R. J. Barnard, H. G. Ziaee, G. Csathy, V. L. Go, H. Wang, and D. Heber. 2006. Tea polyphenols and theaflavins are present in prostate tissue of humans and mice after green and black tea consumption. J Nutr 136:1839-‐1843.
38. Singhal R., T. M. Badger, and M. J. Ronis. 2007. Reduction in 7,12-‐dimethylbenz[a]anthracene-‐induced hepatic cytochrome-‐P450 1A1 expression following soy consumption in female rats is mediated by degradation of the aryl hydrocarbon receptor. J Nutr 137:19-‐24.
39. Gebauer S. K., T. L. Psota, W. S. Harris, and P. M. Kris-‐Etherton. 2006. n-‐3 fatty acid dietary recommendations and food sources to achieve essentiality and cardiovascular benefits. Am J Clin Nutr 83:1526S-‐1535S.
40. Hihi A. K., L. Michalik, and W. Wahli. 2002. PPARs: transcriptional effectors of fatty acids and their derivatives. Cell Mol Life Sci 59:790-‐798.
41. Montagner A., G. Rando, G. Degueurce, N. Leuenberger, L. Michalik, and W. Wahli. 2011. New insights into the role of PPARs. Prostaglandins Leukot Essent Fatty Acids .
42. Wahli W. 2002. Peroxisome proliferator-‐activated receptors (PPARs): from metabolic control to epidermal wound healing. Swiss Med Wkly 132:83-‐91.
43. Peters J. M., S. S. Lee, W. Li, J. M. Ward, O. Gavrilova, C. Everett, M. L. Reitman, L. D. Hudson, and F. J. Gonzalez. 2000. Growth, adipose, brain, and skin alterations resulting from targeted disruption of the mouse peroxisome proliferator-‐activated receptor beta(delta). Mol Cell Biol 20:5119-‐5128.
44. Spiegelman B. M. 1997. Peroxisome proliferator-‐activated receptor gamma: A key regulator of adipogenesis and systemic insulin sensitivity. Eur J Med Res 2:457-‐464.
45. Latruffe N., and J. Vamecq. 1997. Peroxisome proliferators and peroxisome proliferator activated receptors (PPARs) as regulators of lipid metabolism. Biochimie 79:81-‐94.
46. Cowart L. A., S. Wei, M. -‐H. Hsu, E. F. Johnson, M. U. Krishna, J. R. Falck, and J. H. Capdevila. 2002. The CYP4A isoforms hydroxylate epoxyeicosatrienoic acids to form high affinity peroxisome proliferator-‐activated receptor ligands. J Biol Chem 277:35105-‐35112.
by guest, on July 18, 2018w
ww
.jlr.orgD
ownloaded from
20
47. Krey G., O. Braissant, F. L'Horset, E. Kalkhoven, M. Perroud, M. G. Parker, and W. Wahli. 1997. Fatty acids, eicosanoids, and hypolipidemic agents identified as ligands of peroxisome proliferator-‐activated receptors by coactivator-‐dependent receptor ligand assay. Mol Endocrinol 11:779-‐791.
48. Yu K., W. Bayona, C. B. Kallen, H. P. Harding, C. P. Ravera, G. McMahon, M. Brown, and M. A. Lazar. 1995. Differential activation of peroxisome proliferator-‐activated receptors by eicosanoids. J Biol Chem 270:23975-‐23983.
49. Coleman J. D., K. S. Prabhu, J. T. Thompson, P. S. Reddy, J. M. Peters, B. R. Peterson, C. C. Reddy, and J. P. Vanden Heuvel. 2007. The oxidative stress mediator 4-‐hydroxynonenal is an intracellular agonist of the nuclear receptor peroxisome proliferator-‐activated receptor-‐beta/delta (PPARbeta/delta). Free Radic Biol Med 42:1155-‐1164.
50. Sapieha P., A. Stahl, J. Chen, M. R. Seaward, K. L. Willett, N. M. Krah, R. J. Dennison, K. M. Connor, C. M. Aderman, E. Liclican, A. Carughi, D. Perelman, Y. Kanaoka, J. P. Sangiovanni, K. Gronert, and L. E. H. Smith. 2011. 5-‐Lipoxygenase metabolite 4-‐HDHA is a mediator of the antiangiogenic effect of ω-‐3 polyunsaturated fatty acids. Sci Transl Med 3:69ra12.
51. Groeger A. L., C. Cipollina, M. P. Cole, S. R. Woodcock, G. Bonacci, T. K. Rudolph, V. Rudolph, B. A. Freeman, and F. J. Schopfer. 2010. Cyclooxygenase-‐2 generates anti-‐inflammatory mediators from omega-‐3 fatty acids. Nat Chem Biol 6:433-‐441.
52. de Urquiza A. M., S. Liu, M. Sjoberg, R. H. Zetterstrom, W. Griffiths, J. Sjovall, and T. Perlmann. 2000. Docosahexaenoic acid, a ligand for the retinoid X receptor in mouse brain. Science 290:2140-‐214..
by guest, on July 18, 2018w
ww
.jlr.orgD
ownloaded from

21
Figure 1. Altered Gene Expression by EPA-‐rich Oil in THP-‐1 cells stimulated with LPS. Comprehensive analysis of gene expression was performed by microarrays as described in Material and Methods. Average expression values (n=3 arrays per group) were exported to JMP (SAS Institute, Cary NC) and hierarchical clustering performed. Data is expressed relative to the DMSO treated group with green representing a decrease and red an increase relative to control (depicted as black).
by guest, on July 18, 2018w
ww
.jlr.orgD
ownloaded from
22
Figure 2. Expression of selected genes identified as responsive to EPA-‐rich oil in THP-‐1 cells. Genes were selected from Table 1 and Figure 1 for validation by real-‐time PCR. Cells were treated and RNA extracted as described in Material and Methods. Gene expression following treatment with EPA-‐rich oil (0, 1, 10, 100 µM) is expressed relative to a housekeeping gene (GAPDH) and normalized to vehicle control (DMSO). Asterisks denote significantly different than control (p<0.05, n=3, bars represent mean and SEM)
by guest, on July 18, 2018w
ww
.jlr.orgD
ownloaded from

23
Figure 3. Structure activity relationships of altered gene expression in THP-‐1 cells. THP-‐1 cells were treated with the indicated fatty acids or EPA-‐rich oil at 100 µM and stimulated with LPS. See legend to Figure 2 for details. Asterisks denote significantly different than control (p<0.05, n=3, bars represent mean and SEM)
by guest, on July 18, 2018w
ww
.jlr.orgD
ownloaded from

24
Figure 4. Activation of nuclear receptors by EPA-‐rich oil. Whole cell reporter assays were used to examine the activation of various nuclear receptors by EPA-‐rich oil. See Material and Methods for details. (Data is expressed relative to vehicle control; Shown is mean and SEM, n=4)
by guest, on July 18, 2018w
ww
.jlr.orgD
ownloaded from

25
Figure 5. Structure activity relationships for activation of nuclear receptors by ω-‐3 PUFAs. Fatty acids were examined at 100µM as described in Material and Methods and luciferase data is expressed relative to vehicle control. Bars represent mean and SEM (n=4).
by guest, on July 18, 2018w
ww
.jlr.orgD
ownloaded from

26
Figure 6. Serum from individuals given ω3-‐PUFA supplements affected gene expression in THP-‐1 cells. Serum was diluted in treatment media (10% v/v) and applied to THP-‐1 cells followed by LPS stimulation. Data is expressed as gene expression with serum obtained at 6 weeks of treatment relative to the effects seen with serum obtained at baseline. (mean and SEM, n=20-‐25 per group). Asterisks denote significantly different than the Olive Oil (O.O.) administered group (p<0.05, Dunnett’s t-‐test).
by guest, on July 18, 2018w
ww
.jlr.orgD
ownloaded from
27
Figure 7. Correlation of ex vivo gene expression with serum fatty acid concentrations. Individual data for gene expression and clinical fatty acid concentrations were examined by pair-‐wise comparison and linear regression. The ratio of the post-‐ to pre-‐treatment was examined for all treatment groups (n=101-‐110).
by guest, on July 18, 2018w
ww
.jlr.orgD
ownloaded from

28
Table 1.Genes significantly affected by EPA-‐rich oil in THP-‐1 cells
Fold Change (relative to control)
Gene Symbol Gene Title 1 µM 10 µM 100 µM COL10A1 collagen, type X, alpha 1 1.3278 1.1086 2.5391 PLAU plasminogen activator, urokinase 1.1471 0.9655 1.9077 STC1 stanniocalcin 1 1.1964 1.1177 1.6985 AREG /// AREGB amphiregulin /// amphiregulin B 1.0694 1.1683 1.6936 TGFBI transforming growth factor, beta-‐induced,
68kDa 1.0750 1.3081 1.6264
ADFP/ADRP adipose differentiation-‐related protein 1.0160 1.0060 1.4352 PPIF peptidylprolyl isomerase F 1.0781 1.0807 1.3483 SLC16A3 solute carrier family 16, member 3
(monocarboxylic acid transporter 4) 0.2643 0.3233 1.2493
POLR2F polymerase (RNA) II (DNA directed) polypeptide F
0.9596 1.0271 1.1591
TGOLN2 trans-‐golgi network protein 2 0.9787 0.9838 1.1552 COBLL1 COBL-‐like 1 1.2353 1.0838 1.1328 SEC14L1 SEC14-‐like 1 (S. cerevisiae) 0.5690 0.5472 1.0216 USP36 ubiquitin specific peptidase 36 0.6582 0.5994 1.0188 ILF3 interleukin enhancer binding factor 3, 90kDa 0.5487 0.5171 1.0136 SLC4A7 solute carrier family 4, sodium bicarbonate
cotransporter, member 7 0.3262 0.3462 1.0044
TPR translocated promoter region (to activated MET oncogene)
0.5943 0.6034 0.9741
KPNA1 karyopherin alpha 1 (importin alpha 5) 0.9225 0.8926 0.9395 BRD2 bromodomain containing 2 0.8018 0.7723 0.9390 KPNA1 karyopherin alpha 1 (importin alpha 5) 0.6928 0.5825 0.8933 PPP3R1 /// WDR92
protein phosphatase 3 (formerly 2B), regulatory subunit B, alpha isoform /// WD repeat domain 92
0.3005 0.3412 0.8904
LBR lamin B receptor 1.0578 1.0050 0.8025 DBI diazepam binding inhibitor (GABA receptor
modulator, acyl-‐Coenzyme A binding protein) 0.9965 0.9613 0.7820
PSD3 pleckstrin and Sec7 domain containing 3 0.7057 0.7027 0.7524 FADS2 fatty acid desaturase 2 1.0707 0.9498 0.6029 ABCG1 ATP-‐binding cassette, sub-‐family G (WHITE),
member 1 0.9029 0.9907 0.5864
by guest, on July 18, 2018w
ww
.jlr.orgD
ownloaded from
29
Table 1.Genes significantly affected by EPA-‐rich oil in THP-‐1 cells
FDPS farnesyl diphosphate synthase (farnesyl pyrophosphate synthetase, dimethylallyltranstransferase, geranyltranstransferase)
1.0144 0.8790 0.5572
FDFT1 farnesyl-‐diphosphate farnesyltransferase 1 1.0011 0.8560 0.4714 HSD17B7 hydroxysteroid (17-‐beta) dehydrogenase 7 0.9309 0.8483 0.4649 HMGCS1 3-‐hydroxy-‐3-‐methylglutaryl-‐Coenzyme A
synthase 1 (soluble) 1.0462 0.8465 0.4643
FADS1 fatty acid desaturase 1 1.0469 0.9361 0.4585 IDI1 isopentenyl-‐diphosphate delta isomerase 1 0.9725 0.8530 0.4530 IDI1 isopentenyl-‐diphosphate delta isomerase 1 0.9725 0.8795 0.4468 CYP51A1 cytochrome P450, family 51, subfamily A,
polypeptide 1 1.0189 0.8881 0.4406
HMGCR 3-‐hydroxy-‐3-‐methylglutaryl-‐Coenzyme A reductase
0.9683 0.8389 0.4321
DHCR7 7-‐dehydrocholesterol reductase 0.9987 0.9105 0.4267 ACAT2 acetyl-‐Coenzyme A acetyltransferase 2 1.0593 0.9382 0.4142 SC5DL sterol-‐C5-‐desaturase (ERG3 delta-‐5-‐
desaturase homolog, S. cerevisiae)-‐like 1.0299 0.9073 0.3937
SCD stearoyl-‐CoA desaturase (delta-‐9-‐desaturase) 0.9913 0.9573 0.3298 SC4MOL sterol-‐C4-‐methyl oxidase-‐like 1.0343 0.8020 0.3001
by guest, on July 18, 2018w
ww
.jlr.orgD
ownloaded from

30
Table&2.&Serum&fatty&acid&profile&from
&individuals&given&fatty&acid&supplements&for&six&w
eeks
Lipid1
p>value2
p>valuep>value
p>value
Omega3
0.847<0.001
<0.001<0.001
AA/EPA0.971
<0.001<0.001
0.822
AA/DHA0.576
0.6000.114
<0.001
N3/N
60.827
<0.001<0.001
<0.001
AA0.731
0.082<0.001
0.022
EPA0.851
<0.001<0.001
0.030
DHA0.937
0.8650.220
<0.001
SCD180.447
0.551<0.001
0.004
SCD160.774
0.6380.057
0.003
Data show
n as means ± standard error of 26 individuals. A
ll concentrations are expressed as mg/dl.
1Abbreviations7used:7Omega3,7total7D
HA7plus7EPA;7AA,7arachidonic7acid;7SCD
18,718:1(nK9)/18:0;7SCD16,716:1(nK7)/16:0
2Paired7tKtest7(twoKtailed)
0.8537±70.0220.7947±70.022
0.0107±70.0010.0107±70.001
0.0097±70.0000.0097±70.000
0.0107±70.0010.0087±70.000
0.0117±70.0010.0097±70.001
0.867±70.0410.8747±70.036
0.8187±70.0280.8087±70.024
0.8397±70.0240.7687±70.023
0.8917±70.0820.7707±70.050
3.5867±70.3533.5797±70.379
3.2877±70.2513.2587±70.231
3.5667±70.3153.3167±70.219
3.3327±70.1825.9737±70.331
0.9597±70.1110.9377±70.130
0.957±70.1001.9017±70.177
0.8957±70.1233.8717±70.371
0.1417±70.0070.2097±70.010
11.607±70.49511.527±70.559
12.867±70.45512.427±70.548
12.637±70.47511.407±70.462
11.747±70.35410.907±70.361
0.1517±70.0140.1527±70.017
0.1397±70.0100.187±70.012
0.1467±70.0130.2667±70.021
3.8677±70.3273.8547±70.271
2.0767±70.215
17.067±72.21117.137±71.747
17.517±72.0669.0297±71.321
18.857±72.1445.8337±71.530
4.0847±70.4204.1587±70.444
4.3477±70.2944.2677±70.339
4.1617±70.343
5.6787±70.4745.6357±70.526
5.3767±70.3406.6577±70.354
5.5547±70.4389.2557±70.607
5.3867±70.2587.6287±70.323
16.187±71.62715.977±71.323
O.O.
EPA7(Low)
EPA7(High)
DHA
PrePost
PrePost
PrePost
PrePost
by guest, on July 18, 2018w
ww
.jlr.orgD
ownloaded from