registered number: 34161590
TRANSCRIPT

Registered Number: 34161590
Registered office: Luna Arena Herikerbergweg 238 1101 CM Amsterdam Zuidoost The Netherlands
MORGAN STANLEY B.V.
Report and financial statements
31 December 2011

MORGAN STANLEY B.V.
CONTENTS PAGE ANNUAL REPORT Directors' report 1 Directors' responsibility statement 7 ANNUAL ACCOUNTS Statement of comprehensive income 8 Statement of changes in equity 9 Statement of financial position 10 Statement of cash flows 11 Notes to the financial statements 12 OTHER INFORMATION Additional information 46 Independent auditor's report 47

MORGAN STANLEY B.V. DIRECTORS’ REPORT
1
The Directors present their report and financial statements (which comprise the statement of comprehensive income, statement of changes in equity, statement of financial position, statement of cash flows and the related notes, 1 to 20) for Morgan Stanley B.V. (the “Company”) for the year ended 31 December 2011.
RESULTS AND DIVIDENDS
The profit for the year, after tax, was €3,026,000 (2010: €1,638,000 profit after tax).
A final dividend for the year ended 31 December 2010 of €13,175,000 and interim dividends for the year ended 31 December 2011 of €1,222,000 were paid during the current year.
No dividends were paid in the prior year.
PRINCIPAL ACTIVITY
The principal activity of the Company is the issuance of financial instruments including notes, certificates and warrants (“Structured Notes”) and the hedging of the obligations arising pursuant to such issuances.
The Company’s ultimate parent undertaking and controlling entity is Morgan Stanley, which, together with the Company and Morgan Stanley’s other subsidiary undertakings, form the “Morgan Stanley Group”.
On 9 August 2011 the Company’s immediate parent undertaking, Morgan Stanley International Holdings Inc., agreed on the sale and transfer of one ordinary share of €100 to Morgan Stanley International Limited and 150,178 ordinary shares of €100 each to Archimedes Investments Coöperatieve U.A.. Following the sale and transfer of these ordinary shares, Archimedes Investments Coöperatieve U.A. became the Company’s immediate parent undertaking. Archimedes Investments Coöperatieve U.A. is registered in The Netherlands.
FUTURE OUTLOOK
There have not been any significant changes in the Company’s principal activity in the year under review and no significant change in the Company’s principal activity is expected.
BUSINESS REVIEW
During 2011, global market and economic conditions were negatively impacted by concerns about the sovereign debt crisis in Europe, the US federal debt ceiling and slower economic growth leading to volatility on the global equity markets.
In Europe, real gross domestic product growth remained moderate in 2011. Major European equity market indices ended 2011 lower compared with the beginning of the year, primarily due to adverse economic developments, including investors’ growing concerns about the sovereign debt crisis, especially in Greece, Ireland, Italy, Portugal and Spain (the “European Peripherals”), and the sovereign debt exposures in the European banking system. The Euro area unemployment rate increased to 10.4% at 31 December 2011 from 10.0% a year ago. At 31 December 2011, the European Central Bank’s (“ECB”) benchmark interest rate was 1.00%, and the Bank of England’s (“BOE”) benchmark interest rate was 0.50%, both of which were unchanged from a year ago. In 2011, the BOE increased the size of its quantitative easing program by £75 billion to £275 billion in order to inject further monetary stimulus into the economy in UK. To stabilise the European banking system during the sovereign debt crisis, the ECB initiated a number of actions during the fourth quarter of 2011. The ECB made longer-term loans available to banks in exchange for posting of adequate collateral in October and December of 2011 for maturities up to 13 months, ensuring that European banks have unlimited financing into 2013. Starting in November 2011, the ECB also bought €40 billion in European bank bonds backed by mortgages and other assets, known as covered bonds, a key source of funds for banks. On 27 October 2011, leaders of 17 European Union countries announced a financial relief plan that involves a write-off of certain sovereign debt by European banks and other measures aimed to resolve the European sovereign debt crisis. In December 2011, European leaders agreed to sign an inter-government treaty that would require them to enforce stricter fiscal and financial discipline in their future budgets. In January and February 2012, rating agencies downgraded the credit ratings for several Eurozone countries.

MORGAN STANLEY B.V. DIRECTORS’ REPORT
2
BUSINESS REVIEW (CONTINUED)
The statement of comprehensive income for the year is set out on page 8. The Company made a profit before income tax of €4,020,000 in the current year, an increase of €1,832,000 on the prior year. This was attributed to an increase in other income which entirely represents management charges received from other Morgan Stanley Group undertakings, partially offset by a reduction in net interest income earned. The increase in other income is due to a higher level of Structured Notes issued, on which management charges are received, throughout the year.
The losses and gains on financial instruments classified as held for trading and the financial instruments designated at fair value through profit or loss respectively offset to €nil, which is consistent with the Company’s function and the prior year. Net gains on financial instruments designated at fair value through profit or loss of €538,848,000 represents fair value movements for the year on the issued Structured Notes, prepaid equity security contracts and loans designated at fair value. The gain has arisen as a result of favourable movements on the assets underlying the Structured Notes issued, which are hedged by derivatives classified as held for trading, when compared to the prior year (2010: €96,857,000 loss). Net losses on financial instruments classified as held for trading of €538,848,000 represent fair value movements for the year on derivatives classified as held for trading (2010: €96,857,000 gain). These derivatives, along with the loans designated at fair value and prepaid equity securities contracts, form the hedging strategy for the obligations arising pursuant to the issuance of the Structured Notes.
The statement of financial position for the Company is set out on page 10. The Company’s financial position at the end of the year shows total assets of €4,187,365,000, a decrease of €1,306,771,000 or 24% when compared to the financial position at 31 December 2010. Total liabilities of €4,170,543,000 represent a decrease of €1,295,400,000 or 24%, when compared to the financial position at 31 December 2010. The Company’s financial position is primarily driven by financial liabilities designated at fair value through profit or loss, which represent the valuation of issued Structured Notes held at the end of the year. The value of issued Structured Notes held at 31 December 2011 has decreased by €1,613,548,000 since 31 December 2010. This movement represents maturities of issued Structured Notes offset by new issuances and fair value movements in the year.
The decrease in the value of issued Structured Notes has resulted in a reduction in net financial instruments classified as held for trading of €543,138,000 and financial assets designated at fair value through profit or loss of €1,048,747,000, which both represent the valuation of the related hedging instruments.
Trade payables and trade receivables represent trades that have not settled at the year end. At 31 December 2011, the Company recognised net trade payables of €8,784,000 in relation to pending trades compared to net trade receivables of €13,703,000 at 31 December 2010.
The performance of the Company is included in the results of the Morgan Stanley Group which are disclosed in the Morgan Stanley Group’s Annual Report on Form 10-K to the United States Securities and Exchange Commission. The Morgan Stanley Group manages its key performance indicators on a global basis but in consideration of individual legal entities. For this reason, the Company’s Directors believe that providing further performance indicators for the Company itself would not enhance an understanding of the development, performance or position of the business of the Company.
The risk management section below sets out the Company’s and the Morgan Stanley Group’s policies for the management of liquidity and cash flow risk and other significant business risks. Note 15 to the financial statements provides qualitative and quantitative disclosures about the Company’s management of and exposure to financial risks, including liquidity risk.

MORGAN STANLEY B.V. DIRECTORS’ REPORT
3
BUSINESS REVIEW (CONTINUED)
Risk management
Risk is an inherent part of the Company’s business activity and is managed within the context of the broader Morgan Stanley Group’s business activities. The Morgan Stanley Group seeks to identify, assess, monitor and manage each of the various types of risk involved in its activities on a global basis, in accordance with defined policies and procedures and in consideration of the individual legal entities.
Market risk
Market risk refers to the risk that a change in the level of one or more market prices, rates, indices, implied volatilities (the price volatility of the underlying instrument imputed from option prices), correlations or other market factors, such as liquidity, will result in losses for a position or portfolio.
The Morgan Stanley Group manages the market risk associated with its trading activities in consideration of each individual legal entity, but on a global basis, at both a trading division and an individual product level.
It is the policy and objective of the company not to be exposed to market risk.
Credit risk
Credit risk refers to the risk of loss arising from borrower or counterparty default when a borrower, counterparty or obligor does not meet its obligations.
The Morgan Stanley Group manages credit risk exposure on a global basis as well as giving consideration to each individual legal entity, by ensuring transparency of material credit risks, ensuring compliance with established limits, approving material extensions of credit, escalating risk concentrations to appropriate senior management and mitigating credit risk through the use of collateral and other arrangements.
Liquidity and capital resources Liquidity and funding risk refers to the risk that the Company will be unable to meet its funding obligations in a timely manner. Liquidity risk stems from the potential risk that the Company will be unable to obtain necessary funding through borrowing money at favourable interest rates or maturity terms, or selling assets in a timely manner and at a reasonable price. The Morgan Stanley Group’s liquidity and funding risk management policies are designed to mitigate the potential risk that entities within the Morgan Stanley Group, including the Company, may be unable to access adequate financing to service their financial liabilities when they become payable without material, adverse franchise or business impact.
Morgan Stanley continues to actively manage its capital and liquidity position to ensure adequate resources are available to support the activities of the Morgan Stanley Group, to enable the Morgan Stanley Group to withstand market stresses, and to meet regulatory stress testing requirements proposed by regulators globally. Throughout 2011, the Morgan Stanley Group has been focused on the composition of its funding liabilities, reducing reliance on short term funding in favour of more diverse and durable funding sources. This remains an ongoing objective of the Morgan Stanley Group. In line with this active management, in June 2011, the Morgan Stanley Group’s capital position was further strengthened by converting its outstanding Series B Non-Cumulative Non-Voting Perpetual Convertible Preferred Stock with a face value of $7.8 billion and a 10% dividend issued to Mitsubishi UFJ Financial Group Inc (“MUFG”), for 385,464,097 shares in Morgan Stanley’s common stock. During the latest Comprehensive Capital Analysis and Review performed by the Federal Reserve, Morgan Stanley Group exceeded the minimum capital ratio even under the most negative “stressed” scenario, which reaffirms the improvements done in recent years to reduce risk and overhauling the quality and quantity of the capital base.

MORGAN STANLEY B.V. DIRECTORS’ REPORT
4
BUSINESS REVIEW (CONTINUED)
Risk management (continued)
Operational risk
Operational risk refers to the risk of financial or other loss, or damage to the Company’s or the Morgan Stanley Group’s reputation, resulting from inadequate or failed internal processes, people, resources, systems or from other internal or external events (e.g. internal or external fraud, legal and compliance risks, damage to physical assets, etc.). Legal and compliance risk is included in the scope of operational risk and is discussed below under “Legal and regulatory risk”.
The Company’s business is highly dependent on the ability to process, on a daily basis, a large number of transactions across numerous and diverse markets in many currencies. In general, the transactions processed are increasingly complex. The Company relies on the ability of the Morgan Stanley Group’s employees, its internal systems, and systems at technology centres operated by third parties to process a high volume of transactions.
The Company also faces the risk of operational failure or termination of any of the clearing agents, exchanges, clearing houses or other financial intermediaries it uses to facilitate securities transactions. In the event of a breakdown or improper operation of the Company’s or a third party’s systems or improper action by third parties or employees, the Company could suffer financial loss, an impairment to its liquidity, a disruption of its businesses, regulatory sanctions or damage to its reputation.
The Company’s operations rely on the secure processing, storage and transmission of confidential and other information in its computer systems and may be vulnerable to unauthorised access, mishandling or misuse, computer viruses and other events that could have a security impact on such systems. If one or more of such events occur, this potentially could jeopardise the Company’s or the Company’s clients’ or counterparties’ personal, confidential, proprietary or other information processed and stored in, and transmitted through, the Company’s computer systems. Furthermore, such events could cause interruptions or malfunctions in the Company’s, the Company’s clients’, the Company’s counterparties’ or third parties’ operations, which could result in reputational damage, litigation or regulatory fines or penalties not covered by insurance maintained by the Company, or adversely affect the business, financial condition or results of operations.
The Morgan Stanley Group has established an operational risk management process which operates on a global and regional basis to identify, measure, monitor and control risk. Effective operational risk management is essential to reducing the impact of operational risk incidents and mitigating legal, regulatory, and reputational risks.
The Morgan Stanley Group has established a Eurozone Crisis Planning Group to formulate strategy, planning and execution associated with the European sovereign debt crisis and focus on the associated legal and operational issues. This planning group has directed a number of focused risk management reviews to ensure the Morgan Stanley Group is prepared in the case of a Eurozone country default or exit. Legal and regulatory risk
Legal and regulatory risk includes the risk of exposure to fines, penalties, judgements, damages and/or settlements in conjunction with regulatory or legal actions as a result of non-compliance with applicable legal or regulatory requirements or litigation. Legal risk also includes contractual risk such as the risk that a counterparty’s performance obligations will be unenforceable. In the current environment of rapid and possibly transformational regulatory change, the Morgan Stanley Group also views regulatory change as a component of legal risk.

MORGAN STANLEY B.V. DIRECTORS’ REPORT
5
BUSINESS REVIEW (CONTINUED)
Risk management (continued)
The Morgan Stanley Group has established procedures based on legal and regulatory requirements on a worldwide basis that are designed to foster compliance with applicable statutory and regulatory requirements. The Morgan Stanley Group, principally through the Legal and Compliance Division, also has established procedures that are designed to require that the Morgan Stanley Group’s policies relating to conduct, ethics and business practices are followed globally. In connection with its businesses, the Morgan Stanley Group has and continuously develops various procedures addressing issues such as regulatory capital requirements, sales and trading practices, new products, potential conflicts of interest, structured transactions, use and safekeeping of customer funds and securities, credit granting, money laundering, privacy and recordkeeping. In addition, the Morgan Stanley Group has established procedures to mitigate the risk that a counterparty’s performance obligations will be unenforceable, including consideration of counterparty legal authority and capacity, adequacy of legal documentation, the permissibility of a transaction under applicable law and whether applicable bankruptcy or insolvency laws limit or alter contractual remedies. The legal and regulatory focus on the financial services industry presents a continuing business challenge for the Morgan Stanley Group.
Significant changes in the way that major financial services institutions are regulated are occurring in the UK, Europe, the US and worldwide. The reforms being discussed and, in some cases, already implemented, include several that contemplate comprehensive restructuring of the regulation of the financial services industry. Such measures will likely lead to stricter regulation of financial institutions generally, and heightened prudential requirements for systemically important firms in particular. Such measures could include taxation of financial transactions, liabilities and employee compensation as well as reforms of the over-the-counter (“OTC”) derivatives markets, such as mandated exchange trading and clearing, position limits, margin, capital and registration requirements.
Many of these reforms, if enacted, may materially affect the Company’s and the Morgan Stanley Group’s business, financial condition, results of operations and cash flows in the future.
Continuing market uncertainty During the year the financial services industry has been exposed to the deteriorating economic and financial conditions in selected Eurozone countries. Although there has been a significant reduction in the industry's exposure to certain Eurozone countries, there is still the risk of sovereign defaults, including contagion risk, and potential for the economic environment to worsen. The Morgan Stanley Group regularly performs stress testing to ensure both the Morgan Stanley Group and the Company have sufficient resources at their disposal to absorb losses associated with certain stressed scenarios. The global regulatory environment is continually changing and it remains difficult to assess the full impact on the Company. It is likely that there will be further material changes in the way major financial institutions are regulated and we are continually assessing the impact of these changes. These conditions present difficulties and uncertainty for the business outlook which may adversely impact the financial performance of the Company in the future.

MORGAN STANLEY B.V. DIRECTORS’ REPORT
6
DIRECTORS
The following Directors held office throughout the year and to the date of approval of this report (except where otherwise shown):
P W Banks (resigned 25 March 2011) A J S Crawford (resigned 18 January 2011) R H L de Groot H Herrmann (resigned 21 December 2011, re-appointed 16 February 2012) H K A Lee (resigned 15 April 2011) P J G de Reus R J Rinkes (appointed 13 July 2011, resigned 9 January 2012) J A Solan (resigned 26 April 2011) Z Wu (appointed 8 March 2012) TMF Management B.V. EVENTS AFTER THE REPORTING DATE
On 30 March 2012 the Company issued 11,252,813 of Convertible Preferred Equity Securities (“CPEC”) of €100 each to Archimedes Investments Coöperatieve U.A. in exchange for cash consideration of €1,125,281,000.
AUDIT COMMITTEE
The Company qualifies as an organisation of public interest pursuant to Dutch and European Union (“EU”) law. Morgan Stanley International Limited has an audit committee that complies with the applicable corporate governance rules and also functions as the audit committee of the Company; accordingly, the Company has therefore taken the exemption for groups and has not established an audit committee.
AUDITOR
Deloitte Accountants B.V. have expressed their willingness to continue in office as auditor of the Company and a resolution to re-appoint them will be proposed at the forthcoming annual general meeting.
Approved by the Board on 24 April 2012 and signed on its behalf by R H L de Groot H Herrmann P J G de Reus Z Wu TMF Management B.V.

MORGAN STANLEY B.V. DIRECTORS’ RESPONSIBILITY STATEMENT
7
The Directors, the names of whom are set out below, confirm to the best of their knowledge: - the financial statements, which have been prepared in accordance with International Financial
Reporting Standards (“IFRSs”) as issued by the International Accounting Standards Board (“IASB”) and as endorsed by the EU, have been prepared in accordance with the applicable set of accounting standards and give a true and fair view of the assets, liabilities, financial position and profit or loss of the Company; and
- the management report represented by the Directors’ report includes a fair review of the development
and performance of the business and the position of the Company together with a description of the principal risks and uncertainties that the Company faces.
Approved by the Board on 24 April 2012 and signed on its behalf by R H L de Groot H Herrmann P J G de Reus Z Wu TMF Management B.V.

MORGAN STANLEY B.V. STATEMENT OF COMPREHENSIVE INCOME Year ended 31 December 2011
8
Note 2011 2010 €'000 €'000
Net (losses)/gains on financial instruments classified as held for trading (538,848) 96,857
Net gains/(losses) on financial instruments designated at fair value through profit or loss 538,848 (96,857) Interest income 4 408 667 Interest expense 4 (129) (122) Other income 5 3,827 1,736 Other expense 6 (86) (93) PROFIT BEFORE INCOME TAX 4,020 2,188 Income tax expense 7 (994) (550)
PROFIT AND TOTAL COMPREHENSIVE INCOME FOR THE YEAR 3,026 1,638 All operations were continuing in the current and prior year.
The notes on pages 12 to 45 form an integral part of the financial statements.

MORGAN STANLEY B.V. STATEMENT OF CHANGES IN EQUITY Year ended 31 December 2011
9
Note Share
capital Retained earnings
Total equity
€'000 €'000 €'000 Balance at 1 January 2010 15,018 11,537 26,555 Profit and total comprehensive income for the year - 1,638 1,638 Balance at 31 December 2010 15,018 13,175 28,193 Profit and total comprehensive income for the year - 3,026 3,026 Transactions with owners: - Dividends to equity holders of the Company 11 - (14,397) (14,397) Balance at 31 December 2011 15,018 1,804 16,822
The notes on pages 12 to 45 form an integral part of the financial statements.

MORGAN STANLEY B.V. Registered number: 34161590
STATEMENT OF FINANCIAL POSITION As at 31 December 2011 (Including Proposed Appropriation of Results)
10
Note 2011 2010 €'000 €'000 ASSETS Loans and receivables: Cash at bank 1,097 1,035 Trade receivables 11,966 94,979 Other receivables 19 18,461 27,648 31,524 123,662
Financial assets classified as held for trading 8 211,187 377,004 Financial assets designated at fair value through profit or loss 9 3,944,654 4,993,401 Current tax - 69
TOTAL ASSETS 4,187,365 5,494,136 LIABILITIES AND EQUITY Financial liabilities at amortised cost: Trade payables 20,750 81,276 Other payables 19 1,932 1,228 22,682 82,504 Financial liabilities classified as held for trading 8 556,946 179,625 Financial liabilities designated at fair value through profit or loss 9 3,590,266 5,203,814 Current tax 649 - TOTAL LIABILITIES 4,170,543 5,465,943
EQUITY ATTRIBUTABLE TO EQUITY HOLDERS OF THE COMPANY Share capital 10 15,018 15,018 Retained earnings 1,804 13,175 TOTAL EQUITY 16,822 28,193 TOTAL LIABILITIES AND EQUITY 4,187,365 5,494,136
These financial statements were approved by the Board and authorised for issue on 24 April 2012. Signed on behalf of the Board R H L de Groot H Herrmann P J G de Reus Z Wu TMF Management B.V. The notes on pages 12 to 45 form an integral part of the financial statements.

MORGAN STANLEY B.V. STATEMENT OF CASH FLOWS Year ended 31 December 2011
11
Note 2011 2010 €'000 €'000
NET CASH FLOWS FROM/(USED IN) OPERATING ACTIVITIES 12b 14,459 (5,561)
FINANCING ACTIVITIES
Dividends paid to equity holders of the Company 11 (14,397) -
NET CASH FLOWS USED IN FINANCING ACTIVITIES (14,397) -
NET INCREASE/(DECREASE) IN CASH AND CASH EQUIVALENTS 62 (5,561) CASH AND CASH EQUIVALENTS AT THE BEGINNING OF THE YEAR 1,035 6,596
CASH AND CASH EQUIVALENTS AT THE END OF THE YEAR 12a 1,097 1,035
The notes on pages 12 to 45 form an integral part of the financial statements.

MORGAN STANLEY B.V. NOTES TO THE FINANCIAL STATEMENTS Year ended 31 December 2011
12
1. CORPORATE INFORMATION The Company is incorporated and domiciled in The Netherlands, at the following address:
Luna Arena, Herikerbergweg 238, 1101 CM, Amsterdam Zuidoost, The Netherlands.
The Company is engaged in the issuance of financial instruments including notes, certificates and warrants (“Structured Notes”) and the hedging of the obligations arising pursuant to such issuances with prepaid equity security contracts, loans designated at fair value and derivatives from other Morgan Stanley Group undertakings.
The issued Structured Notes expose the Company to the risk of changes in market prices of the underlying securities, interest rate risk and, where denominated in currencies other than Euros, the risk of changes in rates of exchange between the Euro and the other relevant currencies. The Company uses the contracts that it purchases from other Morgan Stanley Group undertakings to hedge the market price, interest rate and foreign currency risks associated with the issuance of the Structured Notes. The changes in fair value of the Structured Notes issuances are fully hedged by the changes in fair value of these contracts.
2. BASIS OF PREPARATION Statement of compliance
The Company has prepared its annual financial statements in accordance with IFRSs issued by the IASB as adopted by the EU, Interpretations issued by the IFRS Interpretations Committee (“IFRIC”) and Dutch law. The primary financial statements in this document are presented in accordance with International Accounting Standards (“IAS”) 1 ‘Presentation of financial statements’ (“IAS 1”).
New standards and interpretations adopted during the year
The following standard and amendments to standards relevant to the Company’s operations were adopted during the year. The standard and amendments to standards did not have a material impact on the Company’s financial statements.
IAS 24 ‘Related party disclosures’ was revised by the IASB in November 2009 for retrospective application in annual periods beginning on or after 1 January 2011. The revised standard was endorsed by the EU in July 2010.
As part of the May 2010 improvements to IFRSs, the IASB made amendments to the following standards that are relevant to the Company’s operations: IFRS 7 ‘Financial instruments: Disclosures’ and IAS 1 (for application in annual periods beginning on or after 1 January 2011). The improvements were endorsed by the EU in February 2011.
New standards and interpretations not yet adopted
At the date of authorisation of these financial statements, the following standards and amendments to standards relevant to the Company’s operations were issued by the IASB but not yet mandatory. Except where otherwise stated, the Company does not expect that the adoption of the following standards and amendments to standards will have a material impact on the Company’s financial statements.
An amendment to IAS 1 was issued by the IASB in June 2011 for application in annual periods beginning on or after 1 July 2012.
An amendment to IAS 12 ‘Income taxes’ was issued by the IASB in December 2010 for retrospective application in annual periods beginning on or after 1 January 2012.
An amendment to IAS 32 ‘Financial instruments: presentation – offsetting financial instruments’ was issued by the IASB in December 2011, for retrospective application in annual periods beginning on or after 1 January 2014.

MORGAN STANLEY B.V. NOTES TO THE FINANCIAL STATEMENTS Year ended 31 December 2011
13
2. BASIS OF PREPARATION (CONTINUED) New standards and interpretations not yet adopted (continued)
An amendment to IFRS 7 ‘Financial instruments: Disclosures – transfers of financial assets’ was issued by the IASB in October 2010 for prospective application in annual periods beginning on or after 1 July 2011.
A further amendment to IFRS 7 ‘Financial instruments: Disclosures – Offsetting Financial Assets and Financial Liabilities’ was issued by the IASB in December 2011 for retrospective application in annual periods beginning on or after 1 January 2013, including interim periods.
IFRS 9 ‘Financial instruments’ was issued by the IASB in November 2009 for retrospective application in annual periods beginning on or after 1 January 2015. Although there are expected to be significant changes to the presentation of financial instruments by the Company, there is not expected to be a significant impact on net assets.
IFRS 13 ‘Fair value measurement’ was issued by the IASB in May 2011 for prospective application in annual periods beginning on or after 1 January 2013.
Basis of measurement
The financial statements of the Company are prepared under the historical cost convention modified by the inclusion of certain financial instruments at fair value.
The going concern assumption
The Company’s business activities, together with the factors likely to affect its future development, performance and position, are set out in the Business Review sections of the Director’s Report on pages 1 to 5. In addition, the notes to the financial statements include the Company’s objectives, policies and processes for managing its capital; its financial risk management objectives; details of its financial instruments; and its exposures to credit risk and liquidity risk.
As set out in the Directors’ Report retaining sufficient liquidity and capital to withstand market pressures remains central to the Morgan Stanley Group’s and the Company’s strategy and steps have been taken to strengthen both the Morgan Stanley Group and the Company’s capital positions.
Taking all of these factors into consideration, the Directors believe it is reasonable to assume that the Company will have access to adequate resources to continue in operational existence for the foreseeable future. Accordingly, they continue to adopt the going concern basis in preparing the annual report and financial statements.
Use of estimates and sources of uncertainty
The preparation of financial information requires the Company to make judgements, estimates and assumptions regarding the valuation of certain financial instruments, impairment of assets, and other matters that affect the financial statements and related disclosures. The Company believes that the estimates utilised in preparing the financial statements are reasonable, relevant and reliable. Actual results could differ from these estimates.
3. SUMMARY OF SIGNIFICANT ACCOUNTING POLICIES a. Functional currency
Items included in the financial statements are measured and presented in Euros, the currency of the primary economic environment in which the Company operates.
All currency amounts in the financial statements and Directors’ report are rounded to the nearest thousand Euros.

MORGAN STANLEY B.V. NOTES TO THE FINANCIAL STATEMENTS Year ended 31 December 2011
14
3. SUMMARY OF SIGNIFICANT ACCOUNTING POLICIES (CONTINU ED) b. Foreign currencies
All monetary assets and liabilities denominated in currencies other than Euros are translated into Euros at the rates ruling at the reporting date. Transactions in currencies other than Euros are recorded at the rates prevailing at the dates of the transactions. All translation differences are taken through the statement of comprehensive income and are presented in ‘Other income’ or ‘Other expense’, except where noted in 3(c) below.
c. Financial instruments
The Company classifies its financial assets into the following categories on initial recognition: financial assets classified as held for trading, financial assets designated at fair value through profit or loss, and loans and receivables.
The Company classifies its financial liabilities into the following categories on initial recognition: financial liabilities classified as held for trading, financial liabilities designated at fair value through profit or loss and financial liabilities at amortised cost.
More information regarding these classifications is included below:
i) Financial instruments classified as held for trading
Financial instruments classified as held for trading, are initially recorded on trade date at fair value. All subsequent changes in fair value, foreign exchange differences, interest and dividends are reflected in the statement of comprehensive income in ‘Net (losses)/gains on financial instruments classified as held for trading’. Transaction costs are excluded from the initial fair value measurement of the financial instrument. These costs are recognised in the statement of comprehensive income in ‘Other expense’.
ii) Financial instruments designated at fair value through profit or loss
The Company has designated certain financial assets and financial liabilities at fair value through profit or loss when the financial assets or financial liabilities are managed, evaluated and reported internally on a fair value basis.
From the date the transaction in a financial instrument designated at fair value is entered into (trade date) until settlement date, the Company recognises any unrealised fair value changes in the contract as financial instruments designated at fair value through profit or loss. On settlement date, the fair value of consideration given or received is recognised as a financial instrument designated at fair value through profit or loss (see note 3(d) below). All subsequent changes in fair value, foreign exchange differences, interest and dividends, are reflected in the statement of comprehensive income in ‘Net gains/(losses) on financial instruments designated at fair value through profit or loss’. Transaction costs are excluded from the initial fair value measurement of the financial instrument. These costs are recognised in the statement of comprehensive income in ‘Other expense’.
iii) Loans and receivables and financial liabilities at amortised cost
Financial assets classified as loans and receivables are initially recognised on settlement date at fair value (see note 3(d) below) and subsequently measured at amortised cost less allowance for impairment. Interest is recognised in the statement of comprehensive income in ‘Interest income’, using the effective interest rate method as described below. Transaction costs that are directly attributable to the acquisition of the financial asset are added to or deducted from the fair value on initial recognition.

MORGAN STANLEY B.V. NOTES TO THE FINANCIAL STATEMENTS Year ended 31 December 2011
15
3. SUMMARY OF SIGNIFICANT ACCOUNTING POLICIES (CONTINU ED) iii) Loans and receivables and financial liabilities at amortised cost (continued)
Financial liabilities held at amortised cost are initially recognised on settlement date at fair value (see note 3(d) below) and subsequently measured at amortised cost. Interest is recognised in the statement of comprehensive income in ‘Interest expense’ using the effective interest rate method as described below. Transaction costs that are directly attributable to the issue of the financial liability are added to or deducted from the fair value on initial recognition. Impairment losses and reversals of impairment losses on financial assets classified as loans and receivables are recognised in the statement of comprehensive income in ‘Other expense’.
The effective interest rate method is a method of calculating the amortised cost of a financial asset or financial liability (or a group of financial assets or financial liabilities) and of allocating the interest income or interest expense over the expected life of the financial asset or financial liability. The effective interest rate is the rate that exactly discounts the estimated future cash payments and receipts through the expected life of the financial asset or financial liability (or, where appropriate a shorter period) to the carrying amount of the financial asset or financial liability. The effective interest rate is established on initial recognition of the financial asset and financial liability. The calculation of the effective interest rate includes all fees and commissions paid or received, transaction costs, and discounts or premiums that are an integral part of the effective interest rate. Transaction costs are incremental costs that are directly attributable to the acquisition, issue or disposal of a financial asset or financial liability.
d. Fair value of financial instruments
Fair value measurement
Fair value is defined as the price that would be received to sell an asset or paid to transfer a liability (i.e. the “exit price”) in an orderly transaction between market participants at the measurement date.
In determining fair value, the Company uses various valuation approaches and establishes a hierarchy for inputs used in measuring fair value that maximises the use of relevant observable inputs and minimises the use of unobservable inputs by requiring that the most observable inputs be used when available. Observable inputs are inputs that market participants would use in pricing the asset or liability developed based on market data obtained from sources independent of the Company. Unobservable inputs are inputs that reflect the Company’s assumptions about the assumptions other market participants would use in pricing the asset or liability, developed based on the best information available in the circumstances.
The availability of observable inputs can vary from product to product and is affected by a wide variety of factors, including, for example, the type of product, whether the product is new and not yet established in the marketplace, the liquidity of markets and other characteristics particular to the transaction. To the extent that valuation is based on models or inputs that are less observable or unobservable in the market, the determination of fair value requires more judgement.
The Company uses prices and inputs that are current as of the measurement date, including during periods of market dislocation. In periods of market dislocation, the observability of prices and inputs may be reduced for many instruments.

MORGAN STANLEY B.V. NOTES TO THE FINANCIAL STATEMENTS Year ended 31 December 2011
16
3. SUMMARY OF SIGNIFICANT ACCOUNTING POLICIES (CONTINU ED) d. Fair value of financial instruments (continued)
Valuation techniques
Fair value for many cash and OTC contracts is derived using pricing models. Pricing models take into account the contract terms (including maturity), as well as multiple inputs including, where applicable, commodity prices, equity prices, interest rate yield curves, credit curves, correlation, creditworthiness of the counterparty, option volatility and currency rates. Where appropriate, valuation adjustments are made to account for various factors such as liquidity risk (bid-ask adjustments), credit quality, model uncertainty and concentration risk. Adjustments for liquidity risk adjust model-derived valuations of financial instruments for the bid-mid or mid-ask spread required to properly reflect the exit price of a risk position. Bid-mid and mid-ask spreads are marked to levels observed in trader activity, broker quotes or other external third-party data. Where these spreads are unobservable for the particular position in question, spreads are derived from observable levels of similar positions. Credit valuation adjustments are applied to both cash instruments and OTC derivatives. For cash instruments, the impact of changes in own credit spreads is considered when measuring the fair value of liabilities and the impact of changes in the counterparty’s credit spreads is considered when measuring the fair value of assets. For OTC derivatives, the impact of changes in both the Company’s and the counterparty’s credit standing is considered when measuring fair value. In determining the expected exposure the Company simulates the distribution of the future exposure to a counterparty, then applies market-based default probabilities to the future exposure, leveraging external third-party credit default swap (“CDS”) spread data. Where CDS spread data is unavailable for a specific counterparty, bond market spreads, CDS spread data based on the counterparty’s credit rating or CDS spread data that reference a comparable counterparty may be utilised. The Company also considers collateral held and legally enforceable master netting agreements that mitigate the Company’s exposure to each counterparty. Adjustments for model uncertainty are taken for positions where underlying models are reliant on significant inputs that are neither directly nor indirectly observable, hence requiring reliance on established theoretical concepts in their derivation. These adjustments are derived by making assessments of the possible degree of variability using statistical approaches and market-based information where possible. The Company generally subjects all valuations and models to a review process initially and on a periodic basis thereafter. The Company may apply a concentration adjustment to certain of its OTC derivatives portfolios to reflect the additional cost of closing out a particularly large risk exposure. Where possible, these adjustments are based on observable market information but in many instances significant judgement is required to estimate the costs of closing out concentrated risk exposures due to the lack of liquidity in the marketplace.
Fair value is a market-based measure considered from the perspective of a market participant rather than an entity-specific measure. Therefore, even when market assumptions are not readily available, the Company’s own assumptions are set to reflect those that the Company believes market participants would use in pricing the asset or liability at the measurement date.
Gains and losses on inception
In the normal course of business, the fair value of a financial instrument on initial recognition is the transaction price (i.e. the fair value of the consideration given or received). In certain circumstances, however, the fair value will be based on other observable current market transactions in the same instrument, without modification or repackaging, or on a valuation technique whose variables include only data from observable markets. When such evidence exists, the Company recognises a gain or loss on inception of the transaction.
When unobservable market data has a significant impact on determining fair value at the inception of the transaction, the entire initial gain or loss indicated by the valuation technique as at the transaction date is not recognised immediately in the statement of comprehensive income and is recognised instead when the market data becomes observable.

MORGAN STANLEY B.V. NOTES TO THE FINANCIAL STATEMENTS Year ended 31 December 2011
17
3. SUMMARY OF SIGNIFICANT ACCOUNTING POLICIES (CONTINU ED) e. Impairment of financial assets
At each reporting date, an assessment is made as to whether there is any objective evidence of impairment in the value of a financial asset classified as loans and receivables. Impairment losses are recognised if an event has occurred which will have an adverse impact on the expected future cash flows of an asset and the expected impact can be reliably estimated.
f. Income tax
The tax expense represents the sum of the tax currently paid and payable.
The tax currently payable is based on taxable profit for the year. Taxable profit may differ from net profit as reported in the statement of comprehensive income because it excludes items of income or expense that are taxable or deductible in other years and it further excludes items that are never taxable or deductible. The Company’s liability for current tax is calculated using tax rates that have been enacted or substantively enacted by the reporting date. Current tax is charged or credited in the statement of comprehensive income.
Current tax assets are offset against current tax liabilities when there is a legally enforceable right to set off current tax assets against current tax liabilities and when they relate to income taxes levied by the same taxation authority and the Company intends to settle its current tax assets and current tax liabilities on a net basis.
g. Cash and cash equivalents For the purposes of the statement of cash flows, cash and cash equivalents comprise cash and demand deposits with banks, along with highly liquid investments, with original maturities of three months or less, that are readily convertible to known amounts of cash and subject to insignificant risk of change in value. h. Offsetting of financial assets and financial liabilities
Where there is a legally enforceable right to set off the recognised amounts and an intention to settle on a net basis or to realise the asset and the liability simultaneously, financial assets and financial liabilities are offset and the net amount is presented on the statement of financial position. In the absence of such conditions, financial assets and financial liabilities are presented on a gross basis.
4. INTEREST INCOME AND INTEREST EXPENSE ‘Interest income’ and ‘Interest expense’ represent total interest income and total interest expense for financial assets and financial liabilities that are not carried at fair value.
No other gains or losses have been recognised in respect of loans and receivables other than as disclosed as ‘Interest income’ within the statement of comprehensive income.
No other gains or losses have been recognised in respect of financial liabilities measured at amortised cost other than as disclosed as ‘Interest expense’ within the statement of comprehensive income.
5. OTHER INCOME 2011 2010 €'000 €'000 Management charges to other Morgan Stanley Group undertakings 3,827 1,736

MORGAN STANLEY B.V. NOTES TO THE FINANCIAL STATEMENTS Year ended 31 December 2011
18
6. OTHER EXPENSE 2011 2010 €'000 €'000 Auditor's remuneration: Audit of the Company’s financial statements 86 84 Foreign exchange losses - 9 86 93 7. INCOME TAX EXPENSE 2011 2010 €'000 €'000 Current tax expense Current year 1,005 558 Adjustments in respect of prior years (11) (8)
Income tax expense 994 550
Reconciliation of effective tax rate
The current year income tax expense is lower than that resulting from applying the average standard rate of corporation tax in The Netherlands for the year of 25.0% (2010: 25.5%). The main differences are explained below:
2011 2010 €'000 €'000 Profit before income tax 4,020 2,188 Income tax using the standard rate of corporation tax in The Netherlands of 25.0% (2010: 25.5%)
1,005 558
Impact on tax of: Tax over provided in prior years (11) (8)
Total income tax expense in the statement of comprehensive income 994 550

MORGAN STANLEY B.V. NOTES TO THE FINANCIAL STATEMENTS Year ended 31 December 2011
19
8. FINANCIAL ASSETS AND FINANCIAL LIABILITIES CLASSIFI ED AS HELD FOR
TRADING Financial assets and financial liabilities classified as held for trading are summarised as follows: 2011 2010
Assets Liabilities Assets Liabilities
€'000 €'000 €'000 €'000 Derivatives 211,187 556,946 377,004 179,625
9. FINANCIAL ASSETS AND FINANCIAL LIABILITIES DESIGNAT ED AT FAIR VALUE
THROUGH PROFIT OR LOSS Financial instruments designated at fair value through profit or loss consist primarily of the following financial liabilities and financial assets:
Issued Structured Notes: These relate to financial liabilities which arise from selling structured products generally in the form of notes, certificates and warrants. These instruments contain an embedded derivative which significantly modifies the cash flows of the issuance. The return on the instrument is linked to an underlying that is not clearly and closely related to the debt host including, but not limited to equity-linked notes. The Structured Notes are designated at fair value as the risks to which the Company is a contractual party are risk managed on a fair value basis as part of the Company’s trading portfolio and the risk is reported to key management personnel on this basis.
Prepaid equity securities contracts: These contracts involve derivatives for which an initial payment is paid at inception. The contracts, along with the loans designated at fair value and the derivative contracts classified as held for trading, are part of the hedging strategy for the obligations arising pursuant to the issuance of the Structured Notes. The prepaid equity securities contracts are designated at fair value as the risks to which the Company is a contractual party are managed on a fair value basis as part of the Company’s trading portfolio and the risk is reported to key management personnel on this basis.
Loans: These are loans to other Morgan Stanley Group undertakings that, along with the prepaid equity securities contracts and the derivatives contracts classified as held for trading, are part of the hedging strategy for the obligations arising pursuant to the issuance of the Structured Notes. These loans are designated at fair value as the risks to which the Company is a contractual party are managed on a fair value basis as part of the Company’s trading portfolio and the risk is reported to key management personnel on this basis.
2011 2010
Assets Liabilities Assets Liabilities
€'000 €'000 €'000 €'000 Issued Structured Notes - 3,590,266 - 5,203,814 Prepaid equity securities contracts 829,187 - 1,370,462 - Loans 3,115,467 - 3,622,939 - 3,944,654 3,590,266 4,993,401 5,203,814

MORGAN STANLEY B.V. NOTES TO THE FINANCIAL STATEMENTS Year ended 31 December 2011
20
9.
FINANCIAL ASSETS AND FINANCIAL LIABILITIES DESIGNAT ED AT FAIR VALUE THROUGH PROFIT OR LOSS (CONTINUED)
The change in fair value of issued Structured Notes recognised through the statement of comprehensive income attributable to own credit risk is a gain of €210,404,000 (2010: loss of €34,301,000) and cumulatively is a gain of €240,387,000 (2010: gain of €29,983,000). This change is determined as the amount of change in fair value that is not attributable to changes in market conditions that give rise to market risk.
The change in fair value of prepaid equity securities contracts and loans recognised through the statement of comprehensive income attributable to changes in credit risk is a loss of €247,333,000 (2010: gain of €47,685,000) and cumulatively is a loss of €264,634,000 (2010: loss of €17,301,000).
The change in fair value of financial instruments designated at fair value through the profit or loss attributable to credit risk for the year is offset by a net gain of €36,929,000 (2010: loss of €13,384,000) and cumulatively is a net gain of €24,247,000 (2010: loss of €12,682,000), in changes in the fair value of financial instruments classified as held for trading attributable to credit risk.
The carrying amount of financial liabilities designated at fair value was €316,000,000 higher than the contractual amount due at maturity (2010: €167,802,000 lower).
The following table presents the carrying value of the Company’s financial liabilities designated at fair value through the profit or loss account, classified according to underlying security type, including, single name equities, equity indices and equity portfolio.
31 December 2011
Single name
equities Equity indices
Equity portfolio Other Total
€'000 €'000 €'000 €'000 €'000 Certificates and warrants 1,306,957 81,788 349,255 - 1,738,000
Notes 128,541 1,100,962 387,019 235,744 1,852,266
Total financial liabilities designated at fair value through profit or loss 1,435,498 1,182,750 736,274 235,744 3,590,266
31 December 2010
Single name
equities Equity indices
Equity portfolio Other Total
€'000 €'000 €'000 €'000 €'000 Certificates and warrants 3,083,389 277,851 608,509 - 3,969,749
Notes 80,138 629,782 275,473 248,672 1,234,065
Total financial liabilities designated at fair value through profit or loss 3,163,527 907,633 883,982 248,672 5,203,814
The majority of the Company’s financial liabilities designated at fair value through the profit or loss provide exposure to an underlying single name equity, an equity index or portfolio of equities. The prepaid equity securities contracts, derivatives and loans that the Company enters into to hedge the Structured Notes are valued as detailed in note 3(d) and note 16a, and have similar valuation inputs to the liabilities they hedge.

MORGAN STANLEY B.V. NOTES TO THE FINANCIAL STATEMENTS Year ended 31 December 2011
21
10. EQUITY Ordinary share capital
Ordinary shares of €100 each
Number Authorised At 1 January 2010, 31 December 2010 and 31 December 2011 400,000
Ordinary shares of €100 each
€'000 Issued and fully paid At 1 January 2010, 31 December 2010 and 31 December 2011 15,018 On 12 July 2011 the Articles of Association of the Company were partially amended at the general meeting of shareholders. The amendment resulted in a change to voting rights of the ordinary shares such that each share confers the right to cast one vote and that no shareholder of the Company shall have the right to cast more than one vote in total, irrespective of the number of shares held by the relevant shareholder.
The holders of ordinary shares are entitled to receive dividends as declared from time to time.
Refer to note 19 for details on the sale and transfer of shares in the current year.
Reserves The Company uses the contracts that it purchases from other Morgan Stanley Group undertakings to hedge the market price, interest rate, foreign currency and other market risks associated with the issuance of the Structured Notes, consistent with the Company’s risk management strategy. Both the contracts and the Structured Note issuances are valued at fair value through profit or loss. As such the Company is not exposed to any market risk on these financial instruments. The changes in fair value of the Structured Note issuances are fully hedged by the changes in fair value of these contracts. Therefore, a legal revaluation reserve under Part 9, Book 2 of the Dutch Civil Code (BW2, article 390(1)) is not necessary.

MORGAN STANLEY B.V. NOTES TO THE FINANCIAL STATEMENTS Year ended 31 December 2011
22
11. DIVIDENDS The following amounts represent the dividends paid in the current and prior year:
2011 2010 Per share Total Per share Total € €'000 € €'000
2010 Final dividend on ordinary shares 87.73 13,175 - -
2011 First interim dividend on ordinary shares 4.65 698 - -
2011 Second interim dividend on ordinary shares 3.49 524 - -
14,397 - 12. ADDITIONAL CASH FLOW INFORMATION a. Cash and cash equivalents
For the purposes of the statement of cash flows, cash and cash equivalents comprise the following balances, which have less than three months maturity from the date of acquisition:
2011 2010 €'000 €'000 Cash at bank 1,097 1,035

MORGAN STANLEY B.V. NOTES TO THE FINANCIAL STATEMENTS Year ended 31 December 2011
23
12. ADDITIONAL CASH FLOW INFORMATION b. Reconciliation of cash flows from operating activities
2011 2010 €'000 €'000 Profit for the year 3,026 1,638 Adjustments for: Interest income (408) (667) Interest expense 129 122 Income tax expense 994 550 Profit before changes in operating assets and liabilities 3,741 1,643 Changes in operating assets
Decrease/(increase) in loans and receivables, excluding cash at bank 92,602 (77,427)
Decrease/(increase) in financial assets classified as held for trading 165,817 (346,046)
Decrease/(increase) in financial assets designated at fair value through profit or loss 1,048,747 (2,174,722)
1,307,166 (2,598,195) Changes in operating liabilities (Decrease)/increase in financial liabilities at amortised cost (59,939) 51,517 Increase in financial liabilities classified as held for trading 377,321 170,855
(Decrease)/increase in financial liabilities designated at fair value through profit or loss (1,613,548) 2,369,306
(1,296,166) 2,591,678 Interest received 6 86 Interest paid (12) - Income taxes paid (276) (773) (282) (687)
Net cash flows from/(used in) operating activities 14,459 (5,561)

MORGAN STANLEY B.V. NOTES TO THE FINANCIAL STATEMENTS Year ended 31 December 2011
24
13. EXPECTED MATURITY OF ASSETS AND LIABILITIES The tables below show an analysis of assets and liabilities analysed according to when they are expected to be recovered, realised or settled:
At 31 December 2011 Equal to or Less than more than twelve twelve months months Total €'000 €'000 €'000 ASSETS
Loans and receivables: Cash at bank 1,097 - 1,097 Trade receivables 11,966 - 11,966 Other receivables 18,461 - 18,461 31,524 - 31,524 Financial assets classified as held for trading 57,810 153,377 211,187 Financial assets designated at fair value through profit or loss 1,152,233 2,792,421 3,944,654 1,241,567 2,945,798 4,187,365 LIABILITIES Financial liabilities at amortised cost: Trade payables 20,750 - 20,750 Other payables 1,932 - 1,932 22,682 - 22,682 Financial liabilities classified as held for trading 65,516 491,430 556,946 Financial liabilities designated at fair value through profit or loss 1,135,898 2,454,368 3,590,266 Current tax 649 - 649 1,224,745 2,945,798 4,170,543

MORGAN STANLEY B.V. NOTES TO THE FINANCIAL STATEMENTS Year ended 31 December 2011
25
13. EXPECTED MATURITY OF ASSETS AND LIABILITIES (CONTIN UED) At 31 December 2010 Equal to or Less than more than twelve twelve months months Total €'000 €'000 €'000 ASSETS Loans and receivables: Cash at bank 1,035 - 1,035 Trade receivables 94,979 - 94,979 Other receivables 27,648 - 27,648 123,662 - 123,662 Financial assets classified as held for trading 212,806 164,198 377,004 Financial assets designated at fair value through profit or loss 2,578,466 2,414,935 4,993,401 Current tax 69 - 69 2,915,003 2,579,133 5,494,136 LIABILITIES Financial liabilities at amortised cost: Trade payables 81,276 - 81,276 Other payables 1,228 - 1,228 82,504 - 82,504 Financial liabilities classified as held for trading 122,279 57,346 179,625 Financial liabilities designated at fair value through profit or loss 2,682,027 2,521,787 5,203,814 2,886,810 2,579,133 5,465,943 14. SEGMENT REPORTING Segment information is presented in respect of the Company’s business and geographical segments. The business segments and geographical segments are based on the Company’s management and internal reporting structure.
Business segments Morgan Stanley structures its business segments primarily based upon the nature of the financial products and services provided to customers and Morgan Stanley’s internal management structure. The Company’s own business segments are consistent with those of Morgan Stanley.
The Company has one reportable business segment, Institutional Securities, which provides financial services to financial institutions. Its business includes the issuance of financial instruments and the hedging of the obligations arising pursuant to such issuances.

MORGAN STANLEY B.V. NOTES TO THE FINANCIAL STATEMENTS Year ended 31 December 2011
26
14. SEGMENT REPORTING (CONTINUED) Geographical segments
The Company operates in three geographic regions as listed below:
• Europe, Middle East and Africa (“EMEA”)
• Americas
• Asia
The following table presents selected statement of comprehensive income and statement of financial position information of the Company’s operations by geographic area. The external revenues (net of interest expense) and total assets disclosed in the following table reflect the regional view of the Company’s operations, on a managed basis. The basis for attributing external revenues (net of interest expense) and total assets is determined by a combination of client and trading desk location.
EMEA Americas Asia Total 2011 2010 2011 2010 2011 2010 2011 2010 €'000 €'000 €'000 €'000 €'000 €'000 €'000 €'000
External revenues net of interest 3,088 1,882 576 75 448 324 4,106 2,281
Profit before income tax 3,018 1,805 564 72 438 311 4,020 2,188
Total assets 2,920,331 3,891,868 796,319 612,945 470,715 989,323 4,187,365 5,494,136 Of the Company’s external revenue, 100% (2010: 96%) arises from transactions with other Morgan Stanley Group undertakings.
15. FINANCIAL RISK MANAGEMENT Risk management procedures
Risk is an inherent part of both Morgan Stanley’s and the Company’s business activity and is managed by the Company within the context of the broader Morgan Stanley Group. The Morgan Stanley Group seeks to identify, assess, monitor and manage each of the various types of risk involved in its business activities in accordance with defined policies and procedures. The Company’s own risk management policies and procedures are consistent with those of the Morgan Stanley Group.
The principal activity of the Company is the issuance of financial instruments and the hedging of the obligations arising pursuant to such issuances. It is the policy and objective of the Company not to be exposed to market risk. On issuance of each financial instrument, the Company enters into hedges of its obligations by purchasing financial instruments from other Morgan Stanley Group undertakings.
Significant risks faced by the Company resulting from its trading activities are set out below.

MORGAN STANLEY B.V. NOTES TO THE FINANCIAL STATEMENTS Year ended 31 December 2011
27
15. FINANCIAL RISK MANAGEMENT (CONTINUED) Credit risk
Credit risk refers to the risk of loss arising from a borrower or counterparty default.
The Morgan Stanley Group manages credit risk exposure on a global basis, but in consideration of each individual legal entity, including those of the Company. The credit risk management policies and procedures of the Morgan Stanley Group include ensuring transparency of material credit risks, ensuring compliance with established limits, approving material extensions of credit and escalating risk concentrations to appropriate senior management. Credit risk management policies and procedures for the Company are consistent with those of the Morgan Stanley Group and include escalation to appropriate key management personnel of the Company.
The Company enters into the majority of its financial asset transactions, including derivatives classified as held for trading, with other Morgan Stanley Group undertakings, and both the Company and the other Morgan Stanley Group undertakings are wholly-owned subsidiaries of the same ultimate parent entity, Morgan Stanley. As a result of the implicit support that would be provided by Morgan Stanley the Company is considered exposed to the credit risk of Morgan Stanley, except where the Company transacts with other Morgan Stanley Group undertakings that have a higher credit rating to that of Morgan Stanley. The Company has therefore not entered into any credit enhancements to manage it’s exposure to credit risk.
The maximum exposure to credit risk of the Company at the reporting date is the carrying amount of the financial assets held in the statement of financial position.
The Company does not have any significant exposure arising from items not recognised on the statement of financial position.
Maximum exposure to credit risk by credit rating(1): Gross credit exposure Credit rating 2011 2010 €'000 €'000 AA 78 8 A 4,187,287 5,494,059 Total 4,187,365 5,494,067 (1) Internal credit rating derived using methodologies generally consistent with those used by external rating agencies. At 31 December 2011 there were no financial assets past due but not impaired or individually impaired (2010: None).
Liquidity risk
Liquidity risk is the risk that the entity may encounter difficulty in meeting obligations associated with financial liabilities that are settled by delivering cash or another financial asset.

MORGAN STANLEY B.V. NOTES TO THE FINANCIAL STATEMENTS Year ended 31 December 2011
28
15. FINANCIAL RISK MANAGEMENT (CONTINUED) Liquidity risk (continued)
The Morgan Stanley Group’s senior management establishes the overall liquidity and funding policies of the Morgan Stanley Group and the liquidity risk management policies and procedures conducted within the Company are consistent with those of the Morgan Stanley Group. The Morgan Stanley Group’s liquidity and funding risk management policies are designed to mitigate the potential risk that entities within the Morgan Stanley Group, including the Company, may be unable to access adequate financing to service their financial liabilities when they become payable without material, adverse franchise or business impact. The key objective of the liquidity and funding risk management framework is to support the successful execution of both the Morgan Stanley Group’s and the Company’s business strategies while ensuring ongoing and sufficient liquidity through the business cycle and during periods of stressed market conditions.
The Company hedges all of its issued Structured Notes with financial instruments entered into with other Morgan Stanley Group undertakings, where both the Company and the other Morgan Stanley Group undertakings are wholly-owned subsidiaries of the same group parent Company, Morgan Stanley. Further, the maturity profile of the financial assets matches the maturity profile of the financial liabilities.
Liquidity management policies
The core components of the Morgan Stanley Group’s liquidity management framework, which includes consideration of the liquidity risk for each individual legal entity, are the Contingency Funding Plan (“CFP”), Liquidity Stress Tests and the Global Liquidity Reserve. These elements support the Morgan Stanley Group’s target liquidity profile.
Contingency Funding Plan. The CFP describes the data and information flows, limits and triggers, escalation procedures, roles and responsibilities, and available mitigating actions in the event of a liquidity stress. The CFP assesses current and future funding sources and uses and establishes a plan for monitoring and managing a potential liquidity stress event. A set of escalation triggers identifies early signs of stress and activates a response plan.
Liquidity Stress Tests. Liquidity stress tests model liquidity outflows across multiple scenarios over a range of time horizons.
The assumptions underpinning the Liquidity Stress Tests include, but not limited to, the following: (i) no government support; (ii) no access to unsecured debt markets; (iii) repayment of all unsecured debt maturing within one year; (iv) higher haircuts and significantly lower availability of secured funding; (v) additional collateral that would be required by trading counterparties and certain exchanges and clearing organisations related to multi-notch credit rating downgrades; (vi) additional collateral that would be required due to collateral substitutions, collateral disputes and uncalled collateral; (vii) discretionary unsecured debt buybacks; (viii) drawdowns on unfunded commitments provided to third parties; (ix) client cash withdrawals and reduction in customer short positions that fund long positions; (x) limited access to the foreign exchange swap markets; (xi) return of securities borrowed on an uncollateralised basis; and (xii) maturity roll-off of outstanding letters of credit with no further issuance.
The Liquidity Stress Tests are produced at the Morgan Stanley Group and major operating subsidiary level, as well as major currency levels, to capture specific cash requirements and cash availability at various legal entities. The Liquidity Stress Tests assume that subsidiaries will use their own liquidity first to fund their obligations before drawing liquidity from Morgan Stanley. It is also assumed that Morgan Stanley does not have access to cash that may be held at certain subsidiaries that are subject to regulatory, legal or tax constraints.

MORGAN STANLEY B.V. NOTES TO THE FINANCIAL STATEMENTS Year ended 31 December 2011
29
15. FINANCIAL RISK MANAGEMENT (CONTINUED) Liquidity risk (continued)
Since the Company hedges the liquidity risk of its issued Structured Notes with financial instruments that match the maturity profile of the Structured Notes, the Company is not considered a major subsidiary for the purposes of liquidity risk. However, the Company would have access to the cash or liquidity reserves held by Morgan Stanley in the unlikely event they were unable to access adequate financing to service their financial liabilities when they become payable.
The CFP and Liquidity Stress Tests are evaluated on an on-going basis and reported to the Firm Risk Committee, Asset/Liability Management Committee, and other appropriate risk committees including the Morgan Stanley International Limited Board Risk Committee.
Global Liquidity Reserve. The Morgan Stanley Group maintains sufficient liquidity reserves (“the Global Liquidity Reserve”) to cover daily funding needs and meet strategic liquidity targets sized by the CFP and Liquidity Stress Tests. These liquidity targets are based on the Morgan Stanley Group’s risk tolerance, balance sheet level and composition, subsidiary funding needs, and upcoming debt maturities, which are subject to change dependent on market and firm-specific events.
The Global Liquidity Reserve, to which the Company has access, is held within Morgan Stanley and the Morgan Stanley Group’s major operating subsidiaries and consists of highly liquid and diversified cash and cash equivalents and unencumbered securities (including US government securities, US agency securities, US agency mortgage-backed securities, FDIC-guaranteed corporate debt and non-US government securities).
Funding management policies
The Morgan Stanley Group’s funding management policies are designed to provide for financings that are executed in a manner that reduces the risk of disruption to the Morgan Stanley Group’s and the Company’s operations. The Morgan Stanley Group pursues a strategy of diversification of secured and unsecured funding sources (by product, by investor and by region) and attempts to ensure that the tenor of the Morgan Stanley Group’s, and the Company’s, liabilities equals or exceeds the expected holding period of the assets being financed.
The Morgan Stanley Group funds its statement of financial position on a global basis through diverse sources, which include consideration of the funding risk of each legal entity. These sources may include the Morgan Stanley Group’s equity capital, long-term debt, repurchase agreements, securities lending, deposits, commercial paper, letters of credit and lines of credit. The Morgan Stanley Group has active financing programs for both standard and structured products, targeting global investors and currencies.
In managing both the Morgan Stanley Group’s and the Company’s funding risk the composition and size of the entire statement of financial position, not just financial liabilities, is monitored and evaluated. A substantial portion of the Morgan Stanley Group’s total assets consist of highly liquid marketable securities and short-term collateralised receivables arising from its Institutional Securities sales and trading activities. The liquid nature of these assets provides the Morgan Stanley Group and the Company with flexibility in financing and managing its business.

MORGAN STANLEY B.V. NOTES TO THE FINANCIAL STATEMENTS Year ended 31 December 2011
30
15. FINANCIAL RISK MANAGEMENT (CONTINUED) Liquidity risk (continued)
Maturity analysis
In the following maturity analysis of financial assets and financial liabilities, derivative contracts, financial assets designated at fair value through profit or loss and financial liabilities designated at fair value through profit or loss are disclosed according to their earliest contractual maturity; all such amounts are presented at their fair value, consistent with how these financial instruments are managed. All other amounts represent the undiscounted cash flows receivable and payable by the Company arising from its financial assets and financial liabilities to earliest contractual maturities as at 31 December 2011. Receipt of financial assets and repayments of financial liabilities that are subject to immediate notice are treated as if notice were given immediately and are classified as on demand. This presentation is considered by the Company to appropriately reflect the liquidity risk arising from these financial assets and financial liabilities, presented in a way that is consistent with how the liquidity risk on these financial assets and financial liabilities is managed by the Company.
Equal to Equal to or more or more than one than two year but years Equal to Less than not more but less or more On one than two than five than five demand year years years years Total 31 December 2011 €'000 €'000 €'000 €'000 €'000 €'000
Financial assets
Loans and receivables: Cash at bank 1,097 - - - - 1,097
Trade receivables 11,966 - - - - 11,966
Other receivables 18,461 - - - - 18,461
Financial assets classified as held for trading:
Derivatives 76,243 16,926 5,878 77,022 35,118 211,187
Financial assets designated at fair value through profit or loss: Prepaid equity securities contracts 479,908 44,536 203,031 74,129 27,583 829,187
Loans 1,400,197 215,357 145,210 1,081,505 273,198 3,115,467
Total financial assets 1,987,872 276,819 354,119 1,232,656 335,899 4,187,365
Financial liabilities
Financial liabilities at amortised cost:
Trade payables 20,750 - - - - 20,750
Other payables 1,932 - - - - 1,932
Financial liabilities classified as held for trading:
Derivatives 261,294 38,317 35,913 185,724 35,698 556,946
Financial liabilities designated at fair value through profit or loss: Issued Structured Notes 1,686,425 238,502 318,206 1,046,932 300,201 3,590,266
Total financial liabilities 1,970,401 276,819 354,119 1,232,656 335,899 4,169,894

MORGAN STANLEY B.V. NOTES TO THE FINANCIAL STATEMENTS Year ended 31 December 2011
31
15. FINANCIAL RISK MANAGEMENT (CONTINUED) Liquidity risk (continued)
Equal to Equal to or more or more than one than two year but years Equal to Less than not more but less or more On one than two than five than 5 demand year years years years Total 31 December 2010 €'000 €'000 €'000 €'000 €'000 €'000
Financial assets
Loans and receivables:
Cash at bank 1,035 - - - - 1,035 Trade receivables 94,979 - - - - 94,979
Other receivables 27,648 - - - - 27,648
Financial assets classified as held for trading: Derivatives 190,619 129,452 21,029 28,908 6,996 377,004
Financial assets designated at fair value through profit or loss: Prepaid equity securities contracts 1,051,998 145,350 14,396 93,344 65,374 1,370,462
Loans 2,862,641 288,815 85,781 308,211 77,491 3,622,939
Total financial assets 4,228,920 563,617 121,206 430,463 149,861 5,494,067
Financial liabilities
Financial liabilities at amortised cost: Trade payables 81,276 - - - - 81,276
Other payables 1,228 - - - - 1,228
Financial liabilities classified as held for trading:
Derivatives 158 123,290 31,894 8,928 15,355 179,625
Financial liabilities designated at fair value through profit or loss:
Issued Structured Notes 4,118,134 440,327 89,312 421,535 134,506 5,203,814
Total financial liabilities 4,200,796 563,617 121,206 430,463 149,861 5,465,943
Market risk
Market risk is defined under IFRS 7 ‘Financial instruments: disclosures’ as the risk that the fair value or future cash flows of a financial instrument will fluctuate because of changes in market prices.
Sound market risk management is an integral part of the Company’s and the Morgan Stanley Group’s culture. The Company is responsible for ensuring that market risk exposures are well-managed and prudent and more broadly for ensuring transparency of material market risks, monitoring compliance with established limits, and escalating risk concentrations to appropriate senior management.

MORGAN STANLEY B.V. NOTES TO THE FINANCIAL STATEMENTS Year ended 31 December 2011
32
15. FINANCIAL RISK MANAGEMENT (CONTINUED) Market risk (continued)
To execute these responsibilities, the Morgan Stanley Group monitors the market risk of the firm against limits on aggregate risk exposures, performs a variety of risk analyses, routinely reports risk summaries and maintains the Value at Risk system. The Company is managed within the Morgan Stanley Group’s global framework. The market risk management policies and procedures of the Company include performing risk analyses and reporting any material risks identified to appropriate key management personnel of the Company.
The Company enters into the majority of its financial asset transactions with other Morgan Stanley Group undertakings, where both the Company and the other Morgan Stanley Group undertakings are wholly-owned subsidiaries of the same group parent entity, Morgan Stanley.
The issued Structured Notes expose the Company to the risk of changes in market prices of the underlying securities, interest rate risk and, where denominated in currencies other than Euros, the risk of changes in rates of exchange between the Euro and the other relevant currencies. The Company uses the contracts that it purchases from other Morgan Stanley Group undertakings to hedge the market price, interest rate and foreign currency risks associated with the issuance of the Structured Notes, consistent with the Company’s risk management strategy. As such, the Company is not exposed to any market risk on these financial instruments.
16. FINANCIAL INSTRUMENTS MEASURED AT FAIR VALUE a. Fair value hierarchy disclosure
Financial instruments recognised at fair value are broken down for disclosure purposes into a three level fair value hierarchy based on the observability of inputs as follows:
• Quoted prices (unadjusted) in an active market for identical assets or liabilities (Level 1) – Valuations based on quoted prices in active markets for identical assets or liabilities that the Morgan Stanley Group has the ability to access. Valuation adjustments and block discounts are not applied to Level 1 instruments. Since valuations are based on quoted prices that are readily and regularly available in an active market, valuation of these products does not entail a significant degree of judgement.
• Valuation techniques using observable inputs (Level 2) – Valuations based on one or more quoted prices in markets that are not active or for which all significant inputs are observable, either directly or indirectly.
• Valuation techniques with significant unobservable inputs (Level 3) – Valuations based on inputs that are unobservable and significant to the overall fair value measurement.
Fair value control processes
The Company employs control processes to validate the fair value of its financial instruments, including those derived from pricing models. These control processes are designed to assure that the values used for financial reporting are based on observable inputs wherever possible. In the event that observable inputs are not available, the control processes are designed to assure that the valuation approach utilised is appropriate and consistently applied and that the assumptions are reasonable. These control processes include reviews of the pricing model’s theoretical soundness and appropriateness by Morgan Stanley Group personnel with relevant expertise who are independent from the trading desks.

MORGAN STANLEY B.V. NOTES TO THE FINANCIAL STATEMENTS Year ended 31 December 2011
33
16. FINANCIAL INSTRUMENTS MEASURED AT FAIR VALUE (CONTI NUED) a. Fair value hierarchy disclosure (continued)
Additionally, groups independent from the trading divisions within the financial control, market risk and credit risk management departments participate in the review and validation of the fair values generated from pricing models, as appropriate. Where a pricing model is used to determine fair value, recently executed comparable transactions and other observable market data are considered for purposes of validating assumptions underlying the model.
Financial assets and liabilities recognised at fair value
The following tables present the carrying value of the Company’s financial assets and liabilities recognised at fair value, classified according to the fair value hierarchy described above:
2011 Valuation Valuation techniques Quoted techniques with prices in using significant active observable unobservable market inputs inputs (Level 1) (Level 2) (Level 3) Total €'000 €'000 €'000 €'000 Financial assets classified as held for trading: Derivatives - 173,008 38,179 211,187
Financial assets designated at fair value through profit or loss: Prepaid equity securities contracts - 772,064 57,123 829,187 Loans - 3,115,467 - 3,115,467
Total financial assets measured at fair value - 4,060,539 95,302 4,155,841 Financial liabilities classified as held for trading: Derivatives - 470,582 86,364 556,946 Financial liabilities designated at fair value through profit or loss: Certificates and warrants - 1,738,000 - 1,738,000 Notes - 1,422,406 429,860 1,852,266
Total financial liabilities measured at fair value - 3,630,988 516,224 4,147,212

MORGAN STANLEY B.V. NOTES TO THE FINANCIAL STATEMENTS Year ended 31 December 2011
34
16. FINANCIAL INSTRUMENTS MEASURED AT FAIR VALUE (CONTI NUED) a. Fair value hierarchy disclosure (continued)
2010 Valuation Valuation techniques Quoted techniques with prices in using significant active observable unobservable market inputs inputs (Level 1) (Level 2) (Level 3) Total €'000 €'000 €'000 €'000 Financial assets classified as held for trading: Derivatives - 299,443 77,561 377,004
Financial assets designated at fair value through profit or loss: Prepaid equity securities contracts - 1,253,000 117,462 1,370,462 Loans - 3,622,939 - 3,622,939
Total financial assets measured at fair value - 5,175,382 195,023 5,370,405 Financial liabilities classified as held for trading: Derivatives - 103,002 76,623 179,625
Financial liabilities designated at fair value through profit or loss: Certificates and warrants - 3,969,749 - 3,969,749 Notes - 1,000,752 233,313 1,234,065
Total financial liabilities measured at fair value - 5,073,503 309,936 5,383,439

MORGAN STANLEY B.V. NOTES TO THE FINANCIAL STATEMENTS Year ended 31 December 2011
35
16. FINANCIAL INSTRUMENTS MEASURED AT FAIR VALUE (CONTI NUED) a. Fair value hierarchy disclosure (continued)
The Company’s valuation approach and fair value hierarchy categorisation for certain significant classes of financial instruments recognised at fair value is as follows:
Financial assets and financial liabilities classified as held for trading
• Derivatives
OTC derivative contracts include forward, swap and option contracts related to interest rates, foreign currencies or equity prices.
Depending on the product and the terms of the transaction, the fair value of OTC derivative products can be either observed or modelled using a series of techniques, and model inputs from comparable benchmarks, including closed-form analytic formulas, such as the Black-Scholes option-pricing model, and simulation models or a combination thereof. Many pricing models do not entail material subjectivity because the methodologies employed do not necessitate significant judgement, and the pricing inputs are observed from actively quoted markets, as is the case for generic interest rate swaps, certain option contracts and certain credit default swaps. In the case of more established derivative products, the pricing models used by the Company are widely accepted by the financial services industry. A substantial majority of OTC derivative products valued using pricing models fall into this category and are categorised within Level 2 of the fair value hierarchy. In instances where significant inputs are unobservable, they are categorised in Level 3 of the fair value hierarchy.
Financial assets and financial liabilities designated at fair value through profit or loss
• Prepaid equity security contracts and issued Structured Notes
The Company issues Structured Notes and trades prepaid equity security contracts that have coupons or repayment terms linked to the performance of debt or equity securities, indices or currencies. The fair value of Structured Notes and prepaid equity security contracts is determined using valuation models for the derivative and debt portions of the notes. These models incorporate observable inputs referencing identical or comparable securities, including prices that the notes are linked to, interest rate yield curves, option volatility and currency, commodity or equity rates. Independent, external and traded prices for the notes are also considered. The impact of own credit spreads is also included based on observed secondary bond market spreads. Most issued Structured Notes and prepaid equity security contracts are categorised in Level 2 of the fair value hierarchy. In instances where significant inputs are unobservable, they are categorised in Level 3 of the fair value hierarchy.
• Loans
The fair value of loans to other Morgan Stanley Group undertakings is estimated based on the present value of expected future cash flows using its best estimate of interest rate yield curves. The loans are generally categorised in Level 2 of the fair value hierarchy.

MORGAN STANLEY B.V. NOTES TO THE FINANCIAL STATEMENTS Year ended 31 December 2011
36
16. FINANCIAL INSTRUMENTS MEASURED AT FAIR VALUE (CONTI NUED) a. Fair value hierarchy disclosure (continued)
• Notes
Notes give a risk exposure tailored to market views and risk appetite and mainly provide exposure to the underlying single name equity, equity index or portfolio of equities. Typically, the redemption payment of the note is significantly dependent on the value of embedded equity derivatives. In general, call and put options, digital options, straddles and callability features are combined to create a bespoke coupon rate or redemption payoff for each note issuance, with risk exposure to one or more equity underlyings or indices. The Company values the embedded derivatives using market standard models, which are assessed for appropriateness at least annually. Model inputs, such as equity forward rates, equity implied volatility and equity correlations, are marked such that the fair value of the derivatives match prices observable in the inter-dealer markets. In arriving at fair value, the Company uses discount rates appropriate to the funding rates specific to the instrument. In general, this results in overnight rates being used to discount the Company assets and liabilities. In addition, since the notes bear Morgan Stanley’s credit risk, the Company considers this when assessing the fair value of the notes, by adjusting the discount rates to reflect the prevailing credit spread at the reporting date.
The Company has a small number of notes where the cash flows due on the notes is dependent on embedded derivatives linked to the interest rate, foreign exchange or commodity markets. The Company values these notes in the same way as for equity-linked notes, by using market standard models and marking the inputs to match prices observed in the inter-dealer OTC markets. Similarly to equity-linked notes, these issuances bear Morgan Stanley’s credit risk, and the valuation is assessed accordingly.
• Certificates and warrants
Certificates and warrants provide exposure to the underlying single name equity, equity index or portfolio of equities. They therefore provide risk exposure to the value of the underlying position and to the dividends paid or received. The Company values the underlying position using observable data where available (for instance, exchange closing prices), or alternatively using information from third parties (for example net asset values obtained from fund administrators) or using Morgan Stanley’s own valuation assumptions if required. The Company estimates future dividend payments using a variety of available data, including market prices for forwards and futures, analytical review and estimates of future tax rates, incorporating the Company’s own assumptions where required. The certificates can typically be redeemed at short notice and so the certificates and warrants provide minimal exposure to the credit risk of Morgan Stanley.
b. Changes in Level 3 assets and liabilities measured at fair value
The following table presents the changes in the fair value of the Company’s Level 3 financial assets and financial liabilities for the year ended 31 December 2011. Level 3 instruments may be hedged with instruments classified in Level 2. As a result, the realised and unrealised gains or losses do not reflect the related realised and unrealised gains or losses on the loans that have been classified by the Company within Level 2. Additionally, both observable and unobservable inputs may be used to determine the fair value of positions that the Company has classified within the Level 3 category. As a result, the unrealised gains or losses during the period for assets and liabilities within the Level 3 category presented in the tables below may include changes in fair value during the period that were attributable to both observable (e.g., changes in market interest rates) and unobservable (e.g., changes in unobservable long-dated volatilities) inputs:

MORGAN STANLEY B.V. NOTES TO THE FINANCIAL STATEMENTS Year ended 31 December 2011
37
16. FINANCIAL INSTRUMENTS MEASURED AT FAIR VALUE (CONTI NUED) b. Changes in Level 3 assets and liabilities measured at fair value (continued)
2011 Unrealised
gains /
(losses) for level 3 assets
Total gains or
Pu
rcha
ses
Issu
ance
s
Se
ttle
me
nts
Net /liabilities (losses) transfers outstanding
Balance recognised in in and/or Balance at as at 31
at 1 statement of out of 31 December
January comprehensive Level 3 December 2011
2011 income (1) 2011 (2)
€'000 €'000 €'000 €'000 €'000 €'000 €'000 €'000
Financial assets classified as held for trading:
Net derivative contracts (3) 938 (72,970) - - 21,874 1,973 (48,185) (49,127)
Financial assets designated at fair value through profit or loss:
Prepaid equity securities contracts 117,462 (19,102) 16,723 - (54,812) (3,148) 57,123 (22,370)
Total financial assets measured at fair value 118,400 (92,072) 16,723 - (32,938) (1,175) 8,938 (71,497)
Financial liabilities designated at fair value through profit or loss:
Issued Structured Notes (233,313) 4,855 - (296,619) 91,630 3,587 (429,860) 42,279
Total financial liabilities measured at fair value (233,313) 4,855 - (296,619) 91,630 3,587 (429,860) 42,279
(1) For financial assets and financial liabilities that were transferred into and out of Level 3 during the year, gains or (losses) are presented as if the assets or liabilities had been transferred into or out of Level 3 as at the beginning of the year.
(2) Amounts represent unrealised gains or (losses) for the year ended 31 December 2011 related to assets and liabilities still outstanding at 31 December 2011. The unrealised gains or (losses) are recognised in the statement of comprehensive income as detailed in the financial instruments accounting policy (note 3c).
(3) Net derivative contracts represent Financial assets classified as held for trading – derivative contracts net of Financial liabilities classified as held for trading – derivative contracts. All cash flows on derivative contracts are presented in settlements.

MORGAN STANLEY B.V. NOTES TO THE FINANCIAL STATEMENTS Year ended 31 December 2011
38
16. FINANCIAL INSTRUMENTS MEASURED AT FAIR VALUE (CONTI NUED) b. Changes in Level 3 assets and liabilities measured at fair value (continued)
As disclosed in Note 19 the Morgan Stanley Group operates a number of intra-group policies to ensure that, where possible, revenues and related costs are matched. Where the trading positions included in the above table are risk managed using financial instruments held by other Morgan Stanley Group undertakings, these policies potentially result in the recognition of offsetting gains or losses in the Company.
During the year, the Company reclassified approximately €7,120,000 of net derivative contracts, €5,695,000 of prepaid equity securities contracts and €27,580,000 of issued Structured Notes from Level 2 to Level 3. The reclassifications were due to a reduction in the volume of recently executed transactions or a lack of available broker quotes for these instruments, such that certain significant inputs became unobservable.
During the year, the Company reclassified approximately €5,147,000 of net derivative contracts, €8,843,000 of prepaid equity securities contracts and €31,167,000 of issued Structured Notes from Level 3 to Level 2. The reclassifications were due to the availability of market quotations for these or comparable instruments, or available broker quotes, or consensus data such that certain significant inputs became observable.

MORGAN STANLEY B.V. NOTES TO THE FINANCIAL STATEMENTS Year ended 31 December 2011
39
16. FINANCIAL INSTRUMENTS MEASURED AT FAIR VALUE (CONTI NUED) b. Changes in Level 3 assets and liabilities measured at fair value (continued)
2010 Unrealised
gains /
(losses) for
level 3 assets
Total gains or
Pu
rcha
ses
Issu
ance
s
Se
ttle
me
nts
Net /liabilities
losses transfers outstanding
Balance recognised in in and/or Balance at as at 31
at 1 statement of out of 31 December
January comprehensive Level 3 December 2010
2010 income (1) 2010 (2) €'000 €'000 €'000 €'000 €'000 €'000 €'000 €'000
Financial assets classified as held for trading:
Net derivative contracts (3) 1,406 3,217 - - 8,140 (11,825) 938 3,217
Financial assets designated at fair value through profit or loss:
Prepaid equity securities contracts 72,488 7,126 49,058 - (22,116) 10,906 117,462 7,126
Total financial assets measured at fair value 73,894 10,343 49,058 - (13,976) (919) 118,400 10,343
Financial liabilities designated at fair value through profit or loss:
Issued Structured Notes (112,070) (6,935) - (142,479) 23,465 4,706 (233,313) (6,935)
Total financial liabilities measured at fair value (112,070) (6,935) - (142,479) 23,465 4,706 (233,313) (6,935)
(1) For financial assets and financial liabilities that were transferred into and out of Level 3 during the year, gains or (losses) are presented as if the assets or liabilities had been transferred into or out of Level 3 as at the beginning of the year.
(2) Amounts represent unrealised gains or (losses) for the year ended 31 December 2010 related to assets and liabilities still outstanding at 31 December 2010. The unrealised gains or (losses) are recognised in the statement of comprehensive income as detailed in the financial instruments accounting policy (note 3c)
(3) Net derivative contracts represent Financial assets classified as held for trading – derivative contracts net of Financial liabilities classified as held for trading – derivative contracts. All cash flows on derivative contracts are presented in settlements.

MORGAN STANLEY B.V. NOTES TO THE FINANCIAL STATEMENTS Year ended 31 December 2011
40
16. FINANCIAL INSTRUMENTS MEASURED AT FAIR VALUE (CONTI NUED) b. Changes in Level 3 assets and liabilities measured at fair value (continued)
As disclosed in Note 19 the Morgan Stanley Group operates a number of intra-group policies to ensure that, where possible, revenues and related costs are matched. Where the trading positions included in the above table are risk managed using financial instruments held by other Morgan Stanley Group undertakings, these policies potentially result in the recognition of offsetting gains or losses in the Company.
During 2010, the Company reclassified approximately €11,121,000 liability of net derivative contracts, €10,906,000 of prepaid equity securities contracts and €15,721,000 of issued Structured Notes from Level 2 to Level 3. The reclassifications were due to a reduction in the volume of recently executed transactions or a lack of available broker quotes for these instruments, such that certain significant inputs became unobservable.
During 2010, the Company reclassified approximately €704,000 asset of net derivative contracts and €20,427,000 of issued Structured Notes from Level 3 to Level 2. The reclassifications were due to the availability of market quotations for these or comparable instruments, or available broker quotes, or consensus data such that certain significant inputs became observable.
c. Significant transfers between Level 1 and Level 2 of the fair value hierarchy
There were no transfers between Level 1 and Level 2 of the fair value hierarchy during the current and prior year.
d. Sensitivity of fair values to changing significant assumptions to reasonably possible alternatives
All financial instruments are valued in accordance with the techniques outlined in the fair value hierarchy disclosure above. Some of these techniques, including those used to value instruments categorised in Level 3 of the fair value hierarchy, are dependent on unobservable parameters and the fair value for these financial instruments has been determined using parameters appropriate for the valuation methodology based on prevailing market evidence. It is recognised that the unobservable parameters could have a range of reasonably possible alternative values.
In estimating the change in fair value, the unobservable parameters were varied to the extremes of the ranges of reasonably possible alternatives using statistical techniques, such as dispersion in comparable observable external inputs for similar asset classes, historic data or judgement if a statistical technique is not appropriate. Where a financial instrument has more than one unobservable parameter, the sensitivity analysis reflects the greatest reasonably possible increase or decrease to fair value by varying the assumptions individually. It is unlikely that all unobservable parameters would be concurrently at the extreme range of possible alternative assumptions and therefore the sensitivity shown below is likely to be greater than the actual uncertainty relating to the financial instruments.
The following tables present the sensitivity of the fair value of Level 3 financial assets and financial liabilities to reasonably possible alternative assumptions.

MORGAN STANLEY B.V. NOTES TO THE FINANCIAL STATEMENTS Year ended 31 December 2011
41
16. FINANCIAL INSTRUMENTS MEASURED AT FAIR VALUE (CONTI NUED) d. Sensitivity of fair values to changing significant assumptions to reasonably possible
alternatives (continued)
Effect of reasonably possible
alternative assumptions 2011
Fair value Increase in fair
value Decrease in fair
value €'000 €'000 €'000
Financial assets designated at fair value through profit or loss: Prepaid equity securities contracts 57,123 1,186 (1,137)
Financial liabilities classified as held for trading: Net derivatives contracts: Equity (48,185) 25,430 (23,412)
Financial liabilities designated at fair value through profit or loss: Issued Structured Notes (429,860) (26,616) 24,549
(1) Net derivative contracts represent Financial assets classified as held for trading – derivative contracts net of Financial liabilities classified as held for trading – derivative contracts.
Effect of reasonably possible
alternative assumptions 2010
Fair value Increase in fair
value Decrease in fair
value €'000 €'000 €'000 Financial assets classified as held for trading: Net derivatives contracts: Equity 938 8,156 (6,177)
Financial assets designated at fair value through profit or loss: Prepaid equity securities contracts 117,462 3,328 (5,307)
Financial liabilities designated at fair value through profit or loss: Issued Structured Notes (233,313) (11,484) 11,484
(1) Net derivative contracts represent Financial assets classified as held for trading – derivative contracts net of Financial liabilities classified as held for trading – derivative contracts.

MORGAN STANLEY B.V. NOTES TO THE FINANCIAL STATEMENTS Year ended 31 December 2011
42
17. FINANCIAL INSTRUMENTS NOT MEASURED AT FAIR VALUE For all financial assets and financial liabilities not measured at fair value, the carrying amount is considered to be a reasonable approximation of fair value due to the short term nature of these financial assets and liabilities.
18. CAPITAL MANAGEMENT The Morgan Stanley Group manages its capital on a global basis with consideration for its legal entities. The capital managed by the Morgan Stanley Group broadly includes ordinary share capital, preference share capital, subordinated loans and reserves.
The Morgan Stanley Group’s capital estimation is based on the Required Capital Framework, an internal capital adequacy measure. The framework is a risk-based internal use of capital measure, which is compared with the Morgan Stanley Group’s regulatory capital to help ensure the Morgan Stanley Group maintain an amount of risk-based going concern capital after absorbing potential losses from extreme stress events at a point in time. The difference between the Morgan Stanley Group’s regulatory capital and aggregate Required Capital is the Morgan Stanley Group’s Parent capital.
Tier 1 capital and common equity attribution to the business segments is based on capital usage calculated by Required Capital. In principle, each business segment is capitalised as if it were an operating entity with limited diversification benefit between the business segments. Required Capital is assessed at each business segment and further attributed to product lines. This process is intended to align capital with the risks in each business segment in order to allow senior management to evaluate returns on a risk-adjusted basis.
The Required Capital Framework will evolve over time in response to changes in the business and regulatory environment and to incorporate enhancements in modelling techniques.
The Morgan Stanley Group actively manages its consolidated capital position based upon, among other things, business opportunities, risks, capital availability and rates of return together with internal capital policies, regulatory requirements and rating agency guidelines and, therefore, in the future may expand or contract its capital base to address the changing needs of its businesses.
The Morgan Stanley Group also aims to adequately capitalise at a legal entity level whilst safeguarding that entity’s ability to continue as a going concern and ensuring that it meets all regulatory capital requirements, so that it can continue to provide returns for the Morgan Stanley Group.
The Company manages the following items as capital: 2011 2010 €'000 €'000 Share capital 15,018 15,018 Reserves 1,804 13,175 16,822 28,193

MORGAN STANLEY B.V. NOTES TO THE FINANCIAL STATEMENTS Year ended 31 December 2011
43
19. RELATED PARTY DISCLOSURES Parent and ultimate controlling entity
On 9 August 2011 the Company’s immediate parent undertaking, Morgan Stanley International Holdings Inc., agreed on the sale and transfer of one ordinary share of €100 to Morgan Stanley International Limited and 150,178 ordinary shares of €100 each to Archimedes Investments Coöperatieve U.A. Following the sale and transfer of these ordinary shares, Archimedes Investments Coöperatieve U.A. became the
Company’s immediate parent undertaking. Archimedes Investments Coöperatieve U.A. is registered in The Netherlands.
The Company’s ultimate parent undertaking and controlling entity and the largest group of which the Company is a member and for which group financial statements are prepared is Morgan Stanley. Morgan Stanley is incorporated in the state of Delaware, the United States of America and copies of its financial statements can be obtained from 25 Cabot Square, Canary Wharf, London E14 4QA.
Key management compensation Key management personnel are defined as those persons having authority and responsibility for planning, directing and controlling the activities of the Company. Key management personnel includes the Board of Directors of Morgan Stanley B.V., plus key business unit management.
Compensation paid to key management personnel in respect of their services rendered to the Company is: 2011 2010 €'000 €'000 Short-term employee benefits 38 56 Post-employment benefits 1 1 Share-based payments 6 5 Other long-term employee benefits 16 2 Termination benefits 7 - Management fees 308 195 376 259 The share-based payment costs disclosed above reflect the amortisation of equity-based awards granted to key management personnel over the last three years and are therefore not directly aligned with other staff costs in the current year.
Key management personnel compensation is borne by other Morgan Stanley Group undertakings in both the current year and prior year.
Transactions with related parties
The Morgan Stanley Group conducts business for clients globally through a combination of both functional and legal entity organisational structures. Accordingly, the Company is closely integrated with the operations of the Morgan Stanley Group and enters into transactions with other Morgan Stanley Group undertakings on an arm’s length basis for the purposes of utilising financing, trading and risk management, and infrastructure services. The nature of these relationships along with information about the transactions and outstanding balances is given below. The Company has not recognised any expense and has made no provision for impairment relating to the amount of outstanding balances from related parties (2010: €nil).
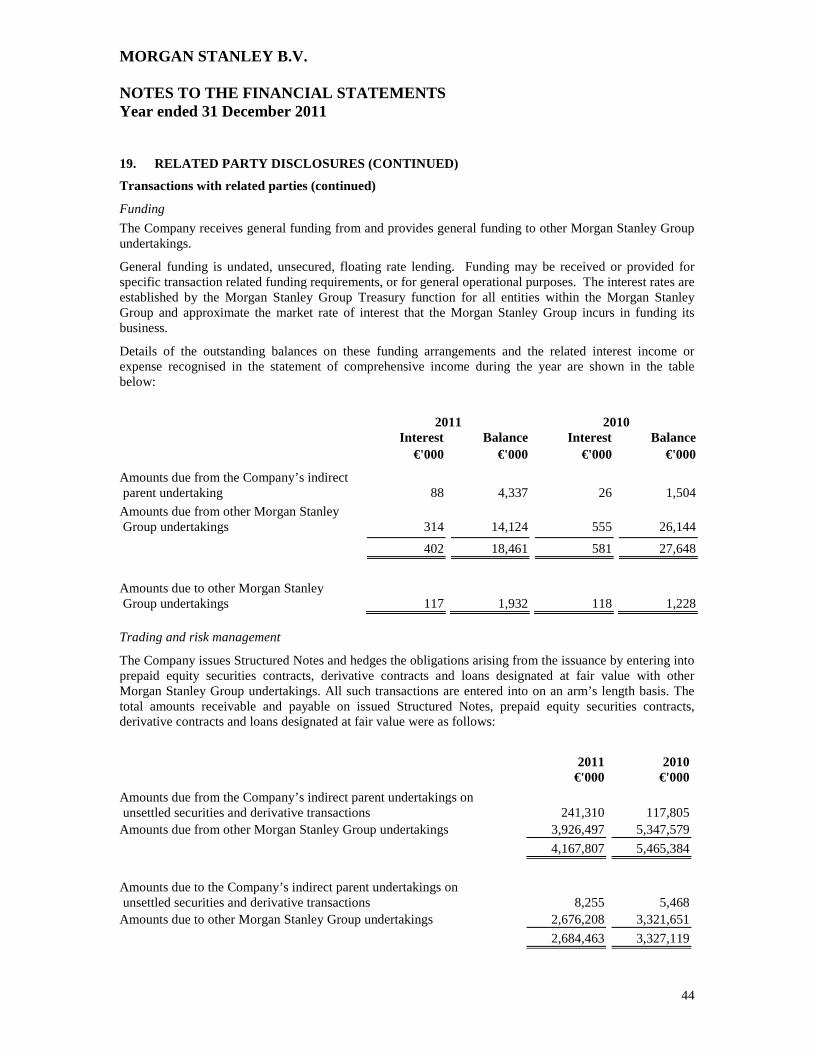
MORGAN STANLEY B.V. NOTES TO THE FINANCIAL STATEMENTS Year ended 31 December 2011
44
19. RELATED PARTY DISCLOSURES (CONTINUED) Transactions with related parties (continued)
Funding
The Company receives general funding from and provides general funding to other Morgan Stanley Group undertakings.
General funding is undated, unsecured, floating rate lending. Funding may be received or provided for specific transaction related funding requirements, or for general operational purposes. The interest rates are established by the Morgan Stanley Group Treasury function for all entities within the Morgan Stanley Group and approximate the market rate of interest that the Morgan Stanley Group incurs in funding its business.
Details of the outstanding balances on these funding arrangements and the related interest income or expense recognised in the statement of comprehensive income during the year are shown in the table below:
2011 2010 Interest Balance Interest Balance €'000 €'000 €'000 €'000
Amounts due from the Company’s indirect parent undertaking 88 4,337 26 1,504
Amounts due from other Morgan Stanley Group undertakings 314 14,124 555 26,144 402 18,461 581 27,648
Amounts due to other Morgan Stanley Group undertakings 117 1,932 118 1,228 Trading and risk management
The Company issues Structured Notes and hedges the obligations arising from the issuance by entering into prepaid equity securities contracts, derivative contracts and loans designated at fair value with other Morgan Stanley Group undertakings. All such transactions are entered into on an arm’s length basis. The total amounts receivable and payable on issued Structured Notes, prepaid equity securities contracts, derivative contracts and loans designated at fair value were as follows:
2011 2010 €'000 €'000
Amounts due from the Company’s indirect parent undertakings on unsettled securities and derivative transactions 241,310 117,805 Amounts due from other Morgan Stanley Group undertakings 3,926,497 5,347,579
4,167,807 5,465,384
Amounts due to the Company’s indirect parent undertakings on unsettled securities and derivative transactions 8,255 5,468 Amounts due to other Morgan Stanley Group undertakings 2,676,208 3,321,651
2,684,463 3,327,119

MORGAN STANLEY B.V. NOTES TO THE FINANCIAL STATEMENTS Year ended 31 December 2011
45
19. RELATED PARTY DISCLOSURES (CONTINUED) Transactions with related parties (continued)
In addition, the management and execution of business strategies on a global basis results in many Morgan Stanley transactions impacting a number of Morgan Stanley Group undertakings. The Morgan Stanley Group operates a number of intra-group policies to ensure that, where possible, revenues and related costs are matched. For the year ended 31 December 2011, a net gain of €1,759,000 was recognised in the statement of comprehensive income arising from such policies (2010: net gain of €1,736,000).
Infrastructure services
In the current and prior year, the Company uses infrastructure services including the provision of office facilities, operated by other Morgan Stanley Group undertakings at no charge. 20. EVENTS AFTER THE REPORTING PERIOD On 30 March 2012 the Company issued 11,252,813 of Convertible Preferred Equity Securities (“CPEC”) of €100 each to Archimedes Investments Coöperatieve U.A. in exchange for cash consideration of €1,125,281,000.

MORGAN STANLEY B.V. ADDITIONAL INFORMATION Year ended 31 December 2011
46
Independent auditor’s report The independent auditor’s report is recorded on the next page. Statutory rules concerning appropriation of the net result The Articles of Incorporation of the Company provide that the net result for the year is at the disposition of the Annual General Meeting of Shareholders. Appropriation of the net result for the year The statement of financial position is presented after the proposed appropriation of net result for the year ended 31 December 2011. The Directors propose to add profit to the statement of comprehensive income as part of the equity shareholders’ funds. Subsequent events On 30 March 2012 the Company issued 11,252,813 of Convertible Preferred Equity Securities (“CPEC”) of €100 each to Archimedes Investments Coöperatieve U.A. in exchange for cash consideration of €1,125,281,000.

INDEPENDENT AUDITOR’S REPORT TO THE MEMBERS OF MORG AN STANLEY B.V.
47
Independent auditor’s report To: the shareholders of Morgan Stanley B.V.
Report on the financial statements We have audited the accompanying financial statements 2011 of Morgan Stanley B.V., Amsterdam, which comprise the statement of financial position as at 2011, the statements of comprehensive income, changes in equity and cash flows for the year then ended and notes, comprising a summary of the significant accounting policies and other explanatory information.
Management's responsibility Management is responsible for the preparation and fair presentation of these financial statements in accordance with International Financial Reporting Standards as adopted by the European Union and with Part 9 of Book 2 of the Dutch Civil Code, and for the preparation of the Director’s report in accordance with Part 9 of Book 2 of the Dutch Civil Code. Furthermore management is responsible for such internal control as it determines is necessary to enable the preparation of the financial statements that are free from material misstatement, whether due to fraud or error.
Auditor's responsibility Our responsibility is to express an opinion on these financial statements based on our audit. We conducted our audit in accordance with Dutch law, including the Dutch Standards on Auditing. This requires that we comply with ethical requirements and plan and perform the audit to obtain reasonable assurance about whether the financial statements are free from material misstatement. An audit involves performing procedures to obtain audit evidence about the amounts and disclosures in the financial statements. The procedures selected depend on the auditor's judgment, including the assessment of the risks of material misstatement of the financial statements, whether due to fraud or error. In making those risk assessments, the auditor considers internal control relevant to the entity's preparation and fair presentation of the financial statements in order to design audit procedures that are appropriate in the circumstances, but not for the purpose of expressing an opinion on the effectiveness of the entity's internal control. An audit also includes evaluating the appropriateness of accounting policies used and the reasonableness of accounting estimates made by management, as well as evaluating the overall presentation of the financial statements. We believe that the audit evidence we have obtained is sufficient and appropriate to provide a basis for our audit opinion.

INDEPENDENT AUDITOR’S REPORT TO THE MEMBERS OF MORG AN STANLEY B.V.
48
Opinion with respect to the financial statements In our opinion, the financial statements give a true and fair view of the financial position of Morgan Stanley B.V. as at December 31, 2011 and of its result and its cash flows for the year then ended in accordance with International Financial Reporting Standards as adopted by the European Union and with Part 9 of Book 2 of the Dutch Civil Code.
Report on other legal and regulatory requirements Pursuant to the legal requirement under Section 2:393 sub 5 at e and f of the Dutch Civil Code, we have no deficiencies to report as a result of our examination whether the Director’s report, to the extent we can assess, has been prepared in accordance with Part 9 of Book 2 of this Code, and whether the information as required under Section 2:392 sub 1 at b-h has been annexed. Further we report that the Director’s report, to the extent we can assess, is consistent with the financial statements as required by Section 2:391 sub 4 of the Dutch Civil Code. Amsterdam, 24 April 2012 Deloitte Accountants B.V. Signed by: W.H.E van Ommeren