regions financial corp - files.shareholder.comfiles.shareholder.com/downloads/amda-j4ztd... ·...
TRANSCRIPT
REGIONS FINANCIAL CORP
FORM 10-Q(Quarterly Report)
Filed 08/06/12 for the Period Ending 06/30/12
Address 1900 FIFTH AVENUE NORTH
BIRMINGHAM, AL 35203Telephone 205-944-1300
CIK 0001281761Symbol RF
SIC Code 6021 - National Commercial BanksIndustry Regional Banks
Sector FinancialFiscal Year 12/31
http://www.edgar-online.com© Copyright 2012, EDGAR Online, Inc. All Rights Reserved.
Distribution and use of this document restricted under EDGAR Online, Inc. Terms of Use.

Table of Contents
UNITED STATES
SECURITIES AND EXCHANGE COMMISSION
Washington, D.C. 20549
Form 10-Q
For the quarterly period ended June 30, 2012
or
For the transition period from to
Commission File Number: 000-50831
Regions Financial Corporation (Exact name of registrant as specified in its charter)
(205) 944-1300 (Registrant’s telephone number, including area code)
NOT APPLICABLE (Former name, former address and former fiscal year, if changed since last report)
Indicate by check mark whether the registrant (1) has filed all reports required to be filed by Section 13 or 15(d) of the Securities Exchange Act of 1934 during the preceding 12 months (or for such shorter period that the registrant was required to file such reports), and (2) has been subject to such filing requirements for the past 90 days. Yes � No
Indicate by check mark whether the registrant has submitted electronically and posted on its corporate Web site, if any, every Interactive Data File required to be submitted and posted pursuant to Rule 405 of Regulation S-T (§232.405 of this chapter) during the preceding 12 months (or for such shorter period that the registrant was required to submit and post such files). Yes � No
Indicate by check mark whether the registrant is a large accelerated filer, an accelerated filer, a non-accelerated filer, or a smaller reporting company. See the definitions of “large accelerated filer”, “accelerated filer” and “smaller reporting company” in Rule 12b-2 of the Exchange Act. (Check one): Large accelerated filer Accelerated filer � Non-accelerated filer � (Do not check if a smaller reporting company) Smaller reporting company �
Indicate by check mark whether the registrant is a shell company (as defined in Rule 12b-2 of the Exchange Act). � Yes No
The number of shares outstanding of each of the issuer’s classes of common stock was 1,413,343,477 shares of common stock, par value $.01, outstanding as of July 25, 2012.
Quarterly report pursuant to Section 13 or 15(d) of the Securities Exchange Act of 1934
� Transition report pursuant to Section 13 or 15(d) of the Securities Exchange Act of 1934
Delaware 63-0589368 (State or other jurisdiction of
incorporation or organization) (IRS Employer
Identification No.)
1900 Fifth Avenue North Birmingham, Alabama 35203
(Address of principal executive offices) (Zip Code)
Table of Contents
REGIONS FINANCIAL CORPORATION
FORM 10-Q
INDEX
2
Page Part I. Financial Information
Item 1. Financial Statements (Unaudited)
Consolidated Balance Sheets—June 30, 2012 and December 31, 2011 5 Consolidated Statements of Income—Three and six months ended June 30, 2012 and 2011 6 Consolidated Statements of Comprehensive Income—Three and six months ended June 30, 2012 and 2011 7
Consolidated Statements of Changes in Stockholders’ Equity—Six months ended June 30, 2012 and 2011 8
Consolidated Statements of Cash Flows—Six months ended June 30, 2012 and 2011 9 Notes to Consolidated Financial Statements 10 Item 2. Management’s Discussion and Analysis of Financial Condition and Results of Operations 65 Item 3. Quantitative and Qualitative Disclosures about Market Risk 106 Item 4. Controls and Procedures 106
Part II. Other Information
Item 1. Legal Proceedings 107 Item 2. Unregistered Sales of Equity Securities and Use of Proceeds 107 Item 6. Exhibits 108
Signatures 109

Table of Contents
Forward-Looking Statements
This Quarterly Report on Form 10-Q, other periodic reports filed by Regions Financial Corporation (“Regions”) under the Securities Exchange Act of 1934, as amended, and any other written or oral statements made by or on behalf of Regions may include forward-looking statements. The Private Securities Litigation Reform Act of 1995 (the “Act”) provides a “safe harbor” for forward-looking statements which are identified as such and are accompanied by the identification of important factors that could cause actual results to differ materially from the forward-looking statements. For these statements, we, together with our subsidiaries, unless the context implies otherwise, claim the protection afforded by the safe harbor in the Act. Forward-looking statements are not based on historical information, but rather are related to future operations, strategies, financial results or other developments. Forward-looking statements are based on management’s expectations as well as certain assumptions and estimates made by, and information available to, management at the time the statements are made. Those statements are based on general assumptions and are subject to various risks, uncertainties and other factors that may cause actual results to differ materially from the views, beliefs and projections expressed in such statements. These risks, uncertainties and other factors include, but are not limited to, those described below:
3
• The Dodd-Frank Wall Street Reform and Consumer Protection Act (the “Dodd-Frank Act”) became law on July 21, 2010, and a number of legislative, regulatory and tax proposals remain pending. Additionally, the U.S. Treasury and federal banking regulators continue to implement, but are also beginning to wind down, a number of programs to address capital and liquidity in the banking system. Future and proposed rules, including those that are part of the Basel III process, are expected to require banking institutions to increase levels of capital. All of the foregoing may have significant effects on Regions and the financial services industry, the exact nature and extent of which cannot be determined at this time.
• Possible additional loan losses, impairment of goodwill and other intangibles, and adjustment of valuation allowances on deferred
tax assets and the impact on earnings and capital.
• Possible changes in interest rates may increase funding costs and reduce earning asset yields, thus reducing margins. Increases in
benchmark interest rates would also increase debt service requirements for customers whose terms include a variable interest rate, which may negatively impact the ability of borrowers to pay as contractually obligated.
• Possible changes in general economic and business conditions in the United States in general and in the communities Regions
serves in particular, including any prolonging or worsening of the current unfavorable economic conditions, including unemployment levels.
• Possible changes in the creditworthiness of customers and the possible impairment of the collectability of loans.
• Possible changes in trade, monetary and fiscal policies, laws and regulations, and other activities of governments, agencies, and
similar organizations, may have an adverse effect on business.
• Possible regulations issued by the Consumer Financial Protection Bureau or other regulators which might adversely impact
Regions’ business model or products and services. • Possible stresses in the financial and real estate markets, including possible continued deterioration in property values.
• Regions’ ability to manage fluctuations in the value of assets and liabilities and off-balance sheet exposure so as to maintain
sufficient capital and liquidity to support Regions’ business. • Regions’ ability to expand into new markets and to maintain profit margins in the face of competitive pressures.
• Regions’ ability to develop competitive new products and services in a timely manner and the acceptance of such products and
services by Regions’ customers and potential customers.

Table of Contents
The words “believe,” “expect,” “anticipate,” “project,” and similar expressions often signify forward-looking statements. You should not place undue reliance on any forward-looking statements, which speak only as of the date made. We assume no obligation to update or revise any forward-looking statements that are made from time to time.
See also the “Forward-Looking Statements” and “Risk Factors” sections of Regions’ Annual Report on Form 10-K for the year ended December 31, 2011 and the “Forward-Looking Statements” section of Regions’ Quarterly Report on Form 10-Q for the quarter ended March 31, 2012, as filed with the Securities and Exchange Commission.
4
• Regions’ ability to keep pace with technological changes.
• Regions’ ability to effectively manage credit risk, interest rate risk, market risk, operational risk, legal risk, liquidity risk,
reputational risk, and regulatory and compliance risk. • Regions’ ability to ensure adequate capitalization which is impacted by inherent uncertainties in forecasting credit losses.
• The cost and other effects of material contingencies, including litigation contingencies, and any adverse judicial, administrative, or
arbitral rulings or proceedings. • The effects of increased competition from both banks and non-banks. • The effects of geopolitical instability and risks such as terrorist attacks.
• Possible changes in consumer and business spending and saving habits could affect Regions’ ability to increase assets and to attract
deposits.
• The effects of weather and natural disasters such as floods, droughts, wind, tornadoes and hurricanes, and the effects of man-made
disasters. • Possible downgrades in ratings issued by rating agencies. • Possible changes in the speed of loan prepayments by Regions’ customers and loan origination or sales volumes.
• Possible acceleration of prepayments on mortgage-backed securities due to low interest rates, and the related acceleration of
premium amortization on those securities.
• The effects of problems encountered by larger or similar financial institutions that adversely affect Regions or the banking industry
generally. • Regions’ ability to receive dividends from its subsidiaries. • The effects of the failure of any component of Regions’ business infrastructure which is provided by a third party.
• Changes in accounting policies or procedures as may be required by the Financial Accounting Standards Board or other regulatory
agencies. • The effects of any damage to Regions’ reputation resulting from developments related to any of the items identified above.

Table of Contents
PART I FINANCIAL INFORMATION
Item 1. Financial Statements (Unaudited)
REGIONS FINANCIAL CORPORATION AND SUBSIDIARIES CONSOLIDATED BALANCE SHEETS
See notes to consolidated financial statements.
5
June 30
2012 December 31
2011 (In millions, except share data)
Assets Cash and due from banks $ 2,000 $ 2,132 Interest-bearing deposits in other banks 1,766 4,913 Federal funds sold and securities purchased under agreements to resell — 200 Trading account assets 110 1,266 Securities available for sale 27,232 24,471 Securities held to maturity 13 16 Loans held for sale (includes $950 and $844 measured at fair value, respectively) 1,187 1,193 Loans, net of unearned income 76,202 77,594 Allowance for loan losses (2,291 ) (2,745 )
Net loans 73,911 74,849 Other interest-earning assets 901 1,085 Premises and equipment, net 2,300 2,375 Interest receivable 341 361 Goodwill 4,816 4,816 Mortgage servicing rights 179 182 Other identifiable intangible assets 391 449 Other assets 7,198 8,742
Total assets $ 122,345 $ 127,050
Liabilities and Stockholders’ Equity Deposits:
Non-interest-bearing $ 29,694 $ 28,266 Interest-bearing 65,404 67,361
Total deposits 95,098 95,627 Borrowed funds:
Short-term borrowings: Federal funds purchased and securities sold under agreements to repurchase 2,746 2,333 Other short-term borrowings 560 734
Total short-term borrowings 3,306 3,067 Long-term borrowings 6,230 8,110
Total borrowed funds 9,536 11,177 Other liabilities 3,256 3,747
Total liabilities 107,890 110,551 Stockholders’ equity:
Preferred stock, authorized 10 million shares Series A, cumulative perpetual participating, par value $1.00 (liquidation preference $1,000.00) per share, net of
discount; Issued—0 and 3,500,000 shares, respectively — 3,419
Common stock, par value $.01 per share: Authorized 3 billion shares Issued including treasury stock—1,454,542,017 and 1,301,230,838 shares, respectively 15 13
Additional paid-in capital 19,898 19,060 Retained earnings (deficit) (4,136 ) (4,527 ) Treasury stock, at cost—41,198,540 and 42,414,444 shares, respectively (1,376 ) (1,397 ) Accumulated other comprehensive income (loss), net 54 (69 )
Total stockholders’ equity 14,455 16,499
Total liabilities and stockholders’ equity $ 122,345 $ 127,050
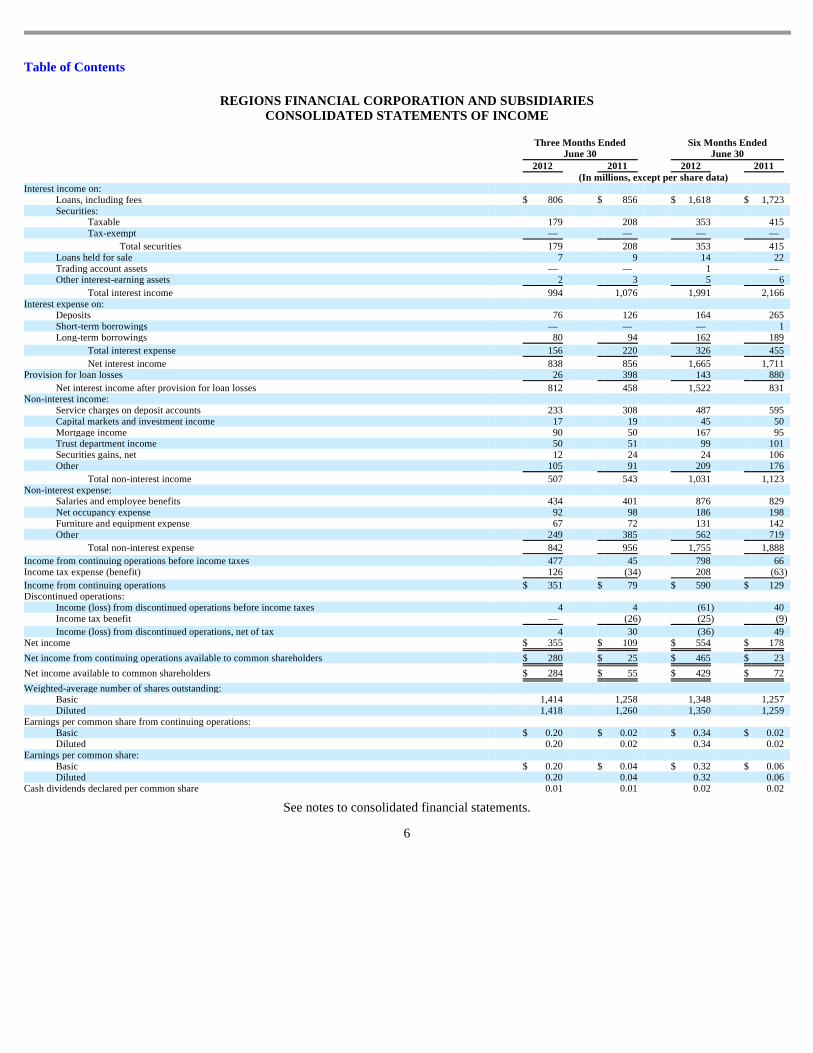
Table of Contents
REGIONS FINANCIAL CORPORATION AND SUBSIDIARIES CONSOLIDATED STATEMENTS OF INCOME
See notes to consolidated financial statements.
6
Three Months Ended
June 30 Six Months Ended
June 30 2012 2011 2012 2011 (In millions, except per share data) Interest income on:
Loans, including fees $ 806 $ 856 $ 1,618 $ 1,723 Securities:
Taxable 179 208 353 415 Tax-exempt — — — —
Total securities 179 208 353 415 Loans held for sale 7 9 14 22 Trading account assets — — 1 — Other interest-earning assets 2 3 5 6
Total interest income 994 1,076 1,991 2,166 Interest expense on:
Deposits 76 126 164 265 Short-term borrowings — — — 1 Long-term borrowings 80 94 162 189
Total interest expense 156 220 326 455
Net interest income 838 856 1,665 1,711 Provision for loan losses 26 398 143 880
Net interest income after provision for loan losses 812 458 1,522 831 Non-interest income:
Service charges on deposit accounts 233 308 487 595 Capital markets and investment income 17 19 45 50 Mortgage income 90 50 167 95 Trust department income 50 51 99 101 Securities gains, net 12 24 24 106 Other 105 91 209 176
Total non-interest income 507 543 1,031 1,123 Non-interest expense:
Salaries and employee benefits 434 401 876 829 Net occupancy expense 92 98 186 198 Furniture and equipment expense 67 72 131 142 Other 249 385 562 719
Total non-interest expense 842 956 1,755 1,888
Income from continuing operations before income taxes 477 45 798 66 Income tax expense (benefit) 126 (34 ) 208 (63 )
Income from continuing operations $ 351 $ 79 $ 590 $ 129 Discontinued operations:
Income (loss) from discontinued operations before income taxes 4 4 (61 ) 40 Income tax benefit — (26 ) (25 ) (9 )
Income (loss) from discontinued operations, net of tax 4 30 (36 ) 49 Net income $ 355 $ 109 $ 554 $ 178
Net income from continuing operations available to common shareholders $ 280 $ 25 $ 465 $ 23
Net income available to common shareholders $ 284 $ 55 $ 429 $ 72
Weighted-average number of shares outstanding: Basic 1,414 1,258 1,348 1,257 Diluted 1,418 1,260 1,350 1,259
Earnings per common share from continuing operations: Basic $ 0.20 $ 0.02 $ 0.34 $ 0.02 Diluted 0.20 0.02 0.34 0.02
Earnings per common share: Basic $ 0.20 $ 0.04 $ 0.32 $ 0.06 Diluted 0.20 0.04 0.32 0.06
Cash dividends declared per common share 0.01 0.01 0.02 0.02
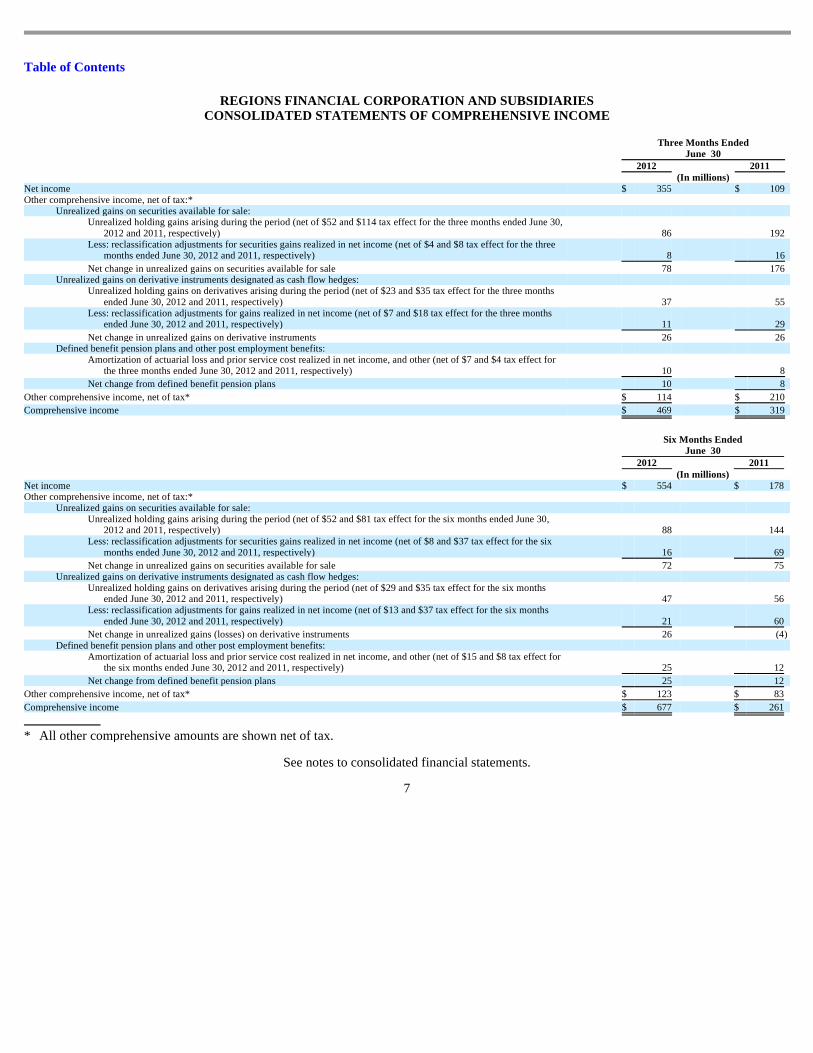
Table of Contents
REGIONS FINANCIAL CORPORATION AND SUBSIDIARIES CONSOLIDATED STATEMENTS OF COMPREHENSIVE INCOME
See notes to consolidated financial statements.
7
Three Months Ended
June 30 2012 2011 (In millions) Net income $ 355 $ 109 Other comprehensive income, net of tax:*
Unrealized gains on securities available for sale: Unrealized holding gains arising during the period (net of $52 and $114 tax effect for the three months ended June 30,
2012 and 2011, respectively) 86 192 Less: reclassification adjustments for securities gains realized in net income (net of $4 and $8 tax effect for the three
months ended June 30, 2012 and 2011, respectively) 8 16
Net change in unrealized gains on securities available for sale 78 176 Unrealized gains on derivative instruments designated as cash flow hedges:
Unrealized holding gains on derivatives arising during the period (net of $23 and $35 tax effect for the three months ended June 30, 2012 and 2011, respectively) 37 55
Less: reclassification adjustments for gains realized in net income (net of $7 and $18 tax effect for the three months ended June 30, 2012 and 2011, respectively) 11 29
Net change in unrealized gains on derivative instruments 26 26 Defined benefit pension plans and other post employment benefits:
Amortization of actuarial loss and prior service cost realized in net income, and other (net of $7 and $4 tax effect for the three months ended June 30, 2012 and 2011, respectively) 10 8
Net change from defined benefit pension plans 10 8
Other comprehensive income, net of tax* $ 114 $ 210
Comprehensive income $ 469 $ 319
Six Months Ended
June 30 2012 2011 (In millions) Net income $ 554 $ 178 Other comprehensive income, net of tax:*
Unrealized gains on securities available for sale: Unrealized holding gains arising during the period (net of $52 and $81 tax effect for the six months ended June 30,
2012 and 2011, respectively) 88 144 Less: reclassification adjustments for securities gains realized in net income (net of $8 and $37 tax effect for the six
months ended June 30, 2012 and 2011, respectively) 16 69
Net change in unrealized gains on securities available for sale 72 75 Unrealized gains on derivative instruments designated as cash flow hedges:
Unrealized holding gains on derivatives arising during the period (net of $29 and $35 tax effect for the six months ended June 30, 2012 and 2011, respectively) 47 56
Less: reclassification adjustments for gains realized in net income (net of $13 and $37 tax effect for the six months ended June 30, 2012 and 2011, respectively) 21 60
Net change in unrealized gains (losses) on derivative instruments 26 (4 ) Defined benefit pension plans and other post employment benefits:
Amortization of actuarial loss and prior service cost realized in net income, and other (net of $15 and $8 tax effect for the six months ended June 30, 2012 and 2011, respectively) 25 12
Net change from defined benefit pension plans 25 12
Other comprehensive income, net of tax* $ 123 $ 83
Comprehensive income $ 677 $ 261
* All other comprehensive amounts are shown net of tax.
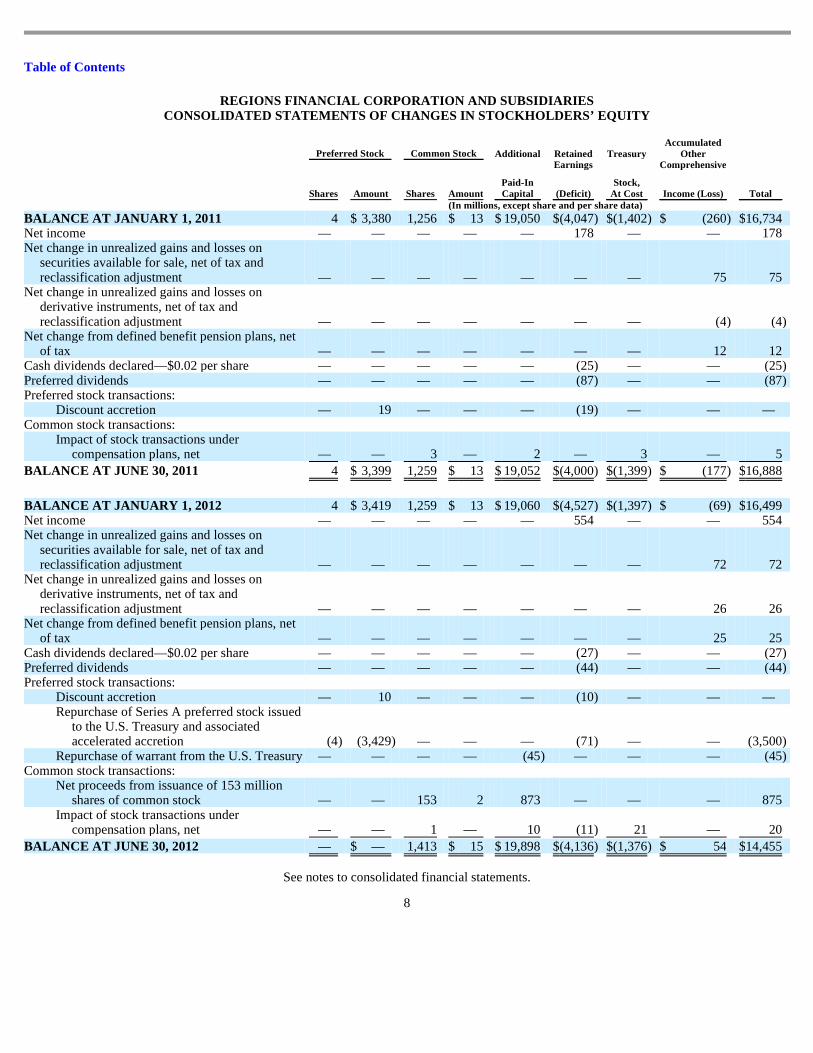
Table of Contents
REGIONS FINANCIAL CORPORATION AND SUBSIDIARIES CONSOLIDATED STATEMENTS OF CHANGES IN STOCKHOLDERS’ EQUITY
See notes to consolidated financial statements.
8
Preferred Stock Common Stock Additional
Paid-In Capital
Retained Earnings
(Deficit)
Treasury
Stock,
At Cost
Accumulated
Other Comprehensive
Income (Loss)
Total
Shares Amount Shares Amount (In millions, except share and per share data)
BALANCE AT JANUARY 1, 2011 4 $ 3,380 1,256 $ 13 $ 19,050 $ (4,047 ) $ (1,402 ) $ (260 ) $ 16,734 Net income — — — — — 178 — — 178 Net change in unrealized gains and losses on
securities available for sale, net of tax and reclassification adjustment — — — — — — — 75 75
Net change in unrealized gains and losses on derivative instruments, net of tax and reclassification adjustment — — — — — — — (4 ) (4 )
Net change from defined benefit pension plans, net of tax — — — — — — — 12 12
Cash dividends declared—$0.02 per share — — — — — (25 ) — — (25 ) Preferred dividends — — — — — (87 ) — — (87 ) Preferred stock transactions:
Discount accretion — 19 — — — (19 ) — — — Common stock transactions:
Impact of stock transactions under compensation plans, net — — 3 — 2 — 3 — 5
BALANCE AT JUNE 30, 2011 4 $ 3,399 1,259 $ 13 $ 19,052 $ (4,000 ) $ (1,399 ) $ (177 ) $ 16,888
BALANCE AT JANUARY 1, 2012 4 $ 3,419 1,259 $ 13 $ 19,060 $ (4,527 ) $ (1,397 ) $ (69 ) $ 16,499 Net income — — — — — 554 — — 554 Net change in unrealized gains and losses on
securities available for sale, net of tax and reclassification adjustment — — — — — — — 72 72
Net change in unrealized gains and losses on derivative instruments, net of tax and reclassification adjustment — — — — — — — 26 26
Net change from defined benefit pension plans, net of tax — — — — — — — 25 25
Cash dividends declared—$0.02 per share — — — — — (27 ) — — (27 ) Preferred dividends — — — — — (44 ) — — (44 ) Preferred stock transactions:
Discount accretion — 10 — — — (10 ) — — — Repurchase of Series A preferred stock issued
to the U.S. Treasury and associated accelerated accretion (4 ) (3,429 ) — — — (71 ) — — (3,500 )
Repurchase of warrant from the U.S. Treasury — — — — (45 ) — — — (45 ) Common stock transactions:
Net proceeds from issuance of 153 million shares of common stock — — 153 2 873 — — — 875
Impact of stock transactions under compensation plans, net — — 1 — 10 (11 ) 21 — 20
BALANCE AT JUNE 30, 2012 — $ — 1,413 $ 15 $ 19,898 $ (4,136 ) $ (1,376 ) $ 54 $ 14,455

Table of Contents
REGIONS FINANCIAL CORPORATION AND SUBSIDIARIES CONSOLIDATED STATEMENTS OF CASH FLOWS
See notes to consolidated financial statements.
9
Six Months Ended
June 30 2012 2011 (In millions)
Operating activities:
Net income $ 554 $ 178 Adjustments to reconcile net cash provided by operating activities:
Provision for loan losses 143 880 Depreciation and amortization of premises and equipment 125 138 Provision for losses on other real estate, net 18 58 Net amortization of securities 144 92 Net amortization of loans and other assets 77 98 Net amortization of borrowings 2 1 Net securities gains (24 ) (106 ) Gain on disposition of business (15 ) — Deferred income tax expense (benefit) 201 (81 ) Excess tax benefits from share-based payments (1 ) — Originations and purchases of loans held for sale (2,834 ) (2,624 ) Proceeds from sales of loans held for sale 2,732 3,525 Gain on sale of loans, net (62 ) (37 ) Valuation charges on loans held for sale 8 6 Branch consolidation and property and equipment charges — 77 Decrease (increase) in trading account assets 193 (107 ) (Increase) decrease in other interest-earning assets (182 ) 12 Decrease in interest receivable 17 67 (Increase) decrease in other assets (102 ) 1,246 Increase (decrease) in other liabilities 39 (543 ) Other 4 (38 )
Net cash from operating activities 1,037 2,842 Investing activities:
Proceeds from sales of securities available for sale 1,670 6,479 Proceeds from maturities of securities available for sale 3,209 2,291 Proceeds from maturities of securities held to maturity 3 4 Purchases of securities available for sale (6,970 ) (9,178 ) Proceeds from sales of loans 411 816 Purchases of loans (407 ) (1,545 ) Net decrease in loans 746 585 Net purchases of premises and equipment (79 ) (128 ) Proceeds from disposition of business, net of cash transferred 855 —
Net cash from investing activities (562 ) (676 ) Financing activities:
Net (decrease) increase in deposits (529 ) 1,717 Net increase (decrease) in short-term borrowings 1,168 (1,215 ) Proceeds from long-term borrowings — 1,001 Payments on long-term borrowings (1,853 ) (2,502 ) Cash dividends on common stock (27 ) (25 ) Cash dividends on preferred stock (44 ) (87 ) Net proceeds from issuance of common stock 875 — Repurchase of Series A preferred stock (3,500 ) — Repurchase of warrant (45 ) — Excess tax benefits from share-based payments 1 —
Net cash from financing activities (3,954 ) (1,111 )
(Decrease) increase in cash and cash equivalents (3,479 ) 1,055 Cash and cash equivalents at beginning of year 7,245 6,919
Cash and cash equivalents at end of period $ 3,766 $ 7,974

Table of Contents
REGIONS FINANCIAL CORPORATION AND SUBSIDIARIES
NOTES TO CONSOLIDATED FINANCIAL STATEMENTS (Unaudited)
Three and Six Months Ended June 30, 2012 and 2011
NOTE 1—Basis of Presentation
Regions Financial Corporation (“Regions” or the “Company”) provides a full range of banking and bank-related services to individual and corporate customers through its subsidiaries and branch offices located primarily in Alabama, Arkansas, Florida, Georgia, Illinois, Indiana, Iowa, Kentucky, Louisiana, Mississippi, Missouri, North Carolina, South Carolina, Tennessee, Texas and Virginia. The Company is subject to competition from other financial institutions, is subject to the regulations of certain government agencies and undergoes periodic examinations by those regulatory authorities.
The accounting and reporting policies of Regions and the methods of applying those policies that materially affect the consolidated financial statements conform with accounting principles generally accepted in the United States (“GAAP”) and with general financial services industry practices. The accompanying interim financial statements have been prepared in accordance with the instructions for Form 10-Q and, therefore, do not include all information and notes to the consolidated financial statements necessary for a complete presentation of financial position, results of operations, comprehensive income and cash flows in conformity with GAAP. In the opinion of management, all adjustments, consisting of normal and recurring items, necessary for the fair presentation of the consolidated financial statements have been included. These interim financial statements should be read in conjunction with the consolidated financial statements and notes thereto in Regions’ Form 10-K for the year ended December 31, 2011. Regions has evaluated all subsequent events for potential recognition and disclosure through the filing date of this Form 10-Q.
Beginning with first quarter 2012 financial reporting, as required by new accounting literature, Regions began presenting separate consolidated statements of comprehensive income. Comprehensive income (loss) is the total of net income and all other non-owner changes in equity. Items are recognized as components of comprehensive income (loss) and are displayed net of tax in the consolidated statements of comprehensive income (loss). In the calculation of comprehensive income (loss), certain reclassification adjustments are made to avoid double-counting items that are displayed as part of net income (loss) for a period that also had been displayed as part of other comprehensive income (loss) in that period or earlier periods. The prior period is also shown for comparability.
On January 11, 2012, Regions entered into an agreement to sell Morgan Keegan & Company, Inc. (“Morgan Keegan”) and related affiliates. The transaction closed on April 2, 2012. See Note 2 and Note 15 for further details. Results of operations for the entities sold are presented separately as discontinued operations for all periods presented on the consolidated statements of income because the sale met all of the criteria for reporting as discontinued operations at June 30, 2012. Other expenses related to the transaction are also included in discontinued operations. This presentation is consistent with the consolidated financial statements included in the 2011 Form 10-K.
Certain amounts in prior period financial statements have been reclassified to conform to the current period presentation. These reclassifications are immaterial and have no effect on net income, comprehensive income, total assets or stockholders’ equity as previously reported.
NOTE 2—Discontinued Operations
On January 11, 2012, Regions entered into a stock purchase agreement to sell Morgan Keegan and related affiliates to Raymond James Financial, Inc. (“Raymond James”). The transaction closed on April 2, 2012. Regions Investment Management, Inc. (formerly known as Morgan Asset Management, Inc.) and Regions Trust
10
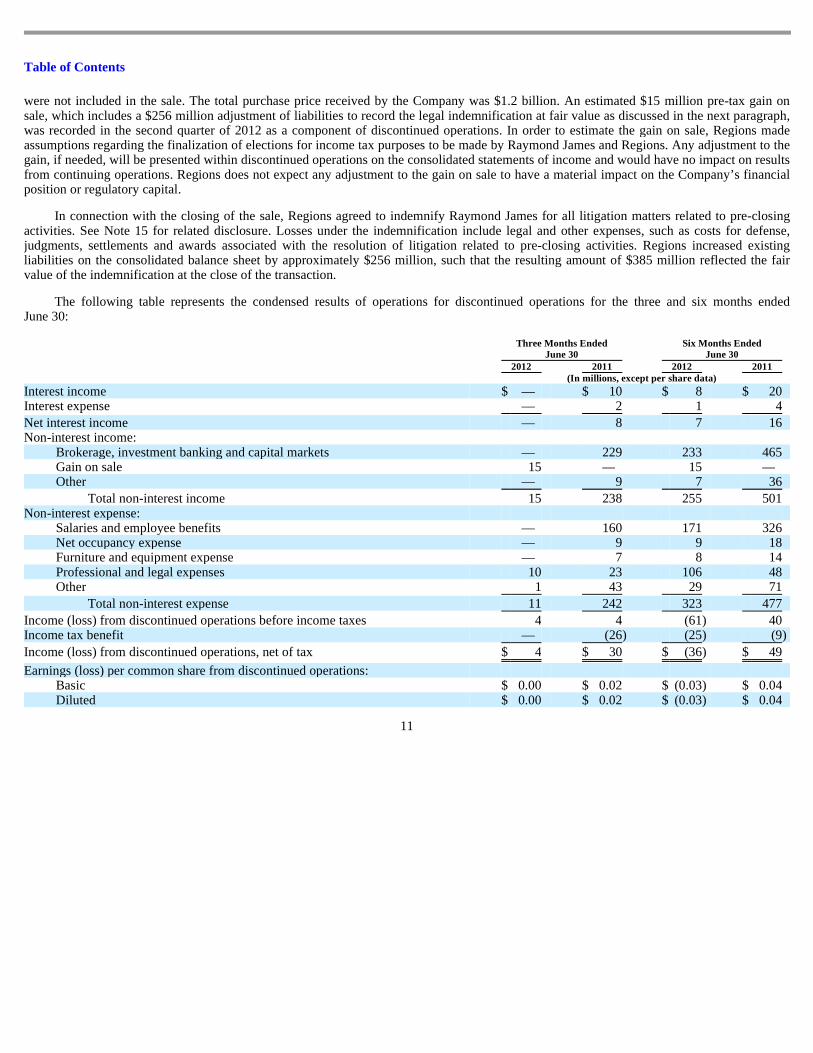
Table of Contents
were not included in the sale. The total purchase price received by the Company was $1.2 billion. An estimated $15 million pre-tax gain on sale, which includes a $256 million adjustment of liabilities to record the legal indemnification at fair value as discussed in the next paragraph, was recorded in the second quarter of 2012 as a component of discontinued operations. In order to estimate the gain on sale, Regions made assumptions regarding the finalization of elections for income tax purposes to be made by Raymond James and Regions. Any adjustment to the gain, if needed, will be presented within discontinued operations on the consolidated statements of income and would have no impact on results from continuing operations. Regions does not expect any adjustment to the gain on sale to have a material impact on the Company’s financial position or regulatory capital.
In connection with the closing of the sale, Regions agreed to indemnify Raymond James for all litigation matters related to pre-closing activities. See Note 15 for related disclosure. Losses under the indemnification include legal and other expenses, such as costs for defense, judgments, settlements and awards associated with the resolution of litigation related to pre-closing activities. Regions increased existing liabilities on the consolidated balance sheet by approximately $256 million, such that the resulting amount of $385 million reflected the fair value of the indemnification at the close of the transaction.
The following table represents the condensed results of operations for discontinued operations for the three and six months ended June 30:
11
Three Months Ended
June 30 Six Months Ended
June 30 2012 2011 2012 2011 (In millions, except per share data)
Interest income $ — $ 10 $ 8 $ 20 Interest expense — 2 1 4
Net interest income — 8 7 16 Non-interest income:
Brokerage, investment banking and capital markets — 229 233 465 Gain on sale 15 — 15 — Other — 9 7 36
Total non-interest income 15 238 255 501 Non-interest expense:
Salaries and employee benefits — 160 171 326 Net occupancy expense — 9 9 18 Furniture and equipment expense — 7 8 14 Professional and legal expenses 10 23 106 48 Other 1 43 29 71
Total non-interest expense 11 242 323 477
Income (loss) from discontinued operations before income taxes 4 4 (61 ) 40 Income tax benefit — (26 ) (25 ) (9 )
Income (loss) from discontinued operations, net of tax $ 4 $ 30 $ (36 ) $ 49
Earnings (loss) per common share from discontinued operations:
Basic $ 0.00 $ 0.02 $ (0.03 ) $ 0.04 Diluted $ 0.00 $ 0.02 $ (0.03 ) $ 0.04
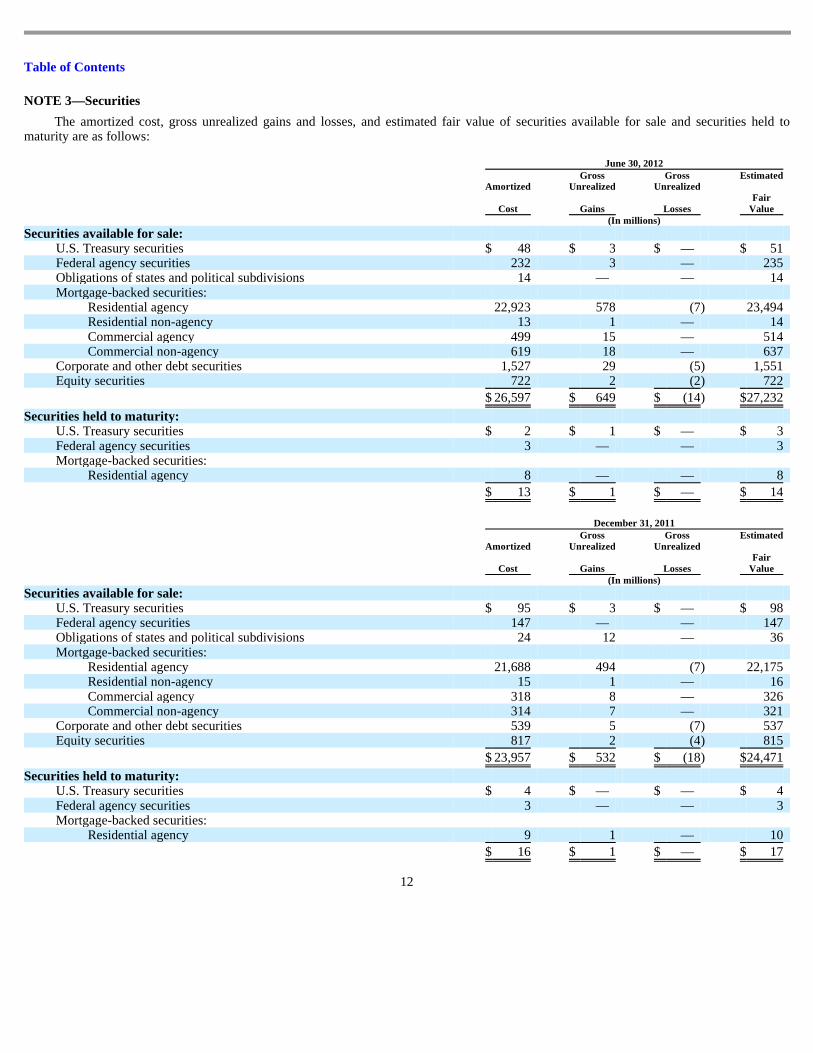
Table of Contents
NOTE 3—Securities
The amortized cost, gross unrealized gains and losses, and estimated fair value of securities available for sale and securities held to maturity are as follows:
12
June 30, 2012
Amortized
Cost
Gross Unrealized
Gains
Gross Unrealized
Losses
Estimated
Fair Value
(In millions)
Securities available for sale:
U.S. Treasury securities $ 48 $ 3 $ — $ 51 Federal agency securities 232 3 — 235 Obligations of states and political subdivisions 14 — — 14 Mortgage-backed securities:
Residential agency 22,923 578 (7 ) 23,494 Residential non-agency 13 1 — 14 Commercial agency 499 15 — 514 Commercial non-agency 619 18 — 637
Corporate and other debt securities 1,527 29 (5 ) 1,551 Equity securities 722 2 (2 ) 722
$ 26,597 $ 649 $ (14 ) $ 27,232
Securities held to maturity:
U.S. Treasury securities $ 2 $ 1 $ — $ 3 Federal agency securities 3 — — 3 Mortgage-backed securities:
Residential agency 8 — — 8
$ 13 $ 1 $ — $ 14
December 31, 2011
Amortized
Cost
Gross Unrealized
Gains
Gross Unrealized
Losses
Estimated
Fair Value
(In millions)
Securities available for sale:
U.S. Treasury securities $ 95 $ 3 $ — $ 98 Federal agency securities 147 — — 147 Obligations of states and political subdivisions 24 12 — 36 Mortgage-backed securities:
Residential agency 21,688 494 (7 ) 22,175 Residential non-agency 15 1 — 16 Commercial agency 318 8 — 326 Commercial non-agency 314 7 — 321
Corporate and other debt securities 539 5 (7 ) 537 Equity securities 817 2 (4 ) 815
$ 23,957 $ 532 $ (18 ) $ 24,471
Securities held to maturity:
U.S. Treasury securities $ 4 $ — $ — $ 4 Federal agency securities 3 — — 3 Mortgage-backed securities:
Residential agency 9 1 — 10
$ 16 $ 1 $ — $ 17

Table of Contents
Entities included with the sale of Morgan Keegan and related affiliates had approximately $2 million in securities available for sale at December 31, 2011, which are included in the table above. There were no such securities at June 30, 2012 as these entities were sold during the second quarter as discussed in Note 2.
Equity securities in the tables above included the following amortized cost related to Federal Reserve Bank stock and Federal Home Loan Bank (“FHLB”) stock. Shares in the Federal Reserve Bank and FHLB are accounted for at amortized cost, which approximates fair value.
Securities with carrying values of $14.0 billion and $14.3 billion at June 30, 2012 and December 31, 2011, respectively, were pledged to secure public funds, trust deposits and certain borrowing arrangements.
The amortized cost and estimated fair value of securities available for sale and securities held to maturity at June 30, 2012, by contractual maturity, are shown below. Expected maturities will differ from contractual maturities because borrowers may have the right to call or prepay obligations with or without call or prepayment penalties.
13
June 30
2012
December 31
2011 (In millions)
Federal Reserve Bank $ 480 $ 481 Federal Home Loan Bank 135 219
Amortized
Cost
Estimated
Fair Value (In millions)
Securities available for sale:
Due in one year or less $ 27 $ 27 Due after one year through five years 636 641 Due after five years through ten years 910 928 Due after ten years 248 255 Mortgage-backed securities:
Residential agency 22,923 23,494 Residential non-agency 13 14 Commercial agency 499 514 Commercial non-agency 619 637
Equity securities 722 722
$ 26,597 $ 27,232
Securities held to maturity:
Due in one year or less $ 3 $ 3 Due after one year through five years 2 3 Due after five years through ten years — — Due after ten years — — Mortgage-backed securities:
Residential agency 8 8
$ 13 $ 14

Table of Contents
The following tables present gross unrealized losses and estimated fair value of securities available for sale at June 30, 2012 and December 31, 2011. These securities are segregated between investments that have been in a continuous unrealized loss position for less than twelve months and twelve months or more.
There was no gross unrealized loss on debt securities held to maturity at either June 30, 2012 or December 31, 2011.
For the securities included in the tables above, management does not believe any individual unrealized loss, which was comprised of 410 securities and 524 securities at June 30, 2012 and December 31, 2011, respectively, represented an other-than-temporary impairment as of those dates. The Company does not intend to sell, and it is not likely that the Company will be required to sell, the securities before the recovery of their amortized cost basis, which may be at maturity.
For both the three and six months ended June 30, 2012, Regions recorded a credit-related impairment charge of approximately $2 million. Regions did not record any credit-related impairment charges during the three or six months ended June 30, 2011.
Proceeds from sale, gross realized gains and gross realized losses from continuing operations on sales of securities available for sale are shown in the table below. The cost of securities sold is based on the specific identification method.
14
June 30, 2012
Less Than Twelve
Months Twelve Months or
More Total
Estimated
Fair Value
Gross Unrealized
Losses
Estimated
Fair Value
Gross Unrealized
Losses
Estimated
Fair Value
Gross Unrealized
Losses
(In millions)
Mortgage-backed securities:
Residential agency $ 950 $ (8 ) $ — $ — $ 950 $ (8 ) Commercial agency — — — — — — Commercial non-agency — — — — — —
All other securities 413 (5 ) 18 (1 ) 431 (6 )
$ 1,363 $ (13 ) $ 18 $ (1 ) $ 1,381 $ (14 )
December 31, 2011
Less Than Twelve
Months Twelve Months or
More Total
Estimated
Fair Value
Gross Unrealized
Losses
Estimated
Fair Value
Gross Unrealized
Losses
Estimated
Fair Value
Gross Unrealized
Losses
(In millions)
Mortgage-backed securities:
Residential agency $ 1,778 $ (7 ) $ — $ — $ 1,778 $ (7 ) All other securities 291 (9 ) 5 (2 ) 296 (11 )
$ 2,069 $ (16 ) $ 5 $ (2 ) $ 2,074 $ (18 )
Three Months Ended
June 30 Six Months Ended
June 30 2012 2011 2012 2011 (In millions)
Proceeds $ 272 $ 4,060 $ 1,670 $ 6,479 Gross realized gains 12 24 24 106 Gross realized losses — — — —
Net securities gains $ 12 $ 24 $ 24 $ 106

Table of Contents
The following table details net gains (losses) for trading account securities:
Included in the table above are amounts related to activities of Morgan Keegan. The totals include net gains related to Morgan Keegan of zero for the three months ended June 30, 2012 and approximately $10 million for the three months ended June 30, 2011. There were approximately $25 million of total net gains for both the six months ended June 30, 2012 and 2011 related to Morgan Keegan activities. These amounts are included within results from discontinued operations.
NOTE 4—Loans and the Allowance for Credit Losses
LOANS
The following table presents the distribution by loan segment and class of Regions’ loan portfolio, net of unearned income:
During the three months ended June 30, 2012 and 2011, Regions purchased approximately $233 million and $174 million, respectively, in indirect loans from a third party. During the six months ended June 30, 2012 and 2011, the comparable loan purchase amounts were approximately $407 million and $336 million, respectively. Additionally, during the second quarter of 2011, Regions purchased approximately $1.1 billion of Regions-branded credit card amounts from FIA Card Services. The purchase included approximately $1.0 billion in consumer credit card accounts with the remainder in small business credit card accounts, which are included in the commercial and industrial portfolio class.
ALLOWANCE FOR CREDIT LOSSES
The allowance for credit losses represents management’s estimate of credit losses inherent in the loan and credit commitment portfolios as of period-end. The allowance for credit losses consists of two components: the allowance for loan and lease losses and the reserve for unfunded credit commitments. Management’s assessment
15
Three Months Ended
June 30 Six Months Ended
June 30 2012 2011 2012 2011 (in millions) (in millions)
Total net gains (losses) $ (1 ) $ 10 $ 29 $ 31 Unrealized portion (1 ) (1 ) 24 13
June 30
2012 December 31
2011 (In millions, net of unearned income)
Commercial and industrial $ 25,990 $ 24,522 Commercial real estate mortgage—owner-occupied 10,626 11,166 Commercial real estate construction—owner-occupied 261 337
Total commercial 36,877 36,025 Commercial investor real estate mortgage 8,598 9,702 Commercial investor real estate construction 849 1,025
Total investor real estate 9,447 10,727 Residential first mortgage 13,394 13,784 Home equity 12,321 13,021 Indirect 2,060 1,848 Consumer credit card 922 987 Other consumer 1,181 1,202
Total consumer 29,878 30,842
$ 76,202 $ 77,594

Table of Contents
of the appropriateness of the allowance for credit losses is based on a combination of both of these components. Regions determines its allowance for credit losses in accordance with applicable accounting literature as well as regulatory guidance related to receivables and contingencies. Binding unfunded credit commitments include items such as letters of credit, financial guarantees and binding unfunded loan commitments.
CALCULATION OF ALLOWANCE FOR CREDIT LOSSES
As part of the Company’s ongoing efforts to enhance the allowance calculation, and in response to regulatory guidance issued during the first quarter of 2012, the home equity portfolio was segmented at a more granular level. Loss rates for home equity products are now developed based on lien position, status as a troubled debt restructuring (“TDR”), geography, past due status, and refreshed FICO scores for non-past due loans. The enhancement had the impact of reducing the component of the allowance for loan losses related to home equity loans by an estimate of approximately $30 million.
In addition to the home equity enhancement, in the second quarter of 2012, the Company refined the methodology for estimation of the reserve for unfunded credit commitments. Before the change, the Company based the reserve for unfunded credit commitments on an analysis of the overall probability of funding and historical losses. Beginning with the second quarter of 2012, the reserve is based on an exposure at default (“EAD”) multiplied by a probability of default (“PD”) multiplied by a loss-given default (“LGD”). The EAD is estimated based on an analysis of historical funding patterns for defaulted loans in various categories. The PD and LGD align with the statistically-calculated parameters used to calculate the allowance for loan losses for various pools, which are based on credit quality indicators and product type. The methodology applies to commercial and investor real estate credit commitments and standby letters of credit. The Company made this change to enhance portfolio segmentation within the calculation of the reserve for unfunded credit commitments and to improve overall consistency within the calculation of the allowance for credit losses. The change did not have a material impact on the allowance for credit losses or the provision for unfunded credit commitments.
Except for the enhancements to home equity segmentation and to the reserve for unfunded credit commitments described above, during the first six months of 2012 there were no changes in methodology for the calculation of the allowance for credit losses or policies for identification of non-accrual or for charge-offs. A detailed description of the Company’s methodology is included in the consolidated financial statements included in the Annual Report on Form 10-K for the year ended December 31, 2011.
16

Table of Contents
ROLLFORWARD OF ALLOWANCE FOR CREDIT LOSSES
The following tables present analyses of the allowance for credit losses by portfolio segment for the three and six months ended June 30, 2012 and 2011. The total allowance for credit losses as of June 30, 2012 and 2011 is then disaggregated to detail the amounts derived through individual evaluation and the amounts calculated through collective evaluation. The allowance for credit losses related to individually evaluated loans includes reserves for non-accrual loans and leases equal to or greater than $2.5 million. The allowance for credit losses related to collectively evaluated loans includes the remainder of the portfolio.
17
Three Months Ended June 30, 2012
Commercial
Investor Real
Estate Consumer Total (In millions)
Allowance for loan losses, April 1, 2012 $ 982 $ 898 $ 650 $ 2,530 Provision (credit) for loan losses (16 ) (80 ) 122 26 Loan losses:
Charge-offs (107 ) (62 ) (146 ) (315 ) Recoveries 25 10 15 50
Net loan losses (82 ) (52 ) (131 ) (265 )
Allowance for loan losses, June 30, 2012 884 766 641 2,291
Reserve for unfunded credit commitments, April 1, 2012 $ 44 $ 26 $ 21 $ 91 Provision (credit) for unfunded credit commitments 17 — (17 ) —
Reserve for unfunded credit commitments, June 30, 2012 61 26 4 91
Allowance for credit losses, June 30, 2012 $ 945 $ 792 $ 645 $ 2,382
Three Months Ended June 30, 2011
Commercial
Investor Real
Estate Consumer Total (In millions)
Allowance for loan losses, April 1, 2011 $ 1,138 $ 1,285 $ 763 $ 3,186 Allowance allocated to purchased loans 10 — 74 84 Provision for loan losses 72 171 155 398 Loan losses:
Charge-offs (107 ) (306 ) (166 ) (579 ) Recoveries 14 3 14 31
Net loan losses (93 ) (303 ) (152 ) (548 )
Allowance for loan losses, June 30, 2011 1,127 1,153 840 3,120
Reserve for unfunded credit commitments, April 1, 2011 $ 37 $ 17 $ 24 $ 78 Provision (credit) for unfunded credit commitments (5 ) 11 — 6
Reserve for unfunded credit commitments, June 30, 2011 32 28 24 84
Allowance for credit losses, June 30, 2011 $ 1,159 $ 1,181 $ 864 $ 3,204

Table of Contents
18
Six Months Ended June 30, 2012
Commercial
Investor Real
Estate Consumer Total (In millions)
Allowance for loan losses, January 1, 2012 $ 1,030 $ 991 $ 724 $ 2,745 Provision (credit) for loan losses 45 (90 ) 188 143 Loan losses:
Charge-offs (232 ) (157 ) (302 ) (691 ) Recoveries 41 22 31 94
Net loan losses (191 ) (135 ) (271 ) (597 )
Allowance for loan losses, June 30, 2012 884 766 641 2,291
Reserve for unfunded credit commitments, January 1, 2012 $ 30 $ 26 $ 22 $ 78 Provision (credit) for unfunded credit commitments 31 — (18 ) 13
Reserve for unfunded credit commitments, June 30, 2012 61 26 4 91
Allowance for credit losses, June 30, 2012 $ 945 $ 792 $ 645 $ 2,382
Portion of ending allowance for credit losses:
Individually evaluated for impairment $ 93 $ 117 $ — $ 210 Collectively evaluated for impairment 852 675 645 2,172
Total allowance for credit losses $ 945 $ 792 $ 645 $ 2,382
Portion of loan portfolio ending balance:
Individually evaluated for impairment $ 428 $ 483 $ — $ 911 Collectively evaluated for impairment 36,449 8,964 29,878 75,291
Total loans evaluated for impairment $ 36,877 $ 9,447 $ 29,878 $ 76,202
Six Months Ended June 30, 2011
Commercial
Investor Real
Estate Consumer Total (In millions)
Allowance for loan losses, January 1, 2011 $ 1,055 $ 1,370 $ 760 $ 3,185 Allowance allocated to purchased loans 10 — 74 84 Provision for loan losses 297 260 323 880 Loan losses:
Charge-offs (258 ) (487 ) (346 ) (1,091 ) Recoveries 23 10 29 62
Net loan losses (235 ) (477 ) (317 ) (1,029 )
Allowance for loan losses, June 30, 2011 1,127 1,153 840 3,120
Reserve for unfunded credit commitments, January 1, 2011 $ 32 $ 16 $ 23 $ 71 Provision (credit) for unfunded credit commitments — 12 1 13
Reserve for unfunded credit commitments, June 30, 2011 32 28 24 84
Allowance for credit losses, June 30, 2011 $ 1,159 $ 1,181 $ 864 $ 3,204
Portion of ending allowance for credit losses:
Individually evaluated for impairment $ 128 $ 163 $ 4 $ 295 Collectively evaluated for impairment 1,031 1,018 860 2,909
Total allowance for credit losses $ 1,159 $ 1,181 $ 864 $ 3,204
Portion of loan portfolio ending balance:
Individually evaluated for impairment $ 599 $ 989 $ 18 $ 1,606 Collectively evaluated for impairment 35,219 12,442 31,909 79,570
Total loans evaluated for impairment $ 35,818 $ 13,431 $ 31,927 $ 81,176

Table of Contents
During the second quarter of 2011, Regions purchased a credit card portfolio for approximately $1.1 billion and recorded an allowance for loan losses and related premium of approximately $84 million. Upon finalization of the purchase price in the fourth quarter of 2011, Regions reclassified the $84 million allowance and premium. The impact of these reclassification entries was not material to the financial results of any of the quarters of 2011.
PORTFOLIO SEGMENT RISK FACTORS
The following describe the risk characteristics relevant to each of the portfolio segments.
Commercial —The commercial loan portfolio segment includes commercial and industrial loans to commercial customers for use in normal business operations to finance working capital needs, equipment purchases or other expansion projects. Commercial also includes owner-occupied commercial real estate loans to operating businesses, which are loans for long-term financing of land and buildings, and are repaid by cash flow generated by business operations. Owner-occupied construction loans are made to commercial businesses for the development of land or construction of a building where the repayment is derived from revenues generated from the business of the borrower. Collection risk in this portfolio is driven by the creditworthiness of underlying borrowers, particularly cash flow from customers’ business operations.
Investor Real Estate —Loans for real estate development are repaid through cash flow related to the operation, sale or refinance of the property. This portfolio segment includes extensions of credit to real estate developers or investors where repayment is dependent on the sale of real estate or income generated from the real estate collateral. A portion of Regions’ investor real estate portfolio segment is comprised of loans secured by residential product types (land, single-family and condominium loans) within Regions’ markets. Additionally, these loans are made to finance income-producing properties such as apartment buildings, office and industrial buildings, and retail shopping centers. Loans in this portfolio segment are particularly sensitive to valuation of real estate.
Consumer —The consumer loan portfolio segment includes residential first mortgage, home equity, indirect, consumer credit card, and other consumer loans. Residential first mortgage loans represent loans to consumers to finance a residence. These loans are typically financed over a 15 to 30 year term and, in most cases, are extended to borrowers to finance their primary residence. Home equity lending includes both home equity loans and lines of credit. This type of lending, which is secured by a first or second mortgage on the borrower’s residence, allows customers to borrow against the equity in their home. Real estate market values as of the time the loan or line is secured directly affect the amount of credit extended and, in addition, changes in these values impact the depth of potential losses. Indirect lending, which is lending initiated through third-party business partners, is largely comprised of loans made through automotive dealerships. Consumer credit card includes approximately 500,000 Regions branded consumer credit card accounts purchased late in the second quarter of 2011 from FIA Card Services. Other consumer loans include direct consumer installment loans, overdrafts and other revolving loans. Loans in this portfolio segment are sensitive to unemployment and other key consumer economic measures.
CREDIT QUALITY INDICATORS
The following tables present credit quality indicators for the loan portfolio segments and classes, excluding loans held for sale, as of June 30, 2012 and December 31, 2011. Commercial and investor real estate loan classes are detailed by categories related to underlying credit quality and probability of default. These categories are utilized to develop the associated allowance for credit losses.
19
• Pass—includes obligations where the probability of default is considered low;
• Special Mention—includes obligations that have potential weakness which may, if not reversed or corrected, weaken the credit or
inadequately protect the Company’s position at some future date. Obligations in this category may also be subject to economic or market conditions which may, in the future, have an adverse effect on debt service ability;

Table of Contents
Substandard accrual and non-accrual loans are often collectively referred to as “classified.” Special mention, substandard accrual, and non-accrual loans are often collectively referred to as “criticized and classified.”
Classes in the consumer portfolio segment are disaggregated by accrual status. The associated allowance for credit losses is generally based on historical losses of the various classes adjusted for current economic conditions. For home equity products, loss rates are based on lien position, TDR status, geography, past due status, and refreshed FICO scores for current loans.
20
• Substandard Accrual—includes obligations that exhibit a well-defined weakness which presently jeopardizes debt repayment, even
though they are currently performing. These obligations are characterized by the distinct possibility that the Company may incur a loss in the future if these weaknesses are not corrected;
• Non-accrual—includes obligations where management has determined that full payment of principal and interest is in doubt.
June 30, 2012
Pass Special Mention
Substandard
Accrual Non-accrual Total (In millions)
Commercial and industrial $ 24,433 $ 590 $601 $ 366 $ 25,990 Commercial real estate mortgage—owner-occupied 9,346 262 514 504 10,626 Commercial real estate construction—owner-occupied 211 18 12 20 261
Total commercial $ 33,990 $ 870 $1,127 $ 890 $ 36,877
Commercial investor real estate mortgage 6,304 567 1,128 599 8,598 Commercial investor real estate construction 594 111 70 74 849
Total investor real estate $ 6,898 $ 678 $1,198 $ 673 $ 9,447
Accrual Non-accrual Total (In millions)
Residential first mortgage $ 13,165 $ 229 $ 13,394 Home equity 12,198 123 12,321 Indirect 2,060 — 2,060 Consumer credit card 922 — 922 Other consumer 1,181 — 1,181
Total consumer $ 29,526 $ 352 $ 29,878
$ 76,202
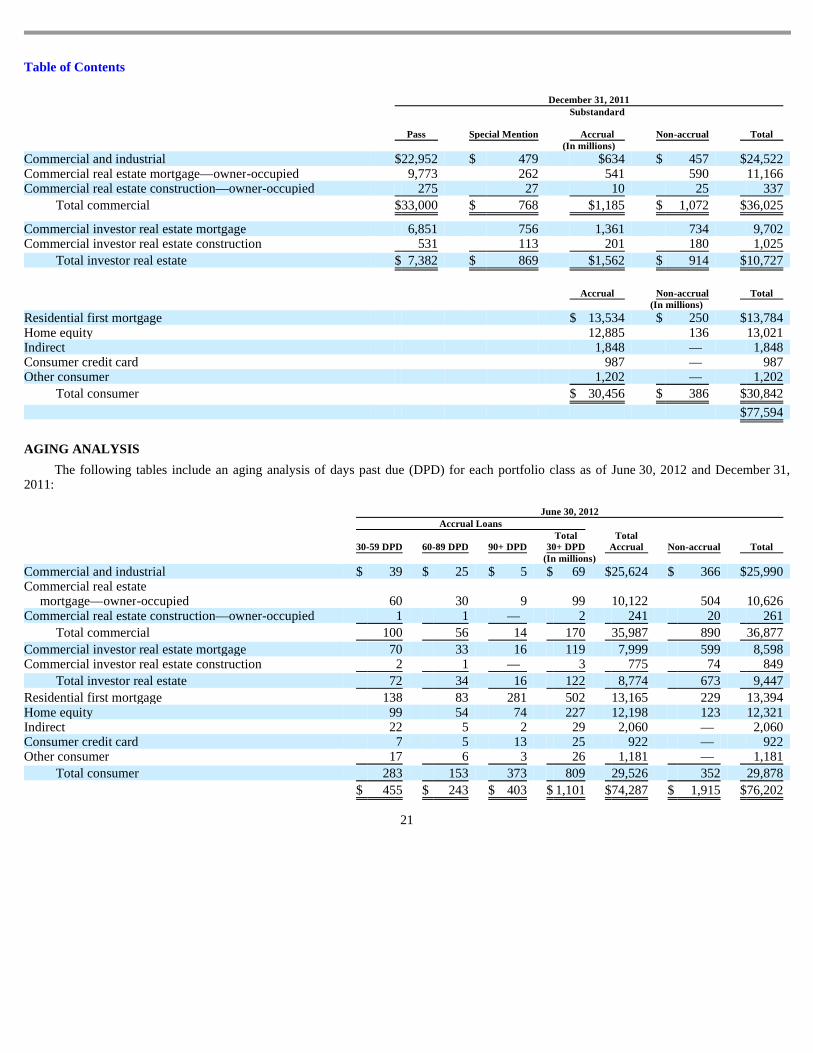
Table of Contents
AGING ANALYSIS
The following tables include an aging analysis of days past due (DPD) for each portfolio class as of June 30, 2012 and December 31, 2011:
21
December 31, 2011
Pass Special Mention
Substandard
Accrual Non-accrual Total (In millions)
Commercial and industrial $ 22,952 $ 479 $634 $ 457 $ 24,522 Commercial real estate mortgage—owner-occupied 9,773 262 541 590 11,166 Commercial real estate construction—owner-occupied 275 27 10 25 337
Total commercial $ 33,000 $ 768 $1,185 $ 1,072 $ 36,025
Commercial investor real estate mortgage 6,851 756 1,361 734 9,702 Commercial investor real estate construction 531 113 201 180 1,025
Total investor real estate $ 7,382 $ 869 $1,562 $ 914 $ 10,727
Accrual Non-accrual Total (In millions)
Residential first mortgage $ 13,534 $ 250 $ 13,784 Home equity 12,885 136 13,021 Indirect 1,848 — 1,848 Consumer credit card 987 — 987 Other consumer 1,202 — 1,202
Total consumer $ 30,456 $ 386 $ 30,842
$ 77,594
June 30, 2012 Accrual Loans
30-59 DPD 60-89 DPD 90+ DPD Total
30+ DPD Total
Accrual Non-accrual Total (In millions)
Commercial and industrial $ 39 $ 25 $ 5 $ 69 $ 25,624 $ 366 $ 25,990 Commercial real estate
mortgage—owner-occupied 60 30 9 99 10,122 504 10,626 Commercial real estate construction—owner-occupied 1 1 — 2 241 20 261
Total commercial 100 56 14 170 35,987 890 36,877
Commercial investor real estate mortgage 70 33 16 119 7,999 599 8,598 Commercial investor real estate construction 2 1 — 3 775 74 849
Total investor real estate 72 34 16 122 8,774 673 9,447
Residential first mortgage 138 83 281 502 13,165 229 13,394 Home equity 99 54 74 227 12,198 123 12,321 Indirect 22 5 2 29 2,060 — 2,060 Consumer credit card 7 5 13 25 922 — 922 Other consumer 17 6 3 26 1,181 — 1,181
Total consumer 283 153 373 809 29,526 352 29,878
$ 455 $ 243 $ 403 $ 1,101 $ 74,287 $ 1,915 $ 76,202

Table of Contents
22
December 31, 2011 Accrual Loans
30-59 DPD 60-89 DPD 90+ DPD Total
30+ DPD Total
Accrual Non-accrual Total (In millions)
Commercial and industrial $ 38 $ 23 $ 28 $ 89 $ 24,065 $ 457 $ 24,522 Commercial real estate mortgage—owner-occupied 47 23 9 79 10,576 590 11,166 Commercial real estate construction—owner-occupied 3 1 — 4 312 25 337
Total commercial 88 47 37 172 34,953 1,072 36,025
Commercial investor real estate mortgage 34 42 13 89 8,968 734 9,702 Commercial investor real estate construction 23 5 — 28 845 180 1,025
Total investor real estate 57 47 13 117 9,813 914 10,727
Residential first mortgage 187 100 284 571 13,534 250 13,784 Home equity 121 77 93 291 12,885 136 13,021 Indirect 26 7 2 35 1,848 — 1,848 Consumer credit card 8 5 14 27 987 — 987 Other consumer 20 6 4 30 1,202 — 1,202
Total consumer 362 195 397 954 30,456 386 30,842
$ 507 $ 289 $ 447 $ 1,243 $ 75,222 $ 2,372 $ 77,594

Table of Contents
IMPAIRED LOANS
The following tables present details related to the Company’s impaired loans as of June 30, 2012 and December 31, 2011. Loans deemed to be impaired include non-accrual commercial and investor real estate loans, excluding leases, and all TDRs (including accruing commercial, investor real estate, and consumer TDRs). Loans which have been fully charged-off do not appear in the tables below.
23
Non-accrual Impaired Loans As of June 30, 2012 Book Value (3)
Unpaid Principal
Balance (1)
Charge-offs and Payments
Applied (2)
Total Impaired Loans on
Non-accrual Status
Impaired Loans on
Non-accrual Status with No Related Allowance
Impaired Loans on
Non-accrual Status with
Related Allowance
Related Allowance for Loan Losses Coverage % (4)
(Dollars in millions)
Commercial and industrial $ 437 $ 80 $ 357 $ 51 $ 306 $ 109 43.2 % Commercial real estate
mortgage—owner- occupied 587 82 505 48 457 162 41.6
Commercial real estate construction—owner-occupied 33 14 19 3 16 6 60.6
Total commercial 1,057 176 881 102 779 277 42.9
Commercial investor real estate mortgage 740 141 599 79 520 177 43.0
Commercial investor real estate construction 88 14 74 12 62 18 36.4
Total investor real estate 828 155 673 91 582 195 42.3
Residential first mortgage 141 51 90 — 90 13 45.4 Home equity 27 9 18 — 18 2 40.7
Total consumer 168 60 108 — 108 15 44.6
Total $ 2,053 $ 391 $ 1,662 $ 193 $ 1,469 $ 487 42.8 %
Accruing Impaired Loans As of June 30, 2012
Unpaid Principal
Balance (1)
Charge-offs and Payments
Applied (2) Book Value
Related Allowance for Loan Losses Coverage % (4)
(Dollars in millions)
Commercial and industrial $ 318 $ 7 $ 311 $ 51 18.2 % Commercial real estate mortgage—owner-
occupied 212 4 208 28 15.1 Commercial real estate construction—owner-
occupied 3 — 3 1 33.3
Total commercial 533 11 522 80 17.1
Commercial investor real estate mortgage 928 8 920 175 19.7 Commercial investor real estate construction 120 1 119 55 46.7
Total investor real estate 1,048 9 1,039 230 22.8
Residential first mortgage 1,079 13 1,066 158 15.8 Home equity 430 5 425 39 10.2 Indirect 2 — 2 — — Other consumer 48 — 48 1 2.1
Total consumer 1,559 18 1,541 198 13.9
Total $ 3,140 $ 38 $ 3,102 $ 508 17.4 %

Table of Contents
24
Total Impaired Loans As of June 30, 2012 Book Value (3)
Unpaid Principal
Balance (1)
Charge-offs and Payments
Applied (2)
Total Impaired
Loans
Impaired Loans with No
Related Allowance
Impaired Loans with
Related Allowance
Related Allowance for Loan Losses Coverage % (4)
(Dollars in millions)
Commercial and industrial $ 755 $ 87 $ 668 $ 51 $ 617 $ 160 32.7 % Commercial real estate
mortgage—owner- occupied 799 86 713 48 665 190 34.5
Commercial real estate construction—owner- occupied 36 14 22 3 19 7 58.3
Total commercial 1,590 187 1,403 102 1,301 357 34.2
Commercial investor real estate mortgage 1,668 149 1,519 79 1,440 352 30.0
Commercial investor real estate construction 208 15 193 12 181 73 42.3
Total investor real estate 1,876 164 1,712 91 1,621 425 31.4
Residential first mortgage 1,220 64 1,156 — 1,156 171 19.3 Home equity 457 14 443 — 443 41 12.0 Indirect 2 — 2 — 2 — — Other consumer 48 — 48 — 48 1 2.1
Total consumer 1,727 78 1,649 — 1,649 213 16.9
Total impaired loans $ 5,193 $ 429 $ 4,764 $ 193 $ 4,571 $ 995 27.4 %
(1) Unpaid principal balance represents the contractual obligation due from the customer and includes the net book value plus charge-offs
and payments applied. (2) Charge-offs and payments applied represents cumulative partial charge-offs taken, as well as interest payments received that have been
applied against the outstanding principal balance. (3) Book value represents the unpaid principal balance less charge-offs and payments applied; it is shown before any allowance for loan
losses. (4) Coverage % represents charge-offs and payments applied plus the related allowance as a percent of the unpaid principal balance.

Table of Contents
25
Non-accrual Impaired Loans As of December 31, 2011 Book Value (3)
Unpaid Principal
Balance (1)
Charge-offs and Payments
Applied (2)
Total Impaired Loans on
Non-accrual Status
Impaired Loans on Non-accrual Status
with No Related
Allowance
Impaired Loans on
Non-accrual Status with
Related Allowance
Related Allowance for Loan Losses Coverage % (4)
(Dollars in millions)
Commercial and industrial $ 468 $ 88 $ 380 $ 61 $ 319 $ 129 46.4 % Commercial real estate
mortgage—owner- occupied 679 88 591 34 557 192 41.2
Commercial real estate construction—owner-occupied 37 12 25 1 24 10 59.5
Total commercial 1,184 188 996 96 900 331 43.8
Commercial investor real estate mortgage 870 136 734 63 671 223 41.3
Commercial investor real estate construction 236 56 180 23 157 62 50.0
Total investor real estate 1,106 192 914 86 828 285 43.1
Residential first mortgage 146 49 97 — 97 15 43.8 Home equity 26 10 16 — 16 2 46.2
Total consumer 172 59 113 — 113 17 44.2
Total $ 2,462 $ 439 $ 2,023 $ 182 $ 1,841 $ 633 43.5 %
Accruing Impaired Loans As of December 31, 2011
Unpaid Principal
Balance (1)
Charge-offs and Payments
Applied (2) Book Value
Related Allowance for Loan Losses Coverage % (4)
(Dollars in millions)
Commercial and industrial $ 290 $ 1 $ 289 $ 60 21.0 % Commercial real estate mortgage—owner-occupied 205 3 202 30 16.1 Commercial real estate construction—owner-
occupied 2 — 2 — —
Total commercial 497 4 493 90 18.9
Commercial investor real estate mortgage 862 7 855 174 21.0 Commercial investor real estate construction 140 — 140 81 57.9
Total investor real estate 1,002 7 995 255 26.1
Residential first mortgage 1,025 12 1,013 148 15.6 Home equity 428 4 424 60 15.0 Indirect 1 — 1 — — Other consumer 55 — 55 1 1.8
Total consumer 1,509 16 1,493 209 14.9
Total $ 3,008 $ 27 $ 2,981 $ 554 19.3 %
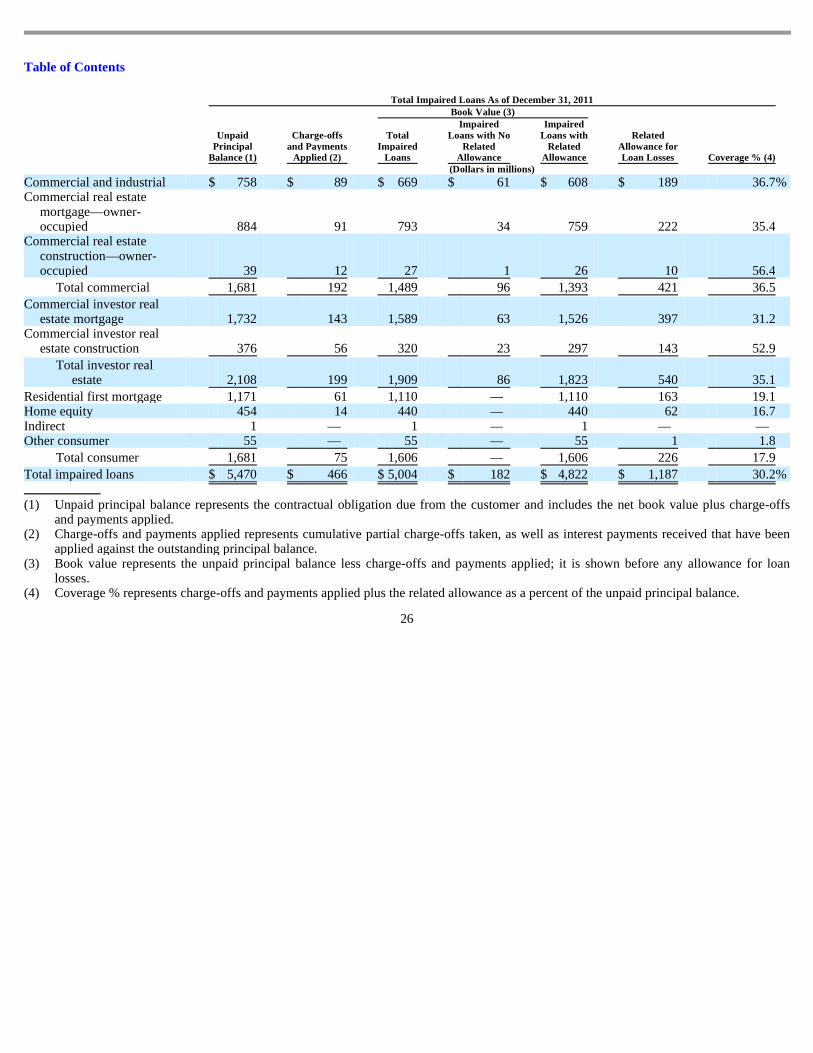
Table of Contents
26
Total Impaired Loans As of December 31, 2011 Book Value (3)
Unpaid Principal
Balance (1)
Charge-offs and Payments
Applied (2)
Total Impaired
Loans
Impaired Loans with No
Related Allowance
Impaired Loans with
Related Allowance
Related Allowance for Loan Losses Coverage % (4)
(Dollars in millions)
Commercial and industrial $ 758 $ 89 $ 669 $ 61 $ 608 $ 189 36.7 % Commercial real estate
mortgage—owner- occupied 884 91 793 34 759 222 35.4
Commercial real estate construction—owner-occupied 39 12 27 1 26 10 56.4
Total commercial 1,681 192 1,489 96 1,393 421 36.5
Commercial investor real estate mortgage 1,732 143 1,589 63 1,526 397 31.2
Commercial investor real estate construction 376 56 320 23 297 143 52.9
Total investor real estate 2,108 199 1,909 86 1,823 540 35.1
Residential first mortgage 1,171 61 1,110 — 1,110 163 19.1 Home equity 454 14 440 — 440 62 16.7 Indirect 1 — 1 — 1 — — Other consumer 55 — 55 — 55 1 1.8
Total consumer 1,681 75 1,606 — 1,606 226 17.9
Total impaired loans $ 5,470 $ 466 $ 5,004 $ 182 $ 4,822 $ 1,187 30.2 %
(1) Unpaid principal balance represents the contractual obligation due from the customer and includes the net book value plus charge-offs
and payments applied. (2) Charge-offs and payments applied represents cumulative partial charge-offs taken, as well as interest payments received that have been
applied against the outstanding principal balance. (3) Book value represents the unpaid principal balance less charge-offs and payments applied; it is shown before any allowance for loan
losses. (4) Coverage % represents charge-offs and payments applied plus the related allowance as a percent of the unpaid principal balance.
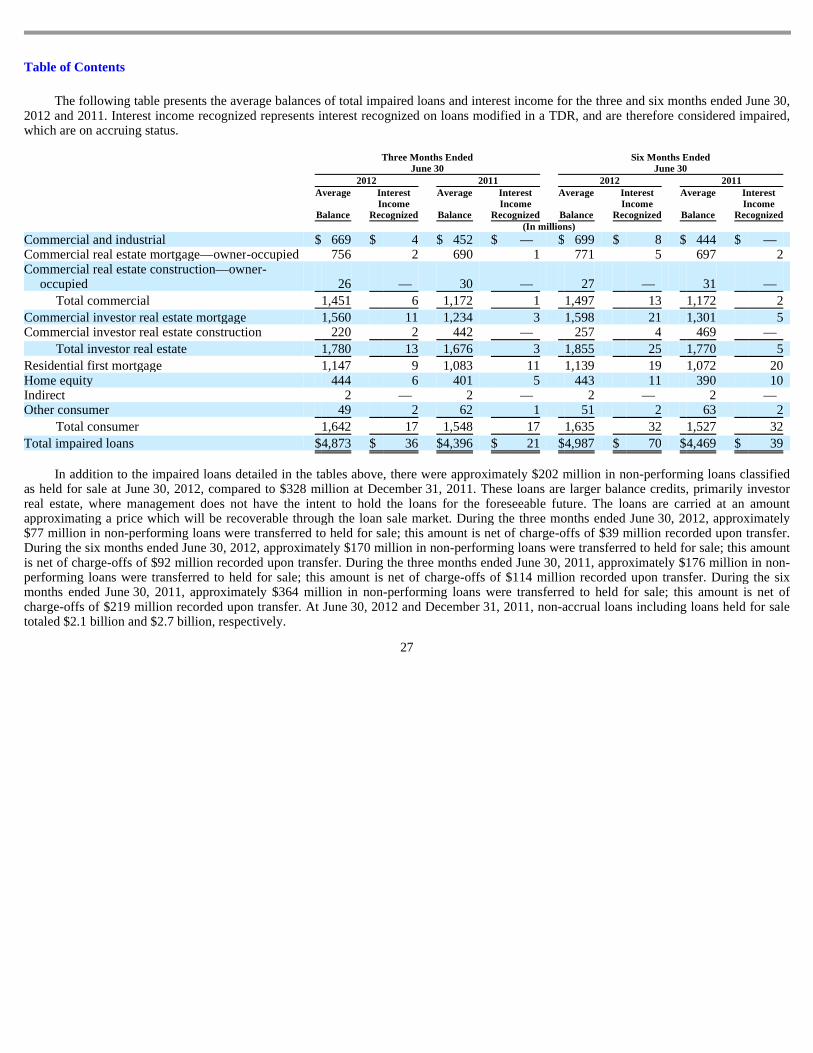
Table of Contents
The following table presents the average balances of total impaired loans and interest income for the three and six months ended June 30, 2012 and 2011. Interest income recognized represents interest recognized on loans modified in a TDR, and are therefore considered impaired, which are on accruing status.
In addition to the impaired loans detailed in the tables above, there were approximately $202 million in non-performing loans classified as held for sale at June 30, 2012, compared to $328 million at December 31, 2011. These loans are larger balance credits, primarily investor real estate, where management does not have the intent to hold the loans for the foreseeable future. The loans are carried at an amount approximating a price which will be recoverable through the loan sale market. During the three months ended June 30, 2012, approximately $77 million in non-performing loans were transferred to held for sale; this amount is net of charge-offs of $39 million recorded upon transfer. During the six months ended June 30, 2012, approximately $170 million in non-performing loans were transferred to held for sale; this amount is net of charge-offs of $92 million recorded upon transfer. During the three months ended June 30, 2011, approximately $176 million in non-performing loans were transferred to held for sale; this amount is net of charge-offs of $114 million recorded upon transfer. During the six months ended June 30, 2011, approximately $364 million in non-performing loans were transferred to held for sale; this amount is net of charge-offs of $219 million recorded upon transfer. At June 30, 2012 and December 31, 2011, non-accrual loans including loans held for sale totaled $2.1 billion and $2.7 billion, respectively.
27
Three Months Ended
June 30 Six Months Ended
June 30 2012 2011 2012 2011
Average
Balance
Interest Income
Recognized
Average
Balance
Interest Income
Recognized
Average
Balance
Interest Income
Recognized
Average
Balance
Interest Income
Recognized (In millions)
Commercial and industrial $ 669 $ 4 $ 452 $ — $ 699 $ 8 $ 444 $ — Commercial real estate mortgage—owner-occupied 756 2 690 1 771 5 697 2 Commercial real estate construction—owner-
occupied 26 — 30 — 27 — 31 —
Total commercial 1,451 6 1,172 1 1,497 13 1,172 2
Commercial investor real estate mortgage 1,560 11 1,234 3 1,598 21 1,301 5 Commercial investor real estate construction 220 2 442 — 257 4 469 —
Total investor real estate 1,780 13 1,676 3 1,855 25 1,770 5
Residential first mortgage 1,147 9 1,083 11 1,139 19 1,072 20 Home equity 444 6 401 5 443 11 390 10 Indirect 2 — 2 — 2 — 2 — Other consumer 49 2 62 1 51 2 63 2
Total consumer 1,642 17 1,548 17 1,635 32 1,527 32
Total impaired loans $ 4,873 $ 36 $ 4,396 $ 21 $ 4,987 $ 70 $ 4,469 $ 39

Table of Contents
TROUBLED DEBT RESTRUCTURINGS (TDRs)
Modification Activity: Commercial and Investor Real Estate Portfolio Segments
Regions regularly modifies commercial and investor real estate loans in order to facilitate a workout strategy. Typical modifications include workout accommodations, such as renewals and forbearances. Regions’ business strategy to keep loan maturities short, particularly in the investor real estate portfolio segment, in order to maintain leverage in negotiating with customers drove the renewal activity. Regions often increases or at least maintains the same interest rate, and often receives consideration in exchange for such modifications (e.g., principal paydowns, additional collateral, or additional guarantor support). However, these modifications are refutably considered by Regions to be concessions if the borrower could not access similar financing at market terms, even if Regions concludes that the borrower will ultimately pay all contractual amounts owed. Additionally, as another workout alternative, Regions periodically uses A/B note restructurings when the underlying assets (primarily investor real estate) have a stabilized level of cash flow. An appropriately underwritten A-note will allow for upgraded risk rating, with ultimate return to accrual status upon charge-off of the B-note, and a satisfactory period of performance of the A-note (generally, six months). Regions continues to report A-notes as TDRs, even if upgraded to accrual status. Also, for smaller-dollar commercial customers, Regions may periodically grant interest rate and other term concessions, similar to those under the Customer Assistance Program (“CAP”) program as described below.
Modification Activity: Consumer Portfolio Segment
Regions continues to work to meet the individual needs of consumer borrowers to stem foreclosure through the CAP. Regions designed the program to allow for customer-tailored modifications with the goal of keeping customers in their homes and avoiding foreclosure where possible. Modification may be offered to any borrower experiencing financial hardship—regardless of the borrower’s payment status. Under the CAP, Regions may offer a short-term deferral, a term extension, an interest rate reduction, a new loan product, or a combination of these options. For loans restructured under the CAP, Regions expects to collect the original contractually due principal. The gross original contractual interest may be collectible, depending on the terms modified. The length of the CAP modifications ranges from temporary payment deferrals of three months to term extensions for the life of the loan. All such modifications are considered TDRs regardless of the term if there is a concession to a borrower experiencing financial difficulty. Modified loans are subject to policies governing accrual/non-accrual evaluation consistent with all other loans of the same product type. Consumer loans are subject to objective accrual/non-accrual decisions. Under these policies, loans subject to the CAP are charged down to estimated value on or before the month in which the loan becomes 180 days past due. Beginning in the third quarter of 2011, home equity second liens are charged down to estimated value by the end of the month in which the loan becomes 120 days past due. If a partial charge-off is necessary as a result of this evaluation, the loan is placed on non-accrual at that time. Because the program was designed to evaluate potential CAP participants as early as possible in the life cycle of the troubled loan, many of the modifications are finalized without the borrower ever reaching the applicable number of days past due, and with the loans having never been placed on non-accrual. Accordingly, given the positive impact of the restructuring on the likelihood of recovery of cash flows due under the modified terms, accrual status continues to be appropriate for these loans. None of the modified consumer loans listed in the following TDR disclosures were collateral-dependent at the time of modification. At June 30, 2012, approximately $126 million in residential first mortgage TDRs were in excess of 180 days past due and are considered collateral-dependent. At June 30, 2012, approximately $9.5 million in home equity first lien TDRs were in excess of 180 days past due and $7.8 million in home equity second lien TDRs were in excess of 120 days past due and are considered collateral-dependent.
Further discussion related to TDRs, including the impact of recently issued accounting literature, impact on allowance for loan losses, and designation of TDRs in periods subsequent to the modification is included in the Annual Report on Form 10-K for the year ended December 31, 2011.
28

Table of Contents
Modifications Considered TDRs and Financial Impact
The majority of Regions’ 2012 commercial and investor real estate TDRs are the result of renewals where the only concession is that the interest rate at renewal is not considered to be a market rate. Consumer TDRs generally involve an interest rate concession. Accordingly, the financial impact of the modifications is best illustrated by the impact to the allowance calculation at the loan or pool level as a result of the loans being considered impaired due to their status as a TDR.
The following table presents loans by class modified in a TDR, and the financial impact of those modifications, for the period presented.
29
Three Months Ended June 30, 2012
Financial Impact of Modifications
Considered TDRs
Number of
Obligors Recorded
Investment
Increase in Allowance at Modification
(Dollars in millions)
Commercial and industrial 160 $ 185 $ 1 Commercial real estate mortgage—owner-occupied 91 94 1 Commercial real estate construction—owner-occupied 1 2 —
Total commercial 252 281 2 Commercial investor real estate mortgage 160 287 2 Commercial investor real estate construction 59 34 —
Total investor real estate 219 321 2 Residential first mortgage 416 92 12 Home equity 277 21 1 Indirect and other consumer 141 3 —
Total consumer 834 116 13
1,305 $ 718 $ 17
Six Months Ended June 30, 2012
Financial Impact of Modifications
Considered TDRs
Number of
Obligors Recorded
Investment
Increase in Allowance at Modification
(Dollars in millions)
Commercial and industrial 359 $ 336 $ 2 Commercial real estate mortgage—owner-occupied 236 210 2 Commercial real estate construction—owner-occupied 7 6 —
Total commercial 602 552 4 Commercial investor real estate mortgage 347 737 6 Commercial investor real estate construction 129 76 1
Total investor real estate 476 813 7 Residential first mortgage 768 159 20 Home equity 586 44 3 Indirect and other consumer 302 6 —
Total consumer 1,656 209 23
2,734 $ 1,574 $ 34
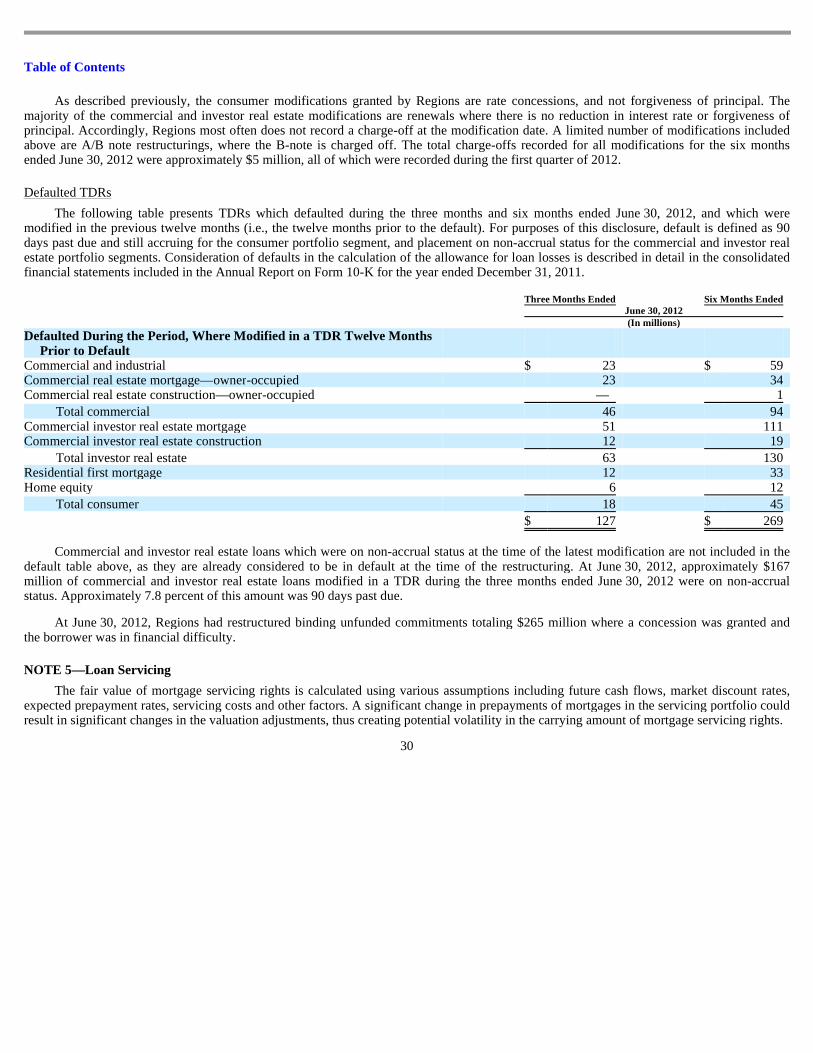
Table of Contents
As described previously, the consumer modifications granted by Regions are rate concessions, and not forgiveness of principal. The majority of the commercial and investor real estate modifications are renewals where there is no reduction in interest rate or forgiveness of principal. Accordingly, Regions most often does not record a charge-off at the modification date. A limited number of modifications included above are A/B note restructurings, where the B-note is charged off. The total charge-offs recorded for all modifications for the six months ended June 30, 2012 were approximately $5 million, all of which were recorded during the first quarter of 2012.
Defaulted TDRs
The following table presents TDRs which defaulted during the three months and six months ended June 30, 2012, and which were modified in the previous twelve months (i.e., the twelve months prior to the default). For purposes of this disclosure, default is defined as 90 days past due and still accruing for the consumer portfolio segment, and placement on non-accrual status for the commercial and investor real estate portfolio segments. Consideration of defaults in the calculation of the allowance for loan losses is described in detail in the consolidated financial statements included in the Annual Report on Form 10-K for the year ended December 31, 2011.
Commercial and investor real estate loans which were on non-accrual status at the time of the latest modification are not included in the default table above, as they are already considered to be in default at the time of the restructuring. At June 30, 2012, approximately $167 million of commercial and investor real estate loans modified in a TDR during the three months ended June 30, 2012 were on non-accrual status. Approximately 7.8 percent of this amount was 90 days past due.
At June 30, 2012, Regions had restructured binding unfunded commitments totaling $265 million where a concession was granted and the borrower was in financial difficulty.
NOTE 5—Loan Servicing
The fair value of mortgage servicing rights is calculated using various assumptions including future cash flows, market discount rates, expected prepayment rates, servicing costs and other factors. A significant change in prepayments of mortgages in the servicing portfolio could result in significant changes in the valuation adjustments, thus creating potential volatility in the carrying amount of mortgage servicing rights.
30
Three Months Ended Six Months Ended June 30, 2012 (In millions)
Defaulted During the Period, Where Modified in a TDR Twelve Months Prior to Default
Commercial and industrial $ 23 $ 59 Commercial real estate mortgage—owner-occupied 23 34 Commercial real estate construction—owner-occupied — 1
Total commercial 46 94 Commercial investor real estate mortgage 51 111 Commercial investor real estate construction 12 19
Total investor real estate 63 130 Residential first mortgage 12 33 Home equity 6 12
Total consumer 18 45
$ 127 $ 269

Table of Contents
The tables below present an analysis of mortgage servicing rights under the fair value measurement method:
Data and assumptions used in the fair value calculation, as well as the valuation’s sensitivity to rate fluctuations, related to mortgage servicing rights (excluding related derivative instruments) are as follows:
The sensitivity calculations above are hypothetical and should not be considered to be predictive of future performance. Changes in fair value based on adverse changes in assumptions generally cannot be extrapolated because the relationship of the change in assumption to the change in fair value may not be linear. Also, the effect of an adverse variation in a particular assumption on the fair value of the mortgage servicing rights is calculated without changing any other assumption, while in reality changes in one factor may result in changes in another, which may either magnify or counteract the effect of the change. The derivative instruments utilized by Regions would serve to reduce the estimated impacts to fair value included in the table above.
The following table presents servicing related fees, which includes contractually specified servicing fees, late fees and other ancillary income resulting from the servicing of mortgage loans:
Loans are sold in the secondary market with standard representations and warranties regarding certain characteristics such as the quality of the loan, the absence of fraud, the eligibility of the loan for sale and the future servicing associated with the loan. Regions may be required to repurchase these loans at par, or make-whole or indemnify the purchasers for losses incurred when representations and warranties are breached.
31
Three Months Ended
June 30 Six Months Ended
June 30 2012 2011 2012 2011 (In millions)
Carrying value, beginning of period $ 199 $ 282 $ 182 $ 267 Additions 14 19 28 35 Decrease in fair value:
Due to change in valuation inputs or assumptions (26 ) (28 ) (17 ) (23 ) Other changes (1) (8 ) (5 ) (14 ) (11 )
Carrying value, end of period $ 179 $ 268 $ 179 $ 268
(1) Represents economic amortization associated with borrower repayments.
June 30 2012 2011 (Dollars in millions)
Unpaid principal balance $ 26,066 $ 26,421 Weighted-average prepayment speed (CPR; percentage) 18.4 % 13.6 %
Estimated impact on fair value of a 10% increase $ (12 ) $ (15 ) Estimated impact on fair value of a 20% increase $ (22 ) $ (29 )
Option-adjusted spread (basis points) 1,332 714 Estimated impact on fair value of a 10% increase $ (6 ) $ (7 ) Estimated impact on fair value of a 20% increase $ (12 ) $ (14 )
Weighted-average coupon interest rate 5.1 % 5.3 % Weighted-average remaining maturity (months) 278 283 Weighted-average servicing fee (basis points) 28.5 28.6
Three Months Ended
June 30 Six Months Ended
June 30 2012 2011 2012 2011 (In millions)
Servicing related fees and other ancillary income $ 21 $ 21 $ 42 $ 42

Table of Contents
Regions maintains a repurchase liability related to mortgage loans sold with representations and warranty provisions. This repurchase liability is reported as other liabilities on the consolidated balance sheets and reflects management’s estimate of losses based on historical repurchase and loss trends, as well as other factors that may result in anticipated losses different from historical loss trends. Adjustments to this reserve are recorded in other non-interest expense on the consolidated statements of income. The table below presents an analysis of Regions’repurchase liability related to mortgage loans sold with representations and warranty provisions:
During the second quarter of 2012 and 2011, settled repurchase claims were related to one of the following alleged breaches: 1) underwriting guideline violations; 2) misrepresentation of income, assets or employment; or 3) property valuation not supported. These claims stem primarily from the 2006—2008 vintages.
NOTE 6—Goodwill
Goodwill allocated to each reportable segment (each a reporting unit) is presented as follows:
Regions evaluates each reporting unit’s goodwill for impairment on an annual basis in the fourth quarter, or more often if events or circumstances indicate that there may be impairment. Adverse changes in the economic environment, declining operations, or other factors could result in a decline in the implied fair value of goodwill. A goodwill impairment test includes two steps. Step One, used to identify potential impairment, compares the estimated fair value of a reporting unit with its carrying amount, including goodwill. If the estimated fair value of a reporting unit exceeds its carrying amount, goodwill of the reporting unit is considered not impaired. If the carrying amount of a reporting unit exceeds its estimated fair value, the second step of the goodwill impairment test is performed to measure the amount of impairment loss, if any. Step Two of the goodwill impairment test compares the implied estimated fair value of reporting unit goodwill with the carrying amount of that goodwill. If the carrying amount of goodwill for that reporting unit exceeds the implied fair value of that unit’s goodwill, an impairment loss is recognized in an amount equal to that excess.
During the second quarter of 2012, Regions assessed the indicators of goodwill impairment as of May 31, 2012, and through the date of the filing of the Quarterly Report on Form 10-Q for the quarter ended June 30, 2012. The indicators assessed included:
32
Three Months Ended
June 30 Six Months Ended
June 30 2012 2011 2012 2011 (In millions)
Beginning balance $ 32 $ 32 $ 32 $ 32 Additions/(reductions), net 14 5 23 13 Losses (9 ) (5 ) (18 ) (13 )
Ending balance $ 37 $ 32 $ 37 $ 32
June 30
2012
December 31
2011 (In millions)
Banking/Treasury $ 4,691 $ 4,691 Insurance 125 125
$ 4,816 $ 4,816
• Recent operating performance, • Changes in market capitalization, • Regulatory actions and assessments,

Table of Contents
While the assessment of these indicators did not indicate impairment, Regions determined that quantitative testing of goodwill was required for all of Regions’ reporting units for the June 30, 2012 interim period due to the shortfall between Regions’ market capitalization and book value. The results of the interim test indicated that goodwill was not impaired as of the test date.
For purposes of performing Step One of the goodwill impairment test, Regions uses both the income and market approaches to value its reporting units. The income approach, which is the primary valuation approach, consists of discounting projected long-term future cash flows, which are derived from internal forecasts and economic expectations for the respective reporting units. The significant inputs to the income approach include expected future cash flows, the long-term target tangible equity to tangible assets ratio, and the discount rate.
Regions utilizes the capital asset pricing model (“CAPM”) in order to derive the base discount rate. The inputs to the CAPM include the 20-year risk-free rate, 5-year beta for a select peer set, and the market risk premium based on published data. Once the output of the CAPM is determined, a size premium is added (also based on a published source) as well as a company-specific risk premium, which is an estimate determined by the Company and meant to compensate for the risk inherent in the future cash flow projections and inherent differences (such as business model and market perception of risk) between Regions and the peer set.
Regions uses the public company method and the transaction method as the two market approaches. The public company method applies a value multiplier derived from each reporting unit’s peer group to a financial metric of the reporting unit (e.g. last twelve months of earnings before interest, taxes and depreciation, tangible book value, etc.) and an implied control premium to the respective reporting unit. The control premium is evaluated and compared to similar financial services transactions considering the absolute and relative potential revenue synergies and cost savings. The transaction method applies a value multiplier to a financial metric of the reporting unit based on comparable observed purchase transactions in the financial services industry for the reporting unit (where available).
Regions uses the output from these approaches to determine the estimated fair value of each reporting unit. Listed in the tables below are assumptions used in estimating the fair value of each reporting unit for the June 30, 2012 interim period and the December 31, 2011 annual test. Second quarter 2012 includes testing for only the Banking/Treasury and Insurance reporting units, as the goodwill impairment charge taken on the Investment Banking/Brokerage/Trust reporting unit in the fourth quarter of 2011 reduced the net carrying value of goodwill in that reporting unit to zero. The tables include the discount rate used in the income approach, the market multiplier used in the market approaches, and the public company method control premium applied to all reporting units.
33
• Changes in the business climate (including legislation, legal factors and competition), • Company-specific factors (including changes in key personnel, asset impairments, and business dispositions), and • Trends in the banking industry.
As of Second Quarter 2012 Banking/ Treasury Insurance
Discount rate used in income approach 14 % 11 % Public company method market multiplier (1) 1.0 x 15.6 x Transaction method market multiplier (2) 1.4 x n/a (1) For the Banking/Treasury reporting unit, this multiplier is applied to tangible book value. For the Insurance reporting unit, this multiplier
is applied to the last twelve months of net income. In addition to the multipliers, a 30 percent control premium is assumed for both the Banking/Treasury and Insurance reporting units.
(2) For the Banking/Treasury reporting unit, this multiplier is applied to tangible book value.

Table of Contents
Regions’ capital plan, which was required under the Federal Reserve’s Comprehensive Capital Analysis and Review (“CCAR”), was submitted in early January of 2012. The Federal Reserve responded with no objections to the capital actions set forth in the capital plan on March 13, 2012. Shortly thereafter, as discussed in Note 7, Regions issued and sold 153 million shares of its common stock at $5.90 per share, generating proceeds of approximately $875 million, net of issuance costs. Additionally, in connection with the CCAR on March 13, 2012, the Federal Reserve disclosed its projections of pro-forma, post stress pre-provision income and losses and pro-forma, post stress capital ratios under the Federal Reserve’s “Supervisory Stress Scenario” for the nineteen institutions, including Regions, that participated in the 2011 CCAR. Regions exceeded the minimum required capital level over the entire review period through year-end 2013. Regions also received an upgrade to its debt ratings from Standard & Poor’s rating agency on March 15, 2012. These positive factors led to a reduction in the discount rate applied to the Banking/Treasury reporting unit in the first quarter of 2012. The discount rate remained the same as first quarter for second quarter 2012.
NOTE 7—Stockholders’ Equity and Accumulated Other Comprehensive Income (Loss)
On March 19, 2012, the Company issued 153 million shares of common stock at $5.90 per share, generating proceeds of approximately $875 million, net of issuance costs.
On November 14, 2008, Regions completed the sale of 3.5 million shares of its Fixed Rate Cumulative Perpetual Preferred Stock, Series A, to the U.S. Treasury as part of the Capital Purchase Program (“CPP”). Under this agreement, Regions was required to pay the U.S. Treasury on a quarterly basis a 5 percent dividend, or $175 million annually, for each of the first five years of the investment, and 9 percent thereafter or until redemption. As part of its purchase of the preferred securities, the U.S. Treasury also received a warrant to purchase 48.3 million shares of Regions’ common stock at an exercise price of $10.88 per share, subject to anti-dilution and other adjustments. Regions received $3.5 billion from issuance of the Series A preferred shares and the warrant. The fair value allocation of the $3.5 billion between the preferred shares and the warrant resulted in $3.304 billion allocated to the preferred shares and $196 million allocated to the warrant. On April 4, 2012, Regions repurchased all 3.5 million shares of the Series A preferred stock issued to the U.S. Treasury Department under the CPP. Therefore, during the second quarter of 2012, Regions derecognized the carrying value of the Series A shares in the amount of approximately $3.4 billion and recorded approximately $71 million of amortization related to the remaining unaccreted discount, which reduced net income available to common shareholders. The total reduction to shareholders’ equity was $3.5 billion. In early May of 2012, Regions repurchased the warrant from the U.S. Treasury Department for $45 million. The transaction reduced additional paid-in capital within stockholders’ equity by $45 million. The warrant repurchase did not impact results of operations.
At June 30, 2012, Regions had 23.1 million common shares available for repurchase through open market transactions under an existing share repurchase authorization. There were no treasury stock purchases through open market transactions during the first six months of 2012 or 2011.
34
As of Fourth Quarter 2011
Banking/
Treasury
Investment Banking/
Brokerage/Trust Insurance Discount rate used in income approach 15 % 15 % 11 % Public company method market multiplier (1) 0.7 x 1.4 x 13.0 x Transaction method market multiplier (2) 1.1 x 1.5 x n/a (1) For the Banking/Treasury and Investment Banking/Brokerage/Trust reporting units, these multipliers are applied to tangible book value.
For the Insurance reporting unit, this multiplier is applied to the last twelve months of net income. In addition to the multipliers, a 55 percent control premium is assumed for the Banking/Treasury reporting unit. A 20 percent control premium is assumed for the Investment Banking/Brokerage/Trust reporting unit and a 30 percent control premium is assumed for the Insurance reporting unit.
(2) For the Banking/Treasury and Investment Banking/Brokerage/Trust reporting units, these multipliers are applied to tangible book value.
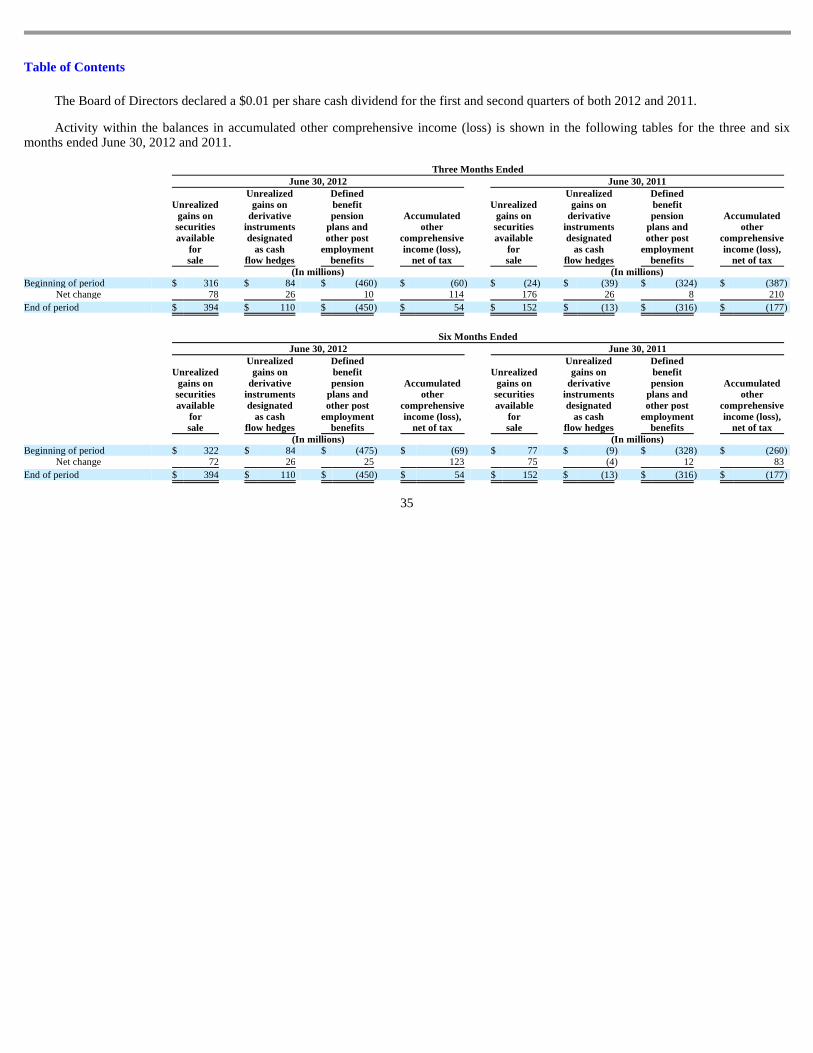
Table of Contents
The Board of Directors declared a $0.01 per share cash dividend for the first and second quarters of both 2012 and 2011.
Activity within the balances in accumulated other comprehensive income (loss) is shown in the following tables for the three and six months ended June 30, 2012 and 2011.
35
Three Months Ended June 30, 2012 June 30, 2011
Unrealized gains on securities available
for sale
Unrealized gains on
derivative instruments designated
as cash flow hedges
Defined benefit pension
plans and other post
employment benefits
Accumulated other
comprehensive income (loss),
net of tax
Unrealized gains on securities available
for sale
Unrealized gains on
derivative instruments designated
as cash flow hedges
Defined benefit pension
plans and other post
employment benefits
Accumulated other
comprehensive income (loss),
net of tax (In millions) (In millions) Beginning of period $ 316 $ 84 $ (460 ) $ (60 ) $ (24 ) $ (39 ) $ (324 ) $ (387 )
Net change 78 26 10 114 176 26 8 210
End of period $ 394 $ 110 $ (450 ) $ 54 $ 152 $ (13 ) $ (316 ) $ (177 )
Six Months Ended June 30, 2012 June 30, 2011
Unrealized gains on securities available
for sale
Unrealized gains on
derivative instruments designated
as cash flow hedges
Defined benefit pension
plans and other post
employment benefits
Accumulated other
comprehensive income (loss),
net of tax
Unrealized gains on securities available
for sale
Unrealized gains on
derivative instruments designated
as cash flow hedges
Defined benefit pension
plans and other post
employment benefits
Accumulated other
comprehensive income (loss),
net of tax (In millions) (In millions) Beginning of period $ 322 $ 84 $ (475 ) $ (69 ) $ 77 $ (9 ) $ (328 ) $ (260 )
Net change 72 26 25 123 75 (4 ) 12 83
End of period $ 394 $ 110 $ (450 ) $ 54 $ 152 $ (13 ) $ (316 ) $ (177 )

Table of Contents
NOTE 8—Earnings (Loss) per Common Share
The following table sets forth the computation of basic earnings (loss) per common share and diluted earnings (loss) per common share:
The effect from the assumed exercise of 39 million stock options for both the three months and six months ended June 30, 2012 was not included in the above computations of diluted earnings per common share because such amounts would have had an antidilutive effect on earnings per common share. The effect from the assumed exercise of 41 million and 42 million stock options for the three months and six months ended June 30, 2011, respectively, was not included in the above computations of diluted earnings per share because such amounts would have had an antidilutive effect on earnings per share.
NOTE 9—Share-Based Payments
Regions has long-term incentive compensation plans that permit the granting of incentive awards in the form of stock options, restricted stock, restricted stock awards and units, performance awards, and/or stock appreciation rights. While Regions has the ability to issue stock appreciation rights, none have been issued to date. The terms of all awards issued under these plans are determined by the Compensation Committee of the Board of Directors; however, no awards may be granted after the tenth anniversary from the date the plans were initially approved by shareholders. Incentive awards usually vest based on employee service, generally within three years from the date of the grant. The contractual lives of options granted under these plans range from seven to ten years from the date of grant.
On May 13, 2010, the shareholders of the Company approved the Regions Financial Corporation 2010 Long-Term Incentive Plan (“2010 LTIP”), which permits the Company to grant to employees and directors
36
Three Months Ended
June 30 Six Months Ended
June 30 2012 2011 2012 2011 (In millions, except per share amounts)
Numerator:
Income from continuing operations $ 351 $ 79 $ 590 $ 129 Less: Preferred stock dividends and accretion (71 ) (54 ) (125 ) (106 )
Income from continuing operations available to common shareholders 280 25 465 23 Income (loss) from discontinued operations, net of tax 4 30 (36 ) 49
Net income available to common shareholders $ 284 $ 55 $ 429 $ 72
Denominator:
Weighted-average common shares outstanding—basic 1,414 1,258 1,348 1,257 Potential common shares 4 2 2 2
Weighted-average common shares outstanding—diluted 1,418 1,260 1,350 1,259
Earnings per common share from continuing operations (1):
Basic $ 0.20 $ 0.02 $ 0.34 $ 0.02 Diluted 0.20 0.02 0.34 0.02
Earnings (loss) per common share from discontinued operations (1):
Basic 0.00 0.02 (0.03 ) 0.04 Diluted 0.00 0.02 (0.03 ) 0.04
Earnings per common share (1):
Basic 0.20 0.04 0.32 0.06 Diluted 0.20 0.04 0.32 0.06
(1) Certain per share amounts may not appear to reconcile due to rounding.
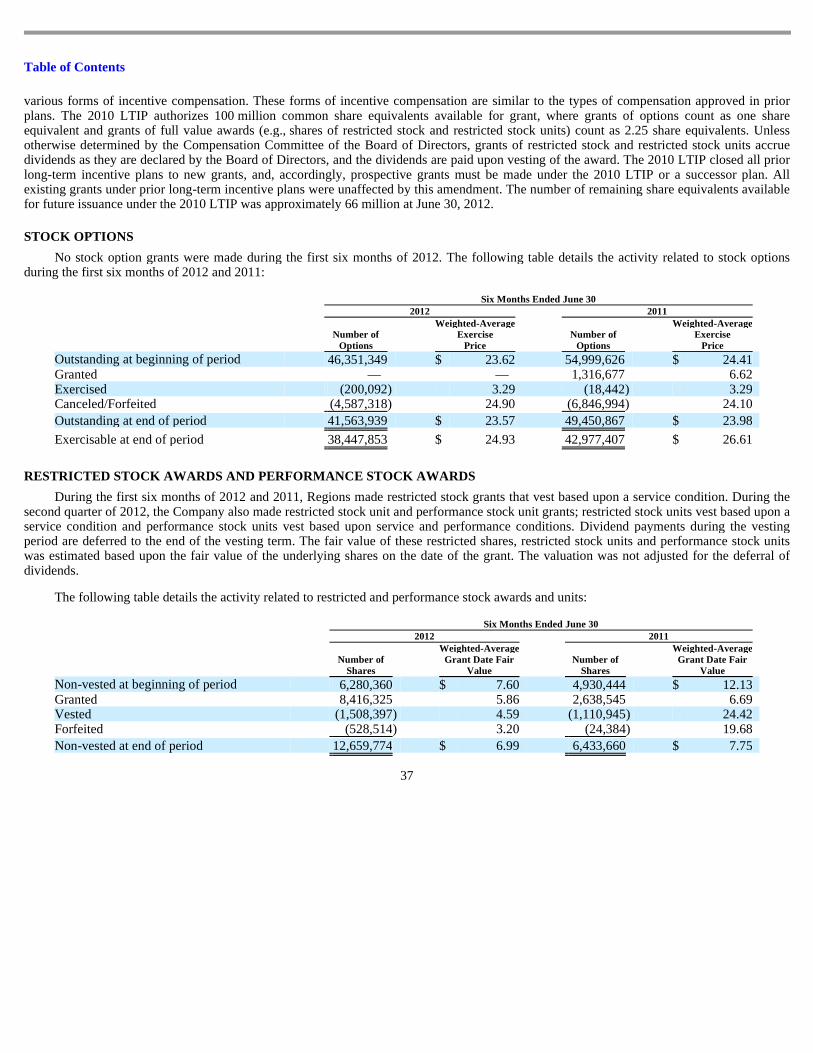
Table of Contents
various forms of incentive compensation. These forms of incentive compensation are similar to the types of compensation approved in prior plans. The 2010 LTIP authorizes 100 million common share equivalents available for grant, where grants of options count as one share equivalent and grants of full value awards (e.g., shares of restricted stock and restricted stock units) count as 2.25 share equivalents. Unless otherwise determined by the Compensation Committee of the Board of Directors, grants of restricted stock and restricted stock units accrue dividends as they are declared by the Board of Directors, and the dividends are paid upon vesting of the award. The 2010 LTIP closed all prior long-term incentive plans to new grants, and, accordingly, prospective grants must be made under the 2010 LTIP or a successor plan. All existing grants under prior long-term incentive plans were unaffected by this amendment. The number of remaining share equivalents available for future issuance under the 2010 LTIP was approximately 66 million at June 30, 2012.
STOCK OPTIONS
No stock option grants were made during the first six months of 2012. The following table details the activity related to stock options during the first six months of 2012 and 2011:
RESTRICTED STOCK AWARDS AND PERFORMANCE STOCK AWARD S
During the first six months of 2012 and 2011, Regions made restricted stock grants that vest based upon a service condition. During the second quarter of 2012, the Company also made restricted stock unit and performance stock unit grants; restricted stock units vest based upon a service condition and performance stock units vest based upon service and performance conditions. Dividend payments during the vesting period are deferred to the end of the vesting term. The fair value of these restricted shares, restricted stock units and performance stock units was estimated based upon the fair value of the underlying shares on the date of the grant. The valuation was not adjusted for the deferral of dividends.
The following table details the activity related to restricted and performance stock awards and units:
37
Six Months Ended June 30 2012 2011
Number of
Options
Weighted-Average Exercise
Price Number of
Options
Weighted-Average Exercise
Price
Outstanding at beginning of period 46,351,349 $ 23.62 54,999,626 $ 24.41 Granted — — 1,316,677 6.62 Exercised (200,092 ) 3.29 (18,442 ) 3.29 Canceled/Forfeited (4,587,318 ) 24.90 (6,846,994 ) 24.10
Outstanding at end of period 41,563,939 $ 23.57 49,450,867 $ 23.98
Exercisable at end of period 38,447,853 $ 24.93 42,977,407 $ 26.61
Six Months Ended June 30 2012 2011
Number of
Shares
Weighted-Average Grant Date Fair
Value Number of
Shares
Weighted-Average Grant Date Fair
Value
Non-vested at beginning of period 6,280,360 $ 7.60 4,930,444 $ 12.13 Granted 8,416,325 5.86 2,638,545 6.69 Vested (1,508,397 ) 4.59 (1,110,945 ) 24.42 Forfeited (528,514 ) 3.20 (24,384 ) 19.68
Non-vested at end of period 12,659,774 $ 6.99 6,433,660 $ 7.75
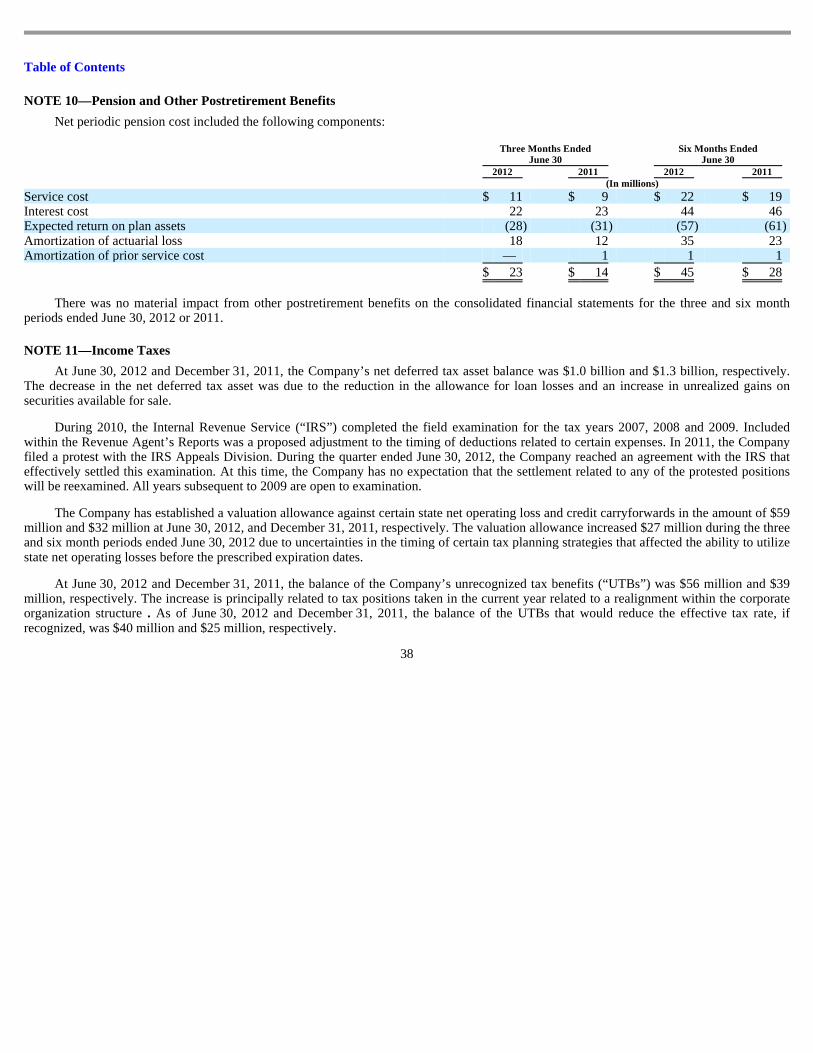
Table of Contents
NOTE 10—Pension and Other Postretirement Benefits
Net periodic pension cost included the following components:
There was no material impact from other postretirement benefits on the consolidated financial statements for the three and six month periods ended June 30, 2012 or 2011.
NOTE 11—Income Taxes
At June 30, 2012 and December 31, 2011, the Company’s net deferred tax asset balance was $1.0 billion and $1.3 billion, respectively. The decrease in the net deferred tax asset was due to the reduction in the allowance for loan losses and an increase in unrealized gains on securities available for sale.
During 2010, the Internal Revenue Service (“IRS”) completed the field examination for the tax years 2007, 2008 and 2009. Included within the Revenue Agent’s Reports was a proposed adjustment to the timing of deductions related to certain expenses. In 2011, the Company filed a protest with the IRS Appeals Division. During the quarter ended June 30, 2012, the Company reached an agreement with the IRS that effectively settled this examination. At this time, the Company has no expectation that the settlement related to any of the protested positions will be reexamined. All years subsequent to 2009 are open to examination.
The Company has established a valuation allowance against certain state net operating loss and credit carryforwards in the amount of $59 million and $32 million at June 30, 2012, and December 31, 2011, respectively. The valuation allowance increased $27 million during the three and six month periods ended June 30, 2012 due to uncertainties in the timing of certain tax planning strategies that affected the ability to utilize state net operating losses before the prescribed expiration dates.
At June 30, 2012 and December 31, 2011, the balance of the Company’s unrecognized tax benefits (“UTBs”) was $56 million and $39 million, respectively. The increase is principally related to tax positions taken in the current year related to a realignment within the corporate organization structure . As of June 30, 2012 and December 31, 2011, the balance of the UTBs that would reduce the effective tax rate, if recognized, was $40 million and $25 million, respectively.
38
Three Months Ended
June 30 Six Months Ended
June 30 2012 2011 2012 2011 (In millions)
Service cost $ 11 $ 9 $ 22 $ 19 Interest cost 22 23 44 46 Expected return on plan assets (28 ) (31 ) (57 ) (61 ) Amortization of actuarial loss 18 12 35 23 Amortization of prior service cost — 1 1 1
$ 23 $ 14 $ 45 $ 28

Table of Contents
NOTE 12—Derivative Financial Instruments and Hedging Activities
The following tables present the notional and fair value of derivative instruments on a gross basis as of June 30, 2012 and December 31, 2011:
39
June 30, 2012
Notional Value
Asset Derivatives Liability Derivatives
Balance Sheet Location Fair
Value Balance Sheet Location Fair
Value (In millions)
Derivatives in fair value hedging relationships:
Interest rate swaps $ 5,107 Other assets $ 128 Other liabilities $ —
Total derivatives designated as hedging instruments $ 5,107 $ 128 $ —
Derivatives not designated as hedging instruments:
Interest rate swaps $ 53,020 Other assets $ 1,931 Other liabilities $ 1,953 Interest rate options 3,838 Other assets 34 Other liabilities 4 Interest rate futures and forward
commitments 55,697 Other assets 8 Other liabilities 22 Other contracts 1,802 Other assets 48 Other liabilities 46
Total derivatives not designated as hedging instruments $ 114,357 $ 2,021 $ 2,025
Total derivatives $ 119,464 $ 2,149 $ 2,025

Table of Contents
HEDGING DERIVATIVES
Derivatives entered into to manage interest rate risk and facilitate asset/liability management strategies are designated as hedging derivatives. Derivative financial instruments that qualify in a hedging relationship are classified, based on the exposure being hedged, as either a fair value hedge or a cash flow hedge. The Company formally documents all hedging relationships between hedging instruments and hedged items, as well as its risk management objective and strategy for entering into various hedge transactions. The Company performs periodic assessments to determine whether the hedging relationship has been highly effective in offsetting changes in fair values or cash flows of hedged items and whether the relationship is expected to continue to be highly effective in the future.
When a hedge is terminated or hedge accounting is discontinued because the hedged item no longer meets the definition of a firm commitment, or because it is probable that the forecasted transaction will not occur by the end of the specified time period, the derivative will continue to be recorded in the consolidated balance sheet at its fair value, with changes in fair value recognized currently in other non-interest income. Any asset or liability that was recorded pursuant to recognition of the firm commitment is removed from the consolidated balance sheets and recognized currently in other non-interest expense. Gains and losses that were accumulated in other comprehensive income pursuant to the hedge of a forecasted transaction are recognized immediately in other non-interest expense.
40
December 31, 2011
Notional
Value
Asset Derivatives Liability Derivatives
Balance Sheet Location Fair
Value Balance Sheet Location Fair
Value (In millions)
Derivatives in fair value hedging relationships:
Interest rate swaps $ 5,535 Other assets $ 153 Other liabilities $ 1 Forward commitments 640 — 11
Derivatives in cash flow hedging relationships:
Interest rate swaps 11,500 Other assets 209 Other liabilities 1
Total derivatives designated as hedging instruments $ 17,675 $ 362 $ 13
Derivatives not designated as hedging instruments:
Interest rate swaps (1) $ 59,293 Other assets $ 2,396 Other liabilities $ 2,414 Interest rate options (2) 4,018 Other assets 41 Other liabilities 28 Interest rate futures and forward
commitments 90,607 Other assets 11 Other liabilities 23 Other contracts 1,276 Other assets 43 Other liabilities 36
Total derivatives not designated as hedging instruments $ 155,194 $ 2,491 $ 2,501
Total derivatives $ 172,869 $ 2,853 $ 2,514
(1) Includes Morgan Keegan amounts of $4.2 billion in Notional Value and $454 million in Other Assets/Other Liabilities (2) Includes Morgan Keegan amounts of $364 million in Notional Value and $23 million in Other Assets/Other Liabilities

Table of Contents
FAIR VALUE HEDGES
Fair value hedge relationships mitigate exposure to the change in fair value of an asset, liability or firm commitment. Under the fair value hedging model, gains or losses attributable to the change in fair value of the derivative instrument, as well as the gains and losses attributable to the change in fair value of the hedged item, are recognized in earnings in the period in which the change in fair value occurs. The corresponding adjustment to the hedged asset or liability is included in the basis of the hedged item, while the corresponding change in the fair value of the derivative instrument is recorded as an adjustment to other assets or other liabilities, as applicable. Hedge ineffectiveness exists to the extent that the changes in fair value of the derivative do not offset the changes in fair value of the hedged item and is recorded as other non-interest expense.
Regions enters into interest rate swap agreements to manage interest rate exposure on the Company’s fixed-rate borrowings, which includes long-term debt and certificates of deposit. These agreements involve the receipt of fixed-rate amounts in exchange for floating-rate interest payments over the life of the agreements. Regions also enters into forward sale commitments to hedge changes in the fair value of available-for-sale securities.
CASH FLOW HEDGES
Cash flow hedge relationships mitigate exposure to the variability of future cash flows or other forecasted transactions. For cash flow hedge relationships, the effective portion of the gain or loss related to the derivative instrument is recognized as a component of other comprehensive income. Ineffectiveness is measured by comparing the change in fair value of the respective derivative instrument and the change in fair value of a “perfectly effective” hypothetical derivative instrument. Ineffectiveness will be recognized in earnings only if it results from an overhedge. The ineffective portion of the gain or loss related to the derivative instrument, if any, is recognized in earnings as other non-interest expense during the period of change. Amounts recorded in other comprehensive income are recognized in earnings in the periods during which the hedged item impacts earnings.
Regions enters into interest rate swap agreements to manage overall cash flow changes related to interest rate risk exposure on LIBOR-based loans. The agreements effectively modify the Company’s exposure to interest rate risk by utilizing receive fixed/pay LIBOR interest rate swaps.
Regions issues long-term fixed-rate debt for various funding needs. Regions enters into receive LIBOR/pay fixed forward starting swaps to hedge risks of changes in the projected quarterly interest payments attributable to changes in the benchmark interest rate (LIBOR) during the time leading up to the probable issuance date of the new long term fixed-rate debt.
Regions enters into interest rate option contracts to protect cash flows through the maturity date of the hedging instrument on designated one-month LIBOR floating-rate loans from adverse extreme market interest rate changes. Regions purchases Eurodollar futures to hedge the variability in future cash flows based on forecasted resets of one-month LIBOR-based floating rate loans due to changes in the benchmark interest rate. Regions recognized an unrealized after-tax gain of $110 million and an unrealized after-tax loss of $31 million in accumulated other comprehensive income at June 30, 2012 and 2011, respectively, related to terminated cash flow hedges of loan and debt instruments which will be amortized into earnings in conjunction with the recognition of interest payments through 2017. Regions recognized pre-tax income of $3 million and $16 million during the three months ended June 30, 2012 and 2011, respectively. Regions recognized a pre-tax loss of $1 million and pre-tax income of $25 million during the six months ended June 30, 2012 and 2011, respectively, related to the amortization of cash flow hedges of loan and debt instruments.
During the second quarter of 2012, all of Regions’ cash flow hedges either matured or were terminated. The total notional amount of the cash flow hedges that matured or terminated was $11.5 billion. As of June 30, 2012, the cumulative pre-tax gain recorded in accumulated other comprehensive income related to these terminated hedges was $243 million. During the next twelve months, Regions expects to reclassify out of other comprehensive income and into earnings approximately $53 million in pre-tax income due to the receipt or payment of interest payments related to the amortization of all discontinued cash flow hedges.
41

Table of Contents
The following tables present the effect of derivative instruments on the statements of income:
Three Months Ended June 30, 2012
Six Months Ended June 30, 2012
42
Derivatives in Fair Value Hedging Relationships
Location of Gain(Loss) Recognized in Income
on Derivatives
Amount of Gain(Loss) Recognized in Income
on Derivatives
Hedged Items in Fair Value Hedge
Relationships
Location of Gain(Loss) Recognized in Income
on Related Hedged Item
Amount of Gain(Loss) Recognized in Income
on Related Hedged Item (In millions)
Interest rate swaps
Other non-interest expense $ (5 )
Debt/CDs
Other non-interest expense $ 6
Interest rate swaps Interest expense 27 Debt Interest expense 3 Forward commitments
Other non-interest
expense — Securities available
for sale Other non-interest
expense —
Total $ 22 $ 9
Derivatives in Cash Flow Hedging Relationships
Amount of Gain(Loss) Recognized in
Accumulated OCI on Derivatives (Effective
Portion) (1)
Location of Gain(Loss) Reclassified from
Accumulated OCI into Income (Effective
Portion)
Amount of Gain(Loss) Reclassified from Accumulated OCI
into Income (Effective Portion) (2)
Location of Gain(Loss) Recognized in Income
on Derivatives (Ineffective Portion and Amount Excluded from Effectiveness Testing)
Amount of Gain(Loss) Recognized in Income on
Derivatives (Ineffective Portion and Amount Excluded from
Effectiveness Testing) (2) (In millions)
Interest rate swaps
$ 25
Interest income on loans $ 21
Other non-interest expense $ 5
Forward starting swaps
2
Interest expense on debt (4 )
Other non-interest expense —
Interest rate options
—
Interest income on loans —
Interest income on loans —
Eurodollar futures
—
Interest income on loans —
Other non-interest expense —
Total $ 27 $ 17 $ 5
(1) After-tax (2) Pre-tax
Derivatives in Fair Value Hedging Relationships
Location of Gain(Loss)
Recognized in Income
on Derivatives
Amount of Gain(Loss)
Recognized in Income
on Derivatives
Hedged Items in Fair Value Hedge
Relationships
Location of Gain(Loss) Recognized in Income
on Related Hedged Item
Amount of Gain(Loss) Recognized in Income
on Related Hedged Item (In millions)
Interest rate swaps
Other non-interest expense $ (21 ) Debt/CDs
Other non-interest expense $ 18
Interest rate swaps Interest expense 58 Debt/CDs Interest expense 6 Forward commitments
Other non-interest
expense —
Securities available
for sale Other non-interest
expense —
Total $ 37 $ 24
Derivatives in Cash Flow Hedging Relationships
Amount of Gain(Loss) Recognized in
Accumulated OCI on Derivatives (Effective
Portion) (1)
Location of Gain(Loss) Reclassified from
Accumulated OCI into Income (Effective
Portion)
Amount of Gain(Loss) Reclassified from Accumulated OCI
into Income (Effective Portion) (2)
Location of Gain(Loss) Recognized in Income
on Derivatives (Ineffective Portion and Amount Excluded from Effectiveness Testing)
Amount of Gain(Loss) Recognized in Income on
Derivatives (Ineffective Portion and Amount Excluded from
Effectiveness Testing) (2) (In millions)
Interest rate swaps
$ 22
Interest income on loans $ 41
Other non-interest expense $ 6
Forward starting swaps
4
Interest expense on debt (7 )
Other non-interest expense —
Interest rate options
—
Interest income on loans —
Interest income on loans —
Eurodollar futures
—
Interest income on loans —
Other non-interest expense —
Total $ 26 $ 34 $ 6
(1) After-tax (2) Pre-tax

Table of Contents
Three Months Ended June 30, 2011
Six Months Ended June 30, 2011
43
Derivatives in Fair Value Hedging Relationships
Location of Gain(Loss) Recognized in Income
on Derivatives
Amount of Gain(Loss) Recognized in Income
on Derivatives
Hedged Items in Fair Value Hedge
Relationships
Location of Gain(Loss) Recognized in Income
on Related Hedged Item
Amount of Gain(Loss) Recognized in Income
on Related Hedged Item (In millions)
Interest rate swaps Other non-interest expense $ 9
Debt/CDs
Other non-interest expense $ (4 )
Interest rate swaps Interest expense 43 Debt Interest expense 4 Forward commitments
Other non-interest expense (35 ) Securities available
for sale Other non-interest
expense 35
Total $ 17 $ 35
Derivatives in Cash Flow Hedging Relationships
Amount of Gain(Loss) Recognized in
Accumulated OCI on Derivatives (Effective
Portion) (1)
Location of Gain(Loss) Reclassified from
Accumulated OCI into Income (Effective
Portion)
Amount of Gain(Loss) Reclassified from Accumulated OCI
into Income (Effective Portion) (2)
Location of Gain(Loss) Recognized in Income
on Derivatives (Ineffective Portion and Amount Excluded from Effectiveness Testing)
Amount of Gain(Loss) Recognized in Income on
Derivatives (Ineffective Portion and Amount Excluded from
Effectiveness Testing) (2) (In millions) Interest rate swaps
$ 30
Interest income
on loans $ 50 Other non-interest
expense $ — Forward starting swaps
(4 )
Interest expense
on debt (3 ) Other non-interest
expense — Interest rate options
—
Interest income
on loans — Interest income
on loans — Eurodollar futures
—
Interest income
on loans — Other non-interest
expense —
Total $ 26 $ 47 $ —
(1) After-tax (2) Pre-tax
Derivatives in Fair Value Hedging Relationships
Location of Gain(Loss) Recognized in Income
on Derivatives
Amount of Gain(Loss) Recognized in Income
on Derivatives
Hedged Items in Fair Value Hedge
Relationships
Location of Gain(Loss) Recognized in Income
on Related Hedged Item
Amount of Gain(Loss) Recognized in Income
on Related Hedged Item (In millions)
Interest rate swaps
Other non-interest expense $ (40 )
Debt/CDs
Other non-interest expense $ 44
Interest rate swaps Interest expense 94 Debt/CDs Interest expense 8 Forward commitments
Other non-interest
expense (35 ) Securities available
for sale Other non-interest
expense 35
Total $ 19 $ 87
Derivatives in Cash Flow Hedging Relationships
Amount of Gain(Loss) Recognized in
Accumulated OCI on Derivatives (Effective
Portion) (1)
Location of Gain(Loss) Reclassified from
Accumulated OCI into Income (Effective
Portion)
Amount of Gain(Loss) Reclassified from Accumulated OCI
into Income (Effective Portion) (2)
Location of Gain(Loss) Recognized in Income
on Derivatives (Ineffective Portion and Amount Excluded from Effectiveness Testing)
Amount of Gain(Loss) Recognized in Income on
Derivatives (Ineffective Portion and Amount Excluded from
Effectiveness Testing) (2) (In millions) Interest rate swaps
$ —
Interest income
on loans $ 98 Other non-interest expense $ 1 Forward starting swaps
(3 )
Interest expense
on debt (3 ) Other non-interest expense (1 ) Interest rate options
(2 )
Interest income
on loans 4 Interest income
on loans — Eurodollar futures
1
Interest income
on loans (2 ) Other non-interest expense —
Total $ (4 ) $ 97 $ —
(1) After-tax (2) Pre-tax

Table of Contents
DERIVATIVES NOT DESIGNATED AS HEDGING INSTRUMENTS
The Company maintains a derivatives trading portfolio of interest rate swaps, option contracts, and futures and forward commitments used to meet the needs of its customers. The portfolio is used to generate trading profit and to help clients manage market risk. The Company is subject to the credit risk that a counterparty will fail to perform. The Company is also subject to market risk, which is evaluated by the Company and monitored by the asset/liability management process. Separate derivative contracts are entered into to reduce overall market exposure to pre-defined limits. The contracts in this portfolio do not qualify for hedge accounting and are marked-to-market through earnings and included in other assets and other liabilities.
Regions enters into interest rate lock commitments, which are commitments to originate mortgage loans whereby the interest rate on the loan is determined prior to funding and the customers have locked into that interest rate. At June 30, 2012 and 2011, Regions had $1.1 billion and $488 million, respectively, in total notional amount of interest rate lock commitments. Regions manages market risk on interest rate lock commitments and mortgage loans held for sale with corresponding forward sale commitments, which are recorded at fair value with changes in fair value recorded in mortgage income. For June 30, 2012 and 2011, Regions had $1.9 billion and $1.0 billion, respectively, in total notional amount related to these forward rate commitments.
Regions has elected to account for mortgage servicing rights at fair market value with any changes to fair value being recorded within mortgage income. Concurrent with the election to use the fair value measurement method, Regions began using various derivative instruments, in the form of forward rate commitments, futures contracts, swaps and swaptions to mitigate the statement of income effect of changes in the fair value of its mortgage servicing rights. As of June 30, 2012 and 2011, the total notional amount related to these contracts was $5.5 billion and $3.6 billion, respectively.
The following tables present the location and amount of gain or (loss) recognized in income on derivatives not designated as hedging instruments in the statements of income for the three and six months ended June 30, 2012 and 2011, respectively:
Credit risk, defined as all positive exposures not collateralized with cash or other financial instruments, at June 30, 2012 and 2011, totaled approximately $850 million and $772 million, respectively. This amount represents the net credit risk on all trading and other derivative positions held by Regions.
44
Three Months Ended
June 30 Six Months Ended
June 30 Derivatives Not Designated as Hedging Instruments 2012 2011 2012 2011 (In millions)
Capital markets and investment income
Interest rate swaps $ 7 $ 3 $ 11 $ 5 Interest rate options (1 ) — (1 ) 1 Interest rate futures and forward commitments (1 ) — (1 ) — Other contracts 2 2 5 5
Total capital markets and investment income 7 5 14 11
Mortgage income
Interest rate swaps 22 17 19 12 Interest rate options 12 (1 ) 17 (29 ) Interest rate futures and forward commitments (3 ) 16 13 18
Total mortgage income 31 32 49 1
$ 38 $ 37 $ 63 $ 12
Table of Contents
CREDIT DERIVATIVES
Regions has both bought and sold credit protection in the form of participations on interest rate swaps (swap participations). These swap participations, which meet the definition of credit derivatives, were entered into in the ordinary course of business to serve the credit needs of customers. Credit derivatives, whereby Regions has purchased credit protection, entitle Regions to receive a payment from the counterparty when the customer fails to make payment on any amounts due to Regions upon early termination of the swap transaction and have maturities between 2012 and 2026. Credit derivatives whereby Regions has sold credit protection have maturities between 2012 and 2018. For contracts where Regions sold credit protection, Regions would be required to make payment to the counterparty when the customer fails to make payment on any amounts due to the counterparty upon early termination of the swap transaction. Regions bases the current status of the prepayment/performance risk on bought and sold credit derivatives on recently issued internal risk ratings consistent with the risk management practices of unfunded commitments.
Regions’ maximum potential amount of future payments under these contracts as of June 30, 2012 was approximately $34 million. This scenario would only occur if variable interest rates were at zero percent and all counterparties defaulted with zero recovery. The fair value of sold protection at June 30, 2012 and 2011 was immaterial. In transactions where Regions has sold credit protection, recourse to collateral associated with the original swap transaction is available to offset some or all of Regions’ obligation.
CONTINGENT FEATURES
Certain of Regions’ derivative instrument contracts with broker-dealers contain provisions allowing those broker-dealers to terminate the contracts in the event that Regions’ and/or Regions Bank’s credit ratings falls below specified ratings from certain major credit rating agencies. At June 30, 2012, Moody’s credit ratings for Regions Financial Corporation and Regions Bank were below investment grade. As a result of these ratings, certain Regions Bank broker-dealer counterparties could have terminated these contracts at their discretion. In lieu of terminating the contracts, Regions Bank and certain of its broker-dealer counterparties amended the contracts such that Regions Bank was required to post additional collateral in the cumulative amount of $186 million to these counterparties as of June 30, 2012.
Some of these contracts with broker-dealers still contain credit-related termination provisions and/or credit-related provisions regarding the posting of collateral. At June 30, 2012, the net fair value of such contracts containing credit-related termination provisions that were in a liability position was $455 million, for which Regions had posted collateral of $581 million. At June 30, 2012, the net fair value of contracts that do not contain credit-related termination provisions that were in a liability position was $291 million, for which Regions had posted collateral of $281 million. Other derivative contracts with broker-dealers do not contain any credit-related provisions. These counterparties require complete overnight collateralization.
The aggregate fair value of all derivative instruments with any credit-risk-related contingent features that were in a liability position on June 30, 2012 and December 31, 2011, was $546 million and $425 million, respectively, for which Regions had posted collateral of $670 million and $531 million, respectively, in the normal course of business.
45
Table of Contents
NOTE 13—Fair Value Measurements
Fair value guidance establishes a framework for using fair value to measure assets and liabilities and defines fair value as the price that would be received to sell an asset or paid to transfer a liability (an exit price) as opposed to the price that would be paid to acquire the asset or received to assume the liability (an entry price). A fair value measure should reflect the assumptions that market participants would use in pricing the asset or liability, including the assumptions about the risk inherent in a particular valuation technique, the effect of a restriction on the sale or use of an asset and the risk of nonperformance. Required disclosures include stratification of balance sheet amounts measured at fair value based on inputs the Company uses to derive fair value measurements. These strata include:
See Note 1 “Summary of Significant Accounting Policies” to the consolidated financial statements of the 2011 Annual Report on Form 10-K for a description of valuation methodologies for assets and liabilities measured at fair value on a recurring and non-recurring basis. Regions rarely transfers assets and liabilities measured at fair value between Level 1 and Level 2 measurements. There were no such transfers during the six month periods ended June 30, 2012 and 2011. Trading account assets are periodically transferred into or out of Level 3 valuation based on management’s conclusion regarding the best method of pricing for an individual security. Such transfers are accounted for as if they occur at the beginning of a reporting period.
46
• Level 1 valuations, where the valuation is based on quoted market prices for identical assets or liabilities traded in active markets
(which include exchanges and over-the-counter markets with sufficient volume),
• Level 2 valuations, where the valuation is based on quoted market prices for similar instruments traded in active markets, quoted
prices for identical or similar instruments in markets that are not active and model-based valuation techniques for which all significant assumptions are observable in the market, and
• Level 3 valuations, where the valuation is generated from model-based techniques that use significant assumptions not observable in the market, but observable based on Company-specific data. These unobservable assumptions reflect the Company’s own estimates for assumptions that market participants would use in pricing the asset or liability. Valuation techniques typically include option pricing models, discounted cash flow models and similar techniques, but may also include the use of market prices of assets or liabilities that are not directly comparable to the subject asset or liability.
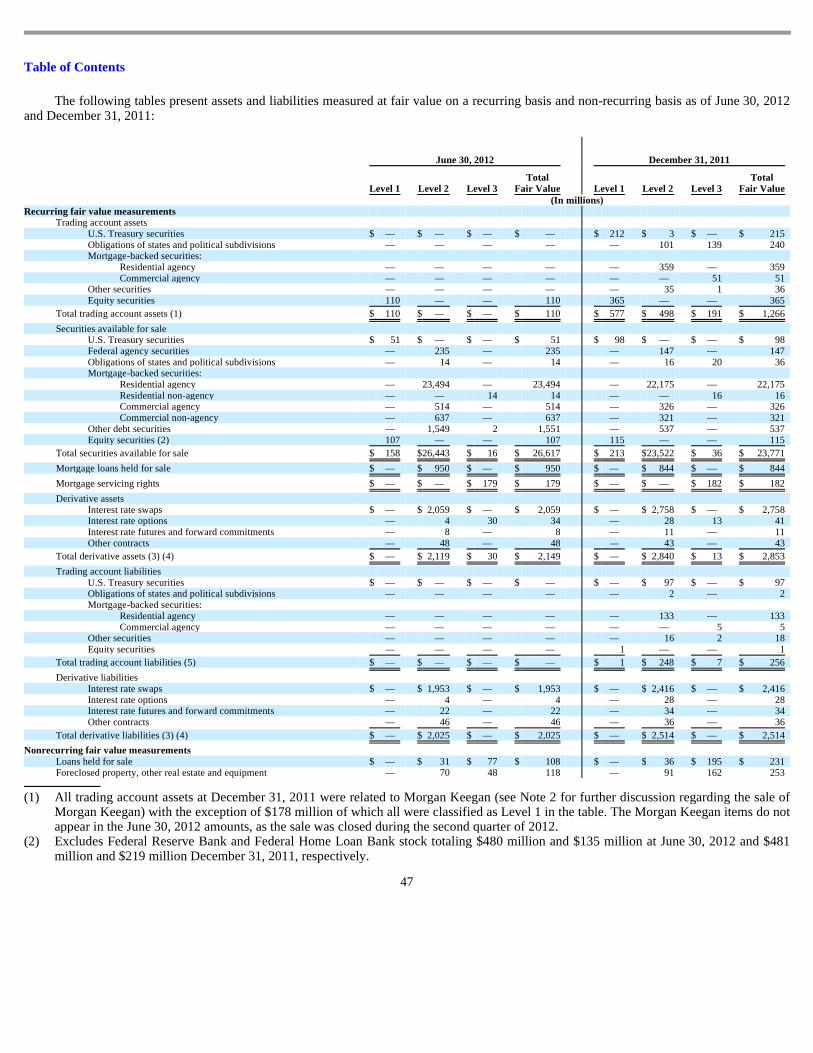
Table of Contents
The following tables present assets and liabilities measured at fair value on a recurring basis and non-recurring basis as of June 30, 2012 and December 31, 2011:
47
June 30, 2012 December 31, 2011
Level 1 Level 2 Level 3 Total
Fair Value Level 1 Level 2 Level 3
Total Fair Value
(In millions) Recurring fair value measurements
Trading account assets U.S. Treasury securities $ — $ — $ — $ — $ 212 $ 3 $ — $ 215 Obligations of states and political subdivisions — — — — — 101 139 240 Mortgage-backed securities:
Residential agency — — — — — 359 — 359 Commercial agency — — — — — — 51 51
Other securities — — — — — 35 1 36 Equity securities 110 — — 110 365 — — 365
Total trading account assets (1) $ 110 $ — $ — $ 110 $ 577 $ 498 $ 191 $ 1,266
Securities available for sale U.S. Treasury securities $ 51 $ — $ — $ 51 $ 98 $ — $ — $ 98 Federal agency securities — 235 — 235 — 147 — 147 Obligations of states and political subdivisions — 14 — 14 — 16 20 36 Mortgage-backed securities:
Residential agency — 23,494 — 23,494 — 22,175 — 22,175 Residential non-agency — — 14 14 — — 16 16 Commercial agency — 514 — 514 — 326 — 326 Commercial non-agency — 637 — 637 — 321 — 321
Other debt securities — 1,549 2 1,551 — 537 — 537 Equity securities (2) 107 — — 107 115 — — 115
Total securities available for sale $ 158 $ 26,443 $ 16 $ 26,617 $ 213 $ 23,522 $ 36 $ 23,771
Mortgage loans held for sale $ — $ 950 $ — $ 950 $ — $ 844 $ — $ 844
Mortgage servicing rights $ — $ — $ 179 $ 179 $ — $ — $ 182 $ 182
Derivative assets Interest rate swaps $ — $ 2,059 $ — $ 2,059 $ — $ 2,758 $ — $ 2,758 Interest rate options — 4 30 34 — 28 13 41 Interest rate futures and forward commitments — 8 — 8 — 11 — 11 Other contracts — 48 — 48 — 43 — 43
Total derivative assets (3) (4) $ — $ 2,119 $ 30 $ 2,149 $ — $ 2,840 $ 13 $ 2,853
Trading account liabilities U.S. Treasury securities $ — $ — $ — $ — $ — $ 97 $ — $ 97 Obligations of states and political subdivisions — — — — — 2 — 2 Mortgage-backed securities:
Residential agency — — — — — 133 — 133 Commercial agency — — — — — — 5 5
Other securities — — — — — 16 2 18 Equity securities — — — — 1 — — 1
Total trading account liabilities (5) $ — $ — $ — $ — $ 1 $ 248 $ 7 $ 256
Derivative liabilities Interest rate swaps $ — $ 1,953 $ — $ 1,953 $ — $ 2,416 $ — $ 2,416 Interest rate options — 4 — 4 — 28 — 28 Interest rate futures and forward commitments — 22 — 22 — 34 — 34 Other contracts — 46 — 46 — 36 — 36
Total derivative liabilities (3) (4) $ — $ 2,025 $ — $ 2,025 $ — $ 2,514 $ — $ 2,514
Nonrecurring fair value measurements Loans held for sale $ — $ 31 $ 77 $ 108 $ — $ 36 $ 195 $ 231 Foreclosed property, other real estate and equipment — 70 48 118 — 91 162 253
(1) All trading account assets at December 31, 2011 were related to Morgan Keegan (see Note 2 for further discussion regarding the sale of
Morgan Keegan) with the exception of $178 million of which all were classified as Level 1 in the table. The Morgan Keegan items do not appear in the June 30, 2012 amounts, as the sale was closed during the second quarter of 2012.
(2) Excludes Federal Reserve Bank and Federal Home Loan Bank stock totaling $480 million and $135 million at June 30, 2012 and $481 million and $219 million December 31, 2011, respectively.
Table of Contents
Assets and liabilities in all levels could result in volatile and material price fluctuations. Realized and unrealized gains and losses on Level 3 assets represent only a portion of the risk to market fluctuations in Regions’ consolidated balance sheets. Further, trading account assets, trading account liabilities and derivatives included in Levels 1, 2 and 3 are used by the Asset and Liability Management Committee of the Company in a holistic approach to managing price fluctuation risks.
48
(3) At June 30, 2012, derivatives include approximately $1.2 billion related to legally enforceable master netting agreements that allow the Company to settle positive and negative positions. Derivatives are also presented excluding cash collateral received of $57 million and cash collateral posted of $881 million with counterparties. At December 31, 2011, derivatives include approximately $1.4 billion related to legally enforceable master netting agreements that allow the Company to settle positive and negative positions. Derivatives are also presented excluding cash collateral received of $55 million and cash collateral posted of $732 million with counterparties.
(4) Derivative assets and liabilities both include $454 million of interest rate swaps and $23 million of interest rate options at December 31, 2011 related to Morgan Keegan, all of which are classified as Level 2 in the table. These items do not appear in the June 30, 2012 amounts, as they were included with the sale of Morgan Keegan.
(5) All trading account liabilities are related to Morgan Keegan at December 31, 2011. These items do not appear in the June 30, 2012 amounts as they were included with the sale of Morgan Keegan.

Table of Contents
The following tables illustrate a rollforward for all assets and (liabilities) measured at fair value on a recurring basis using significant unobservable inputs (Level 3) for the three months and six ended June 30, 2012 and 2011, respectively. The tables do not reflect the change in fair value attributable to any related economic hedges the Company used to mitigate the interest rate risk associated with these assets and (liabilities).
49
Three Months Ended June 30, 2012 Net change in
unrealized
gains (losses)
in included in
earnings related to assets and liabilities held at
June 30, 2012
Total Realized / Unrealized
Gains or Losses
Opening
Balance April 1,
2012
Disposition
of Morgan Keegan
Included
in Earnings
Included
in
Other Compre-
hensive Income (Loss) Purchases Sales Issuances Settlements
Transfers
into Level 3
Transfers
out of Level 3
Closing Balance
June 30,
2012
(In millions) Level 3 Instruments Only
Trading account assets: Obligations of states and
political subdivisions $ 124 (124 ) — — — — — — — — $ — $ — Commercial agency MBS 104 (104 ) — — — — — — — — — — Other securities 13 (13 ) — — — — — — — — — —
Total trading account assets (b) $ 241 (241 ) — — — — — — — — $ — $ —
Securities available for sale: Obligations of states and
political subdivisions $ 16 — — — — (16 ) — — — — $ — $ — Residential non-agency
MBS 15 — — — — — — (1 ) — — 14 — Other debt securities 3 — — — — — — — — (1 ) 2 —
Total securities available for sale $ 34 — — — — (16 ) — (1 ) — (1 ) $ 16 $ —
Mortgage servicing rights $ 199 — (34 )(a) — 14 — — — — — $ 179 $ (26 )(a)
Trading account liabilities: Mortgage-backed
securities: Commercial agency $ 42 (42 ) — — — — — — — — $ — $ —
Other securities 10 (10 ) — — — — — — — — — —
Total trading account liabilities (b) $ 52 (52 ) — — — — — — — — $ — $ —
Derivatives, net: Interest rate options $ 18 — 70 — — — — (58 ) — — $ 30 $ 30 (a)
Total derivatives, net $ 18 — 70 (a) — — — — (58 ) — — $ 30 $ 30 (a)
(a) Included in mortgage income. (b) All amounts related to trading account assets and trading account liabilities are related to Morgan Keegan (see Note 2 for discussion of
sale of Morgan Keegan).

Table of Contents
50
Three Months Ended June 30, 2011
Net change in
unrealized gains
(losses) included in earnings related to assets and liabilities held at
June 30, 2011
Total Realized / Unrealized
Gains or Losses
Opening
Balance April 1,
2011
Included
in Earnings
Included
in Other
Compre-
hensive Income (Loss) Purchases Sales Issuances Settlements
Transfers
into Level 3
Transfers
out of Level 3
Closing
Balance
June 30,
2011
(In millions)
Level 3 Instruments Only Trading account assets (c):
Obligations of states and political subdivisions $ 162 3 — 2 — — (19 ) — — $ 148 $ —
Commercial agency MBS 84 2 — 312 — — (337 ) — — 61 — Other securities 6 6 — 2,249 — — (2,256 ) — — 5 —
Total trading account assets (d) $ 252 11 (a) — 2,563 — — (2,612 ) — — $ 214 $ —
Securities available for sale: Obligations of states and
political subdivisions $ 17 — — — — — — — — $ 17 $ — Residential non-agency
MBS 20 1 (1 ) — (2 ) — (1 ) — — 17 —
Total securities available for sale $ 37 1 (1 ) — (2 ) — (1 ) — — $ 34 $ —
Mortgage servicing rights $ 282 (33 )(b) — 19 — — — — $ 268 $ (28 )(b)
Trading account liabilities (c): Mortgage-backed
securities: Commercial agency $ 13 — — — — — 3 — — $ 16 $ —
Other securities 12 — — (18 ) — — 11 — — 5 —
Total trading account liabilities (d) $ 25 — — (18 ) — — 14 — — $ 21 $
Derivatives, net: Interest rate options $ 5 25 (b) — — — — (25 ) — — $ 5 $ 5 (b) Interest rate futures and
forward commitments 3 — — — — — 1 — — 4 —
Total derivatives, net $ 8 25 — — — — (24 ) — — $ 9 $ 5
(a) Included in discontinued operations, on a net basis. (b) Included in mortgage income. (c) Income from trading account assets primarily represents gains/(losses) on disposition, which inherently includes commissions on security
transactions during the period. (d) All amounts related to trading account assets and trading account liabilities are related to Morgan Keegan (see Note 2 for discussion of
sale of Morgan Keegan).

Table of Contents
51
Six Months Ended June 30, 2012
Net change in unrealized
gains (losses)
included in earnings related to assets and liabilities held at
June 30, 2012
Total Realized / Unrealized
Gains or Losses
Opening Balance
January 1, 2012
Included in
Earnings
Included in Other Compre-hensive Income (Loss) Purchases Sales Issuances Settlements
Transfers into
Level 3
Transfers out of
Level 3
Disposition of Morgan
Keegan
Closing Balance June 30,
2012
(In millions)
Level 3 Instruments Only Trading account assets: (c)
Obligations of states and political subdivisions $ 139 (3 ) — 4 — — (16 ) — — (124 ) $ — $ —
Commercial agency MBS 51 2 — 368 — — (317 ) — — (104 ) — —
Other securities 1 4 — 2,248 — — (2,240 ) — — (13 ) — —
Total trading account assets (d) $ 191 3 (a) — 2,620 — — (2,573 ) — — (241 ) $ — $ —
Securities available for sale: Obligations of states
and political subdivisions $ 20 — (2 ) — (16 ) — (2 ) — — — $ — $ —
Residential non-agency MBS 16 — — — — — (2 ) — — — 14 —
Other debt securities — — — — — — — 3 (1 ) — 2 —
Total securities available for sale $ 36 — (2 ) — (16 ) — (4 ) 3 (1 ) — $ 16 $ —
Mortgage servicing rights $ 182 (31 )(b) — 28 — — — — — — $ 179 $ (17 )(b)
Trading account liabilities: (c) Mortgage-backed
securities: Commercial
agency $ 5 — — 37 — — — — — (42 ) $ — $ — Other securities 2 — — 12 — — (4 ) — — (10 ) — —
Total trading account liabilities (d) $ 7 — — 49 — — (4 ) — — (52 ) $ — $ —
Derivatives, net: Interest rate options $ 13 111 — — — — (94 ) — — — $ 30 $ 48 (b)
Total derivatives, net $ 13 111 (b) — — — — (94 ) — — — $ 30 $ 48 (b)
(a) Included in discontinued operations, on a net basis. (b) Included in mortgage income. (c) Income from trading account assets primarily represents gains/(losses) on disposition, which inherently includes commissions on security
transactions during the period. (d) All amounts related to trading account assets and trading account liabilities are related to Morgan Keegan (see Note 2 for discussion of
sale of Morgan Keegan).
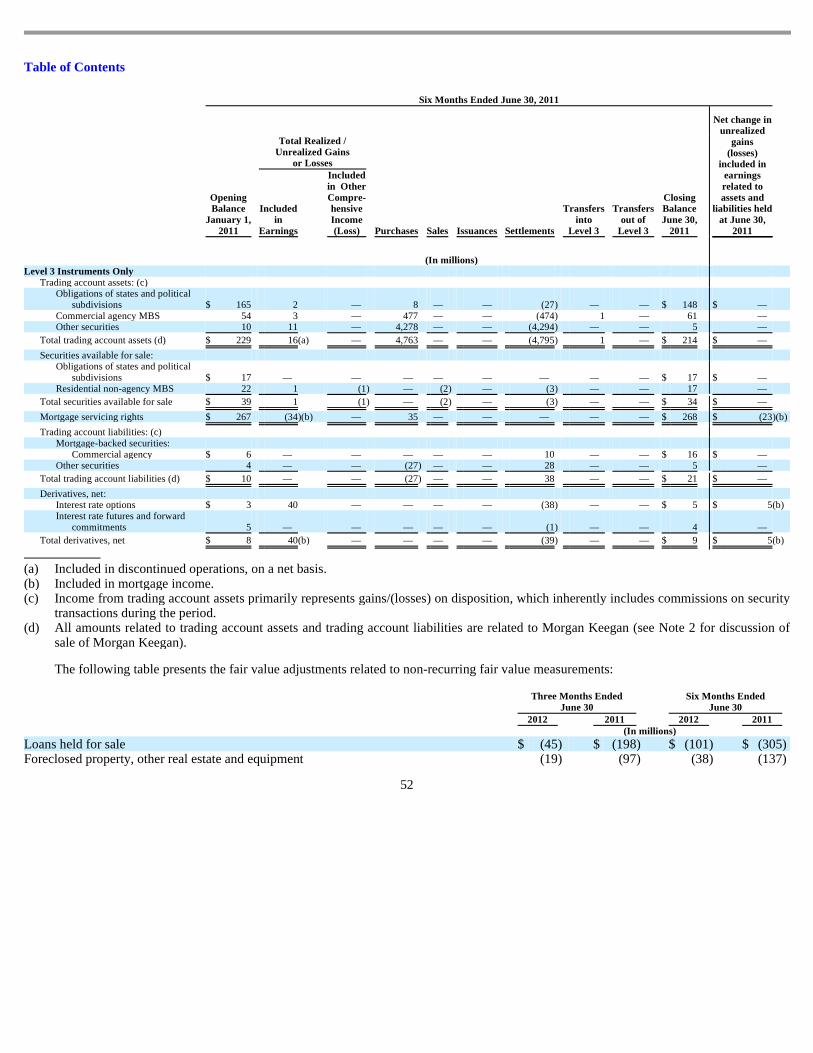
Table of Contents
The following table presents the fair value adjustments related to non-recurring fair value measurements:
52
Six Months Ended June 30, 2011
Net change in unrealized
gains (losses)
included in earnings related to assets and
liabilities held at June 30,
2011
Total Realized / Unrealized Gains
or Losses
Opening Balance
January 1, 2011
Included in
Earnings
Included in Other Compre- hensive Income (Loss) Purchases Sales Issuances Settlements
Transfers into
Level 3
Transfers out of
Level 3
Closing Balance June 30,
2011
(In millions)
Level 3 Instruments Only Trading account assets: (c)
Obligations of states and political subdivisions $ 165 2 — 8 — — (27 ) — — $ 148 $ —
Commercial agency MBS 54 3 — 477 — — (474 ) 1 — 61 — Other securities 10 11 — 4,278 — — (4,294 ) — — 5 —
Total trading account assets (d) $ 229 16 (a) — 4,763 — — (4,795 ) 1 — $ 214 $ —
Securities available for sale: Obligations of states and political
subdivisions $ 17 — — — — — — — — $ 17 $ — Residential non-agency MBS 22 1 (1 ) — (2 ) — (3 ) — — 17 —
Total securities available for sale $ 39 1 (1 ) — (2 ) — (3 ) — — $ 34 $ —
Mortgage servicing rights $ 267 (34 )(b) — 35 — — — — — $ 268 $ (23 )(b)
Trading account liabilities: (c) Mortgage-backed securities:
Commercial agency $ 6 — — — — — 10 — — $ 16 $ — Other securities 4 — — (27 ) — — 28 — — 5 —
Total trading account liabilities (d) $ 10 — — (27 ) — — 38 — — $ 21 $ —
Derivatives, net: Interest rate options $ 3 40 — — — — (38 ) — — $ 5 $ 5 (b) Interest rate futures and forward
commitments 5 — — — — — (1 ) — — 4 —
Total derivatives, net $ 8 40 (b) — — — — (39 ) — — $ 9 $ 5 (b)
(a) Included in discontinued operations, on a net basis. (b) Included in mortgage income. (c) Income from trading account assets primarily represents gains/(losses) on disposition, which inherently includes commissions on security
transactions during the period. (d) All amounts related to trading account assets and trading account liabilities are related to Morgan Keegan (see Note 2 for discussion of
sale of Morgan Keegan).
Three Months Ended
June 30 Six Months Ended
June 30 2012 2011 2012 2011 (In millions)
Loans held for sale $ (45 ) $ (198 ) $ (101 ) $ (305 ) Foreclosed property, other real estate and equipment (19 ) (97 ) (38 ) (137 )
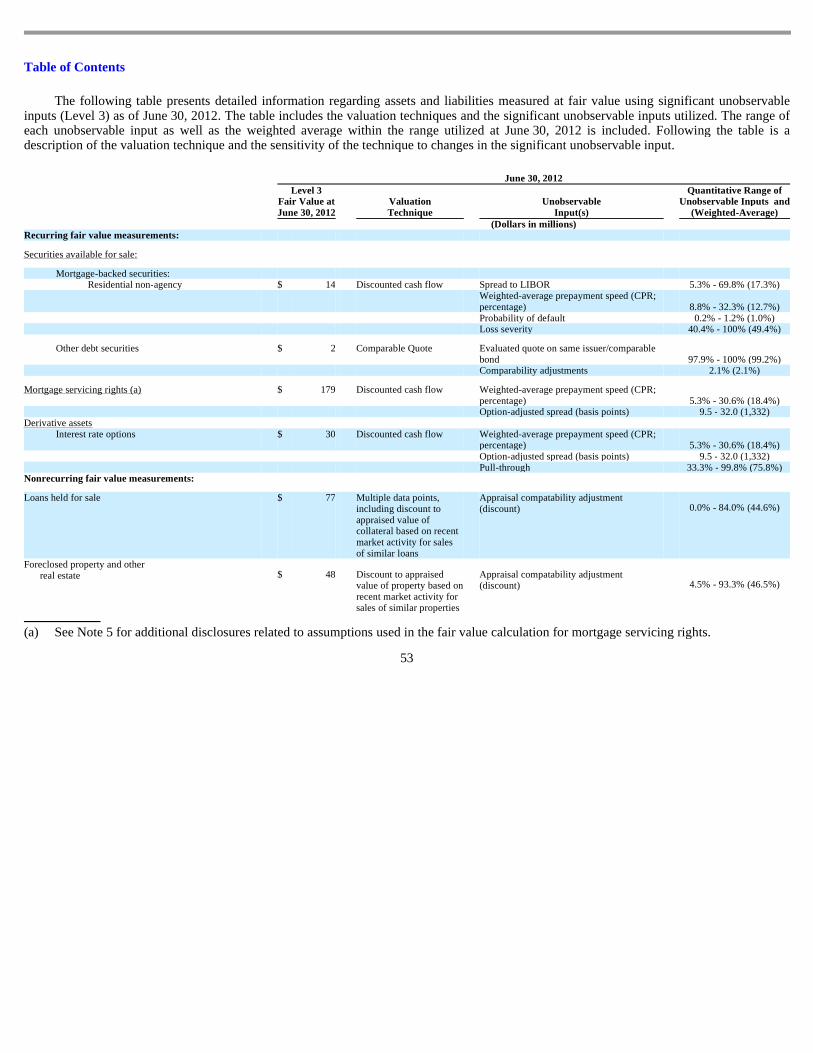
Table of Contents
The following table presents detailed information regarding assets and liabilities measured at fair value using significant unobservable inputs (Level 3) as of June 30, 2012. The table includes the valuation techniques and the significant unobservable inputs utilized. The range of each unobservable input as well as the weighted average within the range utilized at June 30, 2012 is included. Following the table is a description of the valuation technique and the sensitivity of the technique to changes in the significant unobservable input.
53
June 30, 2012
Level 3 Fair Value at June 30, 2012
Valuation Technique
Unobservable Input(s)
Quantitative Range of Unobservable Inputs and
(Weighted-Average) (Dollars in millions) Recurring fair value measurements:
Securities available for sale:
Mortgage-backed securities: Residential non-agency $ 14 Discounted cash flow Spread to LIBOR 5.3% - 69.8% (17.3%)
Weighted-average prepayment speed (CPR; percentage) 8.8% - 32.3% (12.7%)
Probability of default 0.2% - 1.2% (1.0%) Loss severity 40.4% - 100% (49.4%)
Other debt securities
$ 2
Comparable Quote
Evaluated quote on same issuer/comparable bond 97.9% - 100% (99.2%)
Comparability adjustments 2.1% (2.1%)
Mortgage servicing rights (a)
$ 179
Discounted cash flow
Weighted-average prepayment speed (CPR; percentage) 5.3% - 30.6% (18.4%)
Option-adjusted spread (basis points) 9.5 - 32.0 (1,332) Derivative assets
Interest rate options
$ 30
Discounted cash flow
Weighted-average prepayment speed (CPR; percentage) 5.3% - 30.6% (18.4%)
Option-adjusted spread (basis points) 9.5 - 32.0 (1,332) Pull-through 33.3% - 99.8% (75.8%)
Nonrecurring fair value measurements:
Loans held for sale
$ 77
Multiple data points, including discount to appraised value of collateral based on recent market activity for sales of similar loans
Appraisal compatability adjustment (discount)
0.0% - 84.0% (44.6%)
Foreclosed property and other real estate
$
48
Discount to appraised value of property based on recent market activity for sales of similar properties
Appraisal compatability adjustment (discount)
4.5% - 93.3% (46.5%)
(a) See Note 5 for additional disclosures related to assumptions used in the fair value calculation for mortgage servicing rights.

Table of Contents
RECURRING FAIR VALUE MEASUREMENTS USING SIGNIFICANT UNOBSERVABLE INPUTS
Securities available for sale
Mortgage backed securities: residential non-agency —The fair value reported in this category relates to retained interests in legacy securitizations. Significant unobservable inputs include the spread to LIBOR, constant prepayment rate, probability of default, and loss severity in the event of default. Significant increases in any of these inputs in isolation would result in significantly lower fair value measurement. Generally, a change in the assumption used for the probability of default is accompanied by a directionally similar change in the assumption used for loss severity and a directionally opposite change in the assumption used for prepayment rates.
Other debt securities —Significant unobservable inputs include evaluated quotes on comparable bonds for the same issuer and management-determined comparability adjustments. Changes in the evaluated quote on comparable bonds would result in a directionally similar change in the fair value of the other debt securities.
Mortgage Servicing Rights
The significant unobservable inputs used in the fair value measurement of mortgage servicing rights are option adjusted spreads (“OAS”) and prepayment speed. This method requires generating cash flow projections over multiple interest rate scenarios and discounting those cash flows at a risk adjusted rate. Additionally, the impact of prepayments and changes in the option adjusted spread are based on a variety of underlying inputs such as servicing costs. Increases or decreases to the underlying cash flow inputs will have a corresponding impact on the value of the MSR asset. See Note 5 for additional disclosures related to assumptions used in the fair value calculation for mortgage servicing rights.
Derivative assets
Interest rate options —These instruments are interest rate lock agreements made in the normal course of originating residential mortgage loans. Significant unobservable inputs in the fair value measurement are OAS, prepayment speeds, and pull-through. The impact of OAS and prepayment speed inputs in the valuation of these derivative instruments are consistent with the MSR discussion above. Pull-through is an estimate of the number of interest rate lock commitments that will ultimately become funded loans. Increases or decreases in the pull-through assumption will have a corresponding impact on the value of these derivative assets.
NON-RECURRING FAIR VALUE MEASUREMENTS USING SIGNIFICANT UNOBSERVABLE INPUTS
Loans held for sale
Loans held for sale are valued based on multiple data points indicating the fair value for each loan. The primary data point for non-performing investor real estate loans is a discount to the appraised value of the underlying collateral, which considers the return required by potential buyers of the loans. Management establishes this discount or comparability adjustment based on recent sales of loans secured by similar property types. As liquidity in the market increases or decreases, the comparability adjustment and the resulting asset valuation are impacted.
Foreclosed property and other real estate
Foreclosed property and other real estate are valued based on offered quotes as available. If no sales contract is pending for a specific property, management establishes a comparability adjustment to the appraised value based on historical activity considering proceeds for properties sold versus the corresponding appraised value. Increases or decreases in realization for properties sold impact the comparability adjustment for similar assets remaining on the balance sheet.
54
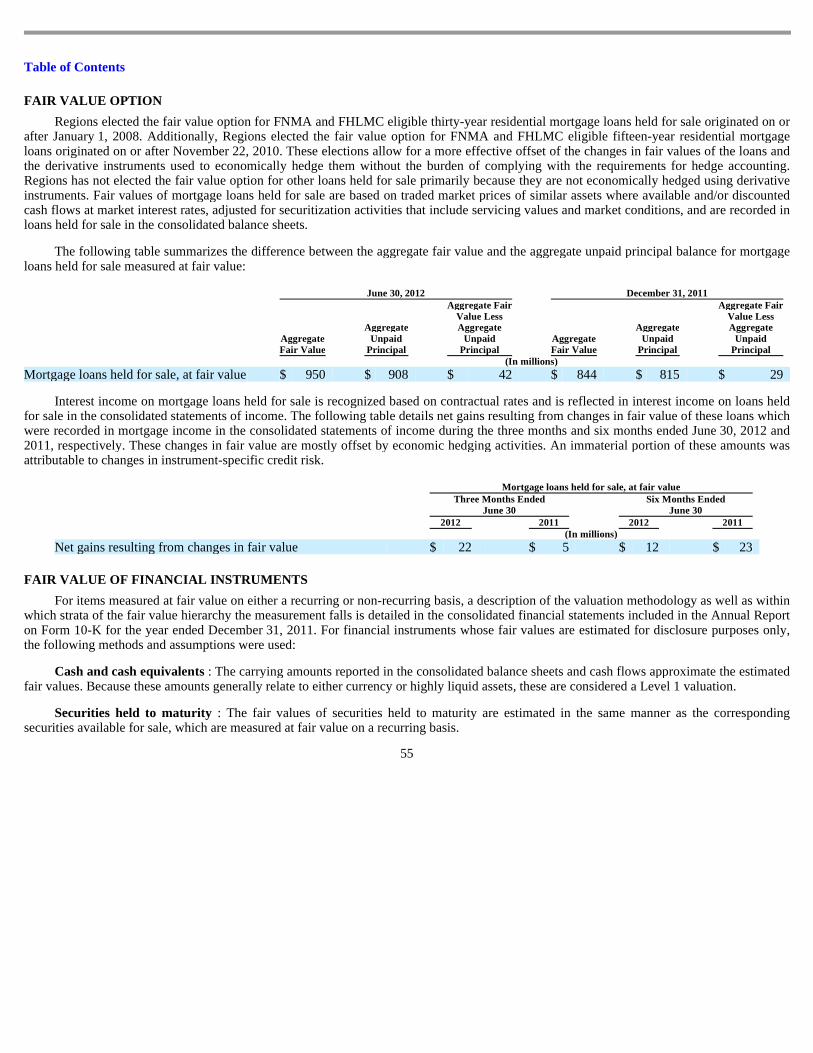
Table of Contents
FAIR VALUE OPTION
Regions elected the fair value option for FNMA and FHLMC eligible thirty-year residential mortgage loans held for sale originated on or after January 1, 2008. Additionally, Regions elected the fair value option for FNMA and FHLMC eligible fifteen-year residential mortgage loans originated on or after November 22, 2010. These elections allow for a more effective offset of the changes in fair values of the loans and the derivative instruments used to economically hedge them without the burden of complying with the requirements for hedge accounting. Regions has not elected the fair value option for other loans held for sale primarily because they are not economically hedged using derivative instruments. Fair values of mortgage loans held for sale are based on traded market prices of similar assets where available and/or discounted cash flows at market interest rates, adjusted for securitization activities that include servicing values and market conditions, and are recorded in loans held for sale in the consolidated balance sheets.
The following table summarizes the difference between the aggregate fair value and the aggregate unpaid principal balance for mortgage loans held for sale measured at fair value:
Interest income on mortgage loans held for sale is recognized based on contractual rates and is reflected in interest income on loans held for sale in the consolidated statements of income. The following table details net gains resulting from changes in fair value of these loans which were recorded in mortgage income in the consolidated statements of income during the three months and six months ended June 30, 2012 and 2011, respectively. These changes in fair value are mostly offset by economic hedging activities. An immaterial portion of these amounts was attributable to changes in instrument-specific credit risk.
FAIR VALUE OF FINANCIAL INSTRUMENTS
For items measured at fair value on either a recurring or non-recurring basis, a description of the valuation methodology as well as within which strata of the fair value hierarchy the measurement falls is detailed in the consolidated financial statements included in the Annual Report on Form 10-K for the year ended December 31, 2011. For financial instruments whose fair values are estimated for disclosure purposes only, the following methods and assumptions were used:
Cash and cash equivalents : The carrying amounts reported in the consolidated balance sheets and cash flows approximate the estimated fair values. Because these amounts generally relate to either currency or highly liquid assets, these are considered a Level 1 valuation.
Securities held to maturity : The fair values of securities held to maturity are estimated in the same manner as the corresponding securities available for sale, which are measured at fair value on a recurring basis.
55
June 30, 2012 December 31, 2011
Aggregate Fair Value
Aggregate Unpaid
Principal
Aggregate Fair Value Less Aggregate
Unpaid Principal
Aggregate Fair Value
Aggregate Unpaid
Principal
Aggregate Fair Value Less Aggregate
Unpaid Principal
(In millions)
Mortgage loans held for sale, at fair value $ 950 $ 908 $ 42 $ 844 $ 815 $ 29
Mortgage loans held for sale, at fair value
Three Months Ended
June 30 Six Months Ended
June 30 2012 2011 2012 2011 (In millions)
Net gains resulting from changes in fair value $ 22 $ 5 $ 12 $ 23

Table of Contents
Loans (excluding leases), net of unearned income and allowance for loan losses : The fair values of loans, excluding leases, are estimated based on groupings of similar loans by type, interest rate, and borrower creditworthiness. Discounted future cash flow analyses are performed for the groupings incorporating assumptions of current and projected prepayment speeds and expected loss. Discount rates are determined using the Company’s current origination rates on similar loans, adjusted for changes in current liquidity and credit spreads (if necessary). Because the current liquidity spreads are generally not observable in the market and the expected loss assumptions are based on the Company’s experience, these are Level 3 valuations.
Other interest-earning assets : The carrying amounts reported in the consolidated balance sheets approximate the estimated fair values. While these instruments are not actively traded in the market, the majority of the inputs required to value them are actively quoted and can be validated through external sources. Accordingly, these are Level 2 valuations.
Deposits : The fair value of non-interest-bearing demand accounts, interest-bearing transaction accounts, savings accounts, money market accounts and certain other time deposit accounts is the amount payable on demand at the reporting date (i.e., the carrying amount). Fair values for certificates of deposit are estimated by using discounted cash flow analyses, based on market spreads to benchmark rates. These are Level 2 valuations.
Short-term and long-term borrowings : The carrying amounts of short-term borrowings reported in the consolidated balance sheets approximate the estimated fair values, and are considered Level 2 measurements as similar instruments are traded in active markets. The fair values of certain long-term borrowings are estimated using quoted market prices of identical instruments, and are considered Level 1 measurements. If identical instruments are not available, fair values are estimated using quoted market prices for similar instruments and are considered Level 2 valuations. Otherwise, valuations are based on a combination of non-binding broker quotes and quoted prices for identical instruments in non-active markets and are considered Level 3 valuations.
Loan commitments and letters of credit : The estimated fair values for these off-balance sheet instruments are based on probabilities of funding to project future loan fundings, which are discounted using the loan methodology described above. The premiums/discounts are adjusted for the time value of money over the average remaining life of the commitments and the opportunity cost associated with regulatory requirements. Because the probabilities of funding and loan valuations are not observable in the market and are considered company specific inputs, these are Level 3 valuations.
Indemnification obligation: The estimated fair value of the indemnification obligation was determined through the use of a present value calculation that takes into account the future cash flows that a market participant would expect to receive from holding the indemnification liability as an asset. Regions performed a probability-weighted cash flow analysis and discounted the result at a credit-adjusted risk free rate. Because the future cash flows and probability weights are company-specific inputs, this is a Level 3 valuation.
56

Table of Contents
The carrying amounts and estimated fair values, as well as the level within the fair value hierarchy, of the Company’s financial instruments as of June 30, 2012 are as follows:
57
June 30, 2012
Carrying Amount
Estimated Fair Value (1) Level 1 Level 2 Level 3
(In millions)
Financial assets:
Cash and cash equivalents $ 3,766 $ 3,766 $ 3,766 $ — $ — Trading account assets 110 110 110 — — Securities available for sale 27,232 27,232 158 27,058 16 Securities held to maturity 13 14 3 11 — Loans held for sale 1,187 1,187 — 981 206 Loans (excluding leases), net of unearned income and
allowance for loan losses (2), (3) 72,427 65,046 — — 65,046 Other interest-earning assets 901 901 — 901 — Derivatives, net 124 124 — 94 30
Financial liabilities:
Deposits 95,098 95,204 — 95,204 — Short-term borrowings 3,306 3,306 — 3,306 — Long-term borrowings 6,230 6,013 291 — 5,722 Loan commitments and letters of credit 129 640 — — 640 Indemnification obligation 383 383 — — 383
(1) Estimated fair values are consistent with an exit price concept. The assumptions used to estimate the fair values are intended to
approximate those that a market participant would use in a hypothetical orderly transaction. In estimating fair value, the Company makes adjustments for interest rates, market liquidity and credit spreads as appropriate.
(2) The estimated fair value of portfolio loans assumes sale of the loans to a third-party financial investor. Accordingly, the value to the Company if the loans were held to maturity is not reflected in the fair value estimate. In the current whole loan market, financial investors are generally requiring a higher rate of return than the return inherent in loans if held to maturity. The fair value discount at June 30, 2012 was $7.4 billion or 10.2 percent.
(3) Excluded from this table is the lease carrying amount of $1.5 billion at June 30, 2012.
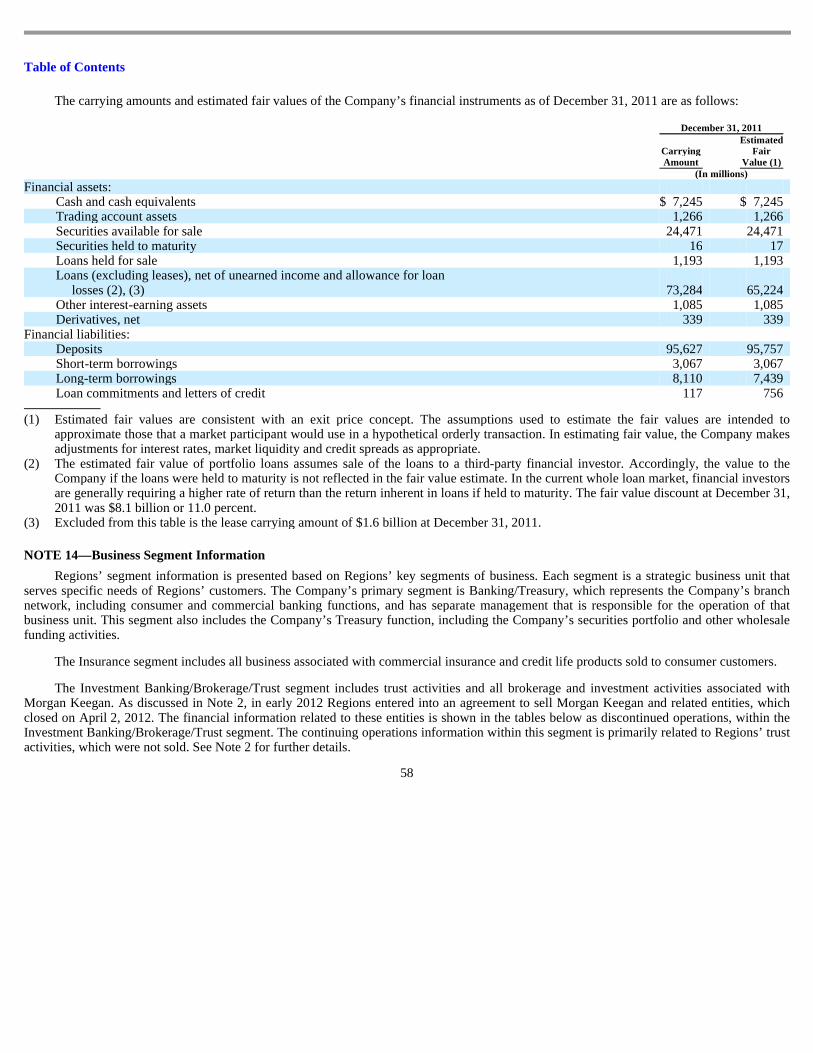
Table of Contents
The carrying amounts and estimated fair values of the Company’s financial instruments as of December 31, 2011 are as follows:
NOTE 14—Business Segment Information
Regions’ segment information is presented based on Regions’ key segments of business. Each segment is a strategic business unit that serves specific needs of Regions’ customers. The Company’s primary segment is Banking/Treasury, which represents the Company’s branch network, including consumer and commercial banking functions, and has separate management that is responsible for the operation of that business unit. This segment also includes the Company’s Treasury function, including the Company’s securities portfolio and other wholesale funding activities.
The Insurance segment includes all business associated with commercial insurance and credit life products sold to consumer customers.
The Investment Banking/Brokerage/Trust segment includes trust activities and all brokerage and investment activities associated with Morgan Keegan. As discussed in Note 2, in early 2012 Regions entered into an agreement to sell Morgan Keegan and related entities, which closed on April 2, 2012. The financial information related to these entities is shown in the tables below as discontinued operations, within the Investment Banking/Brokerage/Trust segment. The continuing operations information within this segment is primarily related to Regions’ trust activities, which were not sold. See Note 2 for further details.
58
December 31, 2011
Carrying Amount
Estimated Fair
Value (1) (In millions)
Financial assets:
Cash and cash equivalents $ 7,245 $ 7,245 Trading account assets 1,266 1,266 Securities available for sale 24,471 24,471 Securities held to maturity 16 17 Loans held for sale 1,193 1,193 Loans (excluding leases), net of unearned income and allowance for loan
losses (2), (3) 73,284 65,224 Other interest-earning assets 1,085 1,085 Derivatives, net 339 339
Financial liabilities:
Deposits 95,627 95,757 Short-term borrowings 3,067 3,067 Long-term borrowings 8,110 7,439 Loan commitments and letters of credit 117 756
(1) Estimated fair values are consistent with an exit price concept. The assumptions used to estimate the fair values are intended to
approximate those that a market participant would use in a hypothetical orderly transaction. In estimating fair value, the Company makes adjustments for interest rates, market liquidity and credit spreads as appropriate.
(2) The estimated fair value of portfolio loans assumes sale of the loans to a third-party financial investor. Accordingly, the value to the Company if the loans were held to maturity is not reflected in the fair value estimate. In the current whole loan market, financial investors are generally requiring a higher rate of return than the return inherent in loans if held to maturity. The fair value discount at December 31, 2011 was $8.1 billion or 11.0 percent.
(3) Excluded from this table is the lease carrying amount of $1.6 billion at December 31, 2011.
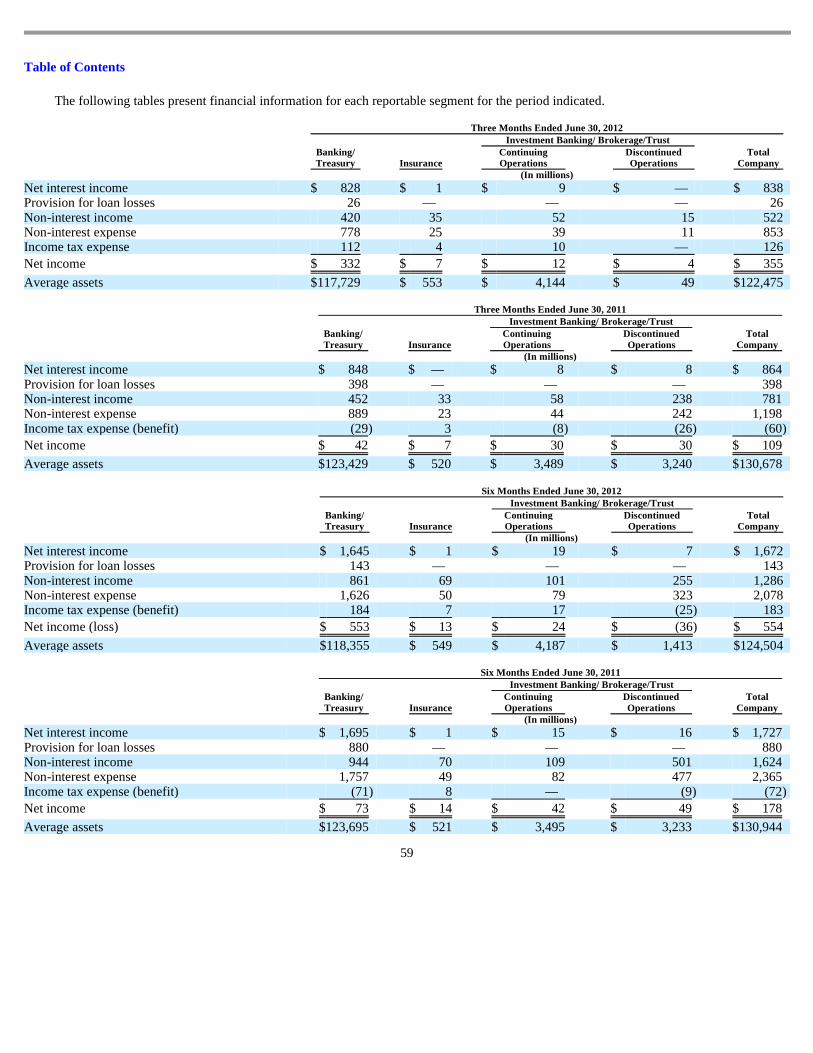
Table of Contents
The following tables present financial information for each reportable segment for the period indicated.
59
Three Months Ended June 30, 2012 Investment Banking/ Brokerage/Trust
Banking/ Treasury Insurance
Continuing Operations
Discontinued Operations
Total Company
(In millions)
Net interest income $ 828 $ 1 $ 9 $ — $ 838 Provision for loan losses 26 — — — 26 Non-interest income 420 35 52 15 522 Non-interest expense 778 25 39 11 853 Income tax expense 112 4 10 — 126
Net income $ 332 $ 7 $ 12 $ 4 $ 355
Average assets $ 117,729 $ 553 $ 4,144 $ 49 $ 122,475
Three Months Ended June 30, 2011 Investment Banking/ Brokerage/Trust
Banking/ Treasury Insurance
Continuing Operations
Discontinued Operations
Total Company
(In millions)
Net interest income $ 848 $ — $ 8 $ 8 $ 864 Provision for loan losses 398 — — — 398 Non-interest income 452 33 58 238 781 Non-interest expense 889 23 44 242 1,198 Income tax expense (benefit) (29 ) 3 (8 ) (26 ) (60 )
Net income $ 42 $ 7 $ 30 $ 30 $ 109
Average assets $ 123,429 $ 520 $ 3,489 $ 3,240 $ 130,678
Six Months Ended June 30, 2012 Investment Banking/ Brokerage/Trust
Banking/ Treasury Insurance
Continuing Operations
Discontinued Operations
Total Company
(In millions)
Net interest income $ 1,645 $ 1 $ 19 $ 7 $ 1,672 Provision for loan losses 143 — — — 143 Non-interest income 861 69 101 255 1,286 Non-interest expense 1,626 50 79 323 2,078 Income tax expense (benefit) 184 7 17 (25 ) 183
Net income (loss) $ 553 $ 13 $ 24 $ (36 ) $ 554
Average assets $ 118,355 $ 549 $ 4,187 $ 1,413 $ 124,504
Six Months Ended June 30, 2011 Investment Banking/ Brokerage/Trust
Banking/ Treasury Insurance
Continuing Operations
Discontinued Operations
Total Company
(In millions)
Net interest income $ 1,695 $ 1 $ 15 $ 16 $ 1,727 Provision for loan losses 880 — — — 880 Non-interest income 944 70 109 501 1,624 Non-interest expense 1,757 49 82 477 2,365 Income tax expense (benefit) (71 ) 8 — (9 ) (72 )
Net income $ 73 $ 14 $ 42 $ 49 $ 178
Average assets $ 123,695 $ 521 $ 3,495 $ 3,233 $ 130,944

Table of Contents
NOTE 15—Commitments and Contingencies
COMMERCIAL COMMITMENTS
Regions issues off-balance sheet financial instruments in connection with lending activities. The credit risk associated with these instruments is essentially the same as that involved in extending loans to customers and is subject to Regions’ normal credit approval policies and procedures. Regions measures inherent risk associated with these instruments by recording a reserve for unfunded commitments based on an assessment of the likelihood that the guarantee will be funded and the creditworthiness of the customer or counterparty. Collateral is obtained based on management’s assessment of the creditworthiness of the customer.
Credit risk associated with these instruments is represented by the contractual amounts indicated in the following table:
Unused commitments to extend credit —To accommodate the financial needs of its customers, Regions makes commitments under various terms to lend funds to consumers, businesses and other entities. These commitments include (among others) credit card and other revolving credit agreements, term loan commitments and short-term borrowing agreements. Many of these loan commitments have fixed expiration dates or other termination clauses and may require payment of a fee. Since many of these commitments are expected to expire without being funded, the total commitment amounts do not necessarily represent future liquidity requirements.
Standby letters of credit —Standby letters of credit are also issued to customers which commit Regions to make payments on behalf of customers if certain specified future events occur. Regions has recourse against the customer for any amount required to be paid to a third party under a standby letter of credit. Historically, a large percentage of standby letters of credit expired without being funded. The contractual amount of standby letters of credit represents the maximum potential amount of future payments Regions could be required to make and represents Regions’ maximum credit risk.
Commercial letters of credit —Commercial letters of credit are issued to facilitate foreign or domestic trade transactions for customers. As a general rule, drafts will be drawn when the goods underlying the transaction are in transit.
INDEMNIFICATION OBLIGATION
As discussed in Note 2, on April 2, 2012 (“Closing Date”), Regions closed the sale of Morgan Keegan Company, Inc. and related affiliates to Raymond James Financial Inc. (“Raymond James”). In connection with the sale, Regions agreed to indemnify Raymond James for all legal matters related to pre-closing activities, including matters filed subsequent to the Closing Date that relate to actions that occurred prior to closing. Losses under the indemnification include legal and other expenses, such as costs for judgments, settlements and awards associated with the defense and resolution of the indemnified matters. The maximum potential amount of future payments that Regions could be required to make under the indemnification is indeterminable due to the indefinite term of some of the obligations. However, Regions expects the majority of ongoing legal matters to be resolved within approximately three years.
60
June 30
2012 December 31
2011 (In millions)
Unused commitments to extend credit $ 36,020 $ 37,872 Standby letters of credit 2,016 2,084 Commercial letters of credit 42 33 Liabilities associated with standby letters of credit 37 37 Assets associated with standby letters of credit 36 36 Reserve for unfunded credit commitments 91 78

Table of Contents
As of the Closing Date, the fair value of the indemnification obligation, which includes defense costs and unasserted claims, was approximately $385 million, of which approximately $256 million was recognized as a reduction to the gain on sale of Morgan Keegan. In accordance with the Stock Purchase Agreement, indemnified losses will be reimbursed once they exceed the dollar value of the reserves related to pending or threatened claims or contingent liabilities that were on the books of Morgan Keegan as of the Closing Date. The fair value was determined through the use of a present value calculation that takes into account the future cash flows that a market participant would expect to receive from holding the indemnification liability as an asset. Regions performed a probability-weighted cash flow analysis and discounted the result at a credit-adjusted risk free rate. The fair value of the indemnification liability includes amounts that Regions had previously determined meet the definition of probable and reasonably estimable. To date, Regions has not incurred any material costs as a result of the indemnification obligation and no amounts have been reimbursed to Raymond James. As of June 30, 2012, the carrying value of the indemnification obligation is approximately $383 million.
LEGAL CONTINGENCIES
Regions and its affiliates are subject to loss contingencies related to litigation and claims arising in the ordinary course of business. Regions evaluates these contingencies based on information currently available, including advice of counsel and assessment of available insurance coverage. Regions establishes accruals for litigation and claims when a loss contingency is considered probable and the related amount is reasonably estimable. Any accruals are periodically reviewed and may be adjusted as circumstances change. In addition, as previously discussed, Regions has agreed to indemnify Raymond James for all legal matters resulting from pre-closing activities in conjunction with the sale of Morgan Keegan and has recorded an indemnification obligation at fair value in the amount of $383 million as of June 30, 2012. When able to do so, Regions also estimates loss contingencies for possible litigation and claims, whether or not there is an accrued probable loss. Where Regions is able to estimate such possible losses, Regions estimates that it is reasonably possible it could incur losses, in excess of amounts accrued, in an aggregate amount up to approximately $200 million as of June 30, 2012, with it also being reasonably possible that Regions could incur no losses in excess of amounts accrued. The legal contingencies included in the reasonably possible estimate include those that are subject to the indemnification agreement with Raymond James.
Assessments of litigation and claims exposures are difficult due to many factors that involve inherent unpredictability. Those factors include the following: the varying stages of the proceedings, particularly in the early stages; unspecified damages; damages other than compensatory such as punitive damages; multiple defendants and jurisdictions; whether discovery has begun or not; and whether the claim involves a class-action. There are numerous factors that result in a greater degree of complexity in class-action lawsuits as compared to other types of litigation. Due to the many intricacies involved in class-action lawsuits at the early stages of these matters, obtaining clarity on a reasonable estimate is difficult which may call into question its reliability. As a result of some of these factors, Regions may be unable to estimate reasonably possible losses with respect to some of the matters disclosed below. The aggregated estimated amount provided above therefore may not include an estimate for every matter disclosed below.
Beginning in December 2007, Regions and certain of its affiliates have been named in class-action lawsuits filed in federal and state courts on behalf of investors who purchased shares of certain Regions Morgan Keegan Select Funds (the “Funds”) and shareholders of Regions. The Funds were formerly managed by Regions Investment Management, Inc. (“Regions Investment Management”). Regions Investment Management no longer manages these Funds, which were transferred to Hyperion Brookfield Asset Management in 2008. Certain of the Funds have since been terminated by Hyperion. The complaints contain various allegations, including claims that the Funds and the defendants misrepresented or failed to disclose material facts relating to the activities of the Funds. Plaintiffs have requested equitable relief and unspecified monetary damages. These cases are in various stages and no classes have been certified. Settlement discussions are ongoing in certain cases. Certain of the shareholders in these Funds and other interested parties have entered into arbitration proceedings and individual civil claims, in lieu of participating in the class actions. These lawsuits and proceedings are subject to the indemnification agreement with Raymond James discussed above.
61

Table of Contents
In July 2009, the Securities and Exchange Commission (“SEC”) filed a complaint in U.S. District Court for the Northern District of Georgia against Morgan Keegan alleging violations of the federal securities laws in connection with auction rate securities (“ARS”) that Morgan Keegan underwrote, marketed and sold. The SEC sought an injunction against Morgan Keegan for violations of the antifraud provisions of the federal securities laws, as well as disgorgement, financial penalties and other equitable relief for customers, including repurchase by Morgan Keegan of all ARS that it sold prior to March 20, 2008. Beginning in February 2009, Morgan Keegan commenced a voluntary program to repurchase ARS that it underwrote and sold to the firm’s customers, and extended that repurchase program on October 1, 2009 to include ARS that were sold by Morgan Keegan to its customers but were underwritten by other firms. On June 29, 2011, Morgan Keegan announced the final phase of the repurchase program to include ARS issued by Jefferson County, Alabama that were sold by Morgan Keegan to its customers. On June 28, 2011, the Court issued a summary judgment in favor of Morgan Keegan in this case. The SEC has appealed that judgment. On May 2, 2012, the Eleventh Circuit granted the SEC’s appeal and remanded the case to the District Court. Previously on July 21, 2009, the Alabama Securities Commission issued a “Show Cause” order to Morgan Keegan arising out of the ARS matter that is the subject of the SEC complaint described above. The order requires Morgan Keegan to show cause why its registration as a broker-dealer should not be suspended or revoked in the State of Alabama and also why it should not be subject to disgorgement, repurchasing all ARS sold to Alabama residents and payment of costs and penalties. These matters are subject to the indemnification agreement with Raymond James.
In October 2010, a purported class-action lawsuit was filed by Regions’ stockholders in the U.S. District Court for the Northern District of Alabama against Regions and certain former officers of Regions. The lawsuit alleges violations of the federal securities laws, including allegations that statements that were materially false and misleading were included in filings made with the SEC. The plaintiffs have requested equitable relief and unspecified monetary damages. On June 7, 2011, the trial court denied Regions’ motion to dismiss this lawsuit. On June 14, 2012, the trial court granted class certification. Regions is seeking appellate review of the class certification. Discovery is ongoing.
Regions has received inquiries and subpoenas from government authorities primarily concerning accounting matters from 2009 and earlier periods that also have been the subject of the civil litigation mentioned above. Regions is cooperating in providing responses to these inquiries and subpoenas. In addition, the Board of Directors is conducting investigations regarding certain of the matters raised in these inquiries and subpoenas.
In December 2009, Regions and certain current and former directors and officers were named in a consolidated shareholder derivative action filed in Jefferson County, Alabama. The complaint alleges mismanagement, waste of corporate assets, breach of fiduciary duty and unjust enrichment relating to bonuses and other benefits received by executive management. Plaintiffs have requested equitable relief and unspecified monetary damages. A motion to dismiss all claims is pending.
In September 2009, Regions was named as a defendant in a purported class-action lawsuit filed by customers of Regions Bank in the U.S. District Court for the Northern District of Georgia challenging the manner in which non-sufficient funds and overdraft fees were charged and the policies related to posting order. The case was transferred to multidistrict litigation in the U.S. District Court for the Southern District of Florida, and in May 2010 an order to compel arbitration was denied. Regions appealed the denial and on April 29, 2011, the Eleventh Circuit Court of Appeals vacated the denial and remanded the case to the district court for reconsideration of Regions’ motion to compel arbitration. On September 1, 2011, the trial court again denied Regions’ motion to compel arbitration. Regions again appealed the denial to the Eleventh Circuit, which on March 5, 2012 granted the motion and ordered that the case be dismissed. Plaintiffs filed a motion for rehearing by the full court of appeals, which was denied on April 30, 2012. Another purported class action alleging these claims was filed in the U.S. District Court for the Northern District of Georgia in January 2012. The case is still early in its development and no class has been certified. Plaintiffs in these cases have requested equitable relief and unspecified monetary damages.
62
Table of Contents
In July 2006, Morgan Keegan and a former Morgan Keegan analyst were named as defendants in a lawsuit filed by a Canadian insurance and financial services company and its American subsidiary in the Circuit Court of Morris County, New Jersey. Plaintiffs made claims under a civil Racketeer Influenced and Corrupt Organizations (“RICO”) statute, for commercial disparagement, tortious interference with contractual relationships, tortious interference with prospective economic advantage and common law conspiracy. Plaintiffs allege that defendants engaged in a multi-year conspiracy to publish and disseminate false and defamatory information about plaintiffs to improperly drive down plaintiff stock price, so that others could profit from short positions. Plaintiffs allege that defendants’ actions damaged their reputations and harmed their business relationships. Plaintiffs allege a number of categories of damages they sustained, including lost insurance business, lost financings and increased financing costs, increased audit fees and directors and officers insurance premiums and lost acquisitions, and have requested monetary damages. These claims were never considered to be meritorious, but some of the claims survived an extended motion practice and discovery process. On May 11, 2012, the trial court ruled that New York law applied to plaintiff’ s RICO claims, therefore the claims are not subject to treble damages. On June 27, 2012, the trial court dismissed plaintiffs’ tortious interference with prospective relations claim, but allowed other claims to go forward. Both the May 11 and June 27 orders are currently being re-heard. A jury trial is currently set to begin on September 10, 2012. These matters are subject to the indemnification agreement with Raymond James.
While the final outcome of litigation and claims exposures is inherently unpredictable, management is currently of the opinion that the outcome of pending and threatened litigation would not have a material effect on Regions’ business, consolidated financial position, results of operations or cash flows as a whole. However, in the event of unexpected future developments, it is reasonably possible that an adverse outcome in any of the matters discussed above could be material to Regions’ business, consolidated financial position, results of operations or cash flows for any particular reporting period of occurrence.
NOTE 16—Recent Accounting Pronouncements
In October 2010, the FASB issued guidance addressing the diversity in practice regarding which costs related to the acquisition or renewal of insurance contracts qualify as deferred acquisition costs for insurance entities. This update amends guidance related to financial services by requiring that costs incurred with the acquisition and renewal of insurance contracts be capitalized as deferred acquisition costs. Incremental direct costs, portions of employees’ compensation associated with time spent acquiring contracts, and other costs directly relating to the advertising, underwriting, issuing and processing of insurance policies are costs that should be capitalized to the extent that they would not have otherwise been incurred had the contracts not been successfully acquired. The amended guidance is effective for fiscal years, and for interim periods within those fiscal years, beginning after December 15, 2011. Regions adopted this guidance beginning with first quarter 2012 financial reporting. The guidance did not have a material impact upon adoption.
In January 2011, the FASB issued accounting guidance temporarily deferring the effective date for when public-entity creditors are required to provide new disclosures, which were addressed in previously issued guidance regarding receivables, for TDRs. The deferred effective date coincides with the effective date for the clarified guidance about what constitutes a TDR for creditors, which was issued in April 2011 by the FASB. Regions applied the clarified definition to all loans modified after January 1, 2011, and reported any newly identified TDRs beginning with the September 30, 2011 financial reporting. The adoption of the standard did not materially impact the overall level of the allowance for loan losses. The guidance also required new disclosures for TDRs, which were also implemented prospectively, beginning with September 30, 2011 financial reporting. See Note 4 for the newly-required disclosures.
In April 2011, the FASB issued accounting guidance to reconsider effective control for repurchase agreements. The guidance will simplify the accounting for financial assets transferred under repurchase agreements and similar arrangements, and will increase the number of transfers to be accounted for as secured borrowings, as opposed to sales. The amended guidance is effective prospectively for new transfers and existing
63

Table of Contents
transactions modified as of the first interim or annual period beginning on or after December 15, 2011. Regions periodically accesses funding markets through sales of securities with agreements to repurchase. Repurchase agreements are also offered through a commercial banking sweep product as a short-term investment opportunity for customers. All such arrangements are considered typical of the banking and brokerage industries and are accounted for as borrowings. Regions adopted this guidance beginning with first quarter 2012 financial reporting; there was no material impact upon adoption.
In May 2011, the FASB issued new guidance to create a uniform framework for applying fair value measurement principles for companies around the world. The new guidance eliminates differences between GAAP and International Financial Reporting Standards (“IFRS”) issued by the International Accounting Standards Board. New disclosures required by the guidance include: quantitative information about the significant unobservable inputs used for Level 3 measurements; a qualitative discussion about the sensitivity of recurring Level 3 measurements to changes in the unobservable inputs disclosed, including the interrelationship between inputs; and a description of the company’s valuation processes. This guidance is effective for interim and annual periods beginning after December 15, 2011. Regions adopted this guidance beginning with first quarter 2012 financial reporting. See Note 13 for the newly-required disclosures.
In June 2011, the FASB issued new guidance amending disclosure requirements for the presentation of comprehensive income. The guidance eliminates the option to present components of other comprehensive income (“OCI”) as part of the statement of changes in shareholders’ equity. All changes in OCI will be presented either in a single continuous statement of comprehensive income or in two separate but consecutive financial statements. The guidance does not change the items that must be reported in OCI. This guidance is effective for fiscal years and interim reporting periods within those years beginning after December 15, 2011. Regions adopted this new guidance with first quarter 2012 financial reporting. In January 2012, the FASB issued accounting guidance that indefinitely defers the effective date of certain provisions concerning the presentation of comprehensive income. The guidance indefinitely defers the requirement to present reclassification adjustments by component in both the statement where net income is presented and the statement where other comprehensive income is presented. See the consolidated statements of comprehensive income for further details.
In September 2011, the FASB issued accounting guidance related to goodwill impairment testing. The guidance allows entities to elect to first perform qualitative tests to determine the likelihood that the entity’s fair value is less than its carrying value. If it is determined that it is more likely that the fair value of a reporting entity is less than its carrying amount, the entity would then perform the first step of the goodwill impairment test. The guidance refers to several factors to consider when performing the qualitative analysis, including: macroeconomic factors, industry factors, and entity-specific factors. The guidance is effective prospectively for annual and interim goodwill impairment tests performed for fiscal years beginning after December 15, 2011. The amended guidance did not have a material impact upon adoption.
In December 2011, the FASB issued new accounting guidance that eliminates offsetting of financial instruments disclosure differences between GAAP and IFRS. New disclosures will be required for recognized financial instruments, such as derivatives, repurchase agreements, and reverse repurchase agreements, that are either (1) offset on the balance sheet in accordance with the FASB’s offsetting guidance or (2) subject to an enforceable master netting arrangement or similar agreement, regardless of whether they are offset in accordance with the FASB’s offsetting guidance. The objective of the new disclosure requirements is to enable users of the financial statements to evaluate the effect or potential effect of netting arrangements on an entity’s financial position, including the effect or potential effect of rights of setoff associated with certain financial instruments and derivative instruments. This amended guidance will be applied retrospectively and is effective for fiscal years, and interim periods within those years, beginning on or after January 1, 2013. The adoption of this guidance, which involves disclosure only, will not impact Regions’ consolidated financial position, results of operations, or cash flows.
64

Table of Contents
INTRODUCTION
The following discussion and analysis is part of Regions Financial Corporation’s (“Regions” or the “Company”) Quarterly Report on Form 10-Q to the Securities and Exchange Commission (“SEC”) and updates Regions’ Form 10-K for the year ended December 31, 2011, which was previously filed with the SEC. This financial information is presented to aid in understanding Regions’ financial position and results of operations and should be read together with the financial information contained in the Form 10-K. Certain prior period amounts presented in this discussion and analysis have been reclassified to conform to current period classifications, except as otherwise noted. The emphasis of this discussion will be on the three and six months ended June 30, 2012 compared to the three and six months ended June 30, 2011 for the statement of income. For the balance sheet, the emphasis of this discussion will be the balances as of June 30, 2012 compared to December 31, 2011.
This discussion and analysis contains statements that may be considered “forward-looking statements” as defined in the Private Securities Litigation Reform Act of 1995. See pages 3 and 4 for additional information regarding forward-looking statements.
CORPORATE PROFILE
Regions is a financial holding company headquartered in Birmingham, Alabama, which operates throughout the South, Midwest and Texas. Regions provides traditional commercial, retail and mortgage banking services, as well as other financial services in the fields of asset management, trust, insurance and other specialty financing.
Regions conducts its banking operations through Regions Bank, an Alabama chartered commercial bank that is a member of the Federal Reserve System. At June 30, 2012, Regions operated 1,719 total branch outlets in Alabama, Arkansas, Florida, Georgia, Illinois, Indiana, Iowa, Kentucky, Louisiana, Mississippi, Missouri, North Carolina, South Carolina, Tennessee, Texas and Virginia. Regions provides full-line insurance brokerage services primarily through Regions Insurance, Inc.
On January 11, 2012, Regions entered into a stock purchase agreement to sell Morgan Keegan & Company, Inc. (“Morgan Keegan”) and related affiliates to Raymond James Financial, Inc. (“Raymond James”). The sale closed on April 2, 2012. Regions Investment Management and Regions Trust were not included in the sale. See Note 2 to the consolidated financial statements for further discussion.
Regions’ profitability, like that of many other financial institutions, is dependent on its ability to generate revenue from net interest income and non-interest income sources. Net interest income is the difference between the interest income Regions receives on interest-earning assets, such as loans and securities, and the interest expense Regions pays on interest-bearing liabilities, principally deposits and borrowings. Regions’ net interest income is impacted by the size and mix of its balance sheet components and the interest rate spread between interest earned on its assets and interest paid on its liabilities. Non-interest income includes fees from service charges on deposit accounts, capital markets and trust activities, mortgage servicing and secondary marketing, insurance activities, and other customer services which Regions provides. Results of operations are also affected by the provision for loan losses and non-interest expenses, such as salaries and employee benefits, occupancy, professional fees, Federal Deposit Insurance Corporation (“FDIC”) insurance, other real estate owned and other operating expenses, as well as income taxes.
Economic conditions, competition, new legislation and related rules impacting regulation of the financial services industry, and the monetary and fiscal policies of the Federal government significantly affect most financial institutions, including Regions. Lending and deposit activities and fee income generation are influenced by levels of business spending and investment, consumer income, consumer spending and savings, capital market activities, and competition among financial institutions, as well as customer preferences, interest rate conditions and prevailing market rates on competing products in Regions’ market areas.
65
Item 2. Management’s Discussion and Analysis of Financial Condition and Results of Operations
Table of Contents
Regions’ business strategy has been and continues to be focused on providing a competitive mix of products and services, delivering quality customer service and maintaining multiple distribution channels, including a branch distribution network with offices in convenient locations.
SECOND QUARTER HIGHLIGHTS
Regions reported net income available to common shareholders of $284 million, or $0.20 per diluted share, in the second quarter of 2012 compared to net income available to common shareholders of $55 million, or $0.04 per diluted share, in the second quarter of 2011. A decline in the second quarter 2012 provision for loan losses was the primary driver of the improvement in results from continuing operations from the prior year period.
Net charge-offs totaled $265 million, or an annualized 1.39 percent of average loans, in the second quarter of 2012, compared to $548 million, or an annualized 2.71 percent for the second quarter of 2011. Net charge-offs were lower across most major loan categories when comparing the 2012 period to the prior year period, except for the consumer credit card portfolio which was purchased in the second quarter of 2011.
The provision for loan losses totaled $26 million in the second quarter of 2012 compared to $398 million during the second quarter of 2011. Credit metrics, including net charge-offs, non-accrual, criticized and classified loan balances, and inflows of non-performing loans showed continued improving trends.
The allowance for loan losses at June 30, 2012 was 3.01 percent of total loans, net of unearned income, compared to 3.54 percent at December 31, 2011. Total non-performing assets were $2.3 billion at June 30, 2012, compared to $3.0 billion at December 31, 2011.
For the second quarter of 2012, net interest income (taxable-equivalent basis) from continuing operations totaled $850 million compared to $864 million in the second quarter of 2011. The net interest margin (taxable-equivalent basis) was 3.16 percent in the second quarter of 2012 compared to 3.07 percent in the second quarter of 2011. Overall declines in loan balances and average earning assets were offset by continued improvements in deposit costs, which was 0.32 percent for the second quarter of 2012, as compared to 0.53 percent for the second quarter of 2011.
Non-interest income from continuing operations for the second quarter of 2012 was $507 million, compared to $543 million for the second quarter of 2011. Service charges on deposit accounts decreased $75 million in the second quarter of 2012 compared to the corresponding 2011 period, reflecting the impact of recently-enacted debit card legislation and the impact of Regulation E. During the second quarter of 2012, service charges on deposit accounts were also impacted by approximately $24 million due to the establishment of a reserve for customer refunds resulting from a change in the Company’s non-sufficient funds policy. Additionally, securities gains declined from $24 million in the second quarter of 2011 to $12 million in the second quarter of 2012. These decreases were partially offset by a $40 million increase in mortgage income, as customers took advantage of the opportunity to refinance under the extended Home Affordable Refinance Program, or HARP II.
Total non-interest expense from continuing operations was $842 million in the second quarter of 2012, a $114 million decrease from the second quarter of 2011. The 2011 period included $77 million in branch consolidation and property and equipment charges driven primarily by Regions’ decision to exit approximately 40 branches. Gains on loans held for sale, lower other real estate owned expense and lower FDIC premiums also contributed to the year-over-year decrease. These items were partially offset by higher salaries and benefits expense.
During the second quarter of 2012, the Company completed the previously-announced sale of Morgan Keegan and related affiliates to Raymond James. Also during the quarter, the Company repurchased $3.5 billion of Series A preferred stock previously issued to the U.S. Treasury. The Series A repurchase drove accelerated accretion of the unamortized discount on the shares, which reduced net income available to common
66

Table of Contents
shareholders by $71 million. In early May of 2012, Regions repurchased a warrant to purchase 48.3 million common shares at $10.88 per share from the U.S. Treasury Department for $45 million. The warrant repurchase resulted in a reduction to additional paid-in capital and did not impact results of operations.
A discussion of activity within discontinued operations is included at the end of the Management’s Discussion and Analysis section of this report.
TOTAL ASSETS
Regions’ total assets at June 30, 2012 were $122.3 billion, compared to $127.1 billion at December 31, 2011. The decrease in total assets from year-end 2011 resulted mainly from a decrease in loans, as well as a decrease in other assets, which was driven by settlements of securities sales. Also, a decrease in interest-bearing deposits in other banks was largely offset by an increase in securities available for sale. The decrease in total assets was also driven by a reduction in trading assets, which resulted from the closing of the sale of Morgan Keegan (see Note 2 “Discontinued Operations” to the consolidated financial statements).
SECURITIES
The following table details the carrying values of securities, including both available for sale and held to maturity:
Table 1—Securities
Securities totaled $27.2 billion at June 30, 2012, an increase of $2.8 billion from year-end 2011 levels. During the first six months of 2012, Regions received proceeds of approximately $1.4 billion primarily from sales of available for sale agency mortgage-backed securities. Proceeds from these sales were reinvested in similar securities. Additionally, during the second quarter of 2012, Regions added approximately $2.2 billion of residential agency mortgage-backed securities and $1.0 billion of high quality investment grade corporate bonds. The net purchases of agency mortgage-backed securities are an offset to the Company’s strategy to sell the majority of agency eligible residential first mortgages at origination, and the corporate bonds increase diversification in the portfolio with an attractive risk and return profile.
Securities available for sale, which comprise nearly all of the securities portfolio, are an important tool used to manage interest rate sensitivity and provide a primary source of liquidity for the Company (see MARKET RISK—INTEREST RATE RISK and LIQUIDITY).
67
June 30
2012 December 31
2011 (In millions)
U.S. Treasury securities $ 53 $ 102 Federal agency securities 238 150 Obligations of states and political subdivisions 14 36 Mortgage-backed securities
Residential agency 23,502 22,184 Residential non-agency 14 16 Commercial agency 514 326 Commercial non-agency 637 321
Corporate and other debt securities 1,551 537 Equity securities 722 815
$ 27,245 $ 24,487

Table of Contents
LOANS
At June 30, 2012, loans represented 71 percent of Regions’ interest-earning assets compared to 70 percent at December 31, 2011. The following table presents the distribution of Regions’ loan portfolio by portfolio segment and class, net of unearned income:
Table 2—Loan Portfolio
Loans, net of unearned income, totaled $76.2 billion at June 30, 2012, a decrease of $1.4 billion from year-end 2011 levels. Continued runoff of balances related to investor real estate, residential first mortgage and home equity products was the primary contributor to the decrease. The decrease was partially offset by an increase in commercial and industrial loans and indirect loans.
Commercial —The commercial portfolio segment includes commercial and industrial loans to commercial customers for use in normal business operations to finance working capital needs, equipment purchases and other expansion projects. Commercial also includes owner-occupied commercial real estate loans to operating businesses, which are loans for long-term financing of land and buildings, and are repaid by cash flow generated by business operations. Owner-occupied construction loans are made to commercial businesses for the development of land or construction of a building where the repayment is derived from revenues generated from the business of the borrower.
Investor Real Estate —Loans for real estate development are repaid through cash flow related to the operation, sale or refinance of the property. This portfolio segment includes extensions of credit to real estate developers or investors where repayment is dependent on the sale of real estate or income generated from the real estate collateral. A portion of Regions’ investor real estate portfolio segment is comprised of loans secured by residential product types (land, single-family and condominium loans) within Regions’ markets. Additionally, this category includes loans made to finance income-producing properties such as apartment buildings, office and industrial buildings, and retail shopping centers.
Residential First Mortgage —Residential first mortgage loans represent loans to consumers to finance a residence. These loans are typically financed over a 15 to 30 year term and, in most cases, are extended to borrowers to finance their primary residence.
68
June 30
2012 December 31
2011 (In millions, net of unearned income)
Commercial and industrial $ 25,990 $ 24,522 Commercial real estate mortgage—owner-occupied 10,626 11,166 Commercial real estate construction—owner-occupied 261 337
Total commercial 36,877 36,025 Commercial investor real estate mortgage 8,598 9,702 Commercial investor real estate construction 849 1,025
Total investor real estate 9,447 10,727 Residential first mortgage 13,394 13,784 Home equity 12,321 13,021 Indirect 2,060 1,848 Consumer credit card 922 987 Other consumer 1,181 1,202
Total consumer 29,878 30,842
$ 76,202 $ 77,594

Table of Contents
Home Equity— Home equity lending includes both home equity loans and lines of credit. This type of lending, which is secured by a first or second mortgage on the borrower’s residence, allows customers to borrow against the equity in their home. Substantially all of this portfolio was originated through Regions’ branch network.
Indirect— Indirect lending, which is lending initiated through third-party business partners, is largely comprised of loans made through automotive dealerships. Beginning in late 2010, the Company re-entered the indirect auto lending business.
Consumer Credit Card— During the second quarter of 2011, Regions completed the purchase of approximately 500,000 existing Regions-branded consumer credit card accounts from FIA Card Services. The products are primarily open-ended variable interest rate consumer credit card loans.
Other Consumer —Other consumer loans include direct consumer installment loans, overdrafts and other revolving loans.
CREDIT QUALITY
Certain of Regions’ loans have been particularly vulnerable to weak economic conditions over the past several years, mainly investor real estate loans and home equity products (particularly Florida second lien). These loan types have a higher risk of non-collection than other loans. The following sections provide further detail on these portfolios.
INVESTOR REAL ESTATE
The following table presents the portions of the investor real estate portfolio segment as of June 30, 2012:
Table 3—Investor Real Estate Analysis
69
Mortgage Construction Total Percent of Total on Non-accrual Status
(Dollars in billions)
Multi -family $ 1.9 $ 0.2 $ 2.1 0.6 % Retail 1.9 — 1.9 1.8 Office 1.8 — 1.8 0.4 Industrial 0.8 — 0.8 0.4 Land 0.6 0.2 0.8 1.8 Single family 0.4 0.4 0.8 1.0 Hotel 0.6 — 0.6 0.3 Other 0.5 — 0.5 0.6 Condominium 0.1 — 0.1 0.2
$ 8.6 $ 0.8 $ 9.4 7.1 %
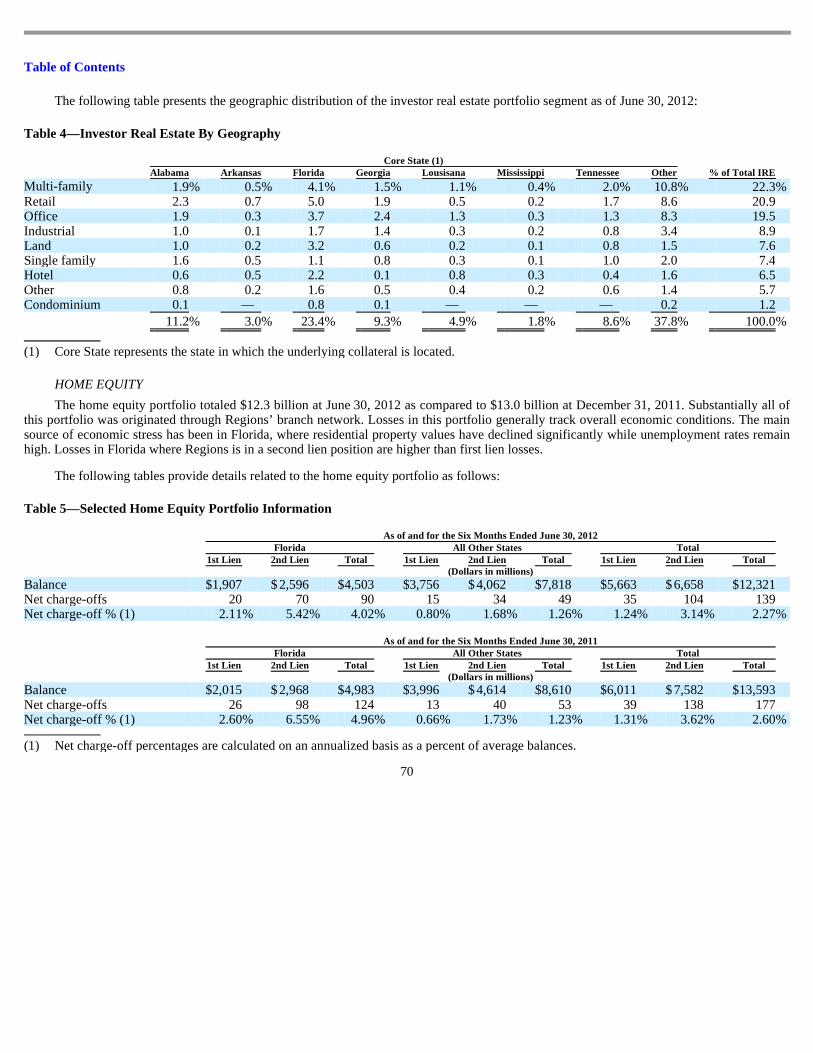
Table of Contents
The following table presents the geographic distribution of the investor real estate portfolio segment as of June 30, 2012:
Table 4—Investor Real Estate By Geography
HOME EQUITY
The home equity portfolio totaled $12.3 billion at June 30, 2012 as compared to $13.0 billion at December 31, 2011. Substantially all of this portfolio was originated through Regions’ branch network. Losses in this portfolio generally track overall economic conditions. The main source of economic stress has been in Florida, where residential property values have declined significantly while unemployment rates remain high. Losses in Florida where Regions is in a second lien position are higher than first lien losses.
The following tables provide details related to the home equity portfolio as follows:
Table 5—Selected Home Equity Portfolio Information
70
Core State (1) % of Total IRE Alabama Arkansas Florida Georgia Lousisana Mississippi Tennessee Other
Multi-family 1.9 % 0.5 % 4.1 % 1.5 % 1.1 % 0.4 % 2.0 % 10.8 % 22.3 % Retail 2.3 0.7 5.0 1.9 0.5 0.2 1.7 8.6 20.9 Office 1.9 0.3 3.7 2.4 1.3 0.3 1.3 8.3 19.5 Industrial 1.0 0.1 1.7 1.4 0.3 0.2 0.8 3.4 8.9 Land 1.0 0.2 3.2 0.6 0.2 0.1 0.8 1.5 7.6 Single family 1.6 0.5 1.1 0.8 0.3 0.1 1.0 2.0 7.4 Hotel 0.6 0.5 2.2 0.1 0.8 0.3 0.4 1.6 6.5 Other 0.8 0.2 1.6 0.5 0.4 0.2 0.6 1.4 5.7 Condominium 0.1 — 0.8 0.1 — — — 0.2 1.2
11.2 % 3.0 % 23.4 % 9.3 % 4.9 % 1.8 % 8.6 % 37.8 % 100.0 %
(1) Core State represents the state in which the underlying collateral is located.
As of and for the Six Months Ended June 30, 2012 Florida All Other States Total 1st Lien 2nd Lien Total 1st Lien 2nd Lien Total 1st Lien 2nd Lien Total (Dollars in millions)
Balance $ 1,907 $ 2,596 $ 4,503 $ 3,756 $ 4,062 $ 7,818 $ 5,663 $ 6,658 $ 12,321 Net charge-offs 20 70 90 15 34 49 35 104 139 Net charge-off % (1) 2.11 % 5.42 % 4.02 % 0.80 % 1.68 % 1.26 % 1.24 % 3.14 % 2.27 %
As of and for the Six Months Ended June 30, 2011 Florida All Other States Total 1st Lien 2nd Lien Total 1st Lien 2nd Lien Total 1st Lien 2nd Lien Total (Dollars in millions)
Balance $ 2,015 $ 2,968 $ 4,983 $ 3,996 $ 4,614 $ 8,610 $ 6,011 $ 7,582 $ 13,593 Net charge-offs 26 98 124 13 40 53 39 138 177 Net charge-off % (1) 2.60 % 6.55 % 4.96 % 0.66 % 1.73 % 1.23 % 1.31 % 3.62 % 2.60 % (1) Net charge-off percentages are calculated on an annualized basis as a percent of average balances.

Table of Contents
Net charge-offs were an annualized 2.27 percent of home equity loans for the first six months of 2012 compared to an annualized 2.60 percent through the first six months of 2011. Losses in Florida-based credits remained at elevated levels, but the related net charge-off percentage decreased to 4.03 percent for the six months ended June 30, 2012 from 4.96 percent for the six months ended June 30, 2011. Home equity losses have decreased due to improvement in unemployment rates which, although high, are lower than prior levels. Tighter underwriting standards in place since 2008 and stabilizing home values in Florida also are contributing to this improvement.
Of the $12.3 billion home equity portfolio at June 30, 2012, approximately $11.0 billion were home equity lines of credit and $1.3 billion were closed-end home equity loans (primarily originated as amortizing loans). Beginning in May 2009, new home equity lines of credit have a 10-year draw period and a 10-year repayment period. Previously, the home equity lines of credit had a 20 year term with a balloon payment upon maturity or a 5-year draw period with a balloon payment upon maturity. The term “balloon payment” means there are no principal payments required until the balloon payment is due for interest-only lines of credit. As of June 30, 2012, none of Regions’ home equity lines of credit have converted to mandatory amortization under the contractual terms. The majority of home equity lines of credit will either mature with a balloon payment or convert to amortizing status after fiscal year 2020.
Of the $11.0 billion of home equity lines of credit as of June 30, 2012, approximately 90 percent require monthly interest-only payments while the remaining approximately 10 percent require a payment equal to 1.5 percent of the outstanding balance, which would include some principal repayment. As of June 30, 2012, approximately 29 percent of borrowers were only paying the minimum amount due on the home equity line. In addition, approximately 55 percent of the home equity lines of credit balances have the option to amortize either all or a portion of their balance. As of June 30, 2012, approximately $465 million of the home equity line of credit balances have elected this option.
Regions’ home equity loans have higher default and delinquency rates than home equity lines of credit, which is expected at origination of the loans, due to more stringent underwriting guidelines for a line of credit versus a loan reflecting the nature of the credit being extended. Therefore, home equity loans secured with a second lien are expected to and do have higher delinquency and loss rates than home equity lines of credit with a second lien. In the current environment, second liens in areas experiencing declines in home prices since origination, such as Florida, perform similar to an unsecured portfolio.
Regions is unable to track payment status on first liens held by another institution, including payment status related to loan modifications. When Regions’ second lien position becomes delinquent, an attempt is made to contact the first lien holder and inquire as to the payment status of the first lien. However, Regions does not continuously monitor the payment status of the first lien position. Short sale offers and settlement agreements are often received by the home equity junior lien holders well before the loan balance reaches the delinquency threshold for charge-off consideration, potentially resulting in a full balance payoff/charge-off. Regions is presently monitoring the status of all first lien position loans that the Company owns or services and has a second lien, and is taking appropriate action when delinquent. Regions is presently testing a means to monitor non-Regions-serviced first liens, and expects to enhance monitoring ability by the end of 2012.
OTHER CONSUMER CREDIT QUALITY DATA
The Company calculates an estimate of the current value of property secured as collateral for both home equity and residential first mortgage lending products (“current LTV”). The estimate is based on home price indices compiled by the Federal Housing Finance Agency (“FHFA”). The FHFA data indicates trends for Metropolitan Statistical Areas (“MSAs”). Regions uses the FHFA valuation trends from the MSAs in the Company’s footprint in its estimate. The trend data is applied to the loan portfolios taking into account the age of the most recent valuation and geographic area.
71

Table of Contents
The following table presents current LTV data for components of the residential mortgage and home equity classes of the consumer portfolio segment. Current LTV data for the remaining loans in the portfolio is not available, primarily because some of the loans are serviced by others. Data may also not be available due to mergers and systems integrations. The amounts in the table represent the entire loan balance. For purposes of the table below, if the loan balance exceeds the current estimated collateral, the entire balance is included in the “Above 100%”category, regardless of the amount of collateral available to partially offset the shortfall.
Table 6—Estimated Current Loan to Value Ranges
Regions qualitatively considers factors such as periodic updates of FICO scores, unemployment, home prices, and geography as credit quality indicators for consumer loans. FICO scores are obtained at origination as part of Regions’ formal underwriting process. Refreshed FICO scores are obtained by the Company quarterly for all revolving accounts and home equity lines of credit and semi-annually for all other consumer loans. Regions considers FICO scores less than 620 to be indicative of higher credit risk and obtains additional collateral in most of these instances. The following table presents estimated current FICO score data for components of classes of the consumer portfolio segment. Current FICO data is not available for the remaining loans in the portfolio for various reasons; for example, if customers do not use sufficient credit, an updated score may not be available.
Table 7—Estimated Current FICO Score Ranges
72
June 30, 2012 December 31, 2011
Residential
First Mortgage Home Equity
Residential First Mortgage
Home Equity
(In millions)
Estimated current loan to value:
Above 100% $ 1,853 $ 2,136 $ 1,854 $ 2,157 80% - 100% 2,879 2,397 2,951 2,568 Below 80% 8,206 6,771 8,483 7,180 Data not available 456 1,017 496 1,116
$ 13,394 $ 12,321 $ 13,784 $ 13,021
June 30, 2012
Residential First
Mortgage Home Equity Indirect
Consumer Credit Card
Other Consumer
(In millions)
Below 620 $ 1,337 $ 841 $ 185 $ 50 $ 111 620 - 680 1,300 1,151 255 120 134 681 - 720 1,541 1,531 263 220 153 Above 720 8,568 7,989 822 528 372 Data not available 648 809 535 4 411
$ 13,394 $ 12,321 $ 2,060 $ 922 $ 1,181
December 31, 2011
Residential First
Mortgage Home Equity Indirect
Consumer Credit Card
Other Consumer
(In millions)
Below 620 $ 1,449 $ 873 $ 191 $ 56 $ 106 620 - 680 1,286 1,157 281 129 142 681 - 720 1,557 1,559 274 236 162 Above 720 8,441 8,576 858 561 383 Data not available 1,051 856 244 5 409
$ 13,784 $ 13,021 $ 1,848 $ 987 $ 1,202

Table of Contents
ALLOWANCE FOR CREDIT LOSSES
The allowance for credit losses represents management’s estimate of credit losses inherent in the loan and credit commitment portfolios as of period end. The allowance for credit losses consists of two components: the allowance for loan and lease losses and the reserve for unfunded credit commitments. Management’s assessment of the appropriateness of the allowance for credit losses is based on a combination of both of these components. Regions determines its allowance for credit losses in accordance with applicable accounting literature as well as regulatory guidance related to receivables and contingencies. Binding unfunded credit commitments include items such as letters of credit, financial guarantees and binding unfunded loan commitments. Additional discussion of the methodology used to calculate the allowance for credit losses is included in Note 6 “Allowance for Credit Losses” to the consolidated financial statements in the 2011 Annual Report on Form 10-K, as well as related discussion in Management’s Discussion and Analysis.
The allowance for loan losses totaled $2.3 billion at June 30, 2012 and $2.7 billion at December 31, 2011. The allowance for loan losses as a percentage of net loans was 3.01 percent at June 30, 2012 and 3.54 percent on December 31, 2011. The reserve for unfunded credit commitments was $91 million at June 30, 2012 compared to $78 million at December 31, 2011. Net charge-offs as a percentage of average loans (annualized) were 1.56 percent and 2.54 percent in the first six months of 2012 and 2011, respectively. Net charge-off ratios were lower across most categories, period over period, except for the consumer credit card portfolio, which was purchased during the second quarter of 2011. In addition to lower levels of charge-offs, credit quality metrics have improved during 2012, including lower levels of non-accrual, criticized and classified loans, and lower inflows of non-accrual loans. The provision for loan losses totaled $26 million in the second quarter of 2012 compared to $398 million during the second quarter of 2011. The provision for loan losses totaled $143 million for the six months ended June 30, 2012 compared to $880 million for the first six months of 2011. Net charge-offs exceeded the provision for loan losses for the second quarter and first half of 2012, primarily resulting from the continued improving credit metrics.
Management considers the current level of allowance for credit losses appropriate to absorb losses inherent in the loan portfolio and unfunded commitments. Management’s determination of the appropriateness of the allowance for credit losses requires the use of judgments and estimations that may change in the future. Changes in the factors used by management to determine the appropriateness of the allowance or the availability of new information could cause the allowance for credit losses to be increased or decreased in future periods. In addition, bank regulatory agencies, as part of their examination process, may require changes in the level of the allowance based on their judgments and estimates.
Given continued economic pressures and anticipated slow recovery, management expects that net loan charge-offs in 2012 will be less than 2011 but remain elevated. Economic trends such as real estate valuations, interest rates and unemployment will impact the future levels of net charge-offs and provision. Details regarding the allowance and net charge-offs, including an analysis of activity from the previous year’s totals, are included in Table 8 “Allowance for Credit Losses.”
73
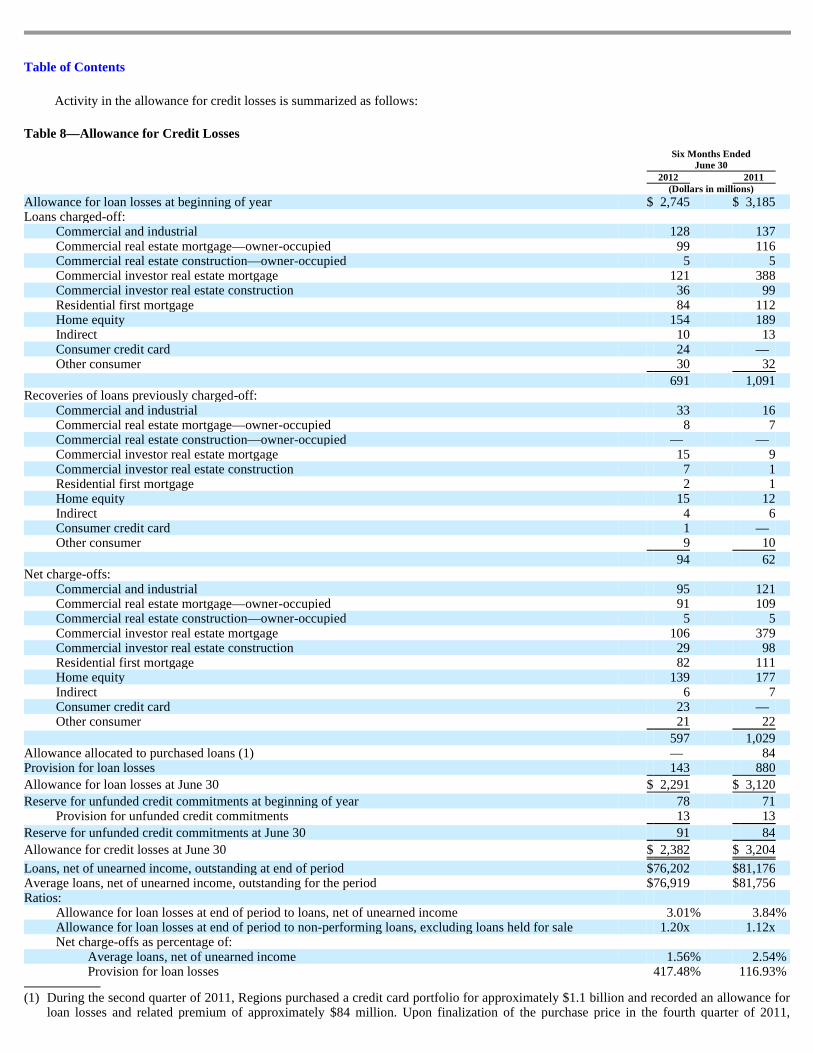
Table of Contents
Activity in the allowance for credit losses is summarized as follows:
Table 8—Allowance for Credit Losses
Six Months Ended
June 30 2012 2011 (Dollars in millions)
Allowance for loan losses at beginning of year $ 2,745 $ 3,185 Loans charged-off:
Commercial and industrial 128 137 Commercial real estate mortgage—owner-occupied 99 116 Commercial real estate construction—owner-occupied 5 5 Commercial investor real estate mortgage 121 388 Commercial investor real estate construction 36 99 Residential first mortgage 84 112 Home equity 154 189 Indirect 10 13 Consumer credit card 24 — Other consumer 30 32
691 1,091 Recoveries of loans previously charged-off:
Commercial and industrial 33 16 Commercial real estate mortgage—owner-occupied 8 7 Commercial real estate construction—owner-occupied — — Commercial investor real estate mortgage 15 9 Commercial investor real estate construction 7 1 Residential first mortgage 2 1 Home equity 15 12 Indirect 4 6 Consumer credit card 1 — Other consumer 9 10
94 62 Net charge-offs:
Commercial and industrial 95 121 Commercial real estate mortgage—owner-occupied 91 109 Commercial real estate construction—owner-occupied 5 5 Commercial investor real estate mortgage 106 379 Commercial investor real estate construction 29 98 Residential first mortgage 82 111 Home equity 139 177 Indirect 6 7 Consumer credit card 23 — Other consumer 21 22
597 1,029 Allowance allocated to purchased loans (1) — 84 Provision for loan losses 143 880
Allowance for loan losses at June 30 $ 2,291 $ 3,120
Reserve for unfunded credit commitments at beginning of year 78 71 Provision for unfunded credit commitments 13 13
Reserve for unfunded credit commitments at June 30 91 84
Allowance for credit losses at June 30 $ 2,382 $ 3,204
Loans, net of unearned income, outstanding at end of period $ 76,202 $ 81,176 Average loans, net of unearned income, outstanding for the period $ 76,919 $ 81,756 Ratios:
Allowance for loan losses at end of period to loans, net of unearned income 3.01 % 3.84 % Allowance for loan losses at end of period to non-performing loans, excluding loans held for sale 1.20x 1.12x Net charge-offs as percentage of:
Average loans, net of unearned income 1.56 % 2.54 % Provision for loan losses 417.48 % 116.93 %
(1) During the second quarter of 2011, Regions purchased a credit card portfolio for approximately $1.1 billion and recorded an allowance for
loan losses and related premium of approximately $84 million. Upon finalization of the purchase price in the fourth quarter of 2011,

74
Regions reclassified the $84 million allowance and premium. The impact of these reclassification entries was not material to the financial results in any of the quarters of 2011.

Table of Contents
Residential first mortgage, home equity and other consumer TDRs are consumer loans modified under the Customer Assistance Program. Commercial and investor real estate loan modifications are not the result of a formal program, but represent situations where modification was offered as a workout alternative. As a result of clarified accounting literature that was effective for third quarter 2011, renewals of classified commercial and investor real estate loans are refutably considered to be TDRs, even if no reduction in interest rate is offered, because the existing terms are considered to be below market. More detailed information is included in Note 4 to the consolidated financial statements. The following table summarizes TDRs for the periods ending June 30, 2012 and December 31, 2011:
Table 9—Troubled Debt Restructurings
Note: All loans listed in the table above are considered impaired under applicable accounting literature.
Refer to Note 6 of the 2011 Annual Report on Form 10-K for detailed information related to identification of TDRs, including the impact of new accounting literature adopted during 2011. Refer to Note 4 to the consolidated financial statements in this Form 10-Q for information on loans modified in a TDR during the second quarter and first six months of 2012 and the financial impact of those modifications, as well as loans which defaulted during the second quarter and first six months of 2012 which were modified in a TDR during the previous twelve months.
75
June 30, 2012 December 31, 2011
Loan
Balance Allowance for Credit Losses
Loan Balance
Allowance for Credit Losses
(In millions)
Accruing:
Commercial $ 521 $ 80 $ 492 $ 89 Investor real estate 1,025 229 995 254 Residential first mortgage 958 141 900 132 Home equity 413 38 407 57 Other consumer 49 1 56 1
$ 2,966 $ 489 $ 2,850 $ 533
Non-accrual status or 90 days past due:
Commercial $ 315 $ 79 $ 353 $ 100 Investor real estate 474 129 473 146 Residential first mortgage 198 29 210 31 Home equity 30 3 33 5 Other consumer 1 — — —
1,018 240 1,069 282
$ 3,984 $ 729 $ 3,919 $ 815

Table of Contents
NON-PERFORMING ASSETS
Non-performing assets are summarized as follows:
Table 10—Non-Performing Assets
Non-performing assets totaled $2.3 billion at June 30, 2012, compared to $3.0 billion at December 31, 2011. Foreclosed properties, a subset of non-performing assets, totaled $214 million and $296 million at June 30, 2012 and December 31, 2011, respectively. The decrease in non-performing assets and foreclosed properties during 2012 reflects the Company’s efforts to work through problem assets and reduce the riskiest exposures.
76
June 30
2012 December 31
2011 (Dollars in millions)
Non-performing loans:
Commercial and industrial $ 366 $ 457 Commercial real estate mortgage—owner-occupied 504 590 Commercial real estate construction—owner-occupied 20 25
Total commercial 890 1,072 Commercial investor real estate mortgage 599 734 Commercial investor real estate construction 74 180
Total investor real estate 673 914 Residential first mortgage 229 250 Home equity 123 136
Total non-performing loans, excluding loans held for sale 1,915 2,372 Non-performing loans held for sale 202 328
Total non-performing loans (1) 2,117 2,700 Foreclosed properties 214 296
Total non-performing assets (1) $ 2,331 $ 2,996
Accruing loans 90 days past due:
Commercial and industrial $ 5 $ 28 Commercial real estate mortgage—owner-occupied 9 9 Commercial real estate construction—owner-occupied — —
Total commercial 14 37 Commercial investor real estate mortgage 16 13 Commercial investor real estate construction — —
Total investor real estate 16 13 Residential first mortgage 281 284 Home equity 74 93 Indirect 2 2 Consumer credit card 13 14 Other consumer 3 4
$ 403 $ 447
Restructured loans not included in the categories above $ 2,966 $ 2,850
Non-performing loans (1) to loans and non-performing loans held for sale 2.77 % 3.47 % Non-performing assets (1) to loans, foreclosed properties and non-performing loans held for sale 3.04 % 3.83 % (1) Exclusive of accruing loans 90 days past due

Table of Contents
Based on current expectations for the economy, management anticipates non-performing assets to decrease during the remainder of 2012, but remain elevated. Economic trends such as real estate valuations, interest rates and unemployment, as well as the level of disposition activity, will impact the future level of non-performing assets.
Loans past due 90 days or more and still accruing were $403 million at June 30, 2012, a decrease from $447 million at December 31, 2011.
At June 30, 2012, Regions had approximately $300-$400 million of potential problem commercial and investor real estate loans that were not included in non-accrual loans, but for which management had concerns as to the ability of such borrowers to comply with their present loan repayment terms. This is a likely estimate of the amount of commercial and investor real estate loans that may migrate to non-accrual status in the next quarter.
In order to arrive at the estimate of potential problem loans, personnel from geographic regions forecast certain larger dollar loans that may potentially be downgraded to non-accrual at a future time, depending on the occurrence of future events. These personnel consider a variety of factors, including the borrower’s capacity and willingness to meet the contractual repayment terms, make principal curtailments or provide additional collateral when necessary, and provide current and complete financial information including global cash flows, contingent liabilities and sources of liquidity. A probability weighting is assigned to the listing of loans due to the inherent level of uncertainty related to potential actions that a borrower or guarantor may take to prevent the loan from reaching problem status. Regions assigns the probability weighting based on an assessment of the likelihood that the necessary actions required to prevent problem loan status will occur. Additionally, for other loans (for example, smaller dollar loans), a factor based on trends and experience is applied to determine the estimate of potential future downgrades. Because of the inherent uncertainty in forecasting future events, the estimate of potential problem loans ultimately represents the estimated aggregate dollar amounts of loans as opposed to an individual listing of loans.
The majority of the loans on which the potential problem loan estimate is based are considered substandard accrual. Detailed disclosures for substandard accrual loans (as well as other credit quality metrics) are included in Note 4 to the consolidated financial statements.
77

Table of Contents
The following table provides an analysis of non-accrual loans (excluding loans held for sale) by portfolio segment for the six months ended June 30, 2012:
Table 11—Analysis of Non-Accrual Loans
LOANS HELD FOR SALE
Loans held for sale totaled $1.2 billion at June 30, 2012, consisting primarily of $950 million of residential real estate mortgage loans and $202 million of non-performing investor real estate loans. At December 31, 2011, loans held for sale also totaled $1.2 billion, consisting primarily of $844 million of residential real estate mortgage loans and $328 million of non-performing investor real estate loans. The level of residential real estate mortgage loans held for sale fluctuates depending on the timing of origination and sale to third parties.
The following table provides an analysis of non-performing loans held for sale for the six months ended June 30, 2012 and 2011:
Table 12—Non-performing Loans Held For Sale
78
Non-Accrual Loans, Excluding Loans Held for Sale
Six Months Ended June 30, 2012
Commercial Investor
Real Estate Consumer (1) Total (In millions)
Balance at beginning of year $ 1,072 $ 914 $ 386 $ 2,372 Additions 380 339 (23 ) 696 Net payments/other activity (175 ) (169 ) — (344 ) Return to accrual (67 ) (121 ) — (188 ) Charge-offs on non-accrual loans (2) (223 ) (149 ) (4 ) (376 ) Tranfers to held for sale (3) (65 ) (102 ) (3 ) (170 ) Transfers to foreclosed properties (28 ) (18 ) — (46 ) Sales (4 ) (21 ) (4 ) (29 )
Balance at end of period $ 890 $ 673 $ 352 $ 1,915
(1) All net activity within the consumer portfolio segment other than charge-offs, sales and transfers to held for sale is included as a single
net number within the additions line, due to the relative immateriality of consumer non-accrual loans. (2) Includes charge-offs on loans on non-accrual status and charge-offs taken upon sale and transfer of non-accrual loans to held for sale. (3) Transfers to held for sale are shown net of charge-offs of $92 million recorded upon transfer.
Six Months Ended
June 30 2012 2011 (In millions)
Balance at beginning of period $ 328 $ 304 Transfers in 170 364 Sales (248 ) (247 ) Writedowns (8 ) (7 ) Loans moved from held for sale/other activity (12 ) (13 ) Transfers to foreclosed properties (28 ) (20 )
Balance at end of period $ 202 $ 381

Table of Contents
ALL OTHER INTEREST-EARNING ASSETS
All other interest-earning assets, which are primarily comprised of interest-bearing deposits in other banks, trading account assets, and other interest-earning assets, decreased approximately $4.7 billion from year-end 2011 to June 30, 2012, primarily due to decreases in interest-bearing deposits in other banks being utilized for debt service and repurchase of the Series A preferred shares, as well as decreases in trading account assets as a result of the sale of Morgan Keegan.
GOODWILL
Goodwill totaled $4.8 billion at both June 30, 2012 and December 31, 2011 and is allocated to each of Regions’ reportable segments (each a reporting unit), at which level goodwill is tested for impairment on an annual basis or more often if events and circumstances indicate impairment may exist (refer to Note 1 “Significant Accounting Policies” to the 2011 consolidated financial statements filed on Form 10-K for the year ended December 31, 2011 for further discussion of when Regions tests goodwill for impairment).
A test of goodwill for impairment consists of two steps. In Step One, the fair value of the reporting unit is compared to its carrying amount, including goodwill. To the extent that the estimated fair value of the reporting unit exceeds the carrying value, impairment is not indicated and no further testing is required. Conversely, if the estimated fair value of the reporting unit is below its carrying amount, Step Two must be performed. Step Two consists of determining the implied estimated fair value of goodwill, which is the net difference between the after-tax valuation adjustments of assets and liabilities and the valuation adjustment to equity (from Step One) of the reporting unit. Adverse changes in the economic environment, declining operations of the reporting unit, or other factors could result in a decline in the estimated implied fair value of goodwill. If the estimated implied fair value is less than the carrying amount, a loss would be recognized to reduce the carrying amount to the estimated implied fair value.
The estimated fair value of the reporting unit is determined using two approaches and several key assumptions. Regions utilizes the capital asset pricing model (“CAPM”) in order to derive the base discount rate. The inputs to the CAPM include the 20-year risk-free rate, 5-year beta for a select peer set, and the market risk premium based on published data. Once the output of the CAPM is determined, a size premium is added (also based on a published source) as well as a company-specific risk premium, which is an estimate determined by the Company and meant to compensate for the risk inherent in the future cash flow projections and inherent differences (such as business model and market perception of risk) between Regions and the peer set.
In estimating future cash flows, a balance sheet as of the test date and a statement of income for the last twelve months of activity for the reporting unit are compiled. From that point, future balance sheets and statements of income are projected based on the inputs. Cash flows are based on expected future capitalization requirements due to balance sheet growth and anticipated changes in regulatory capital requirements. The baseline cash flows utilized in all models correspond to the most recent internal forecasts and/or budgets that range from 1 to 5 years. These internal forecasts are based on inputs developed in the Company’s capital planning processes.
Refer to Note 6 “Goodwill”, for further discussion of these approaches and related assumptions. The fair values of assets and liabilities are determined using an exit price concept. Refer to the discussion of fair value in Note 1 “Summary of Significant Accounting Policies” to the 2011 annual report on form 10-K for discussions of the exit price concept and the determination of fair values of financial assets and liabilities.
Throughout 2009 and 2010 in the Banking/Treasury reporting unit, the credit quality of Regions’ loan portfolio declined, which contributed to increased losses as well as elevated non-performing loan levels. Accordingly, Regions performed tests of goodwill for impairment during each quarter of 2010 and during the second, third and fourth quarters of 2009 in a manner consistent with the annual test conducted in the fourth quarter of 2008. Regions continued to perform its goodwill impairment tests during the four quarters of 2011 and
79

Table of Contents
the first and second quarters of 2012, in a manner consistent with the tests conducted in prior periods, primarily due to the Company’s market capitalization remaining below book value. The long-term fair value of equity was determined using both income and market approaches (discussed in Note 6 “Goodwill”). The results of these calculations for the second quarter of 2012 indicated that the estimated fair value of the Banking/Treasury reporting unit was less than the carrying amount. At May 31, 2012, the carrying amount and estimated fair value of the Banking/Treasury reporting unit were $14.1 billion and $11.7 billion, respectively, while the carrying amount of goodwill for the reporting unit was $4.7 billion. Therefore, Step Two of the goodwill impairment test was performed. In Step Two, the fair values of the reporting unit’s assets and liabilities, including the loan portfolio, intangible assets, time deposits, debt, and other assets and liabilities were calculated. Once the estimated fair values were determined, deferred tax adjustments were calculated as applicable. For the Banking/Treasury reporting unit, the after-tax effects of the Step Two adjustments, which were primarily write-downs of assets to fair value, exceeded any reductions in the value of common equity determined in Step One; accordingly the calculation of implied goodwill exceeded its carrying amount. Therefore, the results were no impairment for the Banking/Treasury reporting unit, whose implied fair value of goodwill exceeded its carrying amount by approximately 39 percent as of May 31, 2012 compared to approximately 48 percent as of February 29, 2012.
The table below summarizes the discount rate used in the goodwill impairment tests of the Banking/Treasury reporting unit for the reporting periods indicated:
Regions’ capital plan, which was required under the Federal Reserve’s Comprehensive Capital Analysis and Review (“CCAR”), was submitted in early January of 2012. The Federal Reserve responded with no objections to the capital actions set forth in the capital plan on March 13, 2012. Shortly thereafter, Regions issued and sold 153 million shares of its common stock, par value $0.01 per share, at a price to the public of $5.90 per share, a premium above the closing price. The Company received approximately $875 million in net proceeds from the offering after underwriting discounts and commissions and other expenses. Additionally, in connection with the CCAR on March 13, 2012, the Federal Reserve disclosed its projections of pro-forma, post stress pre-provision income and losses and pro-forma, post stress capital ratios under the Federal Reserve’s “Supervisory Stress Scenario” for the nineteen institutions, including Regions, that participated in the 2011 CCAR. Regions exceeded the minimum required capital level over the entire review period through year-end 2013. Regions also received an upgrade to its debt ratings from Standard & Poor’s rating agency on March 15, 2012. These positive factors led to a reduction in the discount rate applied to the Banking/Treasury reporting unit during the first quarter of 2012. The discount rate remained the same as first quarter for second quarter 2012.
Specific factors as of the date of filing the financial statements that could negatively impact the assumptions used in assessing goodwill for impairment include: a protracted decline in the Company’s market capitalization; disparities in the level of fair value changes in net assets compared to equity; adverse business trends resulting from litigation and/or regulatory actions; higher loan losses; lengthened forecasts of higher unemployment relative to pre-crisis levels beyond 2013; future increased minimum regulatory capital requirements above current thresholds (refer to Note 13 “Regulatory Capital Requirements and Restrictions” of the consolidated financial statements included in the Annual Report on Form 10-K for the year ended December 31, 2011 for a discussion of current minimum regulatory requirements); future federal rules and regulations resulting from the Dodd-Frank Act; and/or a protraction in the current low level of interest rates significantly beyond 2014.
80
2nd Quarter
2012 1st Quarter
2012 4th Quarter
2011 3rd Quarter
2011 2nd Quarter
2011
Discount Rate 14 % 14 % 15 % 15 % 15 %
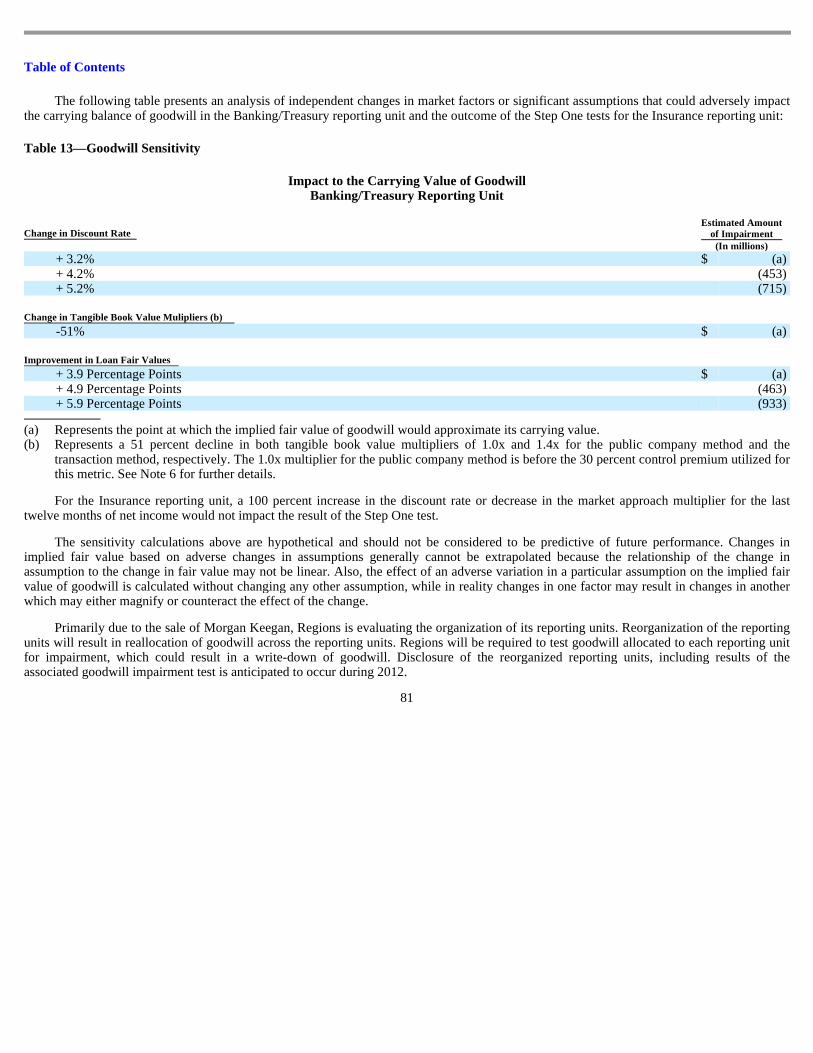
Table of Contents
The following table presents an analysis of independent changes in market factors or significant assumptions that could adversely impact the carrying balance of goodwill in the Banking/Treasury reporting unit and the outcome of the Step One tests for the Insurance reporting unit:
Table 13—Goodwill Sensitivity
Impact to the Carrying Value of Goodwill Banking/Treasury Reporting Unit
For the Insurance reporting unit, a 100 percent increase in the discount rate or decrease in the market approach multiplier for the last twelve months of net income would not impact the result of the Step One test.
The sensitivity calculations above are hypothetical and should not be considered to be predictive of future performance. Changes in implied fair value based on adverse changes in assumptions generally cannot be extrapolated because the relationship of the change in assumption to the change in fair value may not be linear. Also, the effect of an adverse variation in a particular assumption on the implied fair value of goodwill is calculated without changing any other assumption, while in reality changes in one factor may result in changes in another which may either magnify or counteract the effect of the change.
Primarily due to the sale of Morgan Keegan, Regions is evaluating the organization of its reporting units. Reorganization of the reporting units will result in reallocation of goodwill across the reporting units. Regions will be required to test goodwill allocated to each reporting unit for impairment, which could result in a write-down of goodwill. Disclosure of the reorganized reporting units, including results of the associated goodwill impairment test is anticipated to occur during 2012.
81
Change in Discount Rate Estimated Amount
of Impairment (In millions)
+ 3.2% $ (a ) + 4.2% (453 ) + 5.2% (715 )
Change in Tangible Book Value Mulipliers (b)
-51% $ (a )
Improvement in Loan Fair Values
+ 3.9 Percentage Points $ (a ) + 4.9 Percentage Points (463 ) + 5.9 Percentage Points (933 )
(a) Represents the point at which the implied fair value of goodwill would approximate its carrying value. (b) Represents a 51 percent decline in both tangible book value multipliers of 1.0x and 1.4x for the public company method and the
transaction method, respectively. The 1.0x multiplier for the public company method is before the 30 percent control premium utilized for this metric. See Note 6 for further details.

Table of Contents
FORECLOSED PROPERTIES
Other real estate and certain other assets acquired in foreclosure are reported at the lower of the investment in the loan or fair value of the property less estimated costs to sell. The following table summarizes foreclosed property activity for the six months ended June 30, 2012 and 2011:
Table 14—Foreclosed Properties
Note: Approximately 72 percent and 74 percent of the ending balances at June 30, 2012 and June 30, 2011, respectively, relate to properties transferred into foreclosed properties during the previous twelve months.
Valuation adjustments are primarily recorded in other non-interest expense; adjustments are also recorded as a charge to the allowance for loan losses if incurred within 60 days after the date of transfer from loans. Valuation adjustments are primarily post-foreclosure write-downs that are a result of continued declining property values based on updated appraisals or other indications of value, such as offers to purchase. Foreclosed property sold represents the net book value of the properties sold.
OTHER ASSETS
Other assets decreased $1.5 billion from December 31, 2011 to $7.2 billion as of June 30, 2012, primarily due to the net settlements of securities sales. Lower derivative balances also contributed to the decrease.
DEPOSITS
Regions competes with other banking and financial services companies for a share of the deposit market. Regions’ ability to compete in the deposit market depends heavily on the pricing of its deposits and how effectively the Company meets customers’ needs. Regions employs various means to meet those needs and enhance competitiveness, such as providing a high level of customer service, competitive pricing and providing convenient branch locations for its customers. Regions also serves customers through providing centralized, high-quality banking services and alternative product delivery channels such as internet banking.
82
Six Months Ended
June 30 2012 2011 (In millions)
Balance at beginning of period $ 296 $ 454 Transfer from loans 174 318 Valuation adjustments (38 ) (81 ) Foreclosed property sold (216 ) (252 ) Payments and other (2 ) (2 )
(82 ) (17 )
Balance at end of period $ 214 $ 437
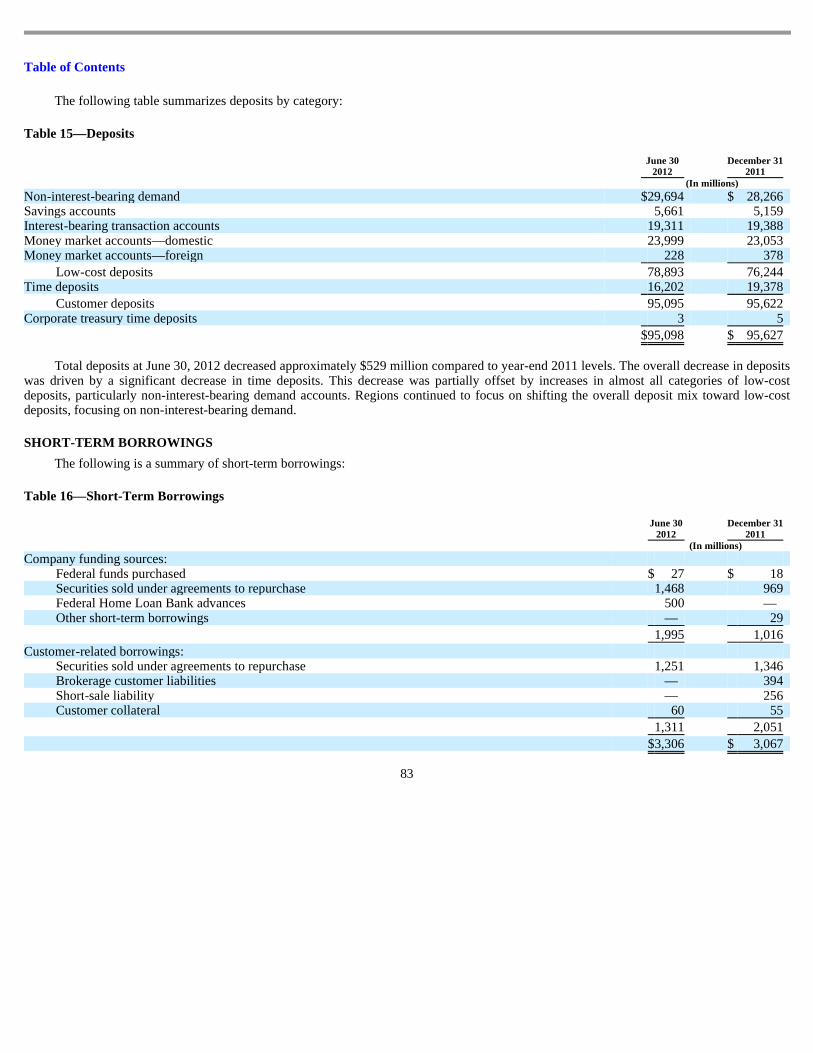
Table of Contents
The following table summarizes deposits by category:
Table 15—Deposits
Total deposits at June 30, 2012 decreased approximately $529 million compared to year-end 2011 levels. The overall decrease in deposits was driven by a significant decrease in time deposits. This decrease was partially offset by increases in almost all categories of low-cost deposits, particularly non-interest-bearing demand accounts. Regions continued to focus on shifting the overall deposit mix toward low-cost deposits, focusing on non-interest-bearing demand.
SHORT-TERM BORROWINGS
The following is a summary of short-term borrowings:
Table 16—Short-Term Borrowings
83
June 30
2012 December 31
2011 (In millions)
Non-interest-bearing demand $ 29,694 $ 28,266 Savings accounts 5,661 5,159 Interest-bearing transaction accounts 19,311 19,388 Money market accounts—domestic 23,999 23,053 Money market accounts—foreign 228 378
Low-cost deposits 78,893 76,244 Time deposits 16,202 19,378
Customer deposits 95,095 95,622 Corporate treasury time deposits 3 5
$ 95,098 $ 95,627
June 30
2012 December 31
2011 (In millions)
Company funding sources:
Federal funds purchased $ 27 $ 18 Securities sold under agreements to repurchase 1,468 969 Federal Home Loan Bank advances 500 — Other short-term borrowings — 29
1,995 1,016
Customer-related borrowings:
Securities sold under agreements to repurchase 1,251 1,346 Brokerage customer liabilities — 394 Short-sale liability — 256 Customer collateral 60 55
1,311 2,051
$ 3,306 $ 3,067

Table of Contents
COMPANY FUNDING SOURCES
Federal funds purchased and securities sold under agreements to repurchase used for funding purposes totaled $1.5 billion at June 30, 2012 compared to $987 million at December 31, 2011. The level of these borrowings can fluctuate significantly on a day-to-day basis, depending on funding needs and which sources of funds are used to satisfy those needs. All such arrangements are considered typical of the banking and brokerage industries and are accounted for as borrowings.
As another source of funding, the Company utilizes short-term borrowings through the issuance of Federal Home Loan Bank (“FHLB”) advances. FHLB borrowings are used to satisfy short-term borrowing requirements and can also fluctuate between periods. There were $500 million in short-term FHLB borrowings outstanding at June 30, 2012 and none at December 31, 2011. See the “Liquidity” section for further detail of Regions’ borrowing capacity with the FHLB.
Other short-term borrowings were related to Morgan Keegan and included borrowings under lines of credit that Morgan Keegan maintained with unaffiliated banks. As of June 30, 2012, there were no other short-term borrowings related to Morgan Keegan outstanding as a result of the sale of Morgan Keegan on April 2, 2012, compared to $29 million December 31, 2011.
Selected data for short-term borrowings used for funding purposes is presented below:
The negative weighted-average interest rates on securities sold under agreements to repurchase during the second quarter of 2012 were the result of, in part, Regions’ entering into reverse-repurchase agreements. There are times when financing costs associated with these transactions are lower than typical repurchase agreement rates as a result of a supply and demand imbalance in particular collateral. Since short-term repurchase agreement rates were close to zero during 2012, the supply and demand imbalance related to securities that Regions owned led to negative financing rates.
CUSTOMER-RELATED BORROWINGS
Short-term borrowings that are the result of customer activity related to investment opportunities or brokerage interests totaled $1.3 billion at June 30, 2012, compared to $2.1 billion at December 31, 2011. The decrease between periods was due to decreases in brokerage customer liabilities and short-sale liabilities as a result of the sale of Morgan Keegan on April 2, 2012.
Repurchase agreements are also offered as commercial banking products as short-term investment opportunities for customers. At the end of each business day, customer balances are swept into the agreement
84
Three Months Ended
June 30 2012 2011 (Dollars in millions)
Federal funds purchased:
Balance at quarter-end $ 27 $ 16 Average outstanding (based on average daily balances) 19 19 Maximum amount outstanding at any month-end during the quarter 27 20 Weighted-average interest rate at quarter-end 0.1 % 0.1 % Weighted-average interest rate on amounts outstanding during the quarter (based on average daily
balances) 0.1 % 0.1 % Securities sold under agreements to repurchase:
Balance at quarter-end $ 1,468 $ 198 Average outstanding (based on average daily balances) 540 285 Maximum amount outstanding at any month-end during the quarter 1,468 331 Weighted-average interest rate at quarter-end 0.0 % 0.3 % Weighted-average interest rate on amounts outstanding during the quarter (based on average daily
balances) (0.1 )% 0.2 %
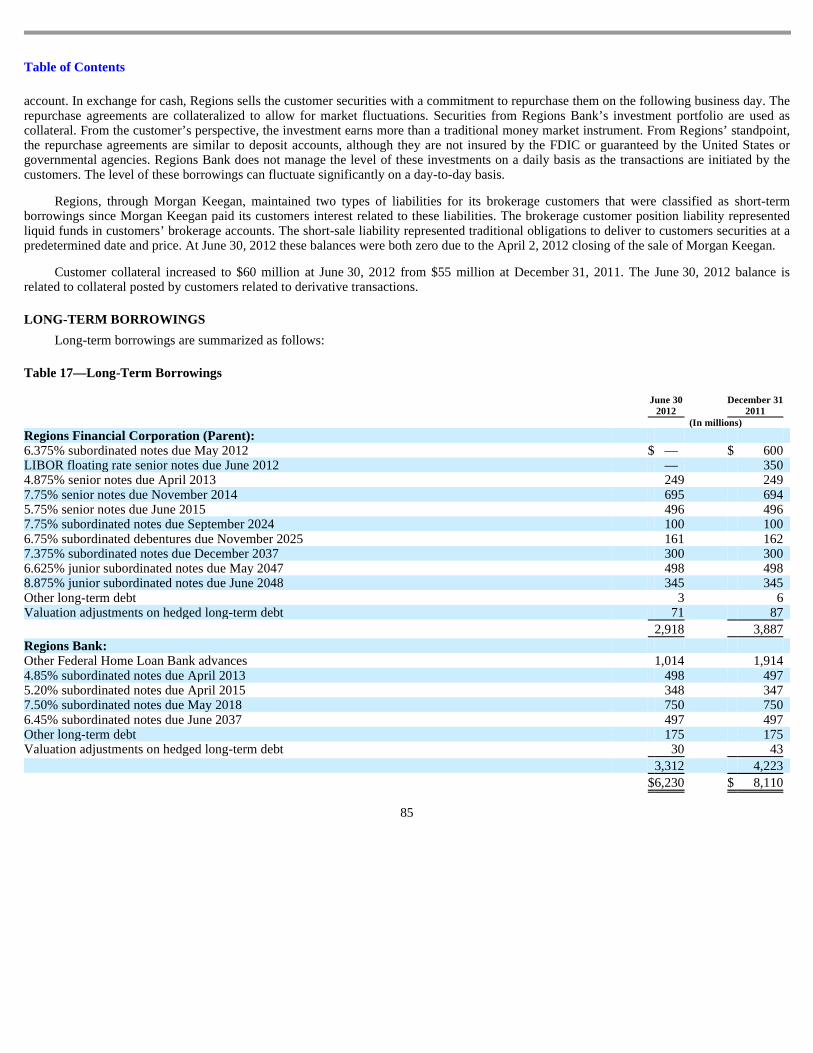
Table of Contents
account. In exchange for cash, Regions sells the customer securities with a commitment to repurchase them on the following business day. The repurchase agreements are collateralized to allow for market fluctuations. Securities from Regions Bank’s investment portfolio are used as collateral. From the customer’s perspective, the investment earns more than a traditional money market instrument. From Regions’ standpoint, the repurchase agreements are similar to deposit accounts, although they are not insured by the FDIC or guaranteed by the United States or governmental agencies. Regions Bank does not manage the level of these investments on a daily basis as the transactions are initiated by the customers. The level of these borrowings can fluctuate significantly on a day-to-day basis.
Regions, through Morgan Keegan, maintained two types of liabilities for its brokerage customers that were classified as short-term borrowings since Morgan Keegan paid its customers interest related to these liabilities. The brokerage customer position liability represented liquid funds in customers’ brokerage accounts. The short-sale liability represented traditional obligations to deliver to customers securities at a predetermined date and price. At June 30, 2012 these balances were both zero due to the April 2, 2012 closing of the sale of Morgan Keegan.
Customer collateral increased to $60 million at June 30, 2012 from $55 million at December 31, 2011. The June 30, 2012 balance is related to collateral posted by customers related to derivative transactions.
LONG-TERM BORROWINGS
Long-term borrowings are summarized as follows:
Table 17—Long-Term Borrowings
85
June 30
2012 December 31
2011 (In millions)
Regions Financial Corporation (Parent):
6.375% subordinated notes due May 2012 $ — $ 600 LIBOR floating rate senior notes due June 2012 — 350 4.875% senior notes due April 2013 249 249 7.75% senior notes due November 2014 695 694 5.75% senior notes due June 2015 496 496 7.75% subordinated notes due September 2024 100 100 6.75% subordinated debentures due November 2025 161 162 7.375% subordinated notes due December 2037 300 300 6.625% junior subordinated notes due May 2047 498 498 8.875% junior subordinated notes due June 2048 345 345 Other long-term debt 3 6 Valuation adjustments on hedged long-term debt 71 87
2,918 3,887
Regions Bank:
Other Federal Home Loan Bank advances 1,014 1,914 4.85% subordinated notes due April 2013 498 497 5.20% subordinated notes due April 2015 348 347 7.50% subordinated notes due May 2018 750 750 6.45% subordinated notes due June 2037 497 497 Other long-term debt 175 175 Valuation adjustments on hedged long-term debt 30 43
3,312 4,223
$ 6,230 $ 8,110
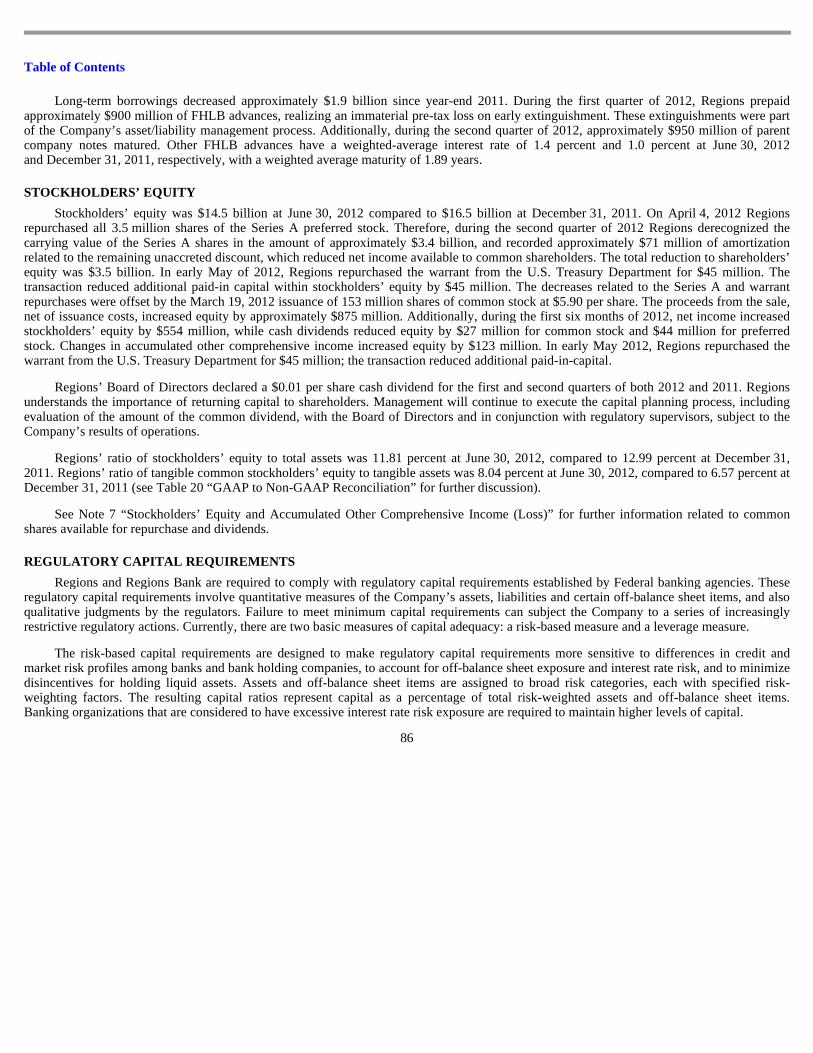
Table of Contents
Long-term borrowings decreased approximately $1.9 billion since year-end 2011. During the first quarter of 2012, Regions prepaid approximately $900 million of FHLB advances, realizing an immaterial pre-tax loss on early extinguishment. These extinguishments were part of the Company’s asset/liability management process. Additionally, during the second quarter of 2012, approximately $950 million of parent company notes matured. Other FHLB advances have a weighted-average interest rate of 1.4 percent and 1.0 percent at June 30, 2012 and December 31, 2011, respectively, with a weighted average maturity of 1.89 years.
STOCKHOLDERS’ EQUITY
Stockholders’ equity was $14.5 billion at June 30, 2012 compared to $16.5 billion at December 31, 2011. On April 4, 2012 Regions repurchased all 3.5 million shares of the Series A preferred stock. Therefore, during the second quarter of 2012 Regions derecognized the carrying value of the Series A shares in the amount of approximately $3.4 billion, and recorded approximately $71 million of amortization related to the remaining unaccreted discount, which reduced net income available to common shareholders. The total reduction to shareholders’equity was $3.5 billion. In early May of 2012, Regions repurchased the warrant from the U.S. Treasury Department for $45 million. The transaction reduced additional paid-in capital within stockholders’ equity by $45 million. The decreases related to the Series A and warrant repurchases were offset by the March 19, 2012 issuance of 153 million shares of common stock at $5.90 per share. The proceeds from the sale, net of issuance costs, increased equity by approximately $875 million. Additionally, during the first six months of 2012, net income increased stockholders’ equity by $554 million, while cash dividends reduced equity by $27 million for common stock and $44 million for preferred stock. Changes in accumulated other comprehensive income increased equity by $123 million. In early May 2012, Regions repurchased the warrant from the U.S. Treasury Department for $45 million; the transaction reduced additional paid-in-capital.
Regions’ Board of Directors declared a $0.01 per share cash dividend for the first and second quarters of both 2012 and 2011. Regions understands the importance of returning capital to shareholders. Management will continue to execute the capital planning process, including evaluation of the amount of the common dividend, with the Board of Directors and in conjunction with regulatory supervisors, subject to the Company’s results of operations.
Regions’ ratio of stockholders’ equity to total assets was 11.81 percent at June 30, 2012, compared to 12.99 percent at December 31, 2011. Regions’ ratio of tangible common stockholders’ equity to tangible assets was 8.04 percent at June 30, 2012, compared to 6.57 percent at December 31, 2011 (see Table 20 “GAAP to Non-GAAP Reconciliation” for further discussion).
See Note 7 “Stockholders’ Equity and Accumulated Other Comprehensive Income (Loss)” for further information related to common shares available for repurchase and dividends.
REGULATORY CAPITAL REQUIREMENTS
Regions and Regions Bank are required to comply with regulatory capital requirements established by Federal banking agencies. These regulatory capital requirements involve quantitative measures of the Company’s assets, liabilities and certain off-balance sheet items, and also qualitative judgments by the regulators. Failure to meet minimum capital requirements can subject the Company to a series of increasingly restrictive regulatory actions. Currently, there are two basic measures of capital adequacy: a risk-based measure and a leverage measure.
The risk-based capital requirements are designed to make regulatory capital requirements more sensitive to differences in credit and market risk profiles among banks and bank holding companies, to account for off-balance sheet exposure and interest rate risk, and to minimize disincentives for holding liquid assets. Assets and off-balance sheet items are assigned to broad risk categories, each with specified risk-weighting factors. The resulting capital ratios represent capital as a percentage of total risk-weighted assets and off-balance sheet items. Banking organizations that are considered to have excessive interest rate risk exposure are required to maintain higher levels of capital.
86

Table of Contents
The minimum standard for the ratio of total capital to risk-weighted assets is 8 percent. At least 50 percent of that capital level must consist of common equity, undivided profits and non-cumulative perpetual preferred stock, senior perpetual preferred stock issued to the U.S. Treasury under the Capital Purchase Program, minority interests relating to qualifying common or noncumulative perpetual preferred stock issued by a consolidated U.S. depository institution or foreign bank subsidiary, less goodwill, deferred tax assets and certain other intangibles (“Tier 1 capital”). The remainder (“Tier 2 capital”) may consist of a limited amount of other preferred stock, mandatorily convertible securities, subordinated debt, and a limited amount of the allowance for loan losses. The sum of Tier 1 capital and Tier 2 capital is “total risk-based capital” or total capital. However, under the Collins Amendment, which was passed as a section of the Dodd-Frank Act, trust preferred securities will be eliminated as an element of Tier 1 capital. This disallowance of trust preferred securities will be phased in from January 1, 2013 to January 1, 2016. Debt or equity instruments issued to the Federal government as part of the CPP are exempt from the Collins Amendment. As of June 30, 2012, Regions had $846 million of trust preferred securities that are subject to the Collins Amendment. As discussed in Note 7 “Stockholders’ Equity and Accumulated Other Comprehensive Income (Loss)” to the consolidated financial statements, on April 4, 2012, the Series A preferred shares were repurchased from the U.S. Treasury.
The minimum guidelines to be considered well capitalized for Total capital and Tier 1 capital are 10 percent and 6 percent, respectively. As of June 30, 2012 and December 31, 2011, the most recent notification from Federal banking agencies categorized Regions and its significant subsidiaries as well capitalized under the regulatory framework.
The Company believes that no changes in conditions or events have occurred since June 30, 2012, which would result in changes that would cause Regions or Regions Bank to fall below the well capitalized level.
The banking regulatory agencies also have adopted regulations that supplement the risk-based guidelines to include a minimum ratio of 3 percent of Tier 1 capital to average assets less goodwill and disallowed deferred tax assets (the “Leverage ratio”). Depending upon the risk profile of the institution and other factors, the regulatory agencies may require a Leverage ratio of 1 percent to 2 percent above the minimum 3 percent level.
In recent years, banking regulators began supplementing their assessment of the capital adequacy of a bank based on a variation of Tier 1 capital, known as Tier 1 common equity. While not prescribed in amount by federal banking regulations, analysts and banking regulators have assessed Regions’ capital adequacy using the tangible common stockholders’ equity and/or the Tier 1 common equity measure. Because tangible common stockholders’ equity and Tier 1 common equity are not formally defined by GAAP or prescribed in amount by federal banking regulations, these measures are considered to be non-GAAP financial measures and other entities may calculate them differently than Regions’ disclosed calculations (see Table 20, “GAAP to Non-GAAP Reconciliation” for further details).
Regions is evaluating the anticipated impact of Basel III, which will be phased in beginning in 2013 and is expected to be fully phased-in by January 1, 2019. The Company’s estimated Tier 1 common ratio as of June 30, 2012, based on Regions’ current understanding of the Basel III requirements, as proposed by the U.S. Notices of Proposed Rulemaking (“NPR”) released in June 2012, was approximately 8.0 percent and therefore exceeded the Basel III minimum of 7 percent for Tier 1 common. Based on Regions’ understanding and interpretation of the rules for the calculation for the liquidity coverage ratio (“LCR”) under Basel III, due to the repurchase of the Series A preferred stock and related warrant during the second quarter of 2012, Regions is currently under the 100 percent target. The Company anticipates being fully compliant with the LCR requirements upon finalization and implementation. However, should Regions’ cash position or investment mix change in the future, Regions’ ability to meet the liquidity coverage ratio may be impacted. Additionally, there is still need for clarification of the Basel III rules as well as interpretation and implementation by U.S. banking regulators, so the ultimate impact of Basel III on Regions is not completely known at this point. The NPR comment period ends in early September 2012; changes to the calculation resulting from the comment process could result in materially different capital ratios from the amounts estimated. Because the Basel III capital calculations are not formally defined by GAAP
87

Table of Contents
and are not currently codified in the federal banking regulations, these measures are considered to be non-GAAP financial measures, and other entities may calculate them differently than Regions’ disclosed calculations (see Table 20, “GAAP to Non-GAAP Reconciliation” for further details).
See the “Supervision and Regulation—Capital Requirements” subsection of the “Business” section and the “Risk Factors” section of Regions’ Annual Report on Form 10-K for the year ended December 31, 2011 for more information.
The following chart summarizes the applicable holding company and bank regulatory capital requirements. Regions’ capital ratios at June 30, 2012 and December 31, 2011 exceeded all regulatory requirements.
Table 18—Regulatory Capital Requirements
As discussed in Note 7 “Stockholders’ Equity and Accumulated Other Comprehensive Income (Loss)” to the consolidated financial statements, on April 4, 2012 Regions repurchased $3.5 billion Series A preferred shares, reducing the parent company’s Tier 1 and Total capital by that same amount.
LIQUIDITY
GENERAL
Liquidity is an important factor in the financial condition of Regions and affects Regions’ ability to meet the borrowing needs and deposit withdrawal requirements of its customers. Regions intends to fund obligations primarily through cash generated from normal operations. In addition to these obligations, Regions has obligations related to potential litigation contingencies. See Note 15 “Commitments and Contingencies” to the consolidated financial statements for additional discussion of the Company’s funding requirements.
Assets, consisting principally of loans and securities, are funded by customer deposits, purchased funds, borrowed funds and stockholders’ equity. Regions’ goal in liquidity management is to satisfy the cash flow requirements of depositors and borrowers, while at the same time meeting the Company’s cash flow needs. The challenges of the current market environment demonstrate the importance of having and using various sources of liquidity to satisfy the Company’s funding requirements.
Regions’ minimum cash requirement for the holding company, by policy ensures that two years of contractual obligations including corporate dividends, debt service and maturities can be covered by utilizing cash on hand and expected dividend capacity from Regions Bank. Further, through scenario analysis the Company stresses various sources of liquidity, including subsidiary dividends when establishing policy minimum cash requirements.
88
June 30,
2012 Ratio December 31,
2011 Ratio To Be Well Capitalized
Tier 1 common (non-GAAP):
Regions Financial Corporation 10.00 % 8.51 % NA (1) Tier 1 capital:
Regions Financial Corporation 11.02 % 13.28 % 6.00 % Regions Bank 12.91 12.86 6.00
Total capital:
Regions Financial Corporation 14.50 % 16.99 % 10.00 % Regions Bank 15.78 15.98 10.00
Leverage:
Regions Financial Corporation 8.67 % 9.91 % 5.00 % Regions Bank 10.14 9.76 5.00
(1) The Board of Governors of the Federal Reserve System has proposed 5% as the level of Tier 1 common capital sufficient to withstand
periods of economic stress.
Table of Contents
Similar rigorous scenario analysis and stress testing are conducted at the Bank and subsidiary level to ensure minimum cash levels are maintained.
The securities portfolio is one of Regions’ primary sources of liquidity. Maturities of securities provide a constant flow of funds available for cash needs (see Note 3 “Securities” to the consolidated financial statements). The agency guaranteed mortgage portfolio is another source of liquidity in various secured borrowing capacities. In anticipation of regulatory changes proposed within the Basel III framework, in particular the Liquidity Coverage Ratio, Regions increased its holdings in securities backed by the Government National Mortgage Association (“GNMA”), which are explicitly backed by the U.S. Government. Additionally, the Company has $12.3 billion of unencumbered liquid securities available for pledging or repurchase agreements.
Maturities in the loan portfolio also provide a steady flow of funds. Additional funds are provided from payments on consumer loans and one-to-four family residential first mortgage loans. In addition, liquidity needs can also be met by borrowing funds in state and national money markets, although Regions does not currently rely on unsecured wholesale market funding. Historically, Regions’ liquidity has been enhanced by its relatively stable customer deposit base. During 2011 and 2012, Regions’ customer base grew substantially in response to competitive offers and customers’ desire to lock-in rates in the falling rate environment, as well as the introduction of new consumer and business checking products.
Regulation Q prohibited banks from paying interest on business checking accounts in accordance with the Glass-Steagall Act of 1933. However, the Dodd-Frank Act repealed Regulation Q. In July 2011, financial institutions, such as Regions, were allowed to offer interest on corporate checking accounts. Regions responded to these changes by enhancing its existing core interest-bearing products. However, due to the low interest rate environment and unlimited FDIC insurance available on non-interest bearing balances until January 1, 2013, the Company has not experienced, nor does it anticipate experiencing, significant migration of business customer balances from non-interest bearing accounts to interest-bearing accounts.
Due to the potential for uncertainty and inconsistency in the unsecured funding markets, Regions has been maintaining higher levels of cash liquidity by depositing excess cash with the Federal Reserve Bank, which is the primary component of the balance sheet line item, “interest-bearing deposits in other banks.” At June 30, 2012, Regions had approximately $1.8 billion in excess cash on deposit with the Federal Reserve. Regions’ borrowing availability with the Federal Reserve Bank as of June 30, 2012, based on assets available for collateral at that date, was $18.6 billion.
Regions periodically accesses funding markets through sales of securities with agreements to repurchase. Repurchase agreements are also offered through a commercial banking sweep product as a short-term investment opportunity for customers. All such arrangements are considered typical of the banking and brokerage industries and are accounted for as borrowings.
Regions’ financing arrangement with the FHLB adds additional flexibility in managing its liquidity position. As of June 30, 2012, Regions’ borrowing availability from the FHLB totaled $5.6 billion. FHLB borrowing capacity is contingent on the amount of collateral pledged to the FHLB. Regions Bank and its subsidiaries have pledged certain residential first mortgage loans on one-to-four family dwellings and home equity lines of credit as collateral for the FHLB advances outstanding. Additionally, investment in FHLB stock is required in relation to the level of outstanding borrowings. Regions held $135 million in FHLB stock at June 30, 2012. The FHLB has been and is expected to continue to be a reliable and economical source of funding.
In February 2010, Regions filed a shelf registration statement with the U.S. Securities and Exchange Commission. This shelf registration does not have a capacity limit and can be utilized by Regions to issue various debt and/or equity securities. The registration statement will expire in February 2013. In March 2012, Regions issued from the shelf 153 million shares of common stock with a par value $0.01 per share at $5.90 a share.
89
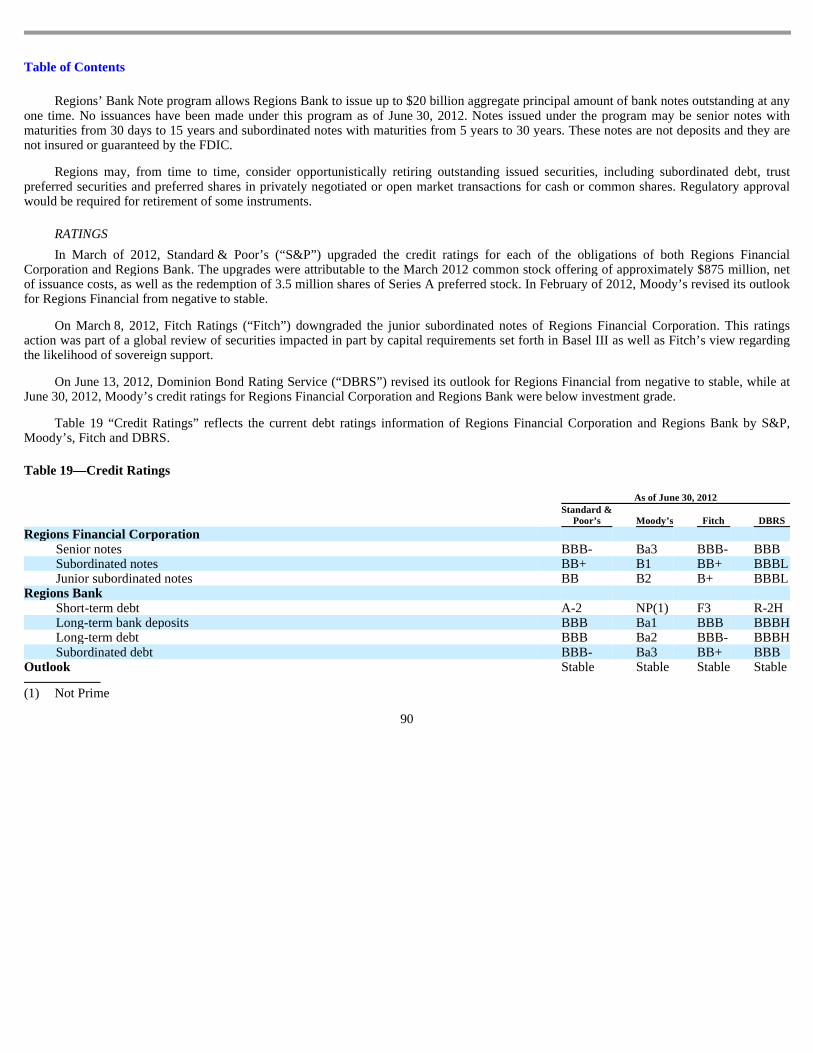
Table of Contents
Regions’ Bank Note program allows Regions Bank to issue up to $20 billion aggregate principal amount of bank notes outstanding at any one time. No issuances have been made under this program as of June 30, 2012. Notes issued under the program may be senior notes with maturities from 30 days to 15 years and subordinated notes with maturities from 5 years to 30 years. These notes are not deposits and they are not insured or guaranteed by the FDIC.
Regions may, from time to time, consider opportunistically retiring outstanding issued securities, including subordinated debt, trust preferred securities and preferred shares in privately negotiated or open market transactions for cash or common shares. Regulatory approval would be required for retirement of some instruments.
RATINGS
In March of 2012, Standard & Poor’s (“S&P”) upgraded the credit ratings for each of the obligations of both Regions Financial Corporation and Regions Bank. The upgrades were attributable to the March 2012 common stock offering of approximately $875 million, net of issuance costs, as well as the redemption of 3.5 million shares of Series A preferred stock. In February of 2012, Moody’s revised its outlook for Regions Financial from negative to stable.
On March 8, 2012, Fitch Ratings (“Fitch”) downgraded the junior subordinated notes of Regions Financial Corporation. This ratings action was part of a global review of securities impacted in part by capital requirements set forth in Basel III as well as Fitch’s view regarding the likelihood of sovereign support.
On June 13, 2012, Dominion Bond Rating Service (“DBRS”) revised its outlook for Regions Financial from negative to stable, while at June 30, 2012, Moody’s credit ratings for Regions Financial Corporation and Regions Bank were below investment grade.
Table 19 “Credit Ratings” reflects the current debt ratings information of Regions Financial Corporation and Regions Bank by S&P, Moody’s, Fitch and DBRS.
Table 19—Credit Ratings
90
As of June 30, 2012
Standard &
Poor’s Moody’s Fitch DBRS
Regions Financial Corporation
Senior notes BBB- Ba3 BBB- BBB Subordinated notes BB+ B1 BB+ BBBL Junior subordinated notes BB B2 B+ BBBL
Regions Bank
Short-term debt A-2 NP(1) F3 R-2H Long-term bank deposits BBB Ba1 BBB BBBH Long-term debt BBB Ba2 BBB- BBBH Subordinated debt BBB- Ba3 BB+ BBB
Outlook Stable Stable Stable Stable (1) Not Prime
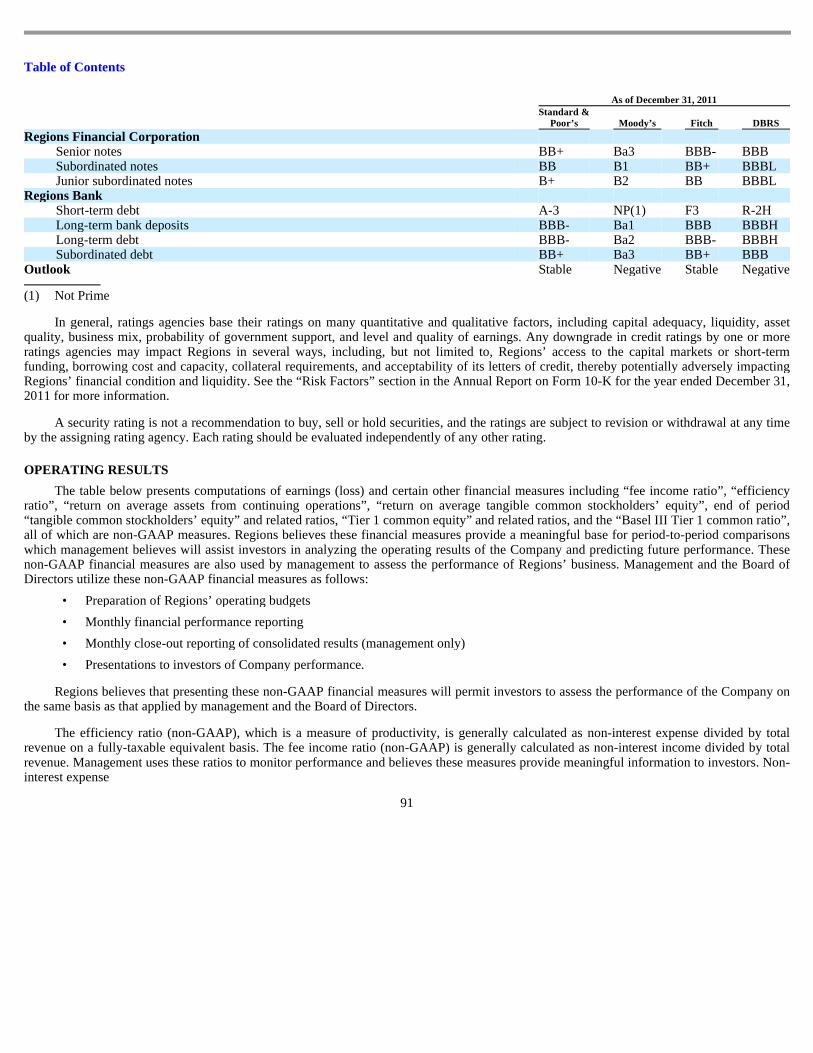
Table of Contents
In general, ratings agencies base their ratings on many quantitative and qualitative factors, including capital adequacy, liquidity, asset quality, business mix, probability of government support, and level and quality of earnings. Any downgrade in credit ratings by one or more ratings agencies may impact Regions in several ways, including, but not limited to, Regions’ access to the capital markets or short-term funding, borrowing cost and capacity, collateral requirements, and acceptability of its letters of credit, thereby potentially adversely impacting Regions’ financial condition and liquidity. See the “Risk Factors” section in the Annual Report on Form 10-K for the year ended December 31, 2011 for more information.
A security rating is not a recommendation to buy, sell or hold securities, and the ratings are subject to revision or withdrawal at any time by the assigning rating agency. Each rating should be evaluated independently of any other rating.
OPERATING RESULTS
The table below presents computations of earnings (loss) and certain other financial measures including “fee income ratio”, “efficiency ratio”, “return on average assets from continuing operations”, “return on average tangible common stockholders’ equity”, end of period “tangible common stockholders’ equity” and related ratios, “Tier 1 common equity” and related ratios, and the “Basel III Tier 1 common ratio”, all of which are non-GAAP measures. Regions believes these financial measures provide a meaningful base for period-to-period comparisons which management believes will assist investors in analyzing the operating results of the Company and predicting future performance. These non-GAAP financial measures are also used by management to assess the performance of Regions’ business. Management and the Board of Directors utilize these non-GAAP financial measures as follows:
Regions believes that presenting these non-GAAP financial measures will permit investors to assess the performance of the Company on the same basis as that applied by management and the Board of Directors.
The efficiency ratio (non-GAAP), which is a measure of productivity, is generally calculated as non-interest expense divided by total revenue on a fully-taxable equivalent basis. The fee income ratio (non-GAAP) is generally calculated as non-interest income divided by total revenue. Management uses these ratios to monitor performance and believes these measures provide meaningful information to investors. Non-interest expense
91
As of December 31, 2011
Standard &
Poor’s Moody’s Fitch DBRS
Regions Financial Corporation
Senior notes BB+ Ba3 BBB- BBB Subordinated notes BB B1 BB+ BBBL Junior subordinated notes B+ B2 BB BBBL
Regions Bank
Short-term debt A-3 NP(1) F3 R-2H Long-term bank deposits BBB- Ba1 BBB BBBH Long-term debt BBB- Ba2 BBB- BBBH Subordinated debt BB+ Ba3 BB+ BBB
Outlook Stable Negative Stable Negative (1) Not Prime
• Preparation of Regions’ operating budgets • Monthly financial performance reporting • Monthly close-out reporting of consolidated results (management only) • Presentations to investors of Company performance.

Table of Contents
(GAAP) may be presented excluding adjustments to arrive at adjusted non-interest expense (non-GAAP), which is the numerator for the efficiency ratio. Non-interest income (GAAP) may be presented excluding adjustments to arrive at adjusted non-interest income (non-GAAP), which is the numerator for the fee income ratio. Net interest income on a fully-taxable equivalent basis (GAAP) and non-interest income (GAAP) are added together to arrive at total revenue (GAAP). Adjustments are made to arrive at adjusted total revenue (non-GAAP), which is the denominator for the fee income and efficiency ratios. Regions believes that the non-GAAP measures reflecting these adjustments provide a meaningful base for period-to-period comparisons, which management believes will assist investors in analyzing the operating results of the Company and predicting future performance. These non-GAAP financial measures are also used by management to assess the performance of Regions’ business. It is possible that the activities related to the adjustments may recur; however, management does not consider the activities related to the adjustments to be indications of ongoing operations. Regions believes that presentation of these non-GAAP financial measures will permit investors to assess the performance of the Company on the same basis as that applied by management.
Tangible common stockholders’ equity ratios have become a focus of some investors in analyzing the capital position of the Company absent the effects of intangible assets and preferred stock. Traditionally, the Federal Reserve and other banking regulatory bodies have assessed a bank’s capital adequacy based on Tier 1 capital, the calculation of which is codified in federal banking regulations. In connection with the Federal Reserve’s Comprehensive Capital Analysis and Review process, these regulators are supplementing their assessment of the capital adequacy of a bank based on a variation of Tier 1 capital, known as Tier 1 common equity. While not prescribed in amount by federal banking regulations, analysts and banking regulators have assessed Regions’ capital adequacy using the tangible common stockholders’ equity and/or the Tier 1 common equity measure. Because tangible common stockholders’ equity and Tier 1 common equity are not formally defined by GAAP or prescribed in amount by federal banking regulations, these measures are considered to be non-GAAP financial measures and other entities may calculate them differently than Regions’ disclosed calculations. Since analysts and banking regulators may assess Regions’ capital adequacy using tangible common stockholders’ equity and Tier 1 common equity, Regions believes that it is useful to provide investors the ability to assess Regions’ capital adequacy on these same bases.
Tier 1 common equity is often expressed as a percentage of risk-weighted assets. Under the risk-based capital framework, a bank’s balance sheet assets and credit equivalent amounts of off-balance sheet items are assigned to one of four broad risk categories. The aggregated dollar amount in each category is then multiplied by the risk weighting assigned to that category. The resulting weighted values from each of the four categories are added together and this sum is the risk-weighted assets total that, as adjusted, comprises the denominator of certain risk-based capital ratios. Tier 1 capital is then divided by this denominator (risk-weighted assets) to determine the Tier 1 capital ratio. Adjustments are made to Tier 1 capital to arrive at Tier 1 common equity (non-GAAP). Tier 1 common equity is also divided by the risk-weighted assets to determine the Tier 1 common equity ratio (non-GAAP). The amounts disclosed as risk-weighted assets are calculated consistent with banking regulatory requirements.
Regions currently calculates its risk-based capital ratios under guidelines adopted by the Federal Reserve based on the 1988 Capital Accord (“Basel I”) of the Basel Committee on Banking Supervision (the “Basel Committee”). In December 2010, the Basel Committee released its final framework for Basel III, which will strengthen international capital and liquidity regulation. When implemented by U.S. bank regulatory agencies and fully phased-in, Basel III will change capital requirements and place greater emphasis on common equity. Implementation of Basel III will begin on January 1, 2013, and will be phased in over a multi-year period. The U.S. bank regulatory agencies have not yet finalized regulations governing the implementation of Basel III. Accordingly, the calculations provided below are estimates, based on Regions’ current understanding of the framework, including the Company’s reading of the original requirements, as well as the U. S. Notices of Proposed Rulemaking (“NPR”) released in June 2012, and informal feedback received through the regulatory process. Regions’understanding of the framework is evolving and will likely change as the regulations are finalized. The NPR comment period ends in early September 2012; changes to the calculation resulting from the
92

Table of Contents
comment process could result in materially different capital ratios from the amounts estimated. Because the Basel III implementation regulations are not formally defined by GAAP and have not yet been finalized and codified, these measures are considered to be non-GAAP financial measures, and other entities may calculate them differently from Regions’ disclosed calculations. Since analysts and banking regulators may assess Regions’ capital adequacy using the Basel III framework, Regions believes that it is useful to provide investors the ability to assess Regions’ capital adequacy on the same basis. Non-GAAP financial measures have inherent limitations, are not required to be uniformly applied and are not audited. Although these non-GAAP financial measures are frequently used by stakeholders in the evaluation of a company, they have limitations as analytical tools, and should not be considered in isolation, or as a substitute for analyses of results as reported under GAAP.
The following tables provide: 1) a reconciliation of net income available to common shareholders (GAAP) to income from continuing operations available to common shareholders, 2) a reconciliation of non-interest income and non-interest expense from continuing operations (GAAP) to adjusted non-interest income and non-interest expense (non-GAAP), 3) a computation of adjusted total revenue (non-GAAP), 4) a computation of the fee income ratio (non-GAAP), 5) a computation of the efficiency ratio (non-GAAP), 6) a reconciliation of average and ending stockholders’ equity (GAAP) to average and ending tangible common stockholders’ equity (non-GAAP) and calculations of related ratios, 7) a reconciliation of stockholders’ equity (GAAP) to Tier 1 capital (regulatory) and to Tier 1 common equity (non-GAAP) and calculations of related ratios, and 8) a reconciliation of stockholders’ equity (GAAP) to Basel III Tier 1 common equity (non-GAAP) and calculation of the related ratio based on Regions’ current understanding of Basel III requirements as proposed by the U.S. Notices of Proposed Rulemaking released in June 2012.
Table 20—GAAP to Non-GAAP Reconciliation
93
Three Months Ended
June 30 Six Months Ended
June 30 2012 2011 2012 2011 (Dollars in millions, except per share data)
INCOME (LOSS)
Net income (GAAP) $ 355 $ 109 $ 554 $ 178 Preferred dividends and accretion (GAAP) (71 ) (54 ) (125 ) (106 )
Net income available to common shareholders (GAAP) A $ 284 $ 55 $ 429 $ 72 Income (loss) from discontinued operations, net of tax (GAAP) 4 30 (36 ) 49
Income from continuing operations available to common shareholders (GAAP) B $ 280 $ 25 $ 465 $ 23
Net income available to common shareholders (GAAP) A $ 284 $ 55 $ 429 $ 72 Income tax benefit related to regulatory charge — (44 ) — (44 )
Net income available to common shareholders, excluding income tax benefit related to regulatory charge (non-GAAP) C $ 284 $ 11 $ 429 $ 28
Income from continuing operations available to common shareholders (GAAP) B $ 280 $ 25 $ 465 $ 23
Income tax benefit related to regulatory charge from continuing operations — (17 ) — (17 )
Net income from continuing operations available to common shareholders, excluding income tax benefit related to regulatory charge (non-GAAP) D $ 280 $ 8 $ 465 $ 6
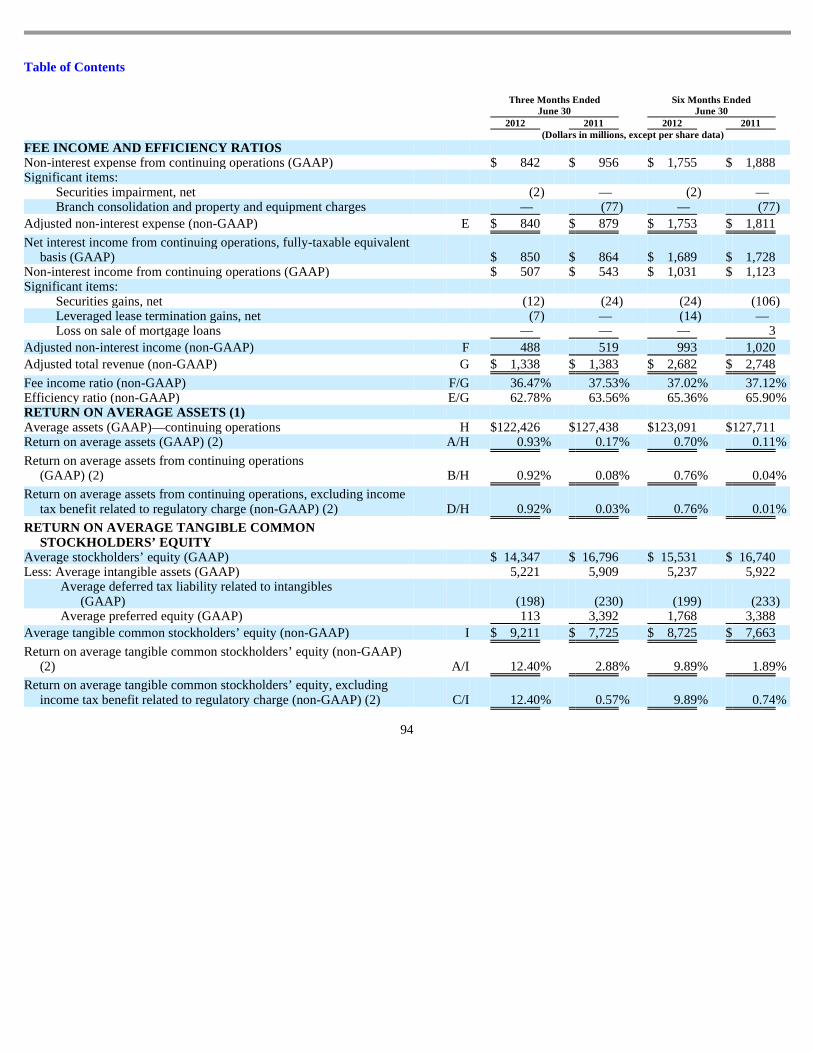
Table of Contents
94
Three Months Ended
June 30 Six Months Ended
June 30 2012 2011 2012 2011 (Dollars in millions, except per share data)
FEE INCOME AND EFFICIENCY RATIOS
Non-interest expense from continuing operations (GAAP) $ 842 $ 956 $ 1,755 $ 1,888 Significant items:
Securities impairment, net (2 ) — (2 ) — Branch consolidation and property and equipment charges — (77 ) — (77 )
Adjusted non-interest expense (non-GAAP) E $ 840 $ 879 $ 1,753 $ 1,811
Net interest income from continuing operations, fully-taxable equivalent basis (GAAP) $ 850 $ 864 $ 1,689 $ 1,728
Non-interest income from continuing operations (GAAP) $ 507 $ 543 $ 1,031 $ 1,123 Significant items:
Securities gains, net (12 ) (24 ) (24 ) (106 ) Leveraged lease termination gains, net (7 ) — (14 ) — Loss on sale of mortgage loans — — — 3
Adjusted non-interest income (non-GAAP) F 488 519 993 1,020
Adjusted total revenue (non-GAAP) G $ 1,338 $ 1,383 $ 2,682 $ 2,748
Fee income ratio (non-GAAP) F/G 36.47 % 37.53 % 37.02 % 37.12 % Efficiency ratio (non-GAAP) E/G 62.78 % 63.56 % 65.36 % 65.90 % RETURN ON AVERAGE ASSETS (1)
Average assets (GAAP)—continuing operations H $ 122,426 $ 127,438 $ 123,091 $ 127,711 Return on average assets (GAAP) (2) A/H 0.93 % 0.17 % 0.70 % 0.11 %
Return on average assets from continuing operations (GAAP) (2) B/H 0.92 % 0.08 % 0.76 % 0.04 %
Return on average assets from continuing operations, excluding income tax benefit related to regulatory charge (non-GAAP) (2) D/H 0.92 % 0.03 % 0.76 % 0.01 %
RETURN ON AVERAGE TANGIBLE COMMON STOCKHOLDERS’ EQUITY
Average stockholders’ equity (GAAP) $ 14,347 $ 16,796 $ 15,531 $ 16,740 Less: Average intangible assets (GAAP) 5,221 5,909 5,237 5,922 Average deferred tax liability related to intangibles (GAAP) (198 ) (230 ) (199 ) (233 ) Average preferred equity (GAAP) 113 3,392 1,768 3,388
Average tangible common stockholders’ equity (non-GAAP) I $ 9,211 $ 7,725 $ 8,725 $ 7,663
Return on average tangible common stockholders’ equity (non-GAAP) (2) A/I 12.40 % 2.88 % 9.89 % 1.89 %
Return on average tangible common stockholders’ equity, excluding income tax benefit related to regulatory charge (non-GAAP) (2) C/I 12.40 % 0.57 % 9.89 % 0.74 %

Table of Contents
95
June 30
2012
December 31
2011
TANGIBLE COMMON RATIOS
Ending stockholders’ equity (GAAP) $ 14,455 $ 16,499 Less: Ending intangible assets (GAAP) 5,207 5,265
Ending deferred tax liability related to intangibles (GAAP) (201 ) (200 ) Ending preferred equity (GAAP) — 3,419
Ending tangible common stockholders’ equity (non-GAAP) J $ 9,449 $ 8,015
Ending total assets (GAAP) $ 122,345 $ 127,050 Less: Ending intangible assets (GAAP) 5,207 5,265
Ending deferred tax liability related to intangibles (GAAP) (201 ) (200 )
Ending tangible assets (non-GAAP) K $ 117,339 $ 121,985
End of period shares outstanding L 1,413 1,259 Tangible common stockholders’ equity to tangible assets (non-GAAP) J/K 8.04 % 6.57 %
Tangible common book value per share (non-GAAP) J/L $ 6.69 $ 6.37
TIER 1 COMMON RISK -BASED RATIO
Stockholders’ equity (GAAP) $ 14,455 $ 16,499 Accumulated other comprehensive (income) loss (54 ) 69 Non-qualifying goodwill and intangibles (4,852 ) (4,900 ) Disallowed deferred tax assets (336 ) (432 ) Disallowed servicing assets (33 ) (35 ) Qualifying non-controlling interests 92 92 Qualifying trust preferred securities 846 846
Tier 1 capital (regulatory) 10,118 12,139 Qualifying non-controlling interests (92 ) (92 ) Qualifying trust preferred securities (846 ) (846 ) Preferred stock — (3,419 )
Tier 1 common equity (non-GAAP) M $ 9,180 $ 7,782
Risk-weighted assets (regulatory) N $ 91,779 $ 91,449 Tier 1 common risk-based ratio (non-GAAP) M/N 10.00 % 8.51 %
BASEL III TIER 1 COMMON RATIO (3)
Stockholders’ equity (GAAP) $ 14,455
Non-qualifying goodwill and intangibles (4) (5,005 )
Adjustments, including other comprehensive income related to cash flow hedges, disallowed deferred tax assets, threshold deductions and other adjustments (548 )
Basel III tier 1 common equity (non-GAAP) O $ 8,902
Basel I risk-weighted assets (regulatory) $ 91,779
Basel III risk-weighted assets (non-GAAP) (5) P $ 111,782
Basel III tier 1 common ratio (non-GAAP) O/P 8.0 %
(1) Return on assets from continuing operations does not include average assets related to discontinued operations of $49 million and $3,240
million for the three months ended June 30, 2012 and 2011 and $1,413 million and $3,233 million for the six months ended June 30, 2012 and 2011, respectively.
(2) Income statement amounts have been annualized in calculation. (3) Estimate based on June 2012 U.S. Notices of Proposed Rulemaking (4) Under Basel III, regulatory capital must be reduced by purchased credit card relationship intangible assets. These assets are partially
allowed in Basel I capital. (5) Regions continues to develop systems and internal controls to calculate risk-weighted assets as required by Basel III. The amount
included above is a reasonable approximation, based on our understanding of the requirements.

Table of Contents
NET INTEREST INCOME
The following tables present an analysis of net interest income/margin from continuing operations for the three and six months ended June 30, 2012 and 2011:
Table 21—Consolidated Average Daily Balances and Yield/Rate Analysis for Continuing Operations
Notes:
96
Three Months Ended June 30 2012 2011
Average Balance
Income/ Expense
Yield/ Rate
Average Balance
Income/ Expense
Yield/ Rate
(Dollars in millions; yields on taxable-equivalent basis)
Assets
Interest-earning assets:
Federal funds sold and securities purchased under agreements to resell $ — $ — — % $ — $ — — % Trading account assets 116 — — 164 1 2.45 Securities:
Taxable 26,846 179 2.68 24,765 208 3.37 Tax-exempt 16 — — 33 — —
Loans held for sale 1,107 8 2.91 1,141 9 3.16 Loans, net of unearned income: (1)(2) 76,670 817 4.29 81,106 863 4.27 Other interest-earning assets 3,311 2 0.24 5,662 3 0.21
Total interest-earning assets 108,066 1,006 3.74 112,871 1,084 3.85 Allowance for loan losses (2,506 ) (3,200 )
Cash and due from banks 1,814 2,027
Other non-earning assets 15,052 15,740
$ 122,426 $ 127,438
Liabilities and Stockholders’ Equity
Interest-bearing liabilities:
Savings accounts $ 5,655 1 0.07 $ 5,107 1 0.08 Interest-bearing transaction accounts 19,447 6 0.12 13,898 7 0.20 Money market accounts 24,456 11 0.18 26,805 20 0.30 Time deposits 17,175 58 1.36 22,507 98 1.75
Total interest-bearing deposits (3) 66,733 76 0.46 68,317 126 0.74 Federal funds purchased and securities sold under agreements to
repurchase 1,856 — — 1,752 1 0.23 Other short-term borrowings 468 — — 122 — — Long-term borrowings 6,862 80 4.69 11,726 93 3.18
Total interest-bearing liabilities 75,919 156 0.83 81,917 220 1.08
Net interest spread 2.91 2.77
Non-interest-bearing deposits (3) 29,130 27,806
Other liabilities 2,996 2,455
Stockholders’ equity 14,381 15,260
$ 122,426 $ 127,438
Net interest income/margin on a taxable-equivalent basis from continuing operations (4)(5) $ 850 3.16 % $ 864 3.07 %
(1) Loans, net of unearned income include non-accrual loans for all periods presented. (2) Interest income includes net loan fees of $17 million and $13 million for the three months ended June 30, 2012 and 2011, respectively. (3) Total deposit costs may be calculated by dividing total interest expense on deposits by the sum of interest-bearing deposits and non-interest
bearing deposits. The rates for total deposit costs equal 0.32% and 0.53% for the three months ended June 30, 2012 and 2011, respectively. (4) The computation of taxable-equivalent net interest income is based on the stautory federal income tax rate of 35%, adjusted for applicable
state income taxes net of the related federal tax benefit. (5) The table above does not include average assets, average liablilites, interest income, or interest expense for discontinued operations (see
Note 2 to the consolidated financial statements). If these assets, liabilities, and net interest income were included in the calculation, the consolidated net interest income and margin on a taxable equivalent basis would be $850 million and 3.16% and $872 million and 3.05% for the three months ended June 30, 2012 and 2011, respectively.
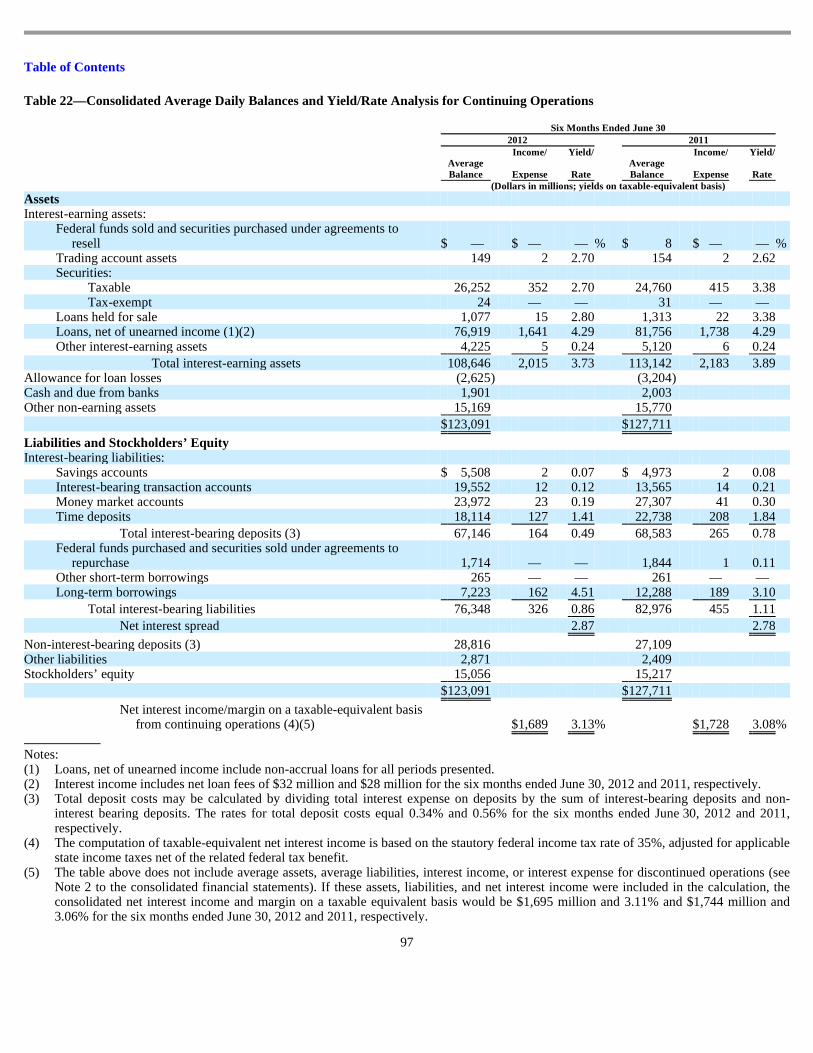
Table of Contents
Table 22—Consolidated Average Daily Balances and Yield/Rate Analysis for Continuing Operations
Notes:
97
Six Months Ended June 30 2012 2011
Average Balance
Income/
Expense
Yield/
Rate Average Balance
Income/
Expense
Yield/
Rate (Dollars in millions; yields on taxable-equivalent basis)
Assets
Interest-earning assets:
Federal funds sold and securities purchased under agreements to resell $ — $ — — % $ 8 $ — — %
Trading account assets 149 2 2.70 154 2 2.62 Securities:
Taxable 26,252 352 2.70 24,760 415 3.38 Tax-exempt 24 — — 31 — —
Loans held for sale 1,077 15 2.80 1,313 22 3.38 Loans, net of unearned income (1)(2) 76,919 1,641 4.29 81,756 1,738 4.29 Other interest-earning assets 4,225 5 0.24 5,120 6 0.24
Total interest-earning assets 108,646 2,015 3.73 113,142 2,183 3.89 Allowance for loan losses (2,625 ) (3,204 )
Cash and due from banks 1,901 2,003
Other non-earning assets 15,169 15,770
$ 123,091 $ 127,711
Liabilities and Stockholders’ Equity
Interest-bearing liabilities:
Savings accounts $ 5,508 2 0.07 $ 4,973 2 0.08 Interest-bearing transaction accounts 19,552 12 0.12 13,565 14 0.21 Money market accounts 23,972 23 0.19 27,307 41 0.30 Time deposits 18,114 127 1.41 22,738 208 1.84
Total interest-bearing deposits (3) 67,146 164 0.49 68,583 265 0.78 Federal funds purchased and securities sold under agreements to
repurchase 1,714 — — 1,844 1 0.11 Other short-term borrowings 265 — — 261 — — Long-term borrowings 7,223 162 4.51 12,288 189 3.10
Total interest-bearing liabilities 76,348 326 0.86 82,976 455 1.11
Net interest spread 2.87 2.78
Non-interest-bearing deposits (3) 28,816 27,109
Other liabilities 2,871 2,409
Stockholders’ equity 15,056 15,217
$ 123,091 $ 127,711
Net interest income/margin on a taxable-equivalent basis from continuing operations (4)(5) $ 1,689 3.13 % $ 1,728 3.08 %
(1) Loans, net of unearned income include non-accrual loans for all periods presented. (2) Interest income includes net loan fees of $32 million and $28 million for the six months ended June 30, 2012 and 2011, respectively. (3) Total deposit costs may be calculated by dividing total interest expense on deposits by the sum of interest-bearing deposits and non-
interest bearing deposits. The rates for total deposit costs equal 0.34% and 0.56% for the six months ended June 30, 2012 and 2011, respectively.
(4) The computation of taxable-equivalent net interest income is based on the stautory federal income tax rate of 35%, adjusted for applicable state income taxes net of the related federal tax benefit.
(5) The table above does not include average assets, average liabilities, interest income, or interest expense for discontinued operations (see Note 2 to the consolidated financial statements). If these assets, liabilities, and net interest income were included in the calculation, the consolidated net interest income and margin on a taxable equivalent basis would be $1,695 million and 3.11% and $1,744 million and 3.06% for the six months ended June 30, 2012 and 2011, respectively.

Table of Contents
For the second quarter of 2012, related to continuing operations net interest income (taxable-equivalent basis) totaled $850 million compared to $864 million in the second quarter of 2011. The net interest margin (taxable-equivalent basis) was 3.16 percent for the second quarter of 2012, compared to 3.07 percent for the second quarter of 2011. For both the first six months of 2012 and 2011, related to continuing operations net interest income (taxable-equivalent basis) totaled $1.7 billion. The net interest margin (taxable-equivalent basis) was 3.13 percent for the six months ended June 30, 2012, compared to 3.08 percent for the first six months of 2011. Net interest margin increased for both periods primarily as a result of declines in overall deposit costs, lower levels of non-accrual loans and a decline in low-yielding other interest earning assets, primarily cash held at the Federal Reserve.
MARKET RISK—INTEREST RATE RISK
Regions’ primary market risk is interest rate risk, including uncertainty with respect to absolute interest rate levels as well as uncertainty with respect to relative interest rate levels, which is impacted by both the shape and the slope of the various yield curves that affect the financial products and services that the Company offers. To quantify this risk, Regions measures the change in its net interest income in various interest rate scenarios compared to a base case scenario. Net interest income sensitivity is a useful short-term indicator of Regions’ interest rate risk.
Sensitivity Measurement —Financial simulation models are Regions’ primary tools used to measure interest rate exposure. Using a wide range of sophisticated simulation techniques provides management with extensive information on the potential impact to net interest income caused by changes in interest rates. Models are structured to simulate cash flows and accrual characteristics of Regions’ balance sheet. Assumptions are made about the direction and volatility of interest rates, the slope of the yield curve, and the changing composition of the balance sheet that result from both strategic plans and from customer behavior. Among the assumptions are expectations of balance sheet growth and composition, the pricing and maturity characteristics of existing business and the characteristics of future business. Interest rate-related risks are expressly considered, such as pricing spreads, the lag time in pricing deposit accounts, prepayments and other option risks. Regions considers these factors, as well as the degree of certainty or uncertainty surrounding their future behavior.
The primary objective of asset/liability management at Regions is to coordinate balance sheet composition with interest rate risk management to sustain a reasonable and stable net interest income throughout various interest rate cycles. In computing interest rate sensitivity for measurement, Regions compares a set of alternative interest rate scenarios to the results of a base case scenario based on “market forward rates.” The standard set of interest rate scenarios includes the traditional instantaneous parallel rate shifts of plus 100 and 200 basis points. Regions also prepares a minus 50 basis points scenario, as minus 100 and 200 basis scenarios are of limited use in the current rate environment. Up-rate scenarios of greater magnitude are also analyzed, and are of increased importance as the current and historic low levels of interest rates increase the relative likelihood of a rapid and substantial increase in interest rates. Regions also includes simulations of gradual interest rate movements that may more realistically mimic potential interest rate movements. These gradual scenarios include curve steepening, flattening, and parallel movements of various magnitudes phased in over a six-month period, and include rate shifts of minus 50 basis points and plus 100 and 200 basis points.
98

Table of Contents
Exposure to Interest Rate Movements— As of June 30, 2012, Regions was moderately asset sensitive to both gradual and instantaneous rate shifts as compared to the base case for the measurement horizon ending June 2013. The exposure reflected in the minus 50 basis points scenario reflects the risk of accelerating prepayment activity as spurred by exceptionally low levels of long-term interest rates, as well as the risk that short-term interest rates (such as the Fed Funds rate and the rate of Interest On Excess Reserves) decline to zero. The table below summarizes Regions’ position, and the scenarios are inclusive of all interest-rate risk hedging activities. Note that wherever scenarios would indicate negative interest rates, a minimum of zero is applied.
Table 23—Interest Rate Sensitivity
Interest rate movements may also have an impact on the value of Regions’ securities portfolio, which can directly impact the carrying value of stockholders’ equity. Regions from time to time may hedge these price movements with derivatives (as discussed below). However, at June 30, 2012, Regions had no designations of hedges to mitigate price movements of securities.
Derivatives —Regions uses financial derivative instruments for management of interest rate sensitivity. The Asset and Liability Committee (“ALCO”), which consists of members of Regions’ senior management team, in its oversight role for the management of interest rate sensitivity, approves the use of derivatives in balance sheet hedging strategies. The most common derivatives Regions employs are forward rate contracts, Eurodollar futures contracts, interest rate swaps, options on interest rate swaps, interest rate caps and floors, and forward sale commitments. Derivatives are also used to offset the risks associated with customer derivatives, which include interest rate, credit and foreign exchange risks.
Forward rate contracts are commitments to buy or sell financial instruments at a future date at a specified price or yield. A Eurodollar futures contract is a future on a Eurodollar deposit. Eurodollar futures contracts subject Regions to market risk associated with changes in interest rates. Because futures contracts are cash settled daily, there is minimal credit risk associated with Eurodollar futures. Interest rate swaps are contractual agreements typically entered into to exchange fixed for variable (or vice versa) streams of interest payments. The notional principal is not exchanged but is used as a reference for the size of interest settlements. Interest rate options are contracts that allow the buyer to purchase or sell a financial instrument at a predetermined price and time. Forward sale commitments are contractual obligations to sell market instruments at a future date for an already agreed-upon price. Foreign currency contracts involve the exchange of one currency for another on a specified date and at a specified rate. The Company is subject to the credit risk that another party will fail to perform.
Regions has made use of interest rate swaps to effectively convert a portion of its fixed-rate funding position to a variable-rate position and, in some cases, to effectively convert a portion of its variable-rate loan portfolio to fixed-rate. Regions also uses derivatives to manage interest rate and pricing risk associated with its mortgage origination business. In the period of time that elapses between the origination and sale of mortgage loans,
99
Estimated Annual Change in Net Interest Income
June 30, 2012 (In millions)
Gradual Change in Interest Rates
+200 basis points $ 386 +100 basis points 209 -50 basis points (99 )
Instantaneous Change in Interest Rates
+200 basis points $ 478 +100 basis points 263 -50 basis points (123 )

Table of Contents
changes in interest rates have the potential to cause a decline in the value of the loans in this held-for-sale portfolio. Futures contracts and forward sale commitments are used to protect the value of the loan pipeline and loans held for sale from changes in interest rates and pricing.
Regions manages the credit risk of these instruments in much the same way as it manages credit risk of the loan portfolios by establishing credit limits for each counterparty and through collateral agreements for dealer transactions. For non-dealer transactions, the need for collateral is evaluated on an individual transaction basis and is primarily dependent on the financial strength of the counterparty. Credit risk is also reduced significantly by entering into legally enforceable master netting agreements. When there is more than one transaction with a counterparty and there is a legally enforceable master netting agreement in place, the exposure represents the net of the gain and loss positions with and collateral received from and/or posted to that counterparty. The “Credit Risk” section in Regions’ Annual Report on Form 10-K for the year ended December 31, 2011 contains more information on the management of credit risk.
Regions also uses derivatives to meet the needs of its customers. Interest rate swaps, interest rate options and foreign exchange forwards are the most common derivatives sold to customers. Other derivatives instruments with similar characteristics are used to hedge market risk and minimize volatility associated with this portfolio. Instruments used to service customers are held in the trading account, with changes in value recorded in the consolidated statements of income.
The primary objective of Regions’ hedging strategies is to mitigate the impact of interest rate changes, from an economic perspective, on net interest income and the net present value of its balance sheet. The overall effectiveness of these hedging strategies is subject to market conditions, the quality of Regions’ execution, the accuracy of its valuation assumptions, counterparty credit risk and changes in interest rates. See Note 12 “Derivative Financial Instruments and Hedging Activities” to the consolidated financial statements for a tabular summary of Regions’ quarter-end and year-end derivatives positions and further discussion.
Regions accounts for mortgage servicing rights at fair market value with any changes to fair value being recorded within mortgage income. Regions enters into derivative and balance sheet transactions to mitigate the impact of market value fluctuations related to mortgage servicing rights. Derivative instruments entered into in the future could be materially different from the current risk profile of Regions’ current portfolio.
MARKET RISK—PREPAYMENT RISK
Regions, like most financial institutions, is subject to changing prepayment speeds on mortgage-related assets under different interest rate environments. Prepayment risk is a significant risk to earnings and specifically to net interest income. For example, mortgage loans and other financial assets may be prepaid by a debtor, so that the debtor may refinance its obligations at lower rates. As loans and other financial assets prepay in a falling rate environment, Regions must reinvest these funds in lower-yielding assets. Prepayments of assets carrying higher rates reduce Regions’ interest income and overall asset yields. Conversely, in a rising rate environment, these assets will prepay at a slower rate, resulting in opportunity cost by not having the cash flow to reinvest at higher rates. Prepayment risk can also impact the value of securities and the carrying value of equity. Regions’ greatest exposures to prepayment risks primarily rest in its mortgage-backed securities portfolio, the mortgage fixed-rate loan portfolio and the mortgage servicing asset, all of which tend to be sensitive to interest rate movements. Regions also has prepayment risk that would be reflected in non-interest income in the form of servicing income on loans sold. Regions actively monitors prepayment exposure as part of its overall net interest income forecasting and interest rate risk management. For instance, at this time of historically low interest rates, Regions carefully evaluates and manages the exposure to declining prepayments that are expected to coincide with increasing interest rates in both the loan and securities portfolio.
100

Table of Contents
MARKET RISK—BROKERAGE AND OTHER MARKET ACTIVITY RIS K
When there are references to Morgan Keegan it should not be assumed or inferred that any specific activity mentioned is carried on by any particular Morgan Keegan entity. On January 11, 2012, Regions entered into a stock purchase agreement to sell Morgan Keegan & Company, Inc. and related affiliates to Raymond James Financial, Inc. The transaction closed on April 2, 2012. Refer to Note 2 “Discontinued Operations,” to the consolidated financial statements for further details.
Regions’ capital markets business, which includes derivatives, loan syndication and foreign exchange trading activities, expose it to market risk. Further, the Company is exposed to market risk from mortgage hedging activities which include secondary marketing of loans to government-sponsored entities and mortgage servicing rights valuation.
To manage trading risks arising from interest rate and equity price risks, the Company uses a Value at Risk (“VAR”) model along with other risk management methods to measure the potential fair value the Company could lose on its trading positions given a specified statistical confidence level and time-to-liquidate time horizon. The results of VAR were immaterial for both June 30, 2012 and December 31, 2011.
PROVISION FOR LOAN LOSSES
The provision for loan losses is used to maintain the allowance for loan losses at a level that in management’s judgment is appropriate to absorb probable losses inherent in the portfolio at the balance sheet date. The provision for loan losses totaled $26 million in the second quarter of 2012 compared to $398 million during the second quarter of 2011. The provision for loan losses totaled $143 million in the first six months of 2012 compared to $880 million in the first six months of 2011. Net charge-offs as a percentage of average loans (annualized) were 1.56 percent and 2.54 percent in the first six months of 2012 and 2011, respectively. Net charge-offs were lower across most major loan categories when comparing the 2012 period to the prior year period, except for the consumer credit card portfolio which was purchased in the second quarter of 2011. In addition to lower levels of charge-offs, credit quality metrics continued to improve. Charge-offs exceeded provision for loan losses for the second quarter of 2012 and the first half of 2012, primarily due to improving credit metrics.
CREDIT RISK
Regions’ objective regarding credit risk is to maintain a high-quality credit portfolio that provides for stable credit costs with acceptable volatility through an economic cycle. Regions has a diversified loan portfolio in terms of product type, collateral and geography. See Table 2 for further details of each loan portfolio segment. See the “Credit Risk” section of the Form 10-K for the year ended December 31, 2011 for a discussion of risk characteristics of each loan type.
INTERNATIONAL RISK
Regions has minimal sovereign credit exposure. Regions does own an immaterial amount in government securities issued by a single non-European sovereign, as well as a guarantee on a leveraged lease from a Western European government agency. However, Regions does have country exposure, which is defined as the aggregation of exposure Regions has with financial institutions, companies, or individuals in a given country outside of the United States. The majority of these exposures are in the form of corporate bonds, derivative hedges (interest rate and foreign exchange) and leveraged lease guarantees. This exposure is concentrated in highly-rated, Western European countries but not in those most severely affected by the recent Eurozone turmoil.
In addition to Western Europe and Australia, Regions’ corporate securities include investments in corporations domiciled in other countries in Eastern Europe and North America. Regions has other smaller exposures in the form of trade confirmations, due from clearing accounts and loan participations with counterparties domiciled in countries in other regions, such as Latin America, Asia and the Middle East / North Africa region.
101

Table of Contents
At June 30, 2012, Regions’ international exposure was approximately $958 million in total. Approximately 63 percent of the total exposure relates to corporate bonds. Approximately 56 percent of the total exposure relates to highly-rated Western European entities.
Regions’ Counterparty Risk department is responsible for the setting of country limits and managing of the outstanding country exposure for all departments of the bank as well as monitoring compliance of the outstanding exposure to the set limits. Reports are sent to Counterparty Risk by the lines of business on a monthly basis to demonstrate their compliance with their set limits. Counterparty Risk conducts a formal, quarterly assessment of the exposure, on both an outstanding and limit basis, which is then distributed to upper management for review.
NON-INTEREST INCOME
The following tables present a summary of non-interest income. For expanded discussion of certain significant non-interest income items, refer to the discussion of each component following the tables presented.
Table 24—Non-Interest Income from Continuing Operations
102
Three Months Ended
June 30 2012 2011 (In millions)
Service charges on deposit accounts $ 233 $ 308 Capital markets and investment income 17 19 Mortgage income 90 50 Trust department income 50 51 Securities gains, net 12 24 Insurance commissions and fees 26 25 Bank owned life insurance 21 20 Commercial credit fee income 16 20 Leveraged lease termination gains 7 — Net revenue (loss) from affordable housing (13 ) (17 ) Credit card / bank card income 23 10 Other miscellaneous income 25 33
$ 507 $ 543
Six Months Ended
June 30 2012 2011 (In millions)
Service charges on deposit accounts $ 487 $ 595 Capital markets and investment income 45 50 Mortgage income 167 95 Trust department income 99 101 Securities gains, net 24 106 Insurance commissions and fees 54 53 Bank owned life insurance 42 41 Commercial credit fee income 35 40 Leveraged lease termination gains 14 — Net revenue (loss) from affordable housing (27 ) (31 ) Credit card / bank card income 46 18 Other miscellaneous income 45 55
$ 1,031 $ 1,123

Table of Contents
Service charges on deposit accounts —Service charges on deposit accounts decreased $75 million for the quarter ended June 30, 2012, as compared to the second quarter of 2011. For the six months ended June 30, 2012 service charges on deposit accounts decreased $108 million from the corresponding 2011 period. The decreases in both periods are primarily driven by policy changes related to Regulation E, as well as a decline in interchange income as a result of debit interchange price controls implemented in the fourth quarter of 2011. During the second quarter of 2012, service charges on deposit accounts were also impacted by approximately $24 million due to the establishment of a reserve for customer refunds resulting from a change in the Company’s non-sufficient funds policy.
Interchange income, which is included in service charges on deposit accounts, was impacted by the Federal Reserve’s rulemaking required by section 1075 of the Dodd-Frank Act. The Federal Reserve Board of Governors announced its final rule on debit card interchange fees mandated by the Durbin Amendment to the Dodd-Frank Act effective October 1, 2011. Based on the final ruling, the Company estimates that the impact on annual debit interchange revenue will be approximately $180 million before any mitigation efforts. However, the Company believes it will able to mitigate this impact over time through fee changes, introduction of new products and services, and expense management.
Mortgage income— Mortgage income increased $40 million for the second quarter of 2012 as compared to the second quarter of 2011. Mortgage income increased $72 million for the six months ended June 30, 2012 as compared to the corresponding 2011 period. The increases were driven by customers taking advantage of the opportunity to refinance under the extended Home Affordable Refinance Program, or HARP II. Mortgage originations totaled $2.1 billion for the second quarter of 2012, as compared to $1.4 billion for the second quarter of 2011. Mortgage originations totaled $3.7 billion for the first six months of 2012, as compared to $3.0 billion for the first six months of 2011.
Securities gains, net —Securities gains for the second quarter of 2012 declined to $12 million from $24 million for the second quarter of 2011. For the first six months of 2012 securities gains declined to $24 million from $106 million for the corresponding 2011 period. Lower securities gains during both 2012 periods resulted from lower volumes of securities sales, resulting from the Company’s asset/liability management process.
Leveraged lease termination gains —A 2008 settlement with the Internal Revenue Service (“IRS”) negatively impacted the economics of Regions’ leveraged lease portfolio. In addition, there has been a mutual desire with lessees to terminate certain leases within this portfolio. Therefore, Regions terminated certain leveraged leases during 2012 resulting in a $7 million gain for the second quarter and a $14 million gain for first six months of 2012. The termination gains were largely offset by increases in related income tax expense. There were no corresponding leveraged lease termination gains in either corresponding 2011 period.
Credit card / bank card income —Credit card / bank card income increased $13 million for second quarter of 2012 as compared to the second quarter of 2011. Credit card / bank card income increased $28 million for the six months ended June 30, 2012 as compared to the corresponding 2011 period. Credit card income is derived from activity related to the Regions-branded credit card amounts purchased from FIA card services in the second quarter of 2011 and any subsequent originations. Bank card income relates to commercial purchasing cards. The increase is due to the credit card portfolio purchase at the end of the second quarter of 2011.
103
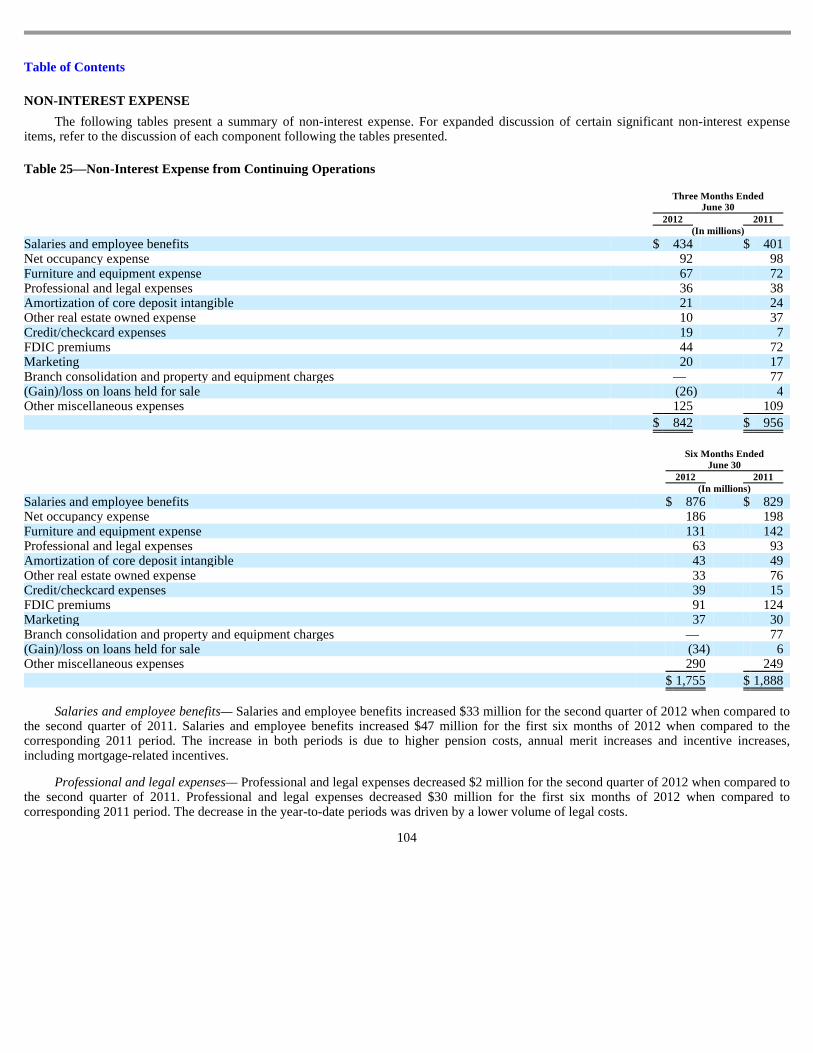
Table of Contents
NON-INTEREST EXPENSE
The following tables present a summary of non-interest expense. For expanded discussion of certain significant non-interest expense items, refer to the discussion of each component following the tables presented.
Table 25—Non-Interest Expense from Continuing Operations
Salaries and employee benefits— Salaries and employee benefits increased $33 million for the second quarter of 2012 when compared to the second quarter of 2011. Salaries and employee benefits increased $47 million for the first six months of 2012 when compared to the corresponding 2011 period. The increase in both periods is due to higher pension costs, annual merit increases and incentive increases, including mortgage-related incentives.
Professional and legal expenses— Professional and legal expenses decreased $2 million for the second quarter of 2012 when compared to the second quarter of 2011. Professional and legal expenses decreased $30 million for the first six months of 2012 when compared to corresponding 2011 period. The decrease in the year-to-date periods was driven by a lower volume of legal costs.
104
Three Months Ended
June 30 2012 2011 (In millions)
Salaries and employee benefits $ 434 $ 401 Net occupancy expense 92 98 Furniture and equipment expense 67 72 Professional and legal expenses 36 38 Amortization of core deposit intangible 21 24 Other real estate owned expense 10 37 Credit/checkcard expenses 19 7 FDIC premiums 44 72 Marketing 20 17 Branch consolidation and property and equipment charges — 77 (Gain)/loss on loans held for sale (26 ) 4 Other miscellaneous expenses 125 109
$ 842 $ 956
Six Months Ended
June 30 2012 2011 (In millions)
Salaries and employee benefits $ 876 $ 829 Net occupancy expense 186 198 Furniture and equipment expense 131 142 Professional and legal expenses 63 93 Amortization of core deposit intangible 43 49 Other real estate owned expense 33 76 Credit/checkcard expenses 39 15 FDIC premiums 91 124 Marketing 37 30 Branch consolidation and property and equipment charges — 77 (Gain)/loss on loans held for sale (34 ) 6 Other miscellaneous expenses 290 249
$ 1,755 $ 1,888
Table of Contents
Other real estate owned expense— Other real estate owned (“OREO”) expense includes the cost of adjusting foreclosed properties to estimated fair value after these assets have been classified as OREO, net gains and losses on sales of properties, and other costs to maintain the property such as property taxes, security, and grounds maintenance. OREO expense decreased $27 million for the second quarter of 2012 when compared to the second quarter of 2011. OREO expense decreased $43 million for the first six months of 2012 when compared to the corresponding 2011 period. The decline in expense was due to lower OREO balances and stabilizing real estate values.
FDIC premiums— FDIC premiums decreased $28 million for the second quarter of 2012 when compared to the second quarter of 2011. FDIC premiums decreased $33 million for the first six months of 2012 when compared to the corresponding 2011 period. The decreases are related to lower assets, improving credit quality and changes in balance sheet mix, all of which impact the premium calculation.
Branch consolidation and property and equipment charges— The Company recorded $77 million in valuation charges during the second quarter of 2011 related to lower of cost or market adjustments on owned branch property, terminated ground leases, and impairment of other equipment. The charges were driven primarily by the Company’s decision to consolidate 40 branches.
(Gain)/loss on loans held for sale— The Company recorded a $26 million reduction in non-interest expense for the second quarter of 2012 and a $34 million reduction of non-interest expense for the first six months of 2012 related to gains on loans held for sale. The Company recorded losses on loans held for sale of $4 million and $6 million for the second quarter and first six months of 2011, respectively. The improvement for both periods relates to completed sales and paydowns of individual loans at amounts in excess of carrying value.
Other miscellaneous expenses —Other miscellaneous expenses increased $16 million for the second quarter of 2012 as compared to the same period of 2011, and $41 million for the first six months of 2012 as compared to the corresponding 2011 period. Higher levels of amortization of intangible assets, driven by the June 30, 2011 credit card portfolio purchase, contributed to the overall increase. This item also includes expenses for communications, postage, supplies, certain credit-related costs and business development services.
INCOME TAXES
The Company’s income tax expense from continuing operations for the three months ended June 30, 2012 was $126 million compared to an income tax benefit of $34 million for the same period in 2011, resulting in effective tax rates of 26.4 percent and (75.6) percent, respectively. Income tax expense from continuing operations for the six months ended June 30, 2012 was $208 million compared to an income tax benefit of $63 million for the same period in 2011, resulting in effective tax rates of 26.1 percent and (95.5) percent, respectively. The increase in income tax expense for the three and six months ended June 30, 2012 is due to positive consolidated pre-tax earnings offset by a net benefit of $23 million recognized in the second quarter of 2012 associated with the following items: effective settlement of the 2007, 2008 and 2009 tax years with the Internal Revenue Service (“IRS”), an increase in the deferred tax asset valuation allowance and an increase in unrecognized tax benefits.
The Company has established a valuation allowance for deferred tax assets in the amount of $59 million at June 30, 2012 and $32 million at December 31, 2011. The Company continually assesses the recoverability of its deferred tax assets based on a process that evaluates all available positive and negative evidence, including the impact of prudent and feasible tax planning strategies. The impact of such tax planning strategies is dependent on, among other things, the timing of implementation and the resulting taxable income. During the period ended June 30, 2012, it was determined that several tax planning strategies focused on utilization of state net operating losses may not occur in a time period that allows for the utilization within the prescribed carryforward periods. As a result, the valuation allowance was increased related to certain state tax net operating losses by $27 million. If the implementation of these tax planning strategies is delayed in future periods, an additional valuation allowance against state net operating losses may be possible.
105
Table of Contents
During the second quarter, the Company reached an agreement with the IRS that effectively settled the examination of the tax years 2007, 2008 and 2009. At this time, the Company has no expectation that any tax positions related to the settlement will be reexamined. The years subsequent to these years are open to examination.
The Company completed the sale of Morgan Keegan and related affiliates to Raymond James on April 2, 2012. Raymond James and the Company have until 2013 to finalize income tax elections that will determine the tax characterization of the sale. The Company has reflected the transaction as if Raymond James purchased the assets of the entities for tax purposes. In future periods, if it is ultimately decided that the transaction is not an asset sale, the Company could reflect additional income tax expense within discontinued operations, which would not materially impact the Company’s financial position or regulatory capital.
The Company’s effective tax rate is affected by recurring items such as affordable housing tax credits, bank-owned life insurance and tax-exempt income, which are expected to be consistent in the near term. The effective tax rate is also affected by items that may occur in any given period but are not consistent from period to period, such as the termination of certain leveraged leases. Accordingly, future period effective tax rates may not be comparable to the current period.
See Note 11 “Income Taxes” to the consolidated financial statements for additional information about taxes.
DISCONTINUED OPERATIONS
Regions reported income from discontinued operations of $4 million, or $0.00 per diluted common share, for the second quarter of 2012, compared to income of $30 million, or $0.02 per diluted common share, for the second quarter of 2011. Morgan Keegan was sold on April 2, 2012. Included in discontinued operations during the second quarter of 2012 were an estimated pre-tax gain on sale of $15 million, largely offset by professional and legal expenses. For the six months ended June 30, 2012, Regions reported a loss from discontinued operations of $36 million, or ($0.03) per diluted common share, compared to income of $49 million, or $0.04 per diluted common share, for the six months ended June 30, 2011. Higher professional and legal costs drove the loss from discontinued operations.
Reference is made to pages 98 through 101 included in Management’s Discussion and Analysis.
Based on an evaluation, as of the end of the period covered by this Form 10-Q, under the supervision and with the participation of Regions’ management, including its Chief Executive Officer and Chief Financial Officer, the Chief Executive Officer and Chief Financial Officer have concluded that Regions’ disclosure controls and procedures (as defined in Rule 13a-15(e) under the Securities Exchange Act of 1934) are effective. During the quarter ended June 30, 2012, there have been no changes in Regions’ internal control over financial reporting that have materially affected, or are reasonably likely to materially affect, Regions’ internal control over financial reporting.
106
Item 3. Quantitative and Qualitative Disclosures about Market Risk
Item 4. Controls and Procedures
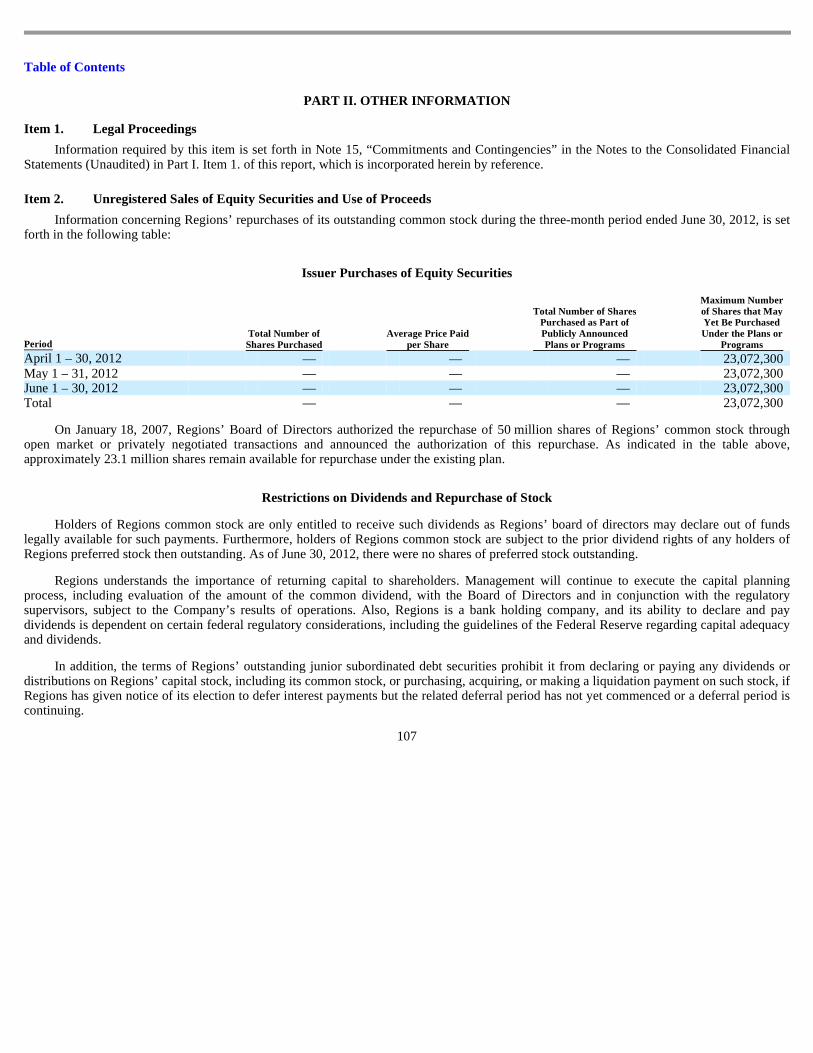
Table of Contents
PART II. OTHER INFORMATION
Information required by this item is set forth in Note 15, “Commitments and Contingencies” in the Notes to the Consolidated Financial Statements (Unaudited) in Part I. Item 1. of this report, which is incorporated herein by reference.
Information concerning Regions’ repurchases of its outstanding common stock during the three-month period ended June 30, 2012, is set forth in the following table:
Issuer Purchases of Equity Securities
On January 18, 2007, Regions’ Board of Directors authorized the repurchase of 50 million shares of Regions’ common stock through open market or privately negotiated transactions and announced the authorization of this repurchase. As indicated in the table above, approximately 23.1 million shares remain available for repurchase under the existing plan.
Restrictions on Dividends and Repurchase of Stock
Holders of Regions common stock are only entitled to receive such dividends as Regions’ board of directors may declare out of funds legally available for such payments. Furthermore, holders of Regions common stock are subject to the prior dividend rights of any holders of Regions preferred stock then outstanding. As of June 30, 2012, there were no shares of preferred stock outstanding.
Regions understands the importance of returning capital to shareholders. Management will continue to execute the capital planning process, including evaluation of the amount of the common dividend, with the Board of Directors and in conjunction with the regulatory supervisors, subject to the Company’s results of operations. Also, Regions is a bank holding company, and its ability to declare and pay dividends is dependent on certain federal regulatory considerations, including the guidelines of the Federal Reserve regarding capital adequacy and dividends.
In addition, the terms of Regions’ outstanding junior subordinated debt securities prohibit it from declaring or paying any dividends or distributions on Regions’ capital stock, including its common stock, or purchasing, acquiring, or making a liquidation payment on such stock, if Regions has given notice of its election to defer interest payments but the related deferral period has not yet commenced or a deferral period is continuing.
107
Item 1. Legal Proceedings
Item 2. Unregistered Sales of Equity Securities and Use of Proceeds
Period Total Number of Shares Purchased
Average Price Paid per Share
Total Number of Shares Purchased as Part of Publicly Announced Plans or Programs
Maximum Number of Shares that May Yet Be Purchased Under the Plans or
Programs
April 1 – 30, 2012 — — — 23,072,300 May 1 – 31, 2012 — — — 23,072,300 June 1 – 30, 2012 — — — 23,072,300 Total — — — 23,072,300

Table of Contents
The following is a list of exhibits including items incorporated by reference
108
Item 6. Exhibits
3.1
Amended and Restated Certificate of Incorporation. The attached Exhibit 3.1 is for the sole purpose of refiling the Amended and Restated Certificate of Incorporation of Regions Financial Corporation as filed with the Secretary of State of the State of Delaware on May 13, 2010 to remove the Certificate of Designations of Fixed Rate Cumulative Perpetual Preferred Stock, Series A and the Certificate of Designations of 10% Mandatory Convertible Preferred Stock, Series B.
3.2
By-laws as amended and restated, incorporated by reference to Exhibit 3.2 to Form 8-K Current Report filed by registrant on May 14, 2010
10.1
Amendment to Certain Equity-based Awards Granted to John C. Carson, Jr. under the Regions Financial Corporation 2010 Long Term Incentive Plan and the Regions Financial Corporation 2006 Long Term Incentive Plan, incorporated by reference to Exhibit 10.1 to Form 8-K Current Report filed by registrant on April 2, 2012
10.2
Regions Financial Corporation Amended and Restated Management Incentive Plan, incorporated by reference to Exhibit 10.1 to Form 8-K Current Report filed by registrant on May 25, 2012
10.3
Form of Notice and Form of Restricted Stock Unit Award Agreement, incorporated by reference to Exhibit 10.2 to Form 8- K Current Report filed by registrant on May 25, 2012
10.4
Form of Notice and Form of Performance Stock Unit Award Agreement, incorporated by reference to Exhibit 10.3 to Form 8-K Current Report filed by registrant on May 25, 2012
10.5
Form of Notice and Form of Performance Unit Award Agreement, incorporated by reference to Exhibit 10.4 to Form 8-K Current Report filed by registrant on May 25, 2012
12 Computation of Ratio of Earnings to Fixed Charges
31.1 Certification of Chief Executive Officer pursuant to Section 302 of the Sarbanes-Oxley Act of 2002
31.2 Certification of Chief Financial Officer pursuant to Section 302 of the Sarbanes-Oxley Act of 2002
32 Certification pursuant to 18 U.S.C. Section 1350, as adopted pursuant to Section 906 of the Sarbanes-Oxley Act of 2002
101 Interactive Data File

Table of Contents
SIGNATURES
Pursuant to the requirements of the Securities Exchange Act of 1934, the registrant has duly caused this report to be signed on its behalf by undersigned thereunto duly authorized.
109
DATE: August 6, 2012 Regions Financial Corporation
/ S / H ARDIE B. K IMBROUGH , J R .
Hardie B. Kimbrough, Jr. Executive Vice President and Controller
(Chief Accounting Officer and Authorized Officer)

Exhibit 3.1
AMENDED AND RESTATED
CERTIFICATE OF INCORPORATION
OF
REGIONS FINANCIAL CORPORATION
Regions Financial Corporation (the “Corporation”), a Delaware corporation, hereby certifies as follows:
First. The name of the Corporation is Regions Financial Corporation.
Second. The original certificate of incorporation of the Corporation was filed with the Secretary of State of the State of Delaware on February 13, 2004, under the name New Regions Financial Corporation. The name of the Corporation was changed to Regions Financial Corporation on July 1, 2004.
Third. This Amended and Restated Certificate of Incorporation amends, restates and integrates the provisions of the Restated Certificate of Incorporation of the Corporation and has been duly adopted in accordance with the provisions of Section 242 and 245 of the General Corporation Law of the State of Delaware by the approval of the holders of a majority of the outstanding stock entitled to vote thereon.
Fourth. The text of the Restated Certificate of Incorporation of the Corporation is amended and restated to read in full as follows:

AMENDED AND RESTATED CERTIFICATE OF INCORPORATION O F REGIONS FINANCIAL CORPORATION
FIRST. The name of the corporation is Regions Financial Corporation.
SECOND. The address of its registered office in the State of Delaware is 2711 Centerville Road in the City of Wilmington, County of New Castle. The name of the registered agent at such address is Corporation Service Company. The principal office of the corporation shall be in the State of Alabama and shall be located in the City of Birmingham, County of Jefferson. Directors’ meetings (unless from time to time specifically otherwise ordered by the Board of Directors) and appropriate corporate functions shall be held in Birmingham. The chief executive officer may, for his convenience, in discharging his duties, locate at whatever place he deems desirable the necessary secretarial and personal assistants for the efficient operation of his office. The corporation may have such other offices, either within or without the State of Alabama, as the Board of Directors may designate or as the business of the corporation may require from time to time. Specialized personnel, such as auditors, examiners, public relation officers, etc., shall be located in such cities as the Directors may from time to time order.
THIRD. The purpose of the corporation is to engage in any lawful act or activity for which corporations may be organized under the General Corporation Law of Delaware.
FOURTH. The total number of shares of all classes of stock which the corporation shall have the authority to issue is Three Billion Ten Million (3,010,000,000) of which Three Billion (3,000,000,000) shares are to be common stock (hereinafter called the “Common Stock”), of a par value of one cent ($.01) each, and Ten Million (10,000,000) shares are to be Preferred Stock (hereinafter called the “Preferred Stock”) of the par value of one dollar ($1) each.
(1) Shares of Preferred Stock may be issued in one or more series from time to time by the board of directors, and the board of directors is expressly authorized to fix by resolution or resolutions the designations and the powers, preferences and rights, and the qualifications, limitations and restrictions thereof, of the shares of each series of Preferred Stock, including without limitation the following:
(a) the distinctive serial designation of such series which shall distinguish it from other series;
(b) the number of shares included in such series;
(c) the dividend rate (or method of determining such rate) payable to the holders of the shares of such series, any conditions upon which such dividends shall be paid and the date or dates upon which such dividends shall be payable;
(d) whether dividends on the shares of such series shall be cumulative and, in the case of shares of any series having cumulative dividend rights, the date or dates or method of determining the date or dates from which dividends on the shares of such series shall be cumulative;
(e) the amount or amounts which shall be payable out of the assets of the corporation to the holders of the shares of such series upon voluntary or involuntary liquidation, dissolution, or winding up the corporation, and the relative rights of priority, if any, of payment of the shares of such series;
(f) the price or prices at which, the period or periods within which and the terms and conditions upon which the shares of such series may be redeemed, in whole or in part, at the option of the corporation or at the option of the holder or holders thereof or upon the happening of a specified event or events;
1

(2) Subject to the rights of the holders of any series of Preferred Stock, the number of authorized shares of any class or series of Preferred Stock set forth in this certificate of incorporation, as it may be amended from time to time, may be increased or decreased (but not below the number of shares thereof then outstanding) by the affirmative vote of the holders of a majority of the outstanding shares of such class or series, voting together as a single class, irrespective of the provisions of Section 242(b)(2) of the General Corporation Law of Delaware or any corresponding provision hereafter enacted.
(3) Authority is hereby expressly granted to the Board of Directors from time to time to issue any authorized but unissued shares of Common Stock for such consideration and on such terms as it may determine.
FIFTH. [Reserved].
SIXTH. The corporation is to have perpetual existence.
SEVENTH. In furtherance and not in limitation of the powers conferred by statute, the Board of Directors is expressly authorized:
(1) To make, alter or repeal the by-laws of the corporation, except as otherwise may be provided by such by-laws.
(2) To authorize and cause to be executed mortgages and liens upon the real and personal property of the corporation.
(3) To declare such lawful dividends, either in cash or stock of the corporation, as in its discretion it may deem advisable.
(4) To set apart out of any of the funds of the corporation available for dividends a reserve or reserves for any proper purposes and to abolish any such reserve in the manner in which it was created.
(5) To fix the number of Directors which shall constitute the whole Board, subject to the following:
(a) The number of Directors constituting the entire Board shall be fixed from time to time by vote of a majority of the entire Board except as may be otherwise provided in the By-Laws of the corporation, provided, however, that the number of Directors shall not be reduced so as to shorten the term of any Director at the time in office.
(b) All Directors will be elected annually for terms of one year and shall continue to hold office until the end of the term for which such director was elected and until such director’s successor shall have been elected and qualified. At each annual meeting of stockholders all directors shall be elected for terms expiring at the next annual meeting of stockholders and until such directors’successors shall have
2
(g) the obligation, if any, of the corporation to purchase or redeem shares of such series pursuant to a sinking fund or otherwise
and the price or prices at which, the period or periods within which and the terms and conditions upon which the shares of such series shall be redeemed or purchased, in whole or in part, pursuant to such obligation;
(h) whether or not the shares of such series shall be convertible or exchangeable, at any time or times at the option of the holder or holders thereof or at the option of the corporation or upon the happening of a specified event or events, into shares of any other class or classes or any other series of the same or any other class or classes of stock of the corporation, and the price or prices or rate or rates of exchange or conversion and any adjustments applicable thereto; and
(i) whether or not the holders of the shares of such series shall have voting rights, in addition to the voting rights provided by
law (if any), and if so the terms of such voting rights.
been elected and qualified. Except as otherwise provided in the By-Laws of the corporation, any vacancies in the Board of Directors for any reason, and any created directorships resulting from any increase in the number of Directors may be filled by the Board of Directors, acting by a majority of Directors then in office, although less than a quorum. Any Directors so chosen shall hold office until the end of the term to which such Directors’ predecessors were elected and until their successors shall be elected and qualified. No decrease in the number of Directors shall shorten the term of any incumbent Director.
(c) Notwithstanding any other provisions of this certificate of incorporation or the By-Laws of the corporation (and notwithstanding the fact that some lesser percentage may be specified by law, this certificate of incorporation or the By-Laws of the corporation), any Director or the entire Board of Directors of the corporation may be removed at any time, with or without cause but only by the affirmative vote of the holders of a majority of the outstanding shares of capital stock of the corporation entitled to vote generally in the election of Directors cast at a meeting of the stockholders called for that purpose.
(d) In the event that the holders of any class or series of stock of the corporation shall be entitled, voting separately as a class, to elect any directors of the corporation, then the number of directors that may be elected by such holders shall be in addition to the number fixed pursuant to the By-Laws and, except as otherwise expressly provided in the terms of such class or series, the terms of the directors elected by such holders shall expire at the annual meeting of stockholders next succeeding their election.
(6)(a) Except as set forth in Clause (d) of this paragraph (6) of Article Seventh, the affirmative vote of the holders of at least 75% of the outstanding shares of the corporation entitled to vote in election of Directors shall be required to effect or validate:
(1) any merger or consolidation with or into any other corporation, or
(2) any sale or lease of all or a substantial part of the assets of the corporation to any other corporation, person or other entity,
if, in the case of both (1) and (2), as of the record date for determination of stockholders entitled to notice thereof and to vote thereon, such other corporation, person or entity which is party to such a transaction is the beneficial owner, directly or indirectly, of 5% or more of the outstanding shares of the corporation entitled to vote in elections of directors. Such affirmative vote shall be in addition to any vote of the holders of the shares of the corporation otherwise required by law, this certificate of incorporation or any agreement between the corporation and any national securities exchange.
(b) For purpose of this paragraph (6) any corporation, person or other entity shall be deemed to be the beneficial owner of any shares of the corporation:
(1) which it owns directly, whether or not of record, or
(2) which it has the right to acquire pursuant to any agreement or understanding or upon exercise of conversion rights, warrants or options or otherwise, or
(3) which are beneficially owned, directly or indirectly (including shares deemed to be owned through application of clause (2) above), by an “affiliate” or “associate” as those terms are defined in Rule 12b-2 of the General Rules and Regulations under the Securities Exchange Act of 1934, as amended and in effect on April 1, 2004, or
(4) which are beneficially owned, directly or indirectly (including shares deemed owned through application of clause (2) above), by any other corporation, person or entity with which it or its “affiliate” or “associate” has any agreement or arrangement or understanding for the purpose of acquiring, holding, voting, or disposing of shares of the corporation. For the purpose of determining whether a specific corporation, person or entity is the beneficial owner of one or more of the outstanding shares of the corporation, the outstanding shares of the corporation shall include shares not in fact outstanding but
3

deemed owned through the application of clauses (b)(2)(3) and (4) above by such corporation, person or entity, but shall not include any other shares which may be issuable pursuant to any agreement or upon exercise of conversion rights, warrants or options or otherwise.
(c) The Board of Directors shall have the power and duty to determine for the purposes of this paragraph (6), on the basis of information known to the corporation, whether:
(1) such other corporation or entity beneficially owns more than 5% of the outstanding shares of the corporation entitled to vote in elections of Directors;
(2) a corporation, person, or entity is an “affiliate” or “associate” (as defined in paragraph (b) above) of another; and
(3) the memorandum of understanding referred to in clause (d) below is substantially consistent with the transaction covered thereby.
Any such determination shall be conclusive and binding for all purposes of this paragraph (6).
(d) The provisions of this paragraph (6) shall not apply to:
(1) any transaction of a type addressed by paragraph 6(a)(1) or (2) if the Board of Directors of the corporation has approved a memorandum of understanding or other written agreement providing for such transaction with such other corporation prior to the time that such other corporation shall have become the beneficial owner of more than 5% of the outstanding shares of the corporation entitled to vote in elections of Directors; or after such acquisition of 5% of the outstanding shares, if 75% or more of the entire Board of Directors approve such transaction prior to its consummation; or
(2) any merger or consolidation of the corporation with, or any sale or lease by the corporation or any subsidiary thereof of any assets of, or any sale or lease by the corporation or any subsidiary thereof of any of its assets to, any corporation of which a majority of the outstanding shares of all classes of stock entitled to vote in election of Directors is owned of record or beneficially by the corporation and its subsidiaries.
EIGHTH. Elections of directors need not be written ballot except and to the extent provided in the by-laws of the corporation or directed by a majority of the entire Board of Directors.
NINTH. No action required to be taken or which may be taken at any annual or special meeting of stockholders of the corporation may be taken without a meeting, and the power of stockholders to consent in writing, without a meeting, to the taking of any action is specifically denied.
TENTH. (1) The corporation shall indemnify its officers, directors, employees and agents to the fullest extent permitted by law.
(2) No director of the corporation shall be personally liable to the corporation or its stockholders for monetary damages, for breach of fiduciary duty as a director, except for liability (i) for any breach of the director’s duty of loyalty to the corporation or its stockholders; (ii) for acts or omissions not in good faith or which involve intentional misconduct or a knowing violation of law; (iii) under Section 174 of the Delaware General Corporation Law; or (iv) for any transaction from which the director derived an improper personal benefit.
ELEVENTH. Whenever a compromise or arrangement is proposed between this corporation and its creditors or any class of them and/or between this corporation and its stockholders or any class of them, any court of equitable jurisdiction within the State of Delaware may, on this application in a summary way of this corporation or of any creditor or stockholder thereof, or on the application of any receiver or receivers appointed for this corporation under the provisions of Section 291 of Title 8 of the Delaware Code or on the application of trustees in dissolution or of any receiver or receivers appointed for this corporation under the provisions of Section 279 of Title 8 of the Delaware Code order a meeting of the creditors or class of creditors, and/or of the
4
stockholders or class of stockholders of this corporation, as the case may be, to be summoned in such manner as the said court directs. If a majority in number representing three-fourths in value of the creditors or class of creditors, and/or of the stockholders or class of stockholders of this corporation, as the case may be, agree to any compromise or arrangement and to any reorganization of this corporation as consequence of such compromise or arrangement, the said compromise or arrangement and the said application has been made, be binding on all the creditors or class of creditors, and/or on all the stockholders or class of stockholders, of this corporation, as the case may be, and also on this corporation.
TWELFTH. The corporation reserves the right to amend, alter, change or repeal any provision contained in this certificate of incorporation, in the manner now or hereafter prescribed by statute, and all rights conferred upon stockholders herein are granted subject to this reservation.
As provided in Article Seventh, paragraph (1), the Board of Directors is expressly authorized to make, alter or repeal By-Laws of the corporation by a vote of a majority of the entire Board except as otherwise provided in the By-Laws; and the stockholders may make, alter or repeal any By-Laws whether or not adopted by them, provided however, that any such additional By-Laws, alterations or repeal by the stockholders may be adopted only by the affirmative vote of the holders of 75% or more of the outstanding shares of capital stock of the corporation entitled to vote generally in the election of Directors (considered for this purpose as one class) at a meeting of stockholders called for such purpose.
Notwithstanding any other provision of this certificate of incorporation or the By-Laws of the corporation (and in addition to any other vote that may be required by law, this certificate of incorporation or the By-Laws) the affirmative vote of the holders of at least 75% of the outstanding shares of the capital stock of the corporation entitled to vote generally in the election of Directors (considered for this purpose as one class) shall be required to amend, alter or repeal or adopt any provision inconsistent with Article Seventh paragraph (5)(a), Article Seventh paragraph (5)(d), Article Seventh paragraph (6), Article Ninth, Article Tenth or Article Twelfth of the certificate of incorporation.
THIRTEENTH. This amended and restated certificate of incorporation shall become effective on May 13, 2010.
5

EXHIBIT 12
Regions Financial Corporation
Computation of Ratio of Earnings to Fixed Charges
(from continuing operations)
(Unaudited)
Three Months Ended
June 30 Six Months Ended
June 30 2012 2011 2012 2011 (Amounts in millions)
Excluding Interest on Deposits
Income from continuing operations before income taxes $ 477 $ 45 $ 798 $ 66 Fixed charges excluding preferred stock dividends and accretion 93 108 188 218
Income for computation excluding interest on deposits 570 153 986 284
Interest expense excluding interest on deposits 80 94 162 190 One-third of rent expense 13 14 26 28 Preferred stock dividends and accretion 71 54 125 106
Fixed charges including preferred stock dividends and accretion 164 162 313 324
Ratio of earnings to fixed charges, excluding interest on deposits 3.48x 0.94x 3.15x 0.88x
Including Interest on Deposits
Income from continuing operations before income taxes $ 477 $ 45 $ 798 $ 66 Fixed charges excluding preferred stock dividends and accretion 169 234 352 483
Income for computation including interest on deposits 646 279 1,150 549
Interest expense including interest on deposits 156 220 326 455 One-third of rent expense 13 14 26 28 Preferred stock dividends and accretion 71 54 125 106
Fixed charges including preferred stock dividends and accretion 240 288 477 589
Ratio of earnings to fixed charges, including interest on deposits 2.69x 0.97x 2.41x 0.93x

EXHIBIT 31.1
CERTIFICATION
I, O.B. Grayson Hall, Jr., certify that:
1. I have reviewed this quarterly report on Form 10-Q of Regions Financial Corporation; 2. Based on my knowledge, this report does not contain any untrue statement of a material fact or omit to state a material fact necessary to
make the statements made, in light of the circumstances under which such statements were made, not misleading with respect to the period covered by this report;
3. Based on my knowledge, the financial statements, and other financial information included in this report, fairly present in all material respects the financial condition, results of operations and cash flows of the registrant as of, and for, the periods presented in this report;
4. The registrant’s other certifying officer and I are responsible for establishing and maintaining disclosure controls and procedures (as defined in Exchange Act Rules 13a-15(e) and 15d-15(e)) and internal control over financial reporting (as defined in Exchange Act Rules 13a-15(f) and 15d-15(f)) for the registrant and have:
a) Designed such disclosure controls and procedures, or caused such disclosure controls and procedures to be designed under our
supervision, to ensure that material information relating to the registrant, including its consolidated subsidiaries, is made known to us by others within those entities, particularly during the period in which this report is being prepared;
b) Designed such internal control over financial reporting, or caused such internal control over financial reporting to be designed under
our supervision, to provide reasonable assurance regarding the reliability of financial reporting and the preparation of financial statements for external purposes in accordance with generally accepted accounting principles;
c) Evaluated the effectiveness of the registrant’s disclosure controls and procedures and presented in this report our conclusions about
the effectiveness of the disclosure controls and procedures, as of the end of the period covered by this report based on such evaluation; and
d) Disclosed in this report any change in the registrant’s internal control over financial reporting that occurred during the registrant’s
most recent fiscal quarter (the registrant’s fourth fiscal quarter in the case of an annual report) that has materially affected, or is reasonably likely to materially affect, the registrant’s internal control over financial reporting; and
5. The registrant’s other certifying officer and I have disclosed, based on our most recent evaluation of internal control over financial reporting, to the registrant’s auditors and the audit committee of the registrant’s board of directors (or persons performing the equivalent functions):
a) All significant deficiencies and material weaknesses in the design or operation of internal control over financial reporting which are
reasonably likely to adversely affect the registrant’s ability to record, process, summarize and report financial information; and
b) Any fraud, whether or not material, that involves management or other employees who have a significant role in the registrant’s
internal control over financial reporting.
Date: August 6, 2012 /s/ O. B. G RAYSON H ALL , J R . O. B. Grayson Hall, Jr. Chief Executive Officer

EXHIBIT 31.2
CERTIFICATION
I, David J. Turner, Jr., certify that:
1. I have reviewed this quarterly report on Form 10-Q of Regions Financial Corporation; 2. Based on my knowledge, this report does not contain any untrue statement of a material fact or omit to state a material fact necessary to
make the statements made, in light of the circumstances under which such statements were made, not misleading with respect to the period covered by this report;
3. Based on my knowledge, the financial statements, and other financial information included in this report, fairly present in all material respects the financial condition, results of operations and cash flows of the registrant as of, and for, the periods presented in this report;
4. The registrant’s other certifying officer and I are responsible for establishing and maintaining disclosure controls and procedures (as defined in Exchange Act Rules 13a-15(e) and 15d-15(e)) and internal control over financial reporting (as defined in Exchange Act Rules 13a-15(f) and 15d-15(f)) for the registrant and have:
a) Designed such disclosure controls and procedures, or caused such disclosure controls and procedures to be designed under our
supervision, to ensure that material information relating to the registrant, including its consolidated subsidiaries, is made known to us by others within those entities, particularly during the period in which this report is being prepared;
b) Designed such internal control over financial reporting, or caused such internal control over financial reporting to be designed under
our supervision, to provide reasonable assurance regarding the reliability of financial reporting and the preparation of financial statements for external purposes in accordance with generally accepted accounting principles;
c) Evaluated the effectiveness of the registrant’s disclosure controls and procedures and presented in this report our conclusions about
the effectiveness of the disclosure controls and procedures, as of the end of the period covered by this report based on such evaluation; and
d) Disclosed in this report any change in the registrant’s internal control over financial reporting that occurred during the registrant’s
most recent fiscal quarter (the registrant’s fourth fiscal quarter in the case of an annual report) that has materially affected, or is reasonably likely to materially affect, the registrant’s internal control over financial reporting; and
5. The registrant’s other certifying officer and I have disclosed, based on our most recent evaluation of internal control over financial reporting, to the registrant’s auditors and the audit committee of the registrant’s board of directors (or persons performing the equivalent functions):
a) All significant deficiencies and material weaknesses in the design or operation of internal control over financial reporting which are
reasonably likely to adversely affect the registrant’s ability to record, process, summarize and report financial information; and
b) Any fraud, whether or not material, that involves management or other employees who have a significant role in the registrant’s
internal control over financial reporting.
Date: August 6, 2012 /s/ D AVID J. T URNER , J R . David J. Turner, Jr. Chief Financial Officer

EXHIBIT 32
CERTIFICATION PURSUANT TO 18 U.S.C. SECTION 1350,
AS ADOPTED PURSUANT TO SECTION 906 OF THE SARBANES-OXLEY ACT OF 2002
In connection with the Quarterly Report of Regions Financial Corporation (the “Company”) on Form 10-Q for the quarter ending June 30, 2012 (the “Report”), I, O.B. Grayson Hall, Jr., Chief Executive Officer of the Company, and David J. Turner, Jr., Chief Financial Officer of the Company, certify, pursuant to 18 U.S.C. § 1350, as adopted pursuant to § 906 of the Sarbanes-Oxley Act of 2002, that to our knowledge:
August 6, 2012
A signed original of this written statement required by Section 906, or other document authenticating, acknowledging, or otherwise adopting the signatures that appear in typed form within the electronic version of this written statement required by Section 906, has been provided to Regions Financial Corporation and will be retained by Regions Financial Corporation and furnished to the Securities and Exchange Commission or its staff upon request.
1) The Report fully complies with the requirements of Section 13(a) or 15(d) of the Securities Exchange Act of 1934; and
2) The information contained in the Report fairly presents, in all material respects, the financial condition and results of operations of
the Company.
/s/ O. B. G RAYSON H ALL , J R . /s/ D AVID J. T URNER , J R . O. B. Grayson Hall, Jr. David J. Turner, Jr. Chief Executive Officer Chief Financial Officer