regionalisation is key to establishing reference ... · regionalisation is key to establishing...
TRANSCRIPT
© CSIRO 2018 Marine and Freshwater Research, 2018, 69, 82–94https://doi.org/10.1071/MF16381_AC
Page 1 of 19
Supplementary material
Regionalisation is key to establishing reference conditions
for neotropical savanna streams
Isabela MartinsA,E, Raphael LigeiroB, Robert M. HughesC,
Diego R. MacedoD and Marcos CallistoA
ALaboratório de Ecologia de Bentos, Departamento de Biologia Geral,
Instituto de Ciências Biológicas, Universidade Federal de Minas Gerais,
Avenida Antônio Carlos 6627, CP 486, CEP 31270-901, Belo Horizonte, MG, Brazil.
BLaboratório de Ecologia e Conservação, Instituto de Ciências Biológicas,
Universidade Federal do Pará, Rua Augusto Corrêa 01, CEP 66075-110, Belém, PA, Brazil.
CAmnis Opes Institute and Department of Fisheries and Wildlife, Oregon State University,
104 Nash Hall, Corvallis, OR 97331-4501, USA.
DDepartamento de Geografia, Instituto de Geociências, Universidade Federal de Minas Gerais,
Avenida Antônio Carlos 6627, CEP 31270-901, Belo Horizonte, MG, Brazil.
ECorresponding author. Email: [email protected]

Marine and Freshwater Research © CSIRO 2018
https://doi.org/10.1071/MF16381_AC
Page 2 of 19
(a)
Fig. S1. Used GIS layers to discriminate Landscape Units in Nova Ponte Hydrologic Unit (a)
Temperature; (b) Precipitation; (c) Geology; (d) Physiography.

Marine and Freshwater Research © CSIRO 2018
https://doi.org/10.1071/MF16381_AC
Page 3 of 19
(b)
Fig. S1. (Cont.)

Marine and Freshwater Research © CSIRO 2018
https://doi.org/10.1071/MF16381_AC
Page 4 of 19
(c)
Fig. S1. (Cont.)

Marine and Freshwater Research © CSIRO 2018
https://doi.org/10.1071/MF16381_AC
Page 5 of 19
(d)
Fig. S1. (Cont.)

Marine and Freshwater Research © CSIRO 2018
https://doi.org/10.1071/MF16381_AC
Page 6 of 19
Fig. S2. Multidimensional scaling (MDS) ordination showing enviromental (temperature, preciptation,
geology, slope, elevation and rougness) similarities among 31 sites. Landscape Units are represented by
symbols as follow: cyan square: Salitre Unit; blue down triangle: Quebra-Anzol Unit; green up triangle:
Canastra Unit.
Marine and Freshwater Research © CSIRO 2018
https://doi.org/10.1071/MF16381_AC
Page 7 of 19
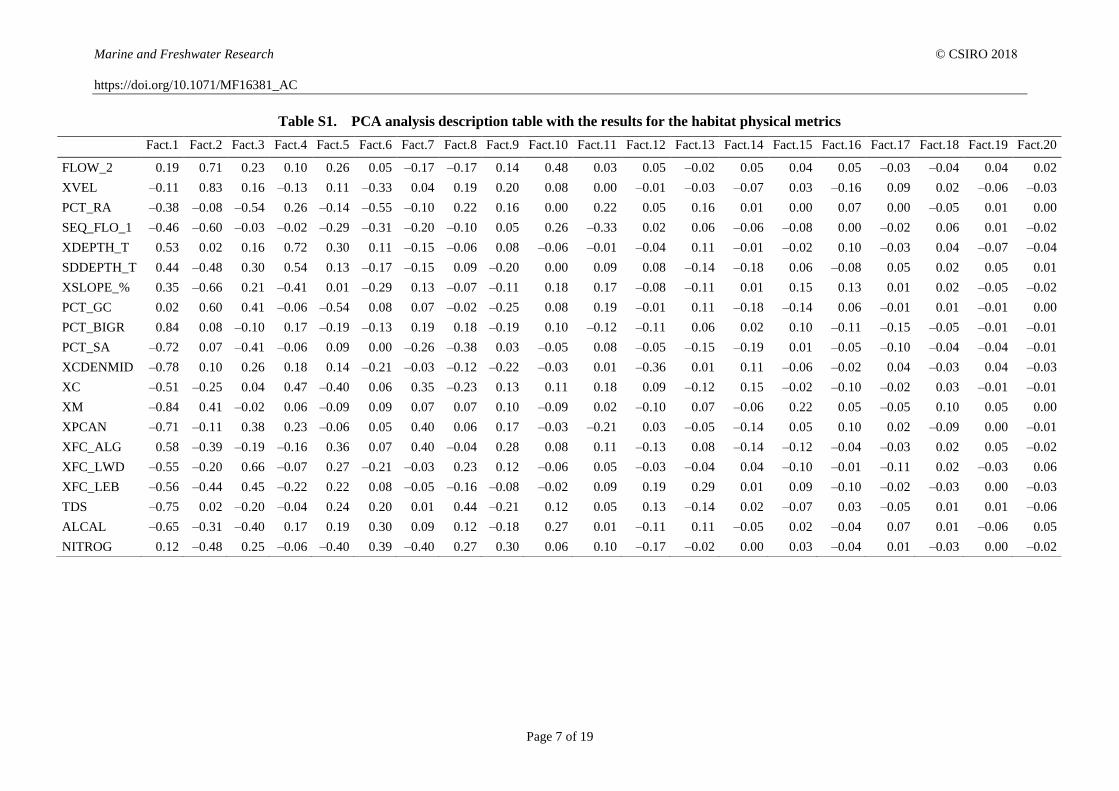
Table S1. PCA analysis description table with the results for the habitat physical metrics
Fact.1 Fact.2 Fact.3 Fact.4 Fact.5 Fact.6 Fact.7 Fact.8 Fact.9 Fact.10 Fact.11 Fact.12 Fact.13 Fact.14 Fact.15 Fact.16 Fact.17 Fact.18 Fact.19 Fact.20
FLOW_2 0.19 0.71 0.23 0.10 0.26 0.05 –0.17 –0.17 0.14 0.48 0.03 0.05 –0.02 0.05 0.04 0.05 –0.03 –0.04 0.04 0.02
XVEL –0.11 0.83 0.16 –0.13 0.11 –0.33 0.04 0.19 0.20 0.08 0.00 –0.01 –0.03 –0.07 0.03 –0.16 0.09 0.02 –0.06 –0.03
PCT_RA –0.38 –0.08 –0.54 0.26 –0.14 –0.55 –0.10 0.22 0.16 0.00 0.22 0.05 0.16 0.01 0.00 0.07 0.00 –0.05 0.01 0.00
SEQ_FLO_1 –0.46 –0.60 –0.03 –0.02 –0.29 –0.31 –0.20 –0.10 0.05 0.26 –0.33 0.02 0.06 –0.06 –0.08 0.00 –0.02 0.06 0.01 –0.02
XDEPTH_T 0.53 0.02 0.16 0.72 0.30 0.11 –0.15 –0.06 0.08 –0.06 –0.01 –0.04 0.11 –0.01 –0.02 0.10 –0.03 0.04 –0.07 –0.04
SDDEPTH_T 0.44 –0.48 0.30 0.54 0.13 –0.17 –0.15 0.09 –0.20 0.00 0.09 0.08 –0.14 –0.18 0.06 –0.08 0.05 0.02 0.05 0.01
XSLOPE_% 0.35 –0.66 0.21 –0.41 0.01 –0.29 0.13 –0.07 –0.11 0.18 0.17 –0.08 –0.11 0.01 0.15 0.13 0.01 0.02 –0.05 –0.02
PCT_GC 0.02 0.60 0.41 –0.06 –0.54 0.08 0.07 –0.02 –0.25 0.08 0.19 –0.01 0.11 –0.18 –0.14 0.06 –0.01 0.01 –0.01 0.00
PCT_BIGR 0.84 0.08 –0.10 0.17 –0.19 –0.13 0.19 0.18 –0.19 0.10 –0.12 –0.11 0.06 0.02 0.10 –0.11 –0.15 –0.05 –0.01 –0.01
PCT_SA –0.72 0.07 –0.41 –0.06 0.09 0.00 –0.26 –0.38 0.03 –0.05 0.08 –0.05 –0.15 –0.19 0.01 –0.05 –0.10 –0.04 –0.04 –0.01
XCDENMID –0.78 0.10 0.26 0.18 0.14 –0.21 –0.03 –0.12 –0.22 –0.03 0.01 –0.36 0.01 0.11 –0.06 –0.02 0.04 –0.03 0.04 –0.03
XC –0.51 –0.25 0.04 0.47 –0.40 0.06 0.35 –0.23 0.13 0.11 0.18 0.09 –0.12 0.15 –0.02 –0.10 –0.02 0.03 –0.01 –0.01
XM –0.84 0.41 –0.02 0.06 –0.09 0.09 0.07 0.07 0.10 –0.09 0.02 –0.10 0.07 –0.06 0.22 0.05 –0.05 0.10 0.05 0.00
XPCAN –0.71 –0.11 0.38 0.23 –0.06 0.05 0.40 0.06 0.17 –0.03 –0.21 0.03 –0.05 –0.14 0.05 0.10 0.02 –0.09 0.00 –0.01
XFC_ALG 0.58 –0.39 –0.19 –0.16 0.36 0.07 0.40 –0.04 0.28 0.08 0.11 –0.13 0.08 –0.14 –0.12 –0.04 –0.03 0.02 0.05 –0.02
XFC_LWD –0.55 –0.20 0.66 –0.07 0.27 –0.21 –0.03 0.23 0.12 –0.06 0.05 –0.03 –0.04 0.04 –0.10 –0.01 –0.11 0.02 –0.03 0.06
XFC_LEB –0.56 –0.44 0.45 –0.22 0.22 0.08 –0.05 –0.16 –0.08 –0.02 0.09 0.19 0.29 0.01 0.09 –0.10 –0.02 –0.03 0.00 –0.03
TDS –0.75 0.02 –0.20 –0.04 0.24 0.20 0.01 0.44 –0.21 0.12 0.05 0.13 –0.14 0.02 –0.07 0.03 –0.05 0.01 0.01 –0.06
ALCAL –0.65 –0.31 –0.40 0.17 0.19 0.30 0.09 0.12 –0.18 0.27 0.01 –0.11 0.11 –0.05 0.02 –0.04 0.07 0.01 –0.06 0.05
NITROG 0.12 –0.48 0.25 –0.06 –0.40 0.39 –0.40 0.27 0.30 0.06 0.10 –0.17 –0.02 0.00 0.03 –0.04 0.01 –0.03 0.00 –0.02

Marine and Freshwater Research © CSIRO 2018
https://doi.org/10.1071/MF16381_AC
Page 8 of 19
Table S2. Abundance tables of macroinvertebrate taxa for each landscape unit Salitre unit Site
Taxa RCA
-48
RCA
-49
RCA
-50
RCA
-52
RCA
-53
RCA
-65
RCA
-68
RCA
-69
RCA
-70
RCA
-72
RCA
-73
RCA
-74
RCA
-90
Mean s.d.
Aeshnidae 0 3 0 0 0 0 0 0 0 0 0 0 0 0.23 0.83
Baetidae 14 18 10 6 2 3 14 6 0 0 1 4 15 7.15 6.31
Belostomatidae 0 0 0 0 0 0 0 0 0 0 0 3 0 0.23 0.83
Bivalvia 0 2 0 0 0 0 0 0 0 0 0 0 0 0.15 0.55
Caenidae 0 38 5 1 0 0 9 0 0 0 0 0 1 4.15 10.52
Calamoceratidae 0 12 0 0 0 0 4 3 0 1 0 0 0 1.54 3.41
Calopterygidae 3 4 0 8 0 0 0 10 0 0 0 0 0 1.92 3.43
Ceratopogonidae 5 25 8 8 0 11 19 2 8 1 3 4 20 8.77 7.93
Chironomidae 348 698 280 366 23 35 318 56 41 57 15 125 259 201.62 201.27
Coenagrionidae 8 20 1 29 2 0 7 2 0 3 1 11 3 6.69 8.76
Corduliidae 0 1 0 0 0 0 0 0 0 0 0 0 0 0.08 0.28
Corixidae 0 0 0 0 0 0 0 0 0 0 0 3 0 0.23 0.83
Corydalidae 7 7 0 10 2 0 9 13 0 4 2 5 2 4.69 4.23
Culicidae 0 0 0 0 0 1 0 0 0 0 0 0 0 0.08 0.28
Dicteriadidae 0 1 0 0 0 1 0 0 0 0 0 0 0 0.15 0.38
Dryopidae 1 0 0 1 0 0 0 0 0 1 0 0 0 0.23 0.44
Dytiscidae 0 0 0 2 0 0 0 0 0 0 0 0 0 0.15 0.55
Ecnomidae 4 7 1 1 0 0 1 0 0 1 0 0 0 1.15 2.08
Elmidae 421 313 75 67 54 8 204 94 13 17 153 159 43 124.69 125.04
Empididae 12 4 1 2 0 0 7 2 0 11 0 0 1 3.08 4.25
Euthyplociidae 0 7 2 12 1 0 12 0 0 1 0 1 0 2.77 4.51
Glossosomatidae 35 1 0 5 0 4 15 6 0 0 8 7 34 8.85 12.18
Gomphidae 0 0 4 1 0 8 2 2 0 4 1 2 4 2.15 2.34
Gripopterygidae 0 10 0 0 0 1 0 2 1 0 0 0 0 1.08 2.75
Helicopsychidae 1 0 0 0 0 0 1 0 0 0 0 8 0 0.77 2.2
Hirudinea 2 1 1 2 0 0 0 0 0 0 0 0 0 0.46 0.78
Hydracarina 0 0 0 0 0 0 1 0 0 0 0 0 0 0.08 0.28
Hydrobiosidae 1 0 0 1 1 0 0 1 0 0 0 0 0 0.31 0.48
Hydrophilidae 1 1 1 0 0 0 0 1 0 0 0 0 0 0.31 0.48
Hydropsychidae 179 93 0 38 11 0 57 19 4 21 24 13 1 35.38 50.65
Hydroptilidae 11 9 2 9 3 0 0 2 1 0 0 0 0 2.85 4.04
Leptoceridae 173 8 5 8 0 0 2 2 0 0 0 3 1 15.54 47.4

Marine and Freshwater Research © CSIRO 2018
https://doi.org/10.1071/MF16381_AC
Page 9 of 19
Salitre unit Site
Taxa RCA
-48
RCA
-49
RCA
-50
RCA
-52
RCA
-53
RCA
-65
RCA
-68
RCA
-69
RCA
-70
RCA
-72
RCA
-73
RCA
-74
RCA
-90
Mean s.d.
Leptohyphidae 182 120 7 137 13 12 94 26 3 72 17 18 27 56 59.11
Leptophlebiidae 195 51 18 211 23 1 64 12 0 0 48 31 10 51.08 70.53
Libellulidae 9 12 11 11 0 2 2 1 0 7 2 2 3 4.77 4.53
Lutrochidae 2 1 0 0 0 0 0 0 0 0 0 0 0 0.23 0.6
Megapodagrionidae 5 6 0 6 0 0 0 0 1 0 0 0 0 1.38 2.47
Muscidae 3 0 0 0 0 0 0 0 0 2 0 0 0 0.38 0.96
Naucoridae 9 0 3 6 1 0 0 1 0 13 0 26 17 5.85 8.25
Nematoda 0 0 0 0 0 0 0 0 0 0 0 2 1 0.23 0.6
Odontoceridae 176 12 43 70 5 0 3 10 5 0 10 18 3 27.31 48.96
Oligochaeta 41 15 7 18 6 2 24 1 16 20 0 65 10 17.31 18.22
Perilestidae 0 3 0 0 0 0 0 0 0 1 0 0 0 0.31 0.85
Perlidae 61 13 0 36 4 0 19 8 3 0 13 0 1 12.15 17.99
Philopotamidae 0 0 0 0 4 0 0 0 0 0 0 0 0 0.31 1.11
Planariidae 1 0 0 1 0 0 0 0 0 0 0 9 0 0.85 2.48
Pleidae 2 1 0 1 0 0 1 1 0 0 0 2 0 0.62 0.77
Polycentropodidae 2 0 1 21 4 0 4 0 0 0 2 0 0 2.62 5.72
Psephenidae 7 3 3 13 11 0 64 13 0 1 18 6 8 11.31 16.79
Pseudostigmatidae 0 7 0 0 0 0 0 0 0 0 0 0 0 0.54 1.94
Psychodidae 0 1 0 0 0 0 0 0 0 0 0 0 0 0.08 0.28
Ptilodactylidae 0 0 0 0 0 0 0 3 0 0 0 0 0 0.23 0.83
Pyralidae 4 16 0 6 0 0 6 2 0 2 0 3 0 3 4.51
Sialidae 0 0 0 0 0 0 0 0 2 0 0 0 0 0.15 0.55
Simuliidae 61 72 0 48 15 2 21 16 0 5 1 0 2 18.69 25.2
Staphylinidae 0 0 0 0 0 0 2 0 0 0 0 0 0 0.15 0.55
Tabanidae 6 2 0 0 0 0 0 0 0 0 0 0 0 0.62 1.71
Tipulidae 16 38 94 39 5 112 6 2 2 0 50 16 37 32.08 35.85
Veliidae 0 0 0 0 0 3 0 0 0 0 0 1 0 0.31 0.85
Xyphocentronidae 0 0 0 3 0 0 0 0 0 0 0 0 0 0.23 0.83
ABUNDANCE 2008 1656 583 1204 190 206 992 319 100 245 369 547 503 686.31 603.01
RICHNESS 36 40 23 36 20 16 30 30 13 21 18 27 23 25.62 8.36

Marine and Freshwater Research © CSIRO 2018
https://doi.org/10.1071/MF16381_AC
Page 10 of 19
Table S2. (Cont.) Quebra-Anzol unit Site
Taxa RCA
-08
RCA
-31
RCA
-44
RCA
-66
RCA
-67
RCA
-71Mean s.d.
Aeshnidae 1 0 3 1 2 0 1.17 1.17
Baetidae 18 2 8 3 13 4 8 6.36
Caenidae 23 0 0 71 3 9 17.67 27.52
Calamoceratidae 0 1 4 2 4 8 3.17 2.86
Calopterygidae 0 1 2 0 2 0 0.83 0.98
Ceratopogonidae 32 13 1 23 19 32 20 11.9
Chironomidae 191 38 94 793 153 583 308.67 305.7
Coenagrionidae 3 0 0 3 13 3 3.67 4.8
Corydalidae 0 0 0 3 7 0 1.67 2.88
Culicidae 10 0 0 0 0 0 1.67 4.08
Dicteriadidae 8 0 1 0 0 1 1.67 3.14
Dixidae 0 0 1 0 0 0 0.17 0.41
Dryopidae 0 0 0 1 0 0 0.17 0.41
Dytiscidae 1 3 1 0 0 1 1 1.1
Ecnomidae 0 0 1 1 0 0 0.33 0.52
Elmidae 8 9 27 28 113 82 44.5 43.06
Empididae 0 1 0 0 0 7 1.33 2.8
Euthyplociidae 0 0 0 0 0 28 4.67 11.43
Gerridae 1 0 0 1 0 1 0.5 0.55
Glossosomatidae 0 2 0 0 6 2 1.67 2.34
Gomphidae 4 8 3 6 7 0 4.67 2.94
Gripopterygidae 0 0 0 0 1 4 0.83 1.6
Gyrinidae 0 0 0 1 0 0 0.17 0.41
Helicopsychidae 1 1 0 2 0 4 1.33 1.51
Hirudinea 34 0 0 1 2 18 9.17 14.01
Hydracarina 0 0 0 0 1 0 0.17 0.41
Hydrophilidae 1 0 1 0 1 0 0.5 0.55
Hydropsychidae 0 0 1 0 9 34 7.33 13.53
Hydroptilidae 0 0 0 1 3 2 1 1.26
Leptoceridae 8 0 4 13 17 9 8.5 6.09
Leptohyphidae 80 1 0 42 45 65 38.83 32.76
Leptophlebiidae 93 5 11 22 43 77 41.83 36.21

Marine and Freshwater Research © CSIRO 2018
https://doi.org/10.1071/MF16381_AC
Page 11 of 19
Quebra-Anzol unit Site
Taxa RCA
-08
RCA
-31
RCA
-44
RCA
-66
RCA
-67
RCA
-71Mean s.d.
Libellulidae 5 2 6 22 11 4 8.33 7.34
Lutrochidae 1 0 0 2 0 5 1.33 1.97
Muscidae 0 0 0 0 1 0 0.17 0.41
Naucoridae 0 2 0 0 0 9 1.83 3.6
Nematoda 1 0 0 0 0 1 0.33 0.52
Odontoceridae 0 2 16 8 3 9 6.33 5.89
Oligochaeta 145 4 22 58 34 181 74 72.04
Perilestidae 0 0 0 0 4 0 0.67 1.63
Perlidae 4 3 18 3 13 20 10.17 7.83
Planariidae 0 0 0 1 0 0 0.17 0.41
Pleidae 18 0 0 1 4 5 4.67 6.86
Polycentropodidae 0 0 1 1 2 1 0.83 0.75
Psephenidae 1 0 0 3 3 1 1.33 1.37
Psychodidae 0 2 0 0 0 0 0.33 0.82
Pyralidae 0 0 1 1 0 0 0.33 0.52
Scirtidae 2 0 0 0 0 0 0.33 0.82
Sialidae 1 0 0 0 0 0 0.17 0.41
Simuliidae 0 0 1 0 2 10 2.17 3.92
Tabanidae 0 0 0 3 0 0 0.5 1.22
Tipulidae 12 8 6 33 10 14 13.83 9.81
Veliidae 1 0 0 1 1 2 0.83 0.75
ABUNDANCE 708 108 234 1155 552 1236 665.5 464.06
RICHNESS 29 20 24 33 33 34 28.83 5.71

Marine and Freshwater Research © CSIRO 2018
https://doi.org/10.1071/MF16381_AC
Page 12 of 19
Table S2. (Cont.) Canastra unit Site
Taxa RCA
-02
RCA
-22
RCA
-23
RCA
-30
RCA
-57
RCA
-58
RCA
-59
RCA
-60
RCA
-62
RCA
-64
Mean s.d.
Aeshnidae 0 0 0 0 0 0 0 0 3 0 0.3 0.95
Baetidae 619 139 2 93 5 2 261 157 0 11 128.9 193.76
Caenidae 0 23 0 2 1 1 1 0 0 0 2.8 7.13
Calamoceratidae 0 0 0 1 1 0 0 0 0 2 0.4 0.7
Calopterygidae 0 0 0 0 0 1 0 0 0 0 0.1 0.32
Ceratopogonidae 0 5 50 1 15 115 150 23 95 1 45.5 55.1
Chironomidae 879 200 194 245 637 615 1060 771 1105 84 579 378.3
Coenagrionidae 0 3 1 0 2 2 7 0 61 2 7.8 18.81
Collembola 0 0 1 0 0 0 14 0 3 0 1.8 4.39
Corduliidae 0 2 0 0 0 0 0 0 1 0 0.3 0.67
Corixidae 0 0 0 0 0 0 3 0 0 0 0.3 0.95
Corydalidae 0 1 0 0 0 0 0 0 0 0 0.1 0.32
Culicidae 0 0 1 0 0 0 0 0 0 1 0.2 0.42
Dryopidae 0 0 1 0 0 0 1 0 0 0 0.2 0.42
Dytiscidae 0 1 1 0 3 0 2 0 1 0 0.8 1.03
Ecnomidae 0 1 0 0 0 0 0 0 3 0 0.4 0.97
Elmidae 136 67 11 280 43 46 448 120 2 19 117.2 142.82
Empididae 0 0 0 5 0 0 5 12 2 1 2.5 3.89
Euthyplociidae 0 4 0 6 8 0 0 0 0 0 1.8 3.05
Gomphidae 0 0 0 0 0 0 1 0 4 0 0.5 1.27
Gripopterygidae 0 0 0 1 0 0 32 7 0 1 4.1 10.04
Gyrinidae 0 0 0 1 0 0 0 0 0 0 0.1 0.32
Helicopsychidae 2 1 0 1 0 1 0 1 0 1 0.7 0.67
Hirudinea 0 0 5 0 2 0 0 0 0 0 0.7 1.64
Hydracarina 3 1 0 0 1 0 2 2 0 0 0.9 1.1
Hydrobiosidae 21 3 0 0 0 1 0 2 0 0 2.7 6.52
Hydrophilidae 0 0 0 1 0 0 0 0 1 0 0.2 0.42
Hydropsychidae 1 0 5 1 0 14 87 18 5 1 13.2 26.67
Hydroptilidae 7 11 0 17 0 14 47 47 0 2 14.5 18.18
Hydroscaphidae 0 0 0 0 2 0 0 0 0 0 0.2 0.63
Leptoceridae 31 11 1 30 16 0 42 337 27 1 49.6 102.04
Leptohyphidae 0 14 0 25 1 1 63 21 0 0 12.5 20.19

Marine and Freshwater Research © CSIRO 2018
https://doi.org/10.1071/MF16381_AC
Page 13 of 19
Canastra unit Site
Taxa RCA
-02
RCA
-22
RCA
-23
RCA
-30
RCA
-57
RCA
-58
RCA
-59
RCA
-60
RCA
-62
RCA
-64
Mean s.d.
Leptophlebiidae 22 69 15 39 22 2 147 48 118 13 49.5 48.28
Libellulidae 0 0 0 0 9 0 15 0 9 3 3.6 5.44
Lutrochidae 1 1 0 0 0 0 0 0 0 0 0.2 0.42
Muscidae 0 0 0 1 0 0 0 0 0 0 0.1 0.32
Naucoridae 1 1 0 1 0 0 0 0 2 0 0.5 0.71
Nematoda 0 0 1 0 1 0 7 0 0 0 0.9 2.18
Noteridae 0 4 0 0 0 0 0 0 0 0 0.4 1.26
Notonectidae 0 0 3 0 0 0 0 0 1 1 0.5 0.97
Odontoceridae 0 0 0 5 6 0 0 0 0 0 1.1 2.33
Oligochaeta 12 5 44 8 111 1 149 0 47 0 37.7 52.37
Perilestidae 0 1 0 0 0 0 0 0 0 1 0.2 0.42
Perlidae 0 0 7 0 0 0 13 5 0 0 2.5 4.48
Philopotamidae 0 0 0 0 0 0 0 0 0 1 0.1 0.32
Planariidae 0 0 0 0 0 0 14 0 0 0 1.4 4.43
Pleidae 0 1 0 0 2 3 22 1 2 0 3.1 6.72
Polycentropodidae 0 5 1 1 0 0 0 2 0 0 0.9 1.6
Psephenidae 0 0 0 0 3 0 0 0 0 0 0.3 0.95
Pyralidae 85 11 1 1 0 4 30 9 48 0 18.9 28.04
Scirtidae 0 0 0 0 0 1 7 0 0 0 0.8 2.2
Simuliidae 1860 0 90 9 0 10 366 1364 6 9 371.4 673.55
Syrphidae 0 0 0 0 0 0 1 0 0 0 0.1 0.32
Staphylinidae 1 0 0 0 0 0 0 0 0 1 0.2 0.42
Tabanidae 0 0 1 0 0 0 0 0 0 0 0.1 0.32
Tipulidae 0 0 16 0 2 2 2 0 79 1 10.2 24.65
Veliidae 0 0 1 0 0 0 0 0 0 1 0.2 0.42
Xyphocentronidae 1 0 0 0 0 0 0 0 0 1 0.2 0.42
ABUNDANCE 3682 585 454 775 893 836 2999 2947 1627 159 1495.7 1255.32
RICHNESS 17 26 24 24 22 19 30 19 24 23 22.8 3.79

Marine and Freshwater Research © CSIRO 2018
https://doi.org/10.1071/MF16381_AC
Page 14 of 19
Table S3. Coordinates for each site Site Longitude (W) Latitude (S)
RCA 02 46°51'02" 20°07'15"
RCA 22 46°41'56" 20°08'10"
RCA 23 46°40'28" 20°09'03"
RCA 30 46°56'16" 20°06'05"
RCA 57 46°45'24" 20°07'25"
RCA 58 46°45'11" 20°07'06"
RCA 59 46°47'03" 20°07'06"
RCA 60 46°47'08" 20°07'07"
RCA 62 46°53'59" 19°59'16"
RCA 64 46°53'53" 20°00'43"
RCA 48 47°02'18" 19°12'27"
RCA 49 47°01'20" 19°12'40"
RCA 50 46°59'31" 19°12'38"
RCA 52 47°00'42" 19° 9'52"
RCA 53 46°57'42" 19°12'34"
RCA 65 46°34'05" 19°14'30"
RCA 68 47°01'35" 19°10'18"
RCA 69 47°02'53" 19°07'54"
RCA 70 47°02'29" 19°11'57"
RCA 72 46°49'31" 19°07'24"
RCA 73 47°02'32" 19°07'40"
RCA 74 47°03'01" 19°09'46"
RCA 90 46°59'58" 19°08'22"
RCA 08 47°13'42" 19°24'56"
RCA 31 47°14'53" 19°21'51"
RCA 44 47°18'17" 19°34'57"
RCA 66 47°15'56" 19°18'58"
RCA 67 47°13'12" 19°21'31"
RCA 71 47°08'59" 19°13'53"

Marine and Freshwater Research © CSIRO 2018
https://doi.org/10.1071/MF16381_AC
Page 15 of 19
Table S4. Results of the test with Residual Moran-I of multiples regressions:
(a) Jaccard × XLEB+XSLOPE, (b) Gower × %SA, (c) Ric × XLEB+XSLOPE
D.Class Count DistCntr Moran’s I P I (max.) I/I (max.)
(a)
1 100 3475 –0.154 0.198 0.47 –0.327
2 100 11851 –0.153 0.227 0.683 –0.224
3 100 23621 0.135 0.288 0.644 0.209
4 100 42053 –0.022 0.804 0.375 –0.059
5 98 72656 –0.04 0.66 0.296 –0.134
6 100 96828 0.041 0.733 0.555 0.074
7 100 105494 0.029 0.802 0.513 0.057
8 100 114221 –0.066 0.441 0.533 –0.124
Expected: –0.036
Distance Units
110,000100,00090,00080,00070,00060,00050,00040,00030,00020,00010,000
Mora
n's
I
0.6
0.4
0.2
0
-0.2
-0.4
-0.6
Max. Moran's I
Conf. Interv. (95%)
Moran's I

Marine and Freshwater Research © CSIRO 2018
https://doi.org/10.1071/MF16381_AC
Page 16 of 19
Table S4. (Cont.)
D.Class Count DistCntr Moran’s I P I (max.) I/I (max.)
(b)
1 100 3475 –0.112 0.38 0.7 –0.16
2 100 11851 –0.002 0.99 0.773 –0.003
3 100 23621 0.04 0.72 0.588 0.068
4 100 42053 –0.097 0.34 0.398 –0.244
5 98 72657 –0.008 0.93 0.595 –0.014
6 100 96828 –0.075 0.57 0.59 –0.127
7 100 105494 0.232 0.06 0.692 0.336
8 100 114221 –0.156 0.16 0.485 –0.322
Expected: –0.036
Distance Units
110,000100,00090,00080,00070,00060,00050,00040,00030,00020,00010,000
Mora
n's
I
0.8
0.6
0.4
0.2
0
-0.2
-0.4
-0.6
-0.8
Max. Moran's I
Conf. Interv. (95%)
Moran's I

Marine and Freshwater Research © CSIRO 2018
https://doi.org/10.1071/MF16381_AC
Page 17 of 19
Table S4. (Cont.)
D.Class Count DistCntr Moran’s I P I (max.) I/I (max.)
(c)
1 100 1461 –0.135 0.318 0.67 –0.202
2 100 5413.5 –0.047 0.63 0.782 –0.06
3 100 12078 –0.098 0.378 0.557 –0.176
4 100 27452 0.011 0.883 0.456 0.023
5 98 61328 –0.032 0.723 0.344 –0.093
6 100 90851 0.004 0.955 0.663 0.007
7 100 101424 0.082 0.395 0.463 0.178
8 100 109222 –0.094 0.271 0.51 –0.184
Expected: –0.036
Distance Units
110,000100,00090,00080,00070,00060,00050,00040,00030,00020,00010,000
Mora
n's
I
0.8
0.6
0.4
0.2
0
-0.2
-0.4
-0.6
-0.8
Max. Moran's I
Conf. Interv. (95%)
Moran's I

Marine and Freshwater Research © CSIRO 2018
https://doi.org/10.1071/MF16381_AC
Page 18 of 19
Table S5. Results of the test of Moran-I: richness
D.Class Count DistCntr Moran’s I P I (max.) I/I (max.)
1 100 3475 –0.04 0.76 0.944 –0.043
2 100 11851 0.136 0.26 0.857 0.159
3 100 23621 –0.057 0.59 0.706 –0.08
4 100 42053 –0.05 0.63 0.682 –0.073
5 98 72657 –0.043 0.62 0.638 –0.068
6 100 96828 –0.011 0.93 0.743 –0.014
7 100 105494 0.075 0.51 0.896 0.084
8 100 114221 –0.281 0.04 1.093 –0.258
Expected: –0.036

Marine and Freshwater Research © CSIRO 2018
https://doi.org/10.1071/MF16381_AC
Page 19 of 19
Table S6. Results of the test of abundance trough Mantel test
D.Class Count DistCntr Pearson’s r P-value Z/n
1 100 3475 0.24 <0.001 4.266
2 102 11851 0.206 0.001 4.313
3 100 23621 0.023 0.699 4.552
4 100 42053 –0.024 0.739 4.615
5 96 72657 –0.181 0.027 4.828
6 98 96828 –0.098 0.083 4.715
7 100 105494 –0.077 0.212 4.685
8 100 114221 –0.095 0.207 4.708
Global Pearson’s r: 0.327
Global P-value: <0.001
Global Z/n: 278397.335