regional value chains: exploring linkages and
TRANSCRIPT

1
REGIONAL VALUE CHAINS: EXPLORING LINKAGES AND OPPORTUNITIES IN THE AGRO-PROCESSING SECTOR ACROSS FIVE SADC COUNTRIES
Paper prepared for UNCTAD Project on “Development policies for sustainable economic growth in South Africa”
Tamara Paremoer

2
Table of Contents 1 Introduction .......................................................................................................................... 4
2 Agro-processing value chains, industrialisation and climate change .......................................... 6
2.1 Regional initiatives to address Climate Change and Industrialisation ................................. 7
2.2 Regional value chains in agro-processing......................................................................... 9
2.3 Regional trade in processed food ................................................................................... 11
2.4 Trends in growth and urbanization ................................................................................ 13
2.5 Trends in Income ......................................................................................................... 15
2.6 Country Trends ............................................................................................................ 15
2.6.1 Zambia ................................................................................................................ 15
2.6.2 Tanzania .............................................................................................................. 19
2.6.3 Mozambique ........................................................................................................ 22
2.6.4 South Africa ......................................................................................................... 24
2.6.5 Mauritius ............................................................................................................. 27
2.7 Summary: identifying high-potential regional value chains for further analysis ................ 30
3 Analysis of selected value chains.......................................................................................... 33
3.1 The oilseeds, animal feed and poultry value chain .......................................................... 33
3.1.1 Trade in oilcake and poultry products..................................................................... 33
3.1.2 Production of soybeans ......................................................................................... 35
3.1.3 Demand for meat and edible oils............................................................................ 36
3.1.4 Challenges in meeting demand and developing a coordinated regional value chain.... 38
3.2 The sugar to sugar confectionery value chain ................................................................. 43
3.2.1 Factors limiting regional trade in sugar .................................................................. 45
3.3 Policy Proposals for strengthening regional value chains in oilseeds and sugar ................. 47
3.3.1 Solving the backhaul constraint between Zambia and South Africa .......................... 47
3.3.2 Sponsoring rivalry: developing a regional supermarket pact .................................... 48
3.3.3 Harmonisation of standards within SADC for key commodities ............................... 48
3.3.4 Review of policies related to the sugar sector.......................................................... 49
3.3.5 Building capacity for understanding firm conduct and strategy ................................ 49
3.3.6 Increasing storage capacity in Zambia and Tanzania ............................................... 50
4 Some conclusions................................................................................................................ 51
5 Bibliography ....................................................................................................................... 53
6 Appendices ......................................................................................................................... 57
6.1 Appendix 1: Regional responses to climate change......................................................... 57
6.2 Appendix 2: National responses to climate change ......................................................... 59
6.3 Appendix 3: Profitability of oilseed farmers in Tanzania................................................. 62

3
List of Figures Figure 1: The 2015/16 Southern African Drought ........................................................................... 7 Figure 2: South Africa’s leading manufactured exports to SADC countries (US$) ........................... 10 Figure 3: SADC trade balance in Food, Beverages and Tobacco (2011- 2016) ................................ 12 Figure 4: Trade balance in processed food (2011 - 2016) ............................................................... 13 Figure 5: Population Projections to 2050 ...................................................................................... 14 Figure 6: Percentage of Population residing in Urban Areas, 2010 – 2015 ...................................... 14 Figure 7: GDP per capita (constant 2010 US$) ............................................................................. 15 Figure 8: The 10 fastest-growing crops in Zambia, 2004 – 2014 .................................................... 16 Figure 9: Top 10 fastest growing crops in Tanzania, 2004 - 2014 ................................................... 20 Figure 10: Total imports and exports in food, beverages and tobacco (Tanzania)............................. 21 Figure 11: Trade balance in ‘fish & fish products’ and ‘sugars & sugar confectionery’ .................... 29 Figure 12: Trade in soya oilcake (HS Code 2304) ......................................................................... 34 Figure 13: Trade in soybeans (HS Code 1201) .............................................................................. 35 Figure 14: OECD estimates of meat consumption, 2016 ................................................................ 37 Figure 15: Projected per capita consumption of vegetable oil (for food use only) ............................ 38 Figure 16:Trade in sugar (HS Code 1701) .................................................................................... 44 Figure 17: Trade in sugar confectionery (HD Code 1704) .............................................................. 45
List of Tables Table 1 : Agro-processing Sectors with Potential Value Chain Enhancement in SADC ..................... 9 Table 2: Zambia's top 5 imports in food, beverages and tobacco, sorted by value in 2016 ................ 17 Table 3: Zambia's top 5 exports in food, beverages and tobacco, sorted by value in 2016................. 18 Table 4: Production of Oilseeds in Tanzania, 2010 – 2015 ............................................................. 20 Table 5: Tanzania's top 5 imports in food, beverages and tobacco, sorted by 2016 value .................. 22 Table 6: Tanzania’s top 5 exports in food, beverages and tobacco, sorted by value in 2016 .............. 22 Table 7: Projected changes in crop yields due to climate change: Mozambique (base year = 2007)... 23 Table 8: Mozambique's top 5 imports in food, beverages and tobacco, sorted by value in 2016 ........ 23 Table 9: Mozambique’s top 5 exports in food, beverages and tobacco, sorted by value in 2016 ........ 24 Table 10: South Africa's top 5 imports in food, beverages and tobacco, sorted by 2016 value .......... 26 Table 11: South Africa’s top 5 exports in food, beverages and tobacco, sorted by value in 2016....... 26 Table 12: Mauritius's top 5 imports in food, beverages and tobacco, sorted by value in 2016 ........... 28 Table 13: Mauritius's top 5 exports in food, beverages and tobacco, sorted by value in 2016............ 29 Table 14: Potential value chains identified in the region ................................................................ 31 Table 15: Soybean production (tons) ............................................................................................ 36 Table 16: Cane or beet sugar and chemically pure sucrose, in solid form (HS Code 1701) ............... 43 Table 17: Profitability of small-scale farmers (data obtained from interviews) ................................ 62

4
1 Introduction
Global value chains (GVCs) describe the full range of cross-national value addition processes and activities that firms and workers engage in to transform raw commodities into final products or services (Gereffi and Fernandez, 2011; Farole, 2015; 2016). The global value chain framework provides a useful methodology for tracing patterns of value creation and understanding power and governance within an industry by exploring the linkages amongst geographically dispersed economic activities and actors (Gereffi and Fernandez-Stark, 2011; Kaplinsky and Morris, 2000).
For many low-income developing countries, the ability to insert themselves into a global value chain is important for economic development and as stepping stone to integration into world trade (Gereffi & Fernandez-Stark, 2011). But for GVCs to be beneficial to growth, it presumes that firms or countries can access value chains, can compete within them, and can capture the benefits for local economic development. Historically, many African countries have been incorporated into GVCs at the low-skill and low-value parts of the chain where there are limited opportunities for upgrading into more complex technology-based and skill-intensive industries (SADC, 2015). Partly due to this trend, regional value chains (RVCs) have emerged as a complementary development tool to both GVCs and national industrial policy.
Regional value chains (RVCs) emphasise increased regional trade, regional investment and regional corporate ownership. The logic of regional value chains as development tool is closely linked to the logic of regional integration, and views increased market size and greater economies of scale as potential growth drivers. Firms generally face lower barriers when entering regional value chains which tend to be less concentrated and have less powerful lead firms compared to lead firms in global value chains (Keane, 2015). Despite the potential for coordinated regional value chains to drive growth in many sectors, policymaking has not yet grasped the potential for regional cooperation to bring win-win outcomes through increased value addition and upgrading at the firm, value chain, and industry levels across national boundaries (Fessehaie, Roberts, & Takala-Greenish, 2015).
The reasons to focus on the potential for regional value chains to drive economic growth in the agro-processing sectors in particular include the continued growth in agricultural productivity across southern Africa, rising global agro- and commodity prices, and increased demand for processed food within the region (McMillan, Rodrick and Verduzco-Gallo, 2014). Tastes and preferences, which tend to limit trade in processed agro- products across continents, are more similar within regions. Proximity of production areas to processing plants is also a major consideration, with processors preferring to locate their processing plants as close as possible to production areas to reduce transport costs and to limit food waste, particularly at lower levels of the value chain where products are bulky and low in value.
The impact of climate change is a further reason to take a regional value chain approach to agricultural production and markets. Climate change means more variability in rainfall across SADC, with more frequent droughts and floods anticipated. While there is projected to be lower rainfall in the southern-most areas, especially in South Africa, there will continue to be abundant water in the SADC region as a whole. Moreover, when there is drought in El Nino years (such as 2015) in South Africa, southern Mozambique, Swaziland, Zimbabwe, Malawi, Botswana and Namibia, there are good rains in much of Zambia, northern Mozambique, DRC and Tanzania. Developing broader and deeper markets in SADC is an essential part of mitigating the risks associated with climate change. Nurturing these markets requires understanding the facilitating investments required in irrigation, storage, transport, insurance, financing and price discovery. A regional approach also increases the pool of resources available to mitigate the impact of climate change and potentially provides greater regional food security. This will become increasingly important as the effects of climate change become more severe. Despite these

5
pressing challenges, our research finds that the effects of climate change have not been incorporated into national and regional industrial and agricultural policy in a meaningful way. In many cases, it is simply incorporated as an “add-on” to traditional industrial policy and planning. The fundamental changes that will accompany increasing climate variability and the need for a coordinated regional response is not yet acknowledge in the policy.
This report focuses on providing practical policy proposals to develop regional value chains in agro-processing sectors (and in specific food processing value chains in particular) across five countries: South Africa, Zambia, Tanzania, Mauritius and Mozambique. Recent studies in the animal-feed-to-poultry and sugar-to-confectionery value chains in southern Africa show evidence of underdeveloped regional value chains with significant potential for import replacement and downstream processing (Das Nair, Nkhonjera and Ziba, 2017; Ncube, Roberts and Zengeni, 2016 & 2017). The region continues to depend on deep-sea imports of key inputs to animal feed, such as soybeans and soya oilcake, despite potential to source inputs from neighbouring countries (Ncube, Roberts, & Zengeni, 2016 & 2017). In the sugar sector, Zambia is one of the lowest-cost sugar producers in the region, but has some of the highest-cost industrial sugar in the world which impedes the development of downstream confectionery businesses. As a result, Zambia; and the SADC region as a whole, continue to import processed sugar confectionery products.
The focus on five countries needs to be explained in the context of the regional questions. The countries chosen are important economies in SADC in different ways. Mauritius and South African are relatively more industrialised economies, with the highest GDP per capita in SADC (along with Botswana). Mozambique, Tanzania and Zambia are large countries with enormous potential for growth in agricultural production. In addition, the largest market for processed food in SADC is South Africa, in the greater Johannesburg/Pretoria metropolitan areas, and both Mozambique and Zambia can readily supply food to this market. The paper therefore considers regional value chains which stretch between Tanzania, Mozambique, Zambia and South Africa. Tanzania has a large and growing population projected to reach 140 million by 2050 (double the size of South Africa). Agricultural production is expanding and there is huge potential for ongoing growth including in agro-processing.
In each country, the paper considers the recent trends, variations related to weather, and step-wise changes which have occurred and are underway. Comparative insights are drawn across the countries in key value chains as well as assessing the regional developments including actual and potential cross-country linkages.
The paper proceeds in four parts. Section 2 explores the links between agro-processing value chains, industrialisation and climate change, section 3 reviews agro-ecological conditions and trade patterns in each of the five countries in the study, section 4 takes a closer look at two key value chains in the region in terms of competitiveness, climate change adaption and challenges to value chain development, and section 5 concludes.

6
2 Agro-processing value chains, industrialisation and climate change
Many African countries continue to be net food importers while having the potential for substantially greater agricultural production.1 At the same time, rapid urbanisation is underway which is changing the demand patterns towards more processed foods and changing consumer purchasing towards supermarkets (UNECA, 2017; Lall et al., 2017). Imports of food have supported urbanisation in the absence of a domestic agricultural surplus. However, food in African cities has been found to be around 35 per cent more expensive than in comparator countries (Nakamura et al., 2016). This means that if food production is not addressed as an industrialisation question to manufacture and supply the processed food products being demanded by urban consumers, African countries will record growing trade deficits in processed food products.
The industrial development of processed food production is important in its own right, and is a manufacturing sector in which there has been growing regional trade in southern Africa. Developing the sector requires building linked industrial capabilities along with logistics, packaging, testing and certification. Along with this central industrial development challenge we must consider the implications of climate change.
Southern and East Africa as a whole have ample water resources for agriculture and the region has the potential to be a major food exporter to the world. However, climate change means that rainfall will be more variable and that there will be more frequent droughts and floods. But when there is a drought in one sub-region, such as the El Nino-induced drought which in 2015 caused South Africa to record its lowest national annual rainfall since 1904, there will be sufficient rain in other sub-regions, such as the north and west of Zambia, Tanzania and north of Mozambique during the 2015 El Nino drought (Figure 1). As an example of the varying effect of these events, cereal production was 26 to 31% lower than normal after the 2015 drought in South Africa, Malawi, Lesotho and Swaziland but production was 13% higher in Mozambique and 2.4% higher in the DRC.2
1 Africa recorded a trade deficit of $24bn in the food, beverages and tobacco category in 2016. This deficit can be attributed to a narrow range of food categories: (1) cereals, with a deficit of $18.3bn, (2) animal or vegetable fats and oils, with a deficit of $4.9bn, and (3) sugar and sugar confectionery products with a deficit of $3.9bn. In each of these categories one product makes up the bulk of imports; namely wheat in the cereals category, palm oil in the vegetable fats and oils category, and raw cane sugar in the sugar and sugar confectionery category. SADC, on the other hand, actually recorded a trade surplus in food, beverages and tobacco products of $1.8bn in 2016, though this was largely due to a surplus of $3.1bn in ‘edible fruit and nuts’ (largely citrus) and a surplus of $2bn in tobacco. SADC’s largest net imports in 2016 were in cereals at -$2.7bn (again, largely wheat) and imports of vegetable fats and oils at -$1.5bn (again, largely palm oil). Food imports are thus concentrated in very narrow categories (wheat, palm oil and sugar). 2 Note that production in Zambia was 17% lower than normal due to a combination of different factors, including the outbreak of fall army worm, which has again recurred in the 2017/18 farming season.

7
Figure 1: The 2015/16 Southern African Drought
Source: UN Office for the Coordination of Humanitarian Affairs
2.1 Regional initiatives to address Climate Change and Industrialisation
In general, responses to climate change are still located within government departments and policy spaces that deal with primary agricultural production and environmental matters. There is no systematic evaluation of the effects of climate change on value chains and it is not seen as an industrial policy challenge. The effects of climate change on the productive economy and on manufacturing enterprises have not been systematically incorporated into the work of practitioners focused on economic development, trade and industry and the capacity of these institutions to identify potential challenges and to respond proactively needs to be developed.
There are several regional initiatives on monitoring, mitigating and adapting to climate change underway at the SADC level (see Appendix 2 for a description). It is difficult to gauge how effectively these strategies have been implemented and whether there is effective coordination amongst the various parties responsible for implementation. In addition to these regional strategies, countries have separate national strategies (often also done on a sectoral level) which do not recognise the potential of developing a regional response to climate change. In general, the national strategies focus on particular sectors or individual challenges and seek national solutions (see Appendix 3).
Thus, though there has been progress towards developing climate change response and adaptation strategies in all countries in this study, the effects of climate change on production within and between countries and what this means for agro-processing firms in particular, has not been evaluated. Both the regional and national climate responses are complex and existing strategies overlap with no clear indication of a phased implementation strategy or priorities. This has contributed to the slow pace of implementation in many countries.
We argue that wider and deeper agricultural markets would reduce the volatility associated with climate change (in both production and food prices) as the supply-side shocks in one area would be proportionately less in a wider market which encompasses areas which had good rains and production.

8
Wider markets require concerted action to improve transport and logistics networks in order to reduce costs and integrate suppliers and consumers across a wider geographic area. The significance of transport costs is illustrated by the example of the costs between Zambia and the greater Johannesburg region in South Africa (a distance of some 1800km) which have been around US$100/tonne or around half of the price of a tonne of maize in South Africa in most years. Such a large price wedge undermines wider regional markets. Interviews with transporters in the region suggest that transport costs for this distance should be no more than US$40/tonne and could fall further with increased trade volumes (Koster, 2016).
In addition, market deepening refers to increasing the number of market participants which can access markets, along with the diversity of trading options and forms such as different pack sizes, volumes and modes of transport. More than simply reducing border restrictions are required. Participation depends on accessing storage and trade finance by smaller participants. For example, there have been competition cases in South Africa relating to silo storage where dominant firms have abused their position. The market failures in financial markets are also well understood, implying that finance may be rationed to smaller participants.
The private sector will under-invest in transport and storage networks relative to social benefits. This is because the investment costs in storage and logistics may not be justified by user charges when the facilities are only used in times of shocks in rainfall. In addition, the social benefit from greater market integration at such times includes the effect across the economy (including on vulnerable groups) from lessening the shocks. These considerations suggest attention needs to be given to the case for public financing, along with regulation.
We need to better understand regional markets to analyse both industrialisation and the implications of climate variability for food production. In this context, markets are shaped both by policies and the influence of large corporations.
The SADC Industrialization Strategy and Roadmap, 2015 – 2063 (SADC roadmap) recognises regional value chains as an important tool in driving structural change and industrialisation. It supports increased participation in regional value chains as a means of expanding production possibilities and enhancing the utilisation of the natural and human resources of the region as a whole. The key challenge for corporations and governments is to identify and prioritise entry points into value chains.
The development of regional value chains also requires strong government-to-government cooperation as many national governments have prioritised similar sectors in national development policies and opportunities for regional cooperation must always take cognizance of these national priorities.
SADC has prioritized six value chain clusters for potential development. These are:
i. Agro-processing ii. Minerals Beneficiation and related mining operations
iii. Pharmaceuticals iv. Consumer goods v. Capital Goods
vi. Services
Within the agro-processing cluster, 10 potential value chains have been identified along with several countries that have the potential for value chain enhancement (Table 1). The value chains are complex and multi-faceted and a further prioritisation process should be conducted to identify which value chains SADC will target in the short, medium, and long term. Targeted action plans should be compiled that draw from existing research. This paper tries to do this for two agro-processing value chains, sugar and soya, to show the detailed analysis required to identify entry points and potential for growth in value

9
chains, as well as to identify policy challenges that need to be addressed at a national and regional (bilateral or multilateral) level.
Table 1 : Agro-processing Sectors with Potential Value Chain Enhancement in SADC
Sectors Countries Soya South Africa, Zimbabwe, Zambia, DRC, Malawi, Madagascar Sugar Malawi, Mozambique, South Africa, Swaziland, DRC, Tanzania,
Zambia, Zimbabwe, Mauritius, Botswana Meat products (poultry and beef) Botswana, South Africa, Zambia, Zimbabwe, Namibia, Swaziland,
Madagascar, Tanzania, DRC Cassava Angola, DRC, Mozambique, Tanzania, South Africa, Malawi,
Madagascar, Zambia, Zimbabwe Dairy products Madagascar, South Africa, Namibia, Tanzania, DRC, Malawi,
Botswana, Zambia, Zimbabwe, Swaziland Fish and fish products Angola, Mauritius, Mozambique, Namibia, Seychelles, South Africa,
Zambia, Madagascar, Malawi, Tanzania, DRC, Zimbabwe Horticulture (Fruits, Vegetables and Flowers)
Swaziland, Lesotho, Zambia, South Africa, Malawi, Madagascar, Zimbabwe, DRC, Namibia, Tanzania
Wildlife (game meat and hide processing)
Botswana, Namibia, South Africa, Zambia, Zimbabwe, DRC
Forestry – Timber and non-timber forest products (medicinal, cosmetics, essential oils and other herbal products)
DRC, South Africa, Angola, Madagascar, Swaziland, Mozambique, Zimbabwe, Zambia, Namibia, Tanzania, Malawi, Mauritius
Other food and drinks Angola, DRC, Lesotho (maize), Zambia (oil seeds and livestock products), Malawi (oil seeds), South Africa, Zimbabwe, Swaziland, Madagascar (Rice, maize, black eyed beans, pea), Namibia, Tanzania (maize, rice, oil seeds)
Source: ACTION PLAN FOR SADC INDUSTRIALIZATION STRATEGY AND ROADMAP (2017)
2.2 Regional value chains in agro-processing
The importance of agro-processing amongst the sectors selected in the SADC Roadmap is further mirrored by trends in trade data. Specifically, the changes in demand in southern Africa are reflected in the dramatic increase of South Africa’s exports of food products to other Southern African Development Community (SADC) countries from 2007 (Figure 2) given South Africa’s more advanced industrial base as well as the spread of South African-owned supermarkets through the region.
At the same time, South Africa is also becoming more reliant on agriculture imports given growing demand from cities and constraints on water. This is reflected in growing deficits in grains such as wheat and soya, and periodic deficits in maize in years of poor rains such as in 2015 and 2016, as discussed in the review of country trends in trade of processed food (see section 3.4).

10
Figure 2: South Africa’s leading manufactured exports to SADC countries (US$)
Source: Quantec
Note: this excludes petroleum, basic chemicals, and basic metals
The fact that Africa as a whole is a net food importer and has low yields and agricultural productivity, while generally having good conditions for agricultural production, has been widely observed (ACET, 2014; Suttie and Benfica, 2016). There does appear to have been a turning point in some countries from 2005 with some improvements in agricultural productivity (Jayne and Ameyaw, 2016). However, even as improved levels of agricultural production may be attained, there will be a rapidly growing trade deficit in processed food products without a substantially improved performance in manufacturing of these products. Food processing has characterised the early industrialisation stages of many emerging economies, what is at issue is how the southern African region can seize the opportunity for local industrialisation offered by growing demand for processed foods.
There have been extensive policy reforms across African countries. Markets and international trade have been liberalised although there is still protection of sensitive crops such as maize in many countries. There has also been rapid integration into the global economy. Major traders such as Cargill, Louis Dreyfus and Bunge have expanded operations in southern Africa very substantially, as has ETG which has its origins in Kenya.
Cargill and Louis Dreyfus handle 70 per cent of all the maize trading in South Africa (Greenberg, 2017). In South Africa, the two largest agro-conglomerate groups, Afgri and Senwes, both of which evolved out of the former cooperatives supported under apartheid, have been bought by or joint-ventured with international finance and trading companies (Makhaya and Roberts, 2013; Bernstein, 2012). Afgri has been bought by Agrigroupe (with ownership in Mauritius and the Cayman Islands and a controlling shareholder based in Canada). Bunge and Senwes formed a joint venture in 2012. Louis Dreyfus is a joint shareholder in an operation of a smaller company, NWK. Nava Bharat, an Indian conglomerate with coal mining operations in Zambia is expanding its interests in both Tanzanian and Zambian agri-business. It has been allocated 10 000 hectares of land by Zambian government to grow sugarcane to establish an integrated sugar complex producing refined sugar, rectified spirit and ethanol, and bio-fuels (Nava Bharat Ventures Limited , 2017). In 2013, the company also entered into a deal with the Tanzanian government to establish a 10 000-hectare palm oil plantation. There is increasing global interest in the potential of agriculture and agro-processing in southern Africa with the potential to shape value chains and industrial development in their favour.
11
Firms’ strategies are already regional in nature, investing in areas with production potential and linking these to area of growing demand. These areas often cross national boundaries with areas with the greatest potential for certain crops (such as soya in Zambia) often in different countries to the major areas of demand (such as the demand for poultry in South Africa). The size of the South African market in SADC skews patterns of demand; it has the largest consumer market in the region by far, but the most suitable areas for production are frequently outside its borders, in counties like Mozambique, Zambia and Tanzania which have more arable land and water available for increased agricultural production. As value chain analysis indicates, there is a need to understand existing and potential capabilities across countries and to consider existing governance arrangements and the distribution of rent (and power) within value chains to evaluate how these could work in the interest of collectively beneficial industrial development across SADC. This requires a country-by-country analysis of existing capabilities and an exploration of the regional potential in selected value chains. Ways of linking potential production capabilities to increased regional processing and to consumers is a critical policy question that requires concerted cooperation as we highlight in this paper.
2.3 Regional trade in processed food
In 2011, SADC recorded a trade surplus of $951mn in the food, beverages and tobacco category (Figure 3) but recorded a trade deficit in processed food (i.e., excluding beverages, tobacco and unprocessed food) of $1.3bn (Figure 4).
Box 1: Description of categories used in analysis of trade data
The food, beverages and tobacco category comprises HS Codes 2 – 4, 7 – 12, and 15 – 24. It includes both processed food (such as ‘Preparations of cereals, flour, starch or milk; pastrycooks' products’ for example) and less processed/unprocessed foods (including grains and cereals for example).
The processed food category excludes tobacco and beverages and also excludes less processed or unprocessed food. Fruit, raw nuts and cereals, for example, are excluded. The category covers HS Codes 15 – 21 which includes ‘Animal or vegetable fats and oils’, ‘Preparations of meat, of fish or of crustaceans, molluscs or other aquatic invertebrates’, ‘Sugars and sugar confectionery’, ‘Cocoa and cocoa preparations’, ‘Preparations of cereals, flour, starch or milk; pastrycooks' products’, ‘Preparations of vegetables, fruit, nuts or other parts of plants’ and ‘Miscellaneous edible preparations’.
It is, however, worth noting that it is increasingly difficult to pin down exactly what constitutes ‘processed food’ as it is not always clear where ‘primary production’ ends and ‘processed food’ starts. In the fruit value chain, ‘fresh fruit’ undergoes a number of very complex steps during harvesting, cleaning, sorting, packing, ripening and transportation which adds significant value to fresh fruit. Fresh fruit is, in fact, a much higher-value product than canned or processed fruit because although fruit is sold ‘fresh’ it has undergone an industrial production process. Cramer and Sender (2015) refer to these as ‘fuzzy boundaries’, suggestion that the distinction between agriculture and agro (food)-processing is somewhat artificial.

12
The trade surplus in food, beverages and tobacco was buoyed by the growth in net exports of ‘edible fruit and nuts’, ‘tobacco and manufactured tobacco substitutes’ and ‘coffee, tea, maté and spices’ and by decreases in net imports of ‘meat and edible meat offal’ and ‘animal and vegetable fats and oils’ (though these still remained in a net import position). The decrease in net imports of ‘animal and vegetable fats and oils’ were accompanied by a decline in net exports of oilseeds showing increasing local value addition.
Figure 3: SADC trade balance in Food, Beverages and Tobacco (2011- 2016)
Source: ITC Trademap
The trade deficit in processed food (HS codes 15 – 21) decreased from -$1.3 billion in 2011 to -$385mn in 2014 but widened again to -$1.5bn in 2016 due to large imports of edible oils and a large drop in net exports of sugar and sugar confectionery (Figure 4).
Between 2011 and 2014 the region seemed to be building capabilities in the sugar sector with increasing net exports of sugar and sugar confectionery products, but this gain was eroded in 2015/2016, pointing to some stagnation at the downstream levels of the sugar value chain (discussed further in section 4.2).
Imports of edible oil also decreased considerably between 2011 and 2015, accompanied by a notable increase in the production of oilseeds in Zambia and Tanzania (see section 3.3), suggesting that increased local production of edible oilseeds is replacing imports. The increase in net imports of edible oil in 2016 is largely due to a sharp year-on-year increase in palm oil imports by South Africa, Tanzania and Angola.
Palm oil is currently produced in small quantities within SADC, mainly by Tanzania and Madagascar with commercial production expected to start in Zambia in 2017. It is used extensively in a wide range of food and non-food processing sectors including in the manufacture of baked goods, sugar confectionery, non-dairy creamers and as a thickener, preservative and antioxidant; in personal care products such as soap and shampoo, in cosmetics and in industrial products including, and in lubricants,

13
paints and inks.3 It is unclear whether the increase in palm oil imports was driven by food or non-food downstream uses.
Figure 4: Trade balance in processed food (2011 - 2016)
Source: ITC Trademap
2.4 Trends in growth and urbanization
Demand for processed food is driven by population growth and increased urbanization, which also changes where and how consumers purchase food. The most remarkable aspect of projected population growth rates to 2050 is the explosive growth expected in Tanzania, where the total population is expected to increase almost threefold between 2015 and 2050 to reach 138 million. Mozambique and Zambia’s population are also expected to grow rapidly, by 142% and 155% respectively while the population of South Africa and Mauritius will remain fairly stable to 2050 (Figure 5).
3 SADC imported $856mn worth of palm oil in 2016. Tanzania and Zambia have both explored opportunities to increase palm oil production. In 2013 the Tanzanian National Development Corporation announced its intention to launch a 10 000-hectare palm oil project in the Ruvu River Basin near Dar es Salaam in partnership with Indian diversified conglomerate, Nava Bharat Ventures Limited. It is unclear how far the project has progressed, but several concerns were raised at the time about the water intensity of the project (which would have required irrigation) and its negative environmental impact on biodiversity in the Ruvu River Basin, much of which is listed as a critical conservation site (see here). More recently, in May 2017, Zambeef (a vertically integrated agro-processing conglomerate in Zambia) announced its intention to start commercial production of palm oil in Muchinga province where it planted 2 873 hectares of palm trees (see here).
Net
impo
rts
Net
exp
orts

14
Figure 5: Population Projections to 2050
Source: UN World Population Prospects
Along with strong population growth, rapid urbanization will continue. By 2050, 54.8% of the population of Sub-Saharan Africa is expected to live in urban areas. There will be high levels of urbanization in each of the five countries in this study with the proportion of the population residing in urban areas by 2050 expected to reach 49.1% in Mozambique, 53% in Tanzania, 58.3% in Zambia, 46.3% in Mauritius and 77.4% in South Africa (Figure 6). Urbanization goes hand in hand with changes in consumption patterns and increased demand for processed food and rising urbanization thus supports a focus on increasing food processing capabilities.
Figure 6: Percentage of Population residing in Urban Areas, 2010 – 2015
Source: UN World Urbanization Prospects (2014)

15
2.5 Trends in Income
Over the past 15 years, per capita incomes in Tanzania, Zambia, Mozambique and Mauritius have risen at more than twice the rate of South Africa (although off a much lower base in all countries except Mauritius) (Figure 7). South African incomes peaked in 2008, after the longest sustained period of economic growth in the country’s history, but have stagnated since then and show no signs of increasing in the short to medium term. In absolute terms however, South Africa is still a large and important market for processed foods but in the medium term, growth in demand is likely to come from countries like Tanzania, Mozambique and Zambia, which will have much stronger population growth and rising urbanization. The per capita income trends also show how well Zambia is performing relative to Tanzania and Mozambique, with a widening gap in per capita income from 2002 to 2016.
Figure 7: GDP per capita (constant 2010 US$)
Source: World Bank Databank
2.6 Country Trends
This section reviews production and trade in food, beverages and tobacco within each of the five countries to give a sense of the productive capacity of the region. It also identifies value chains with significant potential for upgrading and increased trade within the region.
2.6.1 Zambia
Climate
Zambia’s climate varies from region to region. On average, annual rainfall is highest in the north and lowest in the south of the country. The southern and central regions of country often experience extreme weather variability in any given year. A 2011 study of the potential impact of climate change in Zambia estimated that, in the worst-case scenario, climate variability would reduce Zambia’s total Gross Domestic Product (GDP) growth rate by as much as 0.4 percentage points between 2006 and 2016, equivalent at the time to a loss of US$4.3bn (Thurlow, Zhu, & Diao, 2011).

16
Crop production
There is regional variation in the major crops grown in Zambia. Farmers in the northern region grow a range of crops including maize, cassava, groundnuts, beans, sweet potato and various vegetables but in the drier southern and eastern regions, farmers have historically grown maize in a continuous monoculture (Thierfelder, Mwila & Rusinamhodzi, 2013; Stern & Cooper, 2011). Interviews with farmers and animal feed manufacturers around Lusaka indicate that this is changing as farmers across the country are increasingly growing soya in rotation with maize due to the growth in demand for poultry feed across southerm Africa (Imakando, 2017). Many noted that crop rotation, particularly legume intercropping, has additional benefits such as improving crop yields and soil quality, thus reducing the probability of overall yield losses as rainfall becomes more variable (this is supoorted by Arslan, et al., 2015).
The increase in soya production in Zambia has been striking, with a compound annual growth rate of 24.5% between 2004 and 2014 (Figure 8). The production of soya has continued to increase since 2014, with total production of 351 416 metric tonnes in the 2016/17 season, largely due to the incorporation of more small- and medium-sized farmers into the soybean value chain. In the 2016/17 season, small- and medium-sized farmers produced 43% of the soybean crop, a 131% increase from the previous season (Ministry of Agriculture, 2017).
Figure 8: The 10 fastest-growing crops in Zambia, 2004 – 2014 (total production in tons)
Source: FAOSTAT production data
Imports
Zambia is a large importer of fish, spirituous beverages and vegetable oil (Table 2). Its food imports are mainly from other SADC countries with 77% of fish imports from Namibia, 60% of spirituous beverages imports from South Africa and more than 98% of its soya bean oil imports also from South Africa in 2015. Between 2015 and 2016, Zambia decreased its edible oil imports by 54% from $82.2mn to $37.8mn due to an 88% reduction in palm oil imports which were most likely replaced by increased local production of oilseeds.
Zambia also has large imports of nitrogenous fertilisers which come mainly from other countries within SADC. Fifty-three percent of Zambia’s fertilizer imports in 2015 were from South Africa and 14% from

17
Mozambique. Fertilizer prices have historically been quite high, partly due to collusion and other competition concerns in the sector (discussed in section 4). The high cost of fertilizer was identified as a key constraint to increased production by many small and medium sized farmers, the Zambian National Farmers’ Union and agricultural traders interviewed in Zambia all of whom cited this as a major factor a major limiting yields and thus reducing throughput to downstream processing business (Imakando, 2017).
Table 2: Zambia's top 5 imports in food, beverages and tobacco, sorted by value in 2016
Value of imports (USD mn)
Product label 2007 2008 2009 2010 2011 2012 2013 2014 2015 2016* CAGR
Fish, crustaceans, molluscs and other aquatic invertebrates
7.7
4.6
5.5
6.9
15.8
31.1
50.0
77.3
112.6
96.1 32%
Beverages, spirits and vinegar
9.9
13.6
16.1
16.1
29.0
36.8
35.3
38.1
32.5
72.9 25%
Animal or vegetable fats and oils
72.9
97.1
82.8
90.1
133.0
137.4
110.5
105.7
82.2
37.8 -7%**
Miscellaneous edible preparations
10.1
10.5
12.8
19.7
27.2
27.1
31.1
34.5
29.0
36.4 15%
Preparations of cereals, flour, starch or milk; pastrycooks' products
9.7
14.2
13.1
16.9
21.3
27.1
28.8
31.6
29.7
28.8 13%
Fertilisers
116.5
204.1
197.7
190.8
322.9
304.6
382.5
334.4
361.0
142.3
2% Source: ITC Trademap
*The 2016 Trademap Data for Zambia is mirror data, which may not be a true reflection of trade value.
**Note: the CAGR for animal or vegetable fats and oils is not a good reflection of the trend over the period. Edible oil imports increased from 2007 to 2015 when it dropped sharply. The CAGR for edible oils between 2007 and 2015 is +1.5%.
Exports
Zambia’s largest exports in 2016 were unmanufactured tobacco exported to Malawi and Germany. Amongst the next four large import categories, three relate to the cereals value chain (Table 3). Cereal export grew strongly at a CAGR of 7% of the period, but this masks the variability in exports over the period. The growth in cereal exports is mainly due to strong growth in maize exports to neighbouring countries, and the variability may be due to regular export bans placed on maize in the interest of domestic food security. These types of policy decisions may need to be reassessed in the interest of deepening regional markets.
Soya oilcake, which is one of the components of the category ‘Residues and waste from the food industries’ grew in line with Zambia’s increased production of soybeans. Exports of soya oilcake increased at a CAGR of 32.4% between 2007 and 2015 (and at a CAGR of 46.8% between 2007 and 2014), making Zambia the second-largest exporter of oilcake in SADC in 2015 after South Africa. In 2013 Zambia actually exported more soya oilcake than South Africa, which indicates spectacular growth considering Zambia recorded no soya oilcake exports just five years earlier in 2008.
Zambia’s third largest export is sugar and sugar confectionery products, but these exports have been under pressure, declining at a compound annual rate of 2% per annum. This is due to a decline in both raw sugar exports (of -2% per annum) and an even larger decline in sugar confectionery products (of -9% per annum), pointing to constraints in Zambia’s downstream confectionery industry.

18
Table 3: Zambia's top 5 exports in food, beverages and tobacco, sorted by value in 2016
Value of Exports (USD mn)
Product Label 2007 2008 2009 2010 2011 2012 2013 2014 2015 2016 CAGR
Tobacco and tobacco substitutes
62.0 71.9 89.6 117.8 100.5 156.8 216.9 143.4 106.4 175.0 12%
Cereals 63.1 51.4 24.4 37.2 191.5 419.8 161.7 78.2 204.5 115.9 7%
Sugars and sugar confectionery
90.1 64.3 101.8 149.7 164.5 143.6 188.9 221.6 134.7 77.1 -2%
Residues and waste from the food industries; prepared animal fodder
4.7 5.0 7.0 17.5 27.8 131.7 80.7 75.2 34.4 25.8 21%*
Products of the milling industry; malt; starches; inulin; wheat gluten
23.0 33.3 25.1 33.2 58.0 36.1 68.2 47.6 25.5 1.8 -25%*
Oilcake and other solid residues, resulting from the extraction of soya-bean oil
1.5 0 3.1 6.6 2.4 4.9 29.6 22.0 14.2 No data
32.4% (2007-2014)
Source: ITC Trademap
*Note: the CAGR for these categories is not a good reflection of the trend over the period. Between 2007 and 2013, the CAGR for ‘products of the milling industry’ was 19.9% but exports declined to 2015 and dropped precipitously in 2016. Similarly, the CAGR for ‘Residues and waste from the food industries’ between 2007 and 2013 was 60.6% but exports declined steadily thereafter. The reasons for the 2013 peak and subsequent decline are not clear.
Potential agro-processing value chains to explore
Over the past 10 years, Zambia has shown potential to become a leading exporter of maize and soya to the region. Its trade surplus in cereals, primarily driven by maize, grew by 10% per annum between 2007 and 2016 (and by 18% per annum between 2007 and 2015, thus excluding the dampening effect of the El Nino-induced drought on 2016 exports). Interviews with farmers suggest that production and yield of small-scale, rain-fed farmers can be increased further if farmers had access to inputs (particularly more affordable fertiliser) and better infrastructure, including storage facilities.
There are limited opportunities for the development of a strong regional value chain in maize because most countries within SADC are self-sufficient in maize production. Maize also does not offer significant opportunities for further downstream processing, generally undergoing only primary processing to maize meal. The links between maize and adjacent value chains in animal feed are weak because maize oilcake has lower value than soya oilcake, for example, in the animal feed sector. The Zambian government has also imposed restrictions on maize exports in recent years to meet national food reserve requirements, generating uncertainty about producers’ ability to participate in export markets. While maize is likely to remain an important crop, interest is increasingly shifting to the soya value chain which provides high-value soya oilcake for the growing poultry sector across SADC.
Zambia has also grown production and exports of tobacco and sugar, and there seem to be opportunities for increased investment in downstream processing within both value chains. Between 2012 and 2016, Zambia was consistently a net exporter of unmanufactured tobacco while imports of manufactured tobacco and cigarettes increased. Across SADC, there was a trade surplus of $2bn in unmanufactured tobacco in 2016 but net imports of $32mn in manufactured tobacco products.
The trends are similar in sugars and sugar confectionery with exports of raw sugar and imports of sugar confectionery products. Zambia is one of the lowest-cost sugar producers in the world but its sugar

19
processing industries are not well developed and its trade balance in sugar confectionery products worsened significantly in 2016. In 2007, Zambia had a trade surplus of $2.9mn in sugar confectionery products, which increased nearly fourfold to $10.8mn in 2015. However, in 2016 Zambia recorded a trade deficit of $5.3mn in sugar confectionery products, despite recording net exports of raw cane sugar of $68.7mn in the same year.4
There is also a large and persistent deficit in sugar confectionery products across SADC to be met. Though SADC’s trade deficit in sugar confectionery products has reduced over time, it remains significant at -$26.2mn in 2016.
2.6.2 Tanzania
The government of Tanzania has identified the development of agriculture and agro-processing as a core pillar of the country’s industrialisation strategy. The Tanzania Development Vision 2025 envisions that by 2025 Tanzania will be a middle-income country characterised by a competitive and diversified economy with a substantial industrial sector, capable of producing sustainable growth and shared benefits. The Development Vision depends in part on achieving annual average agricultural growth of 6% between 2010 and 2025.
The National Agriculture Policy 2013 provides a summary of the challenges to agricultural growth. These include low productivity of land, labour and production inputs; over-dependency on rainfed agriculture, limited capital and lack of access to finance for the uptake of new technology, poor rural infrastructure and low levels of agro-processing. Weak producers’ organizations and depressed commodity prices also limit opportunities in the agricultural sector. Despite a clear articulation of the various challenges to the growth of the agricultural sector, the impact of climate change is notably absent from these development strategies.
The challenges notwithstanding, there are numerous opportunities for growth in agriculture and agro-processing within Tanzania. The country has abundant natural resources and different agro-ecological zones gives it comparative advantage in the production of various crops. The north-eastern, north-western and northern parts of the coastal belt experience two distinct rainfall patterns with heavy rains between March and May and light rainfall between October and December (Munishi, Shirima Jackson & Kilungu, 2010). In the central, southern, south-eastern and western regions rainfall is uni-modal starting in mid-November until mid-April (Munishi et al., 2010). Due to varying rainfall patterns, planting and harvesting can occur throughout the year, particularly for rainfed crops.
With climate change, rainfall is predicted to decrease in all regions except the north-western region. Forecasts indicate that Tanzanian maize production could decline by as much as 13.0 percentage points between 2030 and 2069 due to climate change (Rowhani et al., 2011, Munishi et al., 2010 and Thornton, Jones, Ericksen and Challinor, 2011). Adapation strategies, including a switch to indigenous drought-resistent crops, will be vital to mitiagte the impact of climate change on the production of maize and other field crops.
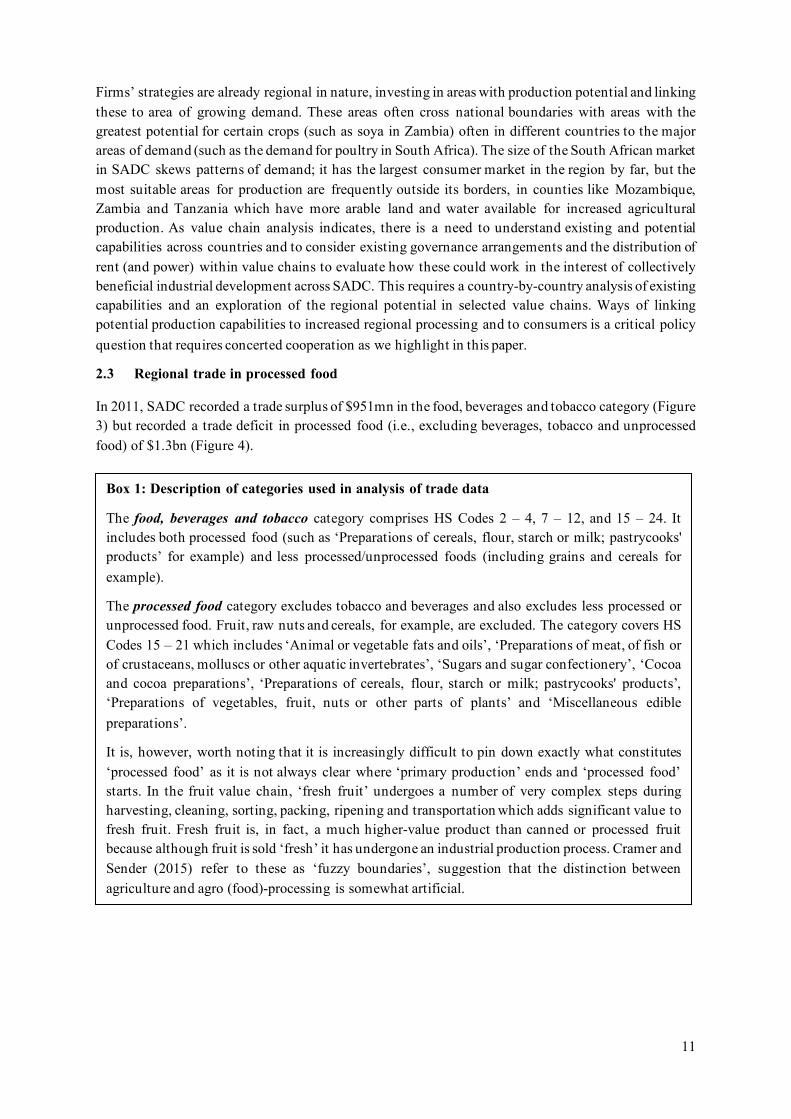
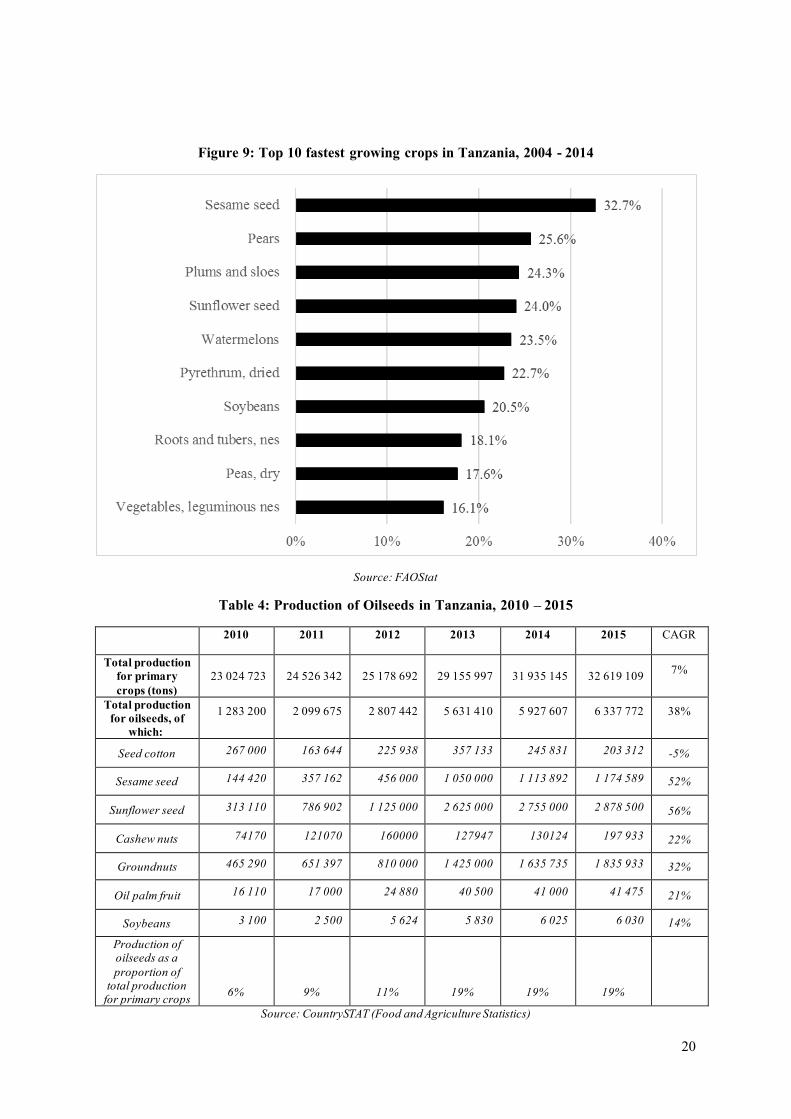
The top 10 fastest growing crops in Tanzania over the period 2004 – 2014 (Figure 9) are all in two categories; oilseeds (including sesame, sunflower and soybeans), and horticultural products including fruit (pears, plums, watermelons), vegetables (leguminous vegetables, peas, roots and tubers) and flowers (puyrethrum). A closer look at the oilseeds production data confirms the significant increase in oilseed production, particularly in the three years to 2015 (Table 4).
4 Zambia’s sugar confectionery imports were mainly from South Africa, reportedly by South African-owned supermarkets expanding their footprint across Zambia. This is discussed further in section 4.
20
Figure 9: Top 10 fastest growing crops in Tanzania, 2004 - 2014
Source: FAOStat
Table 4: Production of Oilseeds in Tanzania, 2010 – 2015
2010 2011 2012 2013 2014 2015 CAGR
Total production for primary crops (tons)
23 024 723 24 526 342 25 178 692 29 155 997 31 935 145 32 619 109 7%
Total production for oilseeds, of
which:
1 283 200 2 099 675 2 807 442 5 631 410 5 927 607 6 337 772 38%
Seed cotton 267 000 163 644 225 938 357 133 245 831 203 312 -5%
Sesame seed 144 420 357 162 456 000 1 050 000 1 113 892 1 174 589 52%
Sunflower seed 313 110 786 902 1 125 000 2 625 000 2 755 000 2 878 500 56%
Cashew nuts 74170 121070 160000 127947 130124 197 933 22%
Groundnuts 465 290 651 397 810 000 1 425 000 1 635 735 1 835 933 32%
Oil palm fruit 16 110 17 000 24 880 40 500 41 000 41 475 21%
Soybeans 3 100 2 500 5 624 5 830 6 025 6 030 14%
Production of oilseeds as a proportion of
total production for primary crops 6% 9% 11% 19% 19% 19%
Source: CountrySTAT (Food and Agriculture Statistics)

21
Trade
Between 2012 and 2016, Tanzania’s total imports in the food, beverages and tobacco category increased by a compound rate of 2.7% per annum while exports increased by 9.7% per annum (Figure 10). Processed food imports grew by 3.9% per annum and processed food exports grew by a slightly higher annual rate of 4.6%, but this analysis is skewed by the significance of palm oil in the processed food trade data.
Palm oil constitutes, on average, 54.7% of Tanzania’s processed food imports and 18.9% of its exports between 2007 and 2016. Excluding palm oil from the analysis, Tanzania’s processed food imports increased by 7.4% per annum between 2007 and 2016 (compared to 3.9%, showing large sustained imports of palm oil over time). Processed food exports, excluding palm oil, grew by 6.7% per annum (compared to 4.6%). Though Tanzania seems to be making progress in turning around its trade deficit in food products the relative weakness of export growth shows that there is significant and growing demand for processed food still to be met. Some authors have suggested that Tanzania is returning to a path of import-substitution industrialisation (see, for example Behuria, 2017) and while the data reflect relative growth in exports, there is a risk that processed food imports will continue to grow faster than processed food exports in the absence of increased investment in agro-processing industries.
Figure 10: Total imports and exports in food, beverages and tobacco (Tanzania)5
Source: ITC Trademap
Imports
Tanzania’s largest imports in the food, beverages and tobacco category were edible oils, cereals and sugar and sugar confectionery (Table 5). Within these categories, its main imports were palm oil from Malaysia, wheat from Russia, Canada and Germany and raw sugar from the UAE, India, Malawi and Brazil.
5 The category ‘food, beverages and tobacco’ include HS codes 02 – 04, 07 – 12, and 15 – 24. The category ‘processed food’ includes HS Codes 15 – 21.

22
Table 5: Tanzania's top 5 imports in food, beverages and tobacco, sorted by 2016 value
Value of imports (USD mn) Product label 2007 2008 2009 2010 2011 2012 2013 2014 2015 2016 CAGR Animal or vegetable fats and oils 250.3 203.6 125.5 211.3 317.7 298.0 233.3 427.4 264.0 301.3 2%
Cereals 242.6 208.0 230.9 308.8 470.7 471.7 400.1 346.7 273.5 213.5 -1% Sugars and sugar confectionery 67.3 41.5 57.0 92.5 126.0 183.8 147.8 117.3 114.0 153.6 10%
Beverages, spirits and vinegar 28.7 35.3 38.1 52.3 60.4 70.0 67.0 62.4 49.9 46.3 5%
Products of the milling industry; malt; starches; inulin; wheat gluten 25.1 49.7 50.5 65.7 55.5 37.6 24.1 55.1 19.4 23.5
-1%
Source: ITC Trademap
Exports
Tanzania’s largest exports were tobacco, edible fruit and nuts, and edible vegetables and tubers. Within these categories, Tanzania exported mainly unmanufactured tobacco to Belgium, cashew nuts to India and Vietnam and beans and peas to India.
Table 6: Tanzania’s top 5 exports in food, beverages and tobacco, sorted by value in 2016
Value of exports (USD mn) Product label 2007 2008 2009 2010 2011 2012 2013 2014 2015 2016 CAGR
Tobacco and manufactured tobacco substitutes 96.7 180.6 97.9 141.2 123.3 223.1 129.1 322.9 293.6 367.7 16% Edible fruit and nuts; peel of citrus fruit or melons 30.0 74.0 92.3 127.6 128.7 189.9 193.8 399.6 279.3 343.7 31% Edible vegetables and certain roots and tubers 58.1 78.1 64.1 100.4 74.3 133.6 105.1 249.8 398.6 255.2 18% Coffee, tea, maté and spices 164.6 162.1 204.6 173.3 225.5 281.9 261.1 213.5 229.0 209.8 3% Oil seeds and oleaginous fruits 47.7 63.4 87.6 77.7 103.6 157.1 170.8 360.5 166.2 146.0 13%
Source: ITC Trademap
Trade balance and value chains of interest
Tanzania’s exports tell a story of growing agricultural productivity with impressive growth rates in the exports of tobacco, oilseeds, vegetables, and nuts. With the impressive growth in oilseeds, Tanzania is in a good position to meet the SADC regional deficit of $103mn in sunflower oil and of $15mn in sunflower seeds.
2.6.3 Mozambique
Climate
Climatic conditions within Mozambique vary significantly with subtropical conditions in the north and central regions, and arid conditions in the south. The northern part of Mozambique has the most arable land and though various crops including maize, sweet potato, sorghum, rice, groundnuts, cowpeas, sesame, cassava, beans, and soya are grown there, it is still significantly underutilized (African Centre for Biodiversity, 2015).
Climate change is likely to have a significant impact on crop yields across the country, but the severity of the impact will vary between regions (Table 7). Central Mozambique seems to be most at risk, with

23
decreases of between 3 and 5.6% expected in the maize yields, and decreases between 3.1 and 6.2% in cassava (Arndt & Thurlow, 2015).
Table 7: Projected changes in crop yields due to climate change: Mozambique (base year = 2007)
Region Period Crops (Range of estimated yield change, %, 2007 as base year)
Central Mozambique 2007 – 2050 Maize: Between -3% and -5.6% Cassava: Between -3.1% and -6.2%
North Mozambique 2007 – 2050 Maize: Between -1.9% and -2.9% Cassava: Between -0.1% and -6.5
South Mozambique 2007 – 2050 Maize: Between -3.9% and -4.4% Cassava: Between 0.4% and -3.2%
Source: Arndt et al. (2011)
Imports
Mozambique’s largest imports in 2016 were cereals (mainly wheat imported from the UAE and Russia and rice imported from Thailand), edible oils (mainly palm oil imported from Indonesia) and beverages (mainly beer and wine imported from South Africa and Portugal) (Table 8). Mozambique also has a sustained, though volatile, imports of nitrogenous fertilizer over the entire period, mainly imported from South Africa.
Table 8: Mozambique's top 5 imports in food, beverages and tobacco, sorted by value in 2016
Value of imports (USD mn) Product label 2007 2008 2009 2010 2011 2012 2013 2014 2015 2016 CAGR
Cereals 181.5 244.2 275.6 149.2 308.3 208.9 405.7 371.3 323.7 301.4 6% Animal or vegetable fats and oils 48.5 111.9 80.1 77.7 141.2 64.8 185.5 162.5 100.5 93.5 8%
Beverages, spirits and vinegar 12.1 16.1 17.4 22.3 35.5 39.6 79.2 98.5 90.4 77.4 23% Fish and crustaceans, molluscs and other aquatic invertebrates 24.9 36.1 37.1 33.9 55.4 47.6 88.9 87.8 80.9 59.8 10%*
Dairy produce; birds' eggs; natural honey; edible products of animal origin, n.e.s. 48.6 22.4 25.4 24.6 40.0 50.1 47.4 50.9 44.6 35.1 -4%
Fertilisers 14.1 72.8 47.6 46.9 101.7 65.6 51.3 86.7 35.7 35.5 11%
Source: ITC Trademap
*Note: The CAGR value is skewed by the drop between 2015 and 2016. The CAGR to 2015 is 15.9%
Exports
Mozambique’s largest exports were tobacco and tobacco products, sugar and sugar confectionery, and edible fruit and nuts. In both tobacco and sugar, Mozambique exported mainly unprocessed goods. Unmanufactured tobacco accounted for more than 99.9% of Mozambique’s tobacco exports in 2016 and more than 93% of total sugar exports were made up of raw cane sugar. In ‘edible fruit and nuts’, Mozambique’s main exports were cashew nuts ($29.2mn) and bananas ($23.4mn) exported mainly to India and South Africa respectively.

24
Table 9: Mozambique’s top 5 exports in food, beverages and tobacco, sorted by value in 2016
Value of exports (USD mn) Product label 2007 2008 2009 2010 2011 2012 2013 2014 2015 2016 CAGR Tobacco and manufactured tobacco substitutes 2.0 0.3 0.4 0.0 0.1 111.4 52.8 443.2 2.5 455.1 82% Sugars and sugar confectionery 3.5 17.2 37.8 7.3 64.0 81.3 224.3 7.4 7.1 82.4 42% Edible fruit and nuts; peel of citrus fruit or melons 26.5 38.1 39.2 43.4 255.5 49.6 55.8 81.3 45.9 72.9 12% Fish and crustaceans, molluscs and other aquatic invertebrates 6.2 10.8 41.0 28.7 35.2 22.0 26.4 49.0 30.6 35.2 21% Oil seeds and oleaginous fruits; miscellaneous grains, seeds and fruit; industrial or medicinal plants; straw and fodder 0.8 0.4 2.5 3.0 3.7 1.2 5.2 15.2 32.2 26.1 48%
Source: ITC Trademap
Potential agro-processing value chains to explore
Mozambique is a net exporter of unmanufactured tobacco and raw sugar. Between 2012 and 2016, it exported an average of $24mn in unmanufactured tobacco per year but imported cigars, cigarettes and other tobacco products. This indicates that there are opportunities for investment at the processing level of the tobacco value chain. However, it is worth nothing that Mozambique already seems to be part of a regional value chain in tobacco products. It exports most of its rolled tobacco to Zimbabwe and imports cigarettes containing tobacco from Zimbabwe. The regional benefits of investing in additional cigarette manufacturing facilities in Mozambique are thus unclear. If a tobacco value chain were developed, it will likely span Zambia, Tanzania (which ara also large tobacco producers), Mozambique and Zimbabwe.
Like Zambia, Mozambique’s downstream sugar confectionery industry appears underdeveloped. Mozambique is a net exporter of raw cane sugar but a net importer of sugar confectionery products. Its raw sugar exports are destined mainly for the EU while a large proportion of sugar confectionery products are imported from South Africa (this is also similar to the trends in Zambia). In 2015, about 39% of Mozambique’s sugar confectionery products were imported from South Africa, the largest single source of imports by some margin, showing the dominance of South African-based multinationals in regional retail markets. These imports could be replaced by increased local processing within Mozambique, which is discussed further in section 4 below.
2.6.4 South Africa
South Africa is the largest and most industrialised economy in the SADC region, which means that any assessment of its inclusion in regional value chain must necessarily be sensitive to the power and influence of South African large and lead firms and their role in shaping value chain across the region. It is a large exporter of processed food and consumer goods within the SADC region and these exports have increased with the expansion of South African-owned supermarkets throughout southern Africa (das Nair and Chisoro-Dube, 2016).
Although South Africa is currently a large exporter of processed food products to the region, its commercial agricultural sector is expected to come under increasing pressure because of climate change. South Africa is a water scarce country with variable rainfall and high evaporation rates across the country (UNEPFI, 2009). Forecasts to 2050 predict that the Northern Cape and the arid regions of the Free State and Mpumalanga will face the highest incremental increases in temperature in the country, and will become drier as a result. In 2016, these three provinces accounted for 67% of South

25
Africa’s maize crop, 81.2% of the sorghum crop and 82.3% of the soya crop and declines in production and yield may have a significant effect on agricultural production in South Africa.
With respect to the other provinces, Gauteng and the North West will face the highest variation in rainfall to 2050 and the coastal provinces (the Western Cape, Eastern Cape and KwaZulu-Natal) are expected to continue to face high incidence of extreme weather conditions which will also intensify soil degradation (Gbetibouo, Ringler and Hassan, 2010). The Limpopo province will likely experience an increase in temperature, reduction in rainfall, and will also get drier as a result (Maponya & Mpandeli, 2012).
Like other countries within the region and in this study, South Africa’s principal crop is maize, which is not drought resilient. Due to the recent drought in 2015/16, South Africa experienced a drop in maize yields of 4.6 million tons in 2015, and 2.4 million tons in 2016. Maize supply shortfalls were recovered by imports from Brazil, Argentina, United States, Mexico and Zambia (AFBIO, 2016). The overall decrease in rainfall forecast within South Africa, coupled with increasing temperatures and more extreme weather events, mean that declining yield may be a long-term problem. Because of this, existing production capabilities may no longer be a good indicator of a country’s future role within an agricultural value chain.
South Africa has also made significant investments in expanding soya processing capacity to meet the demand for animal feed primarily for the poultry sector. This has, in turn, encouraged increased soya production (see section 3.1). However, as a drought-prone country, South Africa’s capacity to further increase soya production is limited and investments have been made in developing drought resistant soya cultivars more suited to the South African climate. If we had taken a regional value chain approach instead, South Africa may look towards countries such as Zambia for unmet soya demand and use scarce water resources for higher value crops such as fruit where it has already penetrated global markets.
Imports
South Africa’s largest imports in the food, beverages and tobacco category were cereals, edible oils and meat and edible meat offal (Table 10). The country’s 2016 imports were significantly affected by the El Nino-induced drought, particularly in the cereals category where it recorded maize imports of $620mn in one year. By contrast, total maize imports between 2007 and 2015 was $588mn, indicating the magnitude of the 2016 maize imports. The other large cereal imports are rice, imported mainly from Thailand and India, and wheat which is imported from Russia, Germany, the USA, Lithuania and Poland, though the origin of wheat imports varies significantly from year to year. The CAGR for cereals imports masks the annual variability in imports. In non-drought years, cereals imports are largely comprised of wheat (and some rice). Given South Africa’s water scarcity, and the water intensity of wheat production, it will not be self-sufficient in wheat in the medium term, particularly not with climate change. In drought years such as 2012 and 2016 there are sharp increases in exports, which reflect maize imports to supplement low local maize production.
South Africa’s edible oil imports are largely split between palm oil, soya bean oil and sunflower oil, which accounted for 42%, 22,8% and 16.1% of the total value of edible oil imports in 2016 respectively. Imports in “meat and edible meat offal” were largely frozen poultry products imported from the European Union.

26
Table 10: South Africa's top 5 imports in food, beverages and tobacco, sorted by 2016 value
Value of imports (USD mn) Product label 2007 2008 2009 2010 2011 2012 2013 2014 2015 2016 CAGR
Cereals 784.2 953.7 754.7 728.0 1189.7 1306.2 1127.6 994.3 786.0 1377.6 6.5%* Animal or vegetable fats and oils 662.8 798.7 542.3 836.5 1083.7 1070.7 813.9 771.0 459.1 682.6 0.3% Meat and edible meat offal 358.9 295.4 291.7 493.4 698.8 744.7 638.8 563.6 449.4 530.9 4.4% Beverages, spirits and vinegar 428.0 436.9 444.9 536.6 640.8 654.2 656.4 548.7 429.7 441.1 0.3% Residues and waste from the food industries; prepared animal fodder 324.8 445.2 419.3 530.1 593.9 618.6 582.0 502.4 326.2 431.6 3.2%
Source: ITC Trademap
*Note: The CAGR masks the trends in cereal imports which is related to climate variability (see discussion above)
Exports
South Africa is large exporter of fruit and processed fruit products (Table 11). Fresh fruit is exported largely to the European Union but exports to China, the UAE, Saudi Arabia and Russia have grown well over the past 10 years.
The third largest export category, ‘preparations of fruit and vegetables’ is made up mostly of fruit juices, purees or concentrates, and canned or preserved fruit. Juice is exported mainly to other SADC countries, which collectively accounted for more than 50% of the 2016 juice exports by value. Canned fruit is exported to a range of countries including the UK (15% of exports in 2016), Japan (10.2% of 2016 exports), Germany (9.8% of 2016 exports) and China (7.2% of 2016 exports).
South Africa is also a large exporter of wine, largely to the EU and north America though exports to China have grown more than 33% per annum (though off a small base) between 2007 and 2016.
Table 11: South Africa’s top 5 exports in food, beverages and tobacco, sorted by value in 2016
Value of exports (USD mn) Product label 2007 2008 2009 2010 2011 2012 2013 2014 2015 2016 CAGR
Edible fruit and nuts; peel of citrus fruit or melons 1479.8 1588.0 1619.2 2195.5 2301.8 2358.8 2640.5 2823.3 2828.0 2887.6 7.7% Beverages, spirits and vinegar 904.3 1043.6 1015.6 1299.6 1347.6 1280.3 1439.2 1405.6 1215.2 1199.6 3.2% Preparations of vegetables, fruit, nuts or other parts of plants 328.5 373.4 388.8 616.9 637.9 620.0 624.0 651.2 555.4 562.9 6.2%
Cereals 51.8* 678.4 497.5 570.1 1103.2 733.5 940.5 804.4 370.4 441.9
-5.2% (from 2008)
Fish and crustaceans, molluscs and other aquatic invertebrates 463.5 487.5 387.9 473.0 507.4 453.8 434.5 483.4 395.8 441.6 -0.5%
Source: ITC Trademap
*Note: Cereals exports for 2015 seem low compared to the rest of the data series. The data point is as reported by Trademap but requires verification. The data point is excluded from the CAGR calculation to prevent skewing the trend.

27
Intra-regional trade: South Africa-SADC trade
Between 2007 and 2016, South Africa’s exports of processed food to the rest of the SADC grew by 18.4% per annum (from $273mn in 2007 to $1.25bn in 2016). Overall; exports of food, beverages and tobacco products increased by 21.4% per annum. These large increases are in line with South Africa’s position as the largest industrial economy in the region and the increasing processed food exports via South African-owned retailers expanding across SADC (discussed further in section 4).
South Africa’s imports from the rest of SADC have also grown over the period 2007 to 2016, though off a small base. In 2007, South Africa’s imports from the rest of SADC were about $24.3mn and grew to $326mn in 2016, a CAGR of 33.5%. More broadly, imports of food, beverages and tobacco grew by 20.5% per annum.
The processed food imports that grew most strongly were (1) ‘meat of bovine animals’ which grew from zero in 2007 to $32.8mn in 2016, (1) wheat flour which grew from zero in 2007 to $13mn in 2016 and, interestingly, (3) malt beer which grew from $0.7m in 2007 to $49.2mn in 2016. This shows how little South Africa imported from the rest of the SADC region even ten years ago and how great the potential for further integration is.
Trade balance and value chains of interest
In processed food, South Africa has large trade deficits in edible oils, chocolate, preserved sardines and pasta. Although there is potential for South Africa to shift its edible oil imports to Tanzania, the rest of the imports are small in value and present limited potential for the development of a regional value chain.
If we look at agricultural imports that could support the development of a regional value chain more broadly, the largest potential lies in soya oilcake for the South African poultry sector. In 2016, South Africa imported soya oilcake worth $201mn, all of which was sourced from Argentina. Other imports, such as South Africa’s $342.9mn net imports in rice could also be shifted to Tanzania but unlike the soya oilcake, there is limited potential for further processing or joint upgrading that makes the soya to poultry value chain compelling.
2.6.5 Mauritius
Mauritius is a volcanic island with significant regional variation in rainfall. The western coastal lowlands have relatively low annual average rainfall and can only support agricultural activity under irrigation (Staub, Stevens & Waylen, 2014; Luximon & Nowbuth, 2010). The eastern coast and central plateau have more favourable rainfall patterns that can support rainfed agriculture (Luximon & Nowbuth, 2010). Rainfall variability is expected to increase with climate change, with decreased rainfall along the north and east coasts, and increased rainfall along the south and west coasts (Staub et al, 2014).
Mauritius is mostly suitable for sugarcane production and is a a net importer of many processed food items incluidng flour, rice, pulses, meat, onions and milk products (Luximon & Nowbuth, 2010). The country’s 2020 Strategic Plan outlines its intention to break from the monoculture of sugarcane and diversify crop production in an attempt to reduce food imports.6 In 2015, more than 60% of the arable land in Mauritius (approximately 53 000 hectares) was under sugar cultivation and produced about 500 000 tonnes of sugar. This was down from 87 000 hectares under sugarcane cultivation in 1973 and peak production of more than 700 000 tonnes but still indicates extensive reliance on sugarcane (Jack, 2015).
6 See Strategic Plan 2016-2020 for the Food Crop, Livestock and Forestry sectors

28
The end of Mauritius’s preferential trade agreement with the EU (the ‘Sugar Protocol’) dealt a blow to the Mauritian sugarcane industry. Under the Sugar Protocal, Mauritius received favourable access to the EU at prices above the world market price for sugar. With the end of this agreement, Mauritian sugar refiners have looked to other SADC countries, expanding sugar cane cultivation in Kenya and Tanzania and are exploring greater value addition locally to improve returns. Government also implemented significant reforms, including centralising sugar purchases under the ‘Mauritius Sugar Syndicate’ and reducing the number of processing plants that crush and refine the sugar from 17 to 4 (Ackbarally, 2014). Farmers have been facing lower sugar purchase prices and are responding by shifting to the production of ‘fairtrade’ sugar, which allows them to earn and additional $60/tonne of sustainably produced sugar (Ackbarally, 2014).
Despite the importance of sugar in the Mauritian agro-processing sector, it is actually a relatively high cost sugar producer, primarly due to low milling capacity and relatively high cost of labour. The rockiness of much of its sugarcane lands also impedes mechanisation, which constrain efficiency improvements.
Imports
Mauritius imports a large amount of its agricultural produce and processed food products. In 2016, its largest imports were frozen fish, dairy products (mainly milk and cheese) and cereals (mainly rice and wheat) (Table 12). In 2015, Mauritius imported frozen fish fillets mainly from South Africa (21% of total imports), but other large processed food imports came from outside SADC. Milk was imported mainly from France (44% of total), cheese from Australia (52% of total) and both rice and wheat flour from India (84% and 94% of total respectively).
Mauritius is less integrated into food-processing value chains within SADC than the other countries in this study and there are opportunities for greater integration through import replacement, particularly where other SADC countries have established production capabilities. For example, it could import rice from Tanzania, fish from Tanzania and South Africa and dairy products from South Africa, Zambia, or Tanzania. Although Mauritius is a net exporter of sugar, it does import some sugar from Brazil (about $32mn in 2016), which could be imported from Zambia or South Africa instead.
Table 12: Mauritius's top 5 imports in food, beverages and tobacco, sorted by value in 2016
Value of imports (USD mn) Product label 2007 2008 2009 2010 2011 2012 2013 2014 2015 2016 CAGR Fish and crustaceans, molluscs and other aquatic invertebrates 215.9 284.9 208.4 239.5 304.2 363.6 366.3 316.1 242.3 295.8 4%
Cereals 108.2 144.8 114.8 128.0 124.0 142.6 153.5 140.5 109.4 93.3 -2% Dairy produce; birds' eggs; natural honey; edible products of animal origin, n.e.s. 78.8 105.9 80.5 99.1 112.8 118.4 107.6 125.8 91.9 103.2 3%
Tobacco and manufactured tobacco substitutes 20.2 42.3 38.6 48.2 57.4 70.6 67.3 67.8 60.5 63.1 13% Animal or vegetable fats and oils 41.0 57.2 44.3 40.8 67.9 68.6 55.1 60.7 40.7 45.9 1%
Sugars and sugar confectionery 20.5 21.5 21.8 23.3 38.0 51.4 36.7 37.7 37.9 42.2 8%
Source: ITC Trademap
Exports

29
In 2016, Mauritius’s largest exports were ‘preparations of meat, fish, crustaceans, molluscs and other aquatic invertebrates’, sugars and sugar confections and ‘fish and crustaceans, molluscs and other aquatic invertebrates’ although it is still a net importer in the last category (Figure 11 and Table 13).
Table 13: Mauritius's top 5 exports in food, beverages and tobacco, sorted by value in 2016
Value of exports (USD mn) Product label 2007 2008 2009 2010 2011 2012 2013 2014 2015 2016 CAGR Preparations of meat, of fish or of crustaceans, molluscs or other aquatic invertebrates 198.8 219.7 220.9 250.5 277.8 344.7 375.8 320.6 256.0 263.0 3.2% Sugars and sugar confectionery 300.6 296.6 224.3 268.3 306.9 273.7 316.5 261.8 222.7 237.5 -2.6% Fish and crustaceans, molluscs and other aquatic invertebrates 63.4 61.8 62.8 73.3 56.9 76.5 100.0 135.1 128.6 133.2 8.6% Coffee, tea, maté and spices 1.2 1.6 1.4 3.9 2.0 4.6 2.4 5.9 23.1 49.8 51.5% Residues and waste from the food industries; prepared animal fodder 11.1 12.7 18.8 15.3 20.7 27.7 29.7 28.3 31.9 28.2 10.9%
Source: ITC Trademap
Figure 11: Trade balance in ‘fish & fish products’ and ‘sugars & sugar confectionery’
Source: ITC Trademap
Potential agro-processing value chains to explore
As discussed above, Mauritius is not very integrated into regional food-processing value chains and sources many of its processed food products from European and Asian markets. To integrate Mauritius into regional value chain, one option is to explore opportunities to replace current deep-sea imports with imports from other SADC countries but there may also be potential for Mauritius to lead the establishment of a processed fish value chain within SADC.
Mauritius imports large quantities of frozen tuna from Spain, China and France and exports processed tuna fillets and canned tuna to the UK, Italy, Spain and the Netherlands. It has positioned itself as a hub for the marine industry with investments in light processing facilities (including sorting, grading,

30
cleaning, filleting, and canning), in warehousing and storage for transhipment and re-export, and in ancillary services such as ship handing, ship building and repair. 7 Mauritius has succeeded in growing its fish processing industry and is recording large net exports of processed fish (Figure 11).
There is potential for Mauritius to shift current deep-sea imports of frozen fish from Europe and China to other SADC countries (including South Africa and Mozambique) and for Mauritius to play a lead role in expanding its capabilities and investments in ocean-based aquaculture to these countries. The fish processing value chain also depends on the acquisition of associated capabilities in logistics and the development of a reliable cold chain transportation systems, which are beneficial for growth in other agro-processing exports, including horticultural and meat products which all require cold chain logistics infrastructure.
2.7 Summary: identifying high-potential regional value chains for further analysis
The preceding section evaluates trade data on a country-by-country basis to understand high-potential value chains across the region (summarized in Table 14 below). The analysis supports the evaluation of regional value chains in soya to poultry and in sugar and the downstream processing of sugar confectionery products.
A regional soya to poultry value chain can support the growing demand for soya in South Africa derived from growing demand for poultry products. Regional soya production, which is already growing at a significant pace in Zambia in particular, can replace deep-sea imports. The soya to poultry value chain illustrates how we can use existing regional resources instead of taking a narrow national approach to food security (such as investing in drought-resistant soya strains to increase soya production in south Africa, for example). With climate change, identifying and using regional resources to respond to food shocks will become increasingly important.
The sugar to sugar confectionery value chain is interesting for slightly different reasons; it highlights some tensions within the policy environment that can frustrate regional industrial development despite a regional advantage in primary production. The production data shows that all countries in this study have the potential for relatively low-cost and large-scale sugarcane production. However, despite low-cost sugar production, the region is still a net importer of processed sugar confectionery products. This goes to the heart of the challenge of seeing food processing as an industrialization imperative, which we have set out above.
These value chains are thus illustrative of various challenges that impede the development of regional value chains. These include a lack of knowledge of regional production and market dynamics that limits opportunities for joint development and incoherent policy frameworks. Though this study will focus on the soya to poultry and sugar to sugar confectionery value chains, several other value chains of interest have been identified in the analysis of trade date. They are summarized below with a short description of value chain potential and proposed areas for future research. Before discussing these value chains in more detail, we briefly discuss some challenges encountered in doing the value chain studies. The challenges pose some interesting insights for the selection and framing of value chain studies in future.
The first challenge is that similar value chains emerge as ‘high potential’ across all countries which makes it difficult to argue for a particular distribution of economic value within a proposed regional value chain. Apart from Mauritius, all the countries in this study are close to each other, have similar agro-ecological conditions and similar production capabilities. It is unsurprising that similar value chains thus emerged as high-potential across all countries. Under these conditions, it may be tempting to suggest that the countries that already have manufacturing capabilities (such as South Africa in sugar
7 http://www.investmauritius.com/Seafood/document.pdf and http://fisheries.govmu.org/English/Pages/Fisheries---SEA-FOOD-HUB.aspx

31
confectionery) should continue to build these capabilities and increase exports to meet the regional deficit, but should shift imports of inputs to other SADC countries. The benefits to the latter are not clear as their mode of incorporation into the regional value chain would be similar to their mode of incorporation into the existing global value chain and the focus on upgrading or moving to higher nodes within the value chain is not apparent.
In cases where the same ‘high potential’ value chain has emerged in several countries, it is also not clear that it is worth pursuing value chain upgrading in all counties. In the oilseeds to edible oil value chain for instance, both Zambia and Tanzania have increased production and exports of sesame seeds but do not have much downstream capacity to crush and process sesame oil. Given economies of scale in crushing and refining, it may not be worthwhile for both countries to pursue upgrading into processed oil. Motivating for only one country to do so is even more difficult.
Another problem arises from the fact that agro-processing value chains are interrelated and difficult to approach as ‘discrete’ value chains. The soya to animal feed value chain, for example, cannot be studied without regard to the edible oil value chain. Soya oil is an important by-product of the soya crushing process, so understanding the soya to poultry value chain requires an understanding of the dynamics in associated value chains in ‘by-products’ such as soya oil.
The selection of the value chains we will study is significantly influenced by the a priori selection of countries. Different value chains may well have been chosen if we took a different approach.
Table 14: Potential value chains identified in the region
Potential value chain(s) Countries Justification for selection as ‘high-potential’ value chain Soya Value chain selected for further evaluation in existing study
Zambia South Africa
• Large and growing production of soya in Zambia • Opportunities for smallholder farmers to be incorporated into
soya value chain in Zambia • Soya oilcake is a high-value product with forward linkages to SA
poultry industry where there is existing (and growing) demand • South Africa’s ability to increase soya limited by water scarcity • Potential for high export growth within the region
Tobacco
Zambia Tanzania Mozambique
• Relatively large and growing primary production but with trade deficit in manufactured tobacco products in SADC
• Opportunities for downstream processing • Regional value chain to include Zimbabwe, which is not part of
current study. Not selected for further study on this basis.
Sugar Value chain selected for further evaluation in existing study
Zambia Tanzania Mozambique South Africa Mauritius
• Lowest-cost producer in region • But, sustained net imports of processed sugar confectionery • There is an existing manufacturing base in Zambia • Opportunities for local processing to replace imported sugar
confectionery
Oilseeds Evaluated, to a limited extent, in relation to soya to poultry value chain study
Tanzania South Africa
• Fast-growing production • Existing SADC deficit in edible oil to be met • Potential downstream linkages to margarine and baking fat to be
explored as part of regional value chain within EAC, particularly Kenya which has manufacturing capability
Fish
Mauritius Tanzania Mozambique South Africa
• Mauritius is a net importer of fish and net exporter of processed fish and has established industrial capabilities in aquaculture and associated industries
• Potential to replace deep-sea imports of frozen fish with regional imports from Mozambique, South Africa and Tanzania to be evaluated, as Mauritius has relatively large imports of fresh fish
• Further details required on type of fish required and state of logistical links between Mauritius and rest of SADC for trade in fresh fish

32
Other products considered Fruit & vegetables Tanzania and rest of
world South Africa (limited)
• Limited opportunity for regional trade (same agro-climatic conditions, with the same fruit available at the same time of the year. Most fruit & vegetable trade is across hemispheres)
• Main export markets are in Europe, USA which have very high sanitary, phytosanitary and other standards
• Expansion of fruit & vegetable sector requires access to markets • Potential for exchange of services, specifically South African
export of skills, capabilities and processing equipment but limited potential for trade of high-value raw fruit
• Not selected for further study due to limited opportunities for intra-regional trade
Maize Zambia and rest of SADC
• Policy uncertainty with frequent export bans • Limited opportunities for downstream processing (low value,
bulky product) • Not selected for further study due to limited opportunities for
intra-regional trade

33
3 Analysis of selected value chains
This section reviews the oilseeds to animal feed and sugar to sugar confectionery value chains which both have the potential to deliver regional growth and increase intra-regional trade within SADC. The discussion on the oilseeds to animal feed value chain focuses on soya as an important input into the poultry sector. Zambia, Tanzania and South Africa have all increased soya production over the past decade (though South African soya production is constrained by its dry climate and production has likely reached its upper limit) but the increase in demand for poultry products across the region (particularly in South Africa) continues to drive demand for soya oilcake which is currently sourced from deep-sea markets. We explore opportunities for regional producers to meet this deficit.
Second, we review challenges and opportunities in the sugar to sugar confectionery value chain. There is a large regional production base for sugarcane across many SADC countries (including all five in this study), yet the SADC region has a sustained deficit in sugar confectionery products. We try to understand the reasons for poor manufacturing growth in the downstream processing sector and identify what can be done to meet the regional deficit in sugar confectionery products.
In the introductory section, we emphasised the increasing importance of taking a regional approach to agricultural markets as a response to climate change. In our interviews and review of secondary data, we found that there is very little discussion about the future impact of climate change and the necessity of developing deeper regional markets to cope with changing dynamics. Discussions about climate change are absent from industrial policy and from interviews with small farmers and large firms across the value chain. An overarching theme is thus the importance of bringing the realities of climate change and the likely changes in regional dynamics into discussions on production and agro-processing.
3.1 The oilseeds, animal feed and poultry value chain
Poultry has strong and important backward linkages to the animal feed production sector and, in turn, to agricultural output. Competitive production of the final output requires linked investments in efficient production facilities at different levels in the value chain with low-cost primary inputs from agriculture (Ncube, Roberts, Zengeni, & Samboko, 2017).
Poultry production in the Southern African region has been led by large, vertically integrated firms, predominantly from South Africa (Bagopi, et al., 2014 and Ncube, Roberts, & Zengeni, 2016). These firms have expanded into the SADC region by establishing vertically integrated operations outside South Africa and also by increasing investment into downstream activities in the respective countries (Ncube, Roberts, Zengeni, & Samboko, 2017). While these developments have occurred in the region, there have been limited moves towards the coordinated development of a regional value chain.
3.1.1 Trade in oilcake and poultry products
All five countries in the study are net importers of soya oilcake, but imports are dominated by South Africa which imported, on average, $279.4 million worth of soya oilcake each year in the 10-year period shown (Figure 12). Cumulatively, South Africa’s oilcake imports were over $2.8 billion over the period. Zambia’s strengthening export position shows up clearly in the chart below, particularly between 2013 and 2015, although with a decrease in exports recorded in 2016.

34
Figure 12: Trade in soya oilcake (HS Code 2304)
Source: ITC Trademap
The trade in soybeans is much lower in value and there is much more variability in net trading positions over the period (Figure13). South Africa is a net importer from 2007 to 2009 but increased production from 2009 onwards turns South Africa into a large net exporter with exports reaching more than $80 million in 2012.
The South African Department of Trade and Industry (the dti) developed an import-substitution strategy for the soya sector to increase local processing of soybean. Large investments were made in soybean processing facilities which increased South Africa’s crushing capacity from 600 000 tons to 2.1 million tons per annum by 2013, far in excess of local production capacity which has been closer to 1 million tons per year (though the latest crop estimates indicate a crop of 1.3 million tons in 2016/2017 season) (Fessehaie, Roberts, & Takala-Greenish, 2015).8 Many of the processing facilities started operating in
8 Crop estimates are provided by Grain SA and are available here. Note that 1.5 million tons of the additional crushing capacity is also capable of crushing sunflower and the dual crushing capacity has thus increased South Africa’s crushing capacity for sunflower too.

35
2013 and the trade data shows increased imports from 2014 onwards to take advantage of the additional crushing capacity.
Zambia has also increased its oilseeds crushing capacity in recent years and now has the capacity to process about 400 000 tons of beans per annum, with production of soybeans growing rapidly towards this capacity (Table 14).
Figure 13: Trade in soybeans (HS Code 1201)
Source: ITC Trademap
The next step in evaluating the potential for an oilseed to animal feed value chain in the region is to understand production capabilities and consumer demand. Below, we evaluate soybean production and the demand for both meat products and edible oils in the region.
3.1.2 Production of soybeans
Sub-Saharan Africa is well suited to soybean production with similar agro-climatic conditions to soy-producing regions in Latin America. Zambia, Tanzanian and the northern part of Mozambique are in similar lines of latitude as Cerrado, the soy basket in Central Brazil which lies mostly between 10⁰ S and 20⁰ S, and have similar rainfall patterns, evapo-transpiration rates, and similar solar radiation rates (Byerlee, Falcon, & Naylor, 2016 and Technoserve, 2011). South Africa is not well-suited to soybean production due to its dry climate and water scarcity and while there is potential for increased soybean production on about 13% of the agricultural land in Mauritius, comparatively greater capabilities exist

36
in continued sugarcane production or a shift to citrus production (Fischer, Hizsnyik, H, D, & Hermann, 2013). The greatest potential for increased soybean production thus seems to be in Zambia, Tanzania and Mozambique.
Production data from 2007 to 2017 show impressive growth in both South Africa and Zambia, but as stated above, South Africa is likely to be at or close to peak production. Zambia, on the other hand, has increased production by 31% between 2016 and 2017 and can support further production by improving the yields of smaller farmers through improving access to inputs and reducing the costs of seeds and fertiliser and increasing the land used for soya cultivation. The Zambian National Farmers Union (ZNFU) and traders of agricultural inputs in and around Lusaka confirm the increasing interest in growing amongst small farmers. The ZNFU emphasised that small farmers have ramped up soya production very rapidly, which shows how quickly farmers can respond to favourable market conditions (ZNFU, 2017 and Livestock Services Co-operative Society, 2017). Soya is a relatively new crop in Zambia but, in a few years, has become the second largest crop in Zambia second only to maize (ZNFU, 2017). Farmers’ output is still constrained by factors such as a lack of finance to access fertiliser and mechanical harvesters, a lack of storage facilities to extend the trading season for their beans and a lack of price transparency in the market. Some interviewees also cautioned that the development of the soya sector could be constrained by conflicting policy position by strong lobbies within the agricultural sector, with livestock farmers lobbying that borders are closed to soya exports and soya farmers and traders lobbying for more open borders.
Table 15: Soybean production (tons)
South Africa Zambia Tanzania Mozambique 2007 205 000 55 194 3 000 -
2008 282 000 56 839 5 390 -
2009 516 000 118 794 3 900 -
2010 566 000 111 887 3 100 18 000 2011 710 000 116 539 2 500 -
2012 650 000 203 038 5 624 -
2013 787 100 261 063 5 830 15 000 2014 948 000 214 179 6 025 -
2015 1 070 000 226 323 394 067* -
2016 742 000 267 490 - -
2017 1 316 370 351 416 - -
CAGR** 20.4% 20.3% - - Source: Grain SA, FAO, Zambian Ministry of Agriculture, Tanzanian National Statistics Bureau, and Technoserve
*Note: The 2015 production data for Tanzania is from the 2014/15 Annual Agricultural Sample Survey Report published by the National Bureau of Statistics and seem out of line with previous official statistics reported by the FAO. The discrepancy could not be verified. **No CAGR is calculated for Tanzania and Mozambique due to concerns about the accuracy of the data No soybean production data is available for Mauritius 3.1.3 Demand for meat and edible oils
The OECD estimated of per capita meat consumption data for 2016 is shown below (Figure 14).9 Mozambique’s per capita poultry consumption is at the bottom end of the scale, only marginally higher than India and Sudan and below the average for Sub-Saharan Africa. Tanzania’s per capita consumption is above the average for Sub-Saharan Africa, but below both the BRICS and World average, indicating
9 No data is available for Mauritius.

37
potential for growth. Zambia and South Africa both have per capita consumption values above the World average, but still below the OECD and EU averages, as well as below that of countries with large poultry sectors and significant production of soybeans such as Brazil and Argentina. Overall, this suggests that meat consumption will grow as per capita income in these countries grows.
Figure 14: OECD estimates of meat consumption, 2016
Source: OECD Meat Consumption Data. Available here.
As noted earlier, the soya to animal feed value chain is closely linked to the oilseeds to edible oil value chain. Although soya oil is the less valuable by-product in the soya to animal feed value chain where there is demand for soya meal, vegetable oil is the primary (and most valuable) by-product in the sunflower and sesame value chains. In both Tanzania and Zambia vegetable oils seem to be considered substitutes in use (particularly for cooking)10 with the result that a tension has emerged between the development of the oilseeds to edible oil value chain in Tanzania and the soya to poultry value chain in Zambia. In Zambia, unlike in South Africa where there is excess demand for soya oilcake, soya processors pay a higher price for crude oil than for beans because they do not have a market for soya meal. In interviews with a large Zambian soya farmer and an animal feed manufacturer, they put forward that the limited local demand for soya oilcake places a limit on the value of soya production and increases tension about edible oil imports from Tanzania. The lack connection between a market of high demand for meal in South Africa and high production in Zambia means that the value of Zambia’s increased soya output is not fully realised.
Soybean crushers interviewed in Zambia raised concerns that cheap edible oil imports from Tanzania reduce Zambian crushers’ incentive to crush more oilseeds as they cannot find a market for their oil.11 There has been increased protection of the Zambian industry as a result, with the Minister of Commerce,
10 For example, IAPRI suggests that Zambia’s increase in soya production is linked to increased demand for edible oil. See Zambia Agricultural Status Report (2016), page 31. 11 This rests on the assumption that consumers consider soya oil a substitute to cheaper sunflower oil from Tanzania, which may not be the case. A South Africa animal feed manufacturer interviewed for the study said that South African consumers find soya oil unpalatable due to its strong odour and taste profile. (Information on South Africa from interview with Heiko Koster, producer of animal feed and consultant for US Grain Council in Sub-Saharan Africa (2016)).

38
Trade and Industry imposing restrictions on the importation of refined, packaged and bottled edible in February 2017 (Lusaka Times , 2017). Zambian processors have made further calls for the removal of value-added tax as protection against cheaper oils ‘smuggled’ into the country (Food Business Africa , 2017).
The EAC has also placed edible oils on a list of sensitive products allowing the EAC bloc to increase tariffs on imports, effectively protecting the Tanzania local industry. The EAC tariffs will increase from 25% to 30% in 2017/2018, 35% in 2018-2019 and to 40% in 2019-2020 (Tralac, 2017). Gradually, the edible oil industry in many jurisdictions is facing increased protection even though there is a large regional deficit that could be met and despite projections showing strong growth in demand for vegetable oil to 2026 (Figure 15). The edible oil deficit, and continued increase in demand with population growth, means that both Zambia and Tanzania have a market to meet and the protectionist trend shows a lack of coordination in resolving a regional deficit in favour of short-term protection based on narrower national trends. This approach runs counter to the regional value chain narrative and may undermine the ideal of coordinated investments in the development of a regional value chain.
Figure 15: Projected per capita consumption of vegetable oil (for food use only)
Source: OECD Vegetable Oil Projections
3.1.4 Challenges in meeting demand and developing a coordinated regional value chain12
The potential for a regional value chain in oilseed to animal feed value chain is clear given unmet demand for soya oilcake in South Africa (currently met by deep sea imports from South America) and high potential for increased production of soya in Tanzania, Zambia and Mozambique to replace deep-sea imports. The market for soya oilcake already exists but the challenges are twofold; first how to increase soya and soya oilcake production in Zambia, Tanzania and Mozambique, and second, how to link animal feed producer and farmers across the region so that farmers are assured access to markets. Both the production and coordination challenge are discussed in more detail below with specific reference to the experience in Zambia and Tanzania.
12 This section is based on interviews on the soya value conducted in Zambia during February 2017 and interviews on the oilseeds value chain conducted in South Africa and Tanzania between March and June 2017.

39
The production challenge: increasing yield and production
Soya beans are largely produced by commercial farmers in Zambia but the share of production from smaller farmers is increasing (Chapoto & Chisanga, 2016). In the 2016/17 season, small and medium-sized farmers produced more than 40% of Zambia’s soybean crop (Zambian Ministry of Agriculture, 2017). Production by smallholder farmers has increased so significantly and supply considered so reliable that the largest beef producer in Zambia, Zambeef Products Plc, purchases about 70% of its soya demand from small farmers who deliver directly to its gate (Interview with Zambeef Products Plc, 2017). The yields of existing small and medium sized farmers can be increased further if constraints to accessing finance and agricultural inputs are addressed. More farmers would also be encouraged to enter the value chain if they are assured of access to markets through offtake commitments or via a commodity exchange.
In Tanzania, production of sunflower is dominated by small scale farmers with plots of less than 5 acres (about 2 hectares) who account for 95% of producers (though not necessary of production).13 Medium-sized farmers with land between 5 and 100 acres (2 – 40 hectares) make up 4% of producers and only 1% can be classified as commercial producers. All small-scale farmers employ traditional (non-mechanised) farming techniques using mainly household labour while medium-scale farmers may sometimes use rented ploughing and harvesting equipment (Ministry of Industry, Trade and Investment, 2016).
The key challenges in increasing production are set out below.
i. Access to agricultural inputs
In Zambia, small and medium-sized farmers are relatively efficient and achieve good yields even under rainfed production, but yields can be improved with increased application of fertiliser. Fertiliser use in Zambia is increasing overall (partly due to subsidised fertiliser provided to small farmers under Farmer Input Supply Programme/e-voucher system), but there is significant regional variation in use. Overall, 58.4% of rural households reported using fertiliser in the 2015/16 (up from only 25% in 2007) ranging from a high of 76% in the Lusaka region to a low of only 11.7% in Western Province. However, fertiliser use amongst smallholder farmers decreased by 21.9% from 348 764 metric tonnes in 2014/15 to 272 762 in 2015/16 (Chapoto & Chisanga, 2016). The decline in fertiliser use amongst small farmers is a worrying trend. In interviews, the high price of fertiliser was raised a continued concern and is probably the reason for the decline in fertiliser use by rural households, particularly those far from the economic hub of Lusaka (interviews with ZNFU and ZRC Farms, 2017).
Small-scale sunflower farmers in Tanzania also reported having lower yields due to low fertiliser use, low pesticide use, and the high cost of improved sunflower seed varietals. Farmers seemed particularly concerned about access to improved seed as the (often recycled) open pollinated varieties currently in use have lower yields and a longer growth cycle than the newer improved varietals. However, in addition to the high cost of the seed, farmers require irrigation to ensure the that the new varietals receive sufficient water after planting (they require rain within two weeks after planting) while the open pollinated varieties are more drought resistant and do not need irrigation.14
In both Zambia and Tanzania small farmers are keenly aware of what they need to do to improve yields, but do not have the money (or access to finance at reasonable rates) to acquire the requisite inputs. Although the Tanzanian Sunflower Development Strategy attributes low fertiliser use primarily to
13 Interviews with District Agricultural, Irrigation and Cooperative Officers in Dodoma and Iringa regions. See also UNIDO (2016), Tanzania’s sunflower oil producers come into bloom available at http://www.unido.org/news/press/tanzanias-sunflow.html 14 Interviews with farmers and processors in Dodoma and Iringa.

40
limited availability at village and district level, studies have shown that Tanzanian fertiliser prices are well above international benchmarks and even higher than fertiliser prices in its landlocked neighbour, Zambia, where prices decreased after cartel conduct was prosecuted by the Zambian competition authority (Ncube, Roberts, & Vilakazi, 2015).
ii. Access to agricultural equipment for harvesting
Eighty-five percent of Zambian farmers are considered small-scale farmers and most remain un-mechanised (Zambian National Farmers Union, 2017). The lack of access to mechanical harvesting equipment is particularly problematic for soybean, which must be harvested soon after the beans reach maturity (between 12 – 14% moisture content) to avoid the risk that the soybean pods dry out and shatter, thus decreasing yields significantly (Imakando, 2017 and University of Missouri, 2017).
As mentioned above, 95% of Tanzanian oilseed farmers are small-scale farmers with no access to mechanisation. Planting, weeding, harvesting and threshing are all done manually using household labour which increased the risk of yield loss relative to mechanical processes.
iii. Access to storage
In both Zambia and Tanzania, increased production must be accompanied by access to reliable storage facilities where farmers can deliver produce in return for a tradable instrument (or ‘warehouse receipt’) that can be sold at their discretion (Imakando, 2017 and Ministry of Industry, Trade and Investment, 2016).
In Tanzania, interviewees said that they are often forced to sell their seeds shortly after harvest when supply is greatest and price lowest, even though they could double their earnings if they could store their produce and wait until low season. The effect of this on farmers’ profitability is included as Appendix 15.
The coordination challenge: connecting farmers to animal feed manufacturers and edible oil refineries in South Africa
The coordination challenge is more difficult to address and potentially more detrimental to the development of regional value chains than the production challenges where the constraints are clear, well-documented and generally agreed between farmers, policymakers and other stakeholders in the value chain. By their nature, coordination challenges involve disparate parties, in this case from different countries, which introduces complexity. In the animal feed market, the firms that have larger production facilities and excess demand for soya meal are South African firms and often are not aware of regional alternatives, or are sceptical about reliability of supply and quality. They also often have longstanding supply relationships with large international producers which increases their wariness to shift to regional alternatives.
In interviews with stakeholders in the South African poultry value chain for example, it was clear that they were not aware of the significant increase in Zambian soya production and were initially skeptical about factors like the quality of the soya (without basis) and the ability to transport the soya cost-effectively to South Africa. However, shortly after discussing the idea of sourcing Zambian soybeans with an animal feed producer, who was doubtful initially, they decided to import Zambian soybeans and found it of high quality and affordable compared to deep-sea imports transported overland from the port of Durban to the northern part of South Africa.15 The idea of a regional value chain did not occur to them independently, but they could see the financial benefit once the idea had been floated and the
15 The only (minor) constraint that remained was the fact that the soya is transported from Zambia in bags and not in bulk, which increases offloading costs at their factory. Investment in bulk storage and bulk loading equipment in Zambia, which requires aggregation of output from many small farmers, would resolve this issue.

41
size of the Zambian surplus was confirmed. In interviews with processors of sunflower seed it was even more apparent that Tanzania had never been considered an alternative and processors were surprised by the large increases in production recorded over recent years.
An important constraint to the development of a regional value chain in oilseeds to animal feed is thus that animal feed manufacturers and oilseed crushers in South Africa do not yet look to the region for alternatives and do not have access to reliable information about the size and quality of the crops to show that regional sourcing is a viable alternative.
Additional coordination challenges are discussed below.
i. Transport costs
The transport challenges between Zambia and South Africa are different to those between Tanzania and South Africa simply because Zambian soybeans would be transported overland while Tanzania has access to a deep-sea port at Dar es Salaam and could ship sunflower seeds or crude sunflower oil to in bulk tankers to the port of Durban.
The effect of transport on the landed price of Zambian soya can be significant, affecting the competitiveness of Zambian soybeans landed in the northern parts of South Africa. In January 2017, the price of Argentinian soya was approximately $380/ton. Transport, insurance and financing costs added about $110/ton, meaning that the price paid by producers in the Gauteng (which is the price against which Zambia would compete) was around $490/t. At the time, Zambian soya prices are averaging around $390/t. The cost of overland transport from Zambia to Gauteng has historically been around $110/t, which means that Zambian soya would land in Gauteng at about $500/t at present. However, these are prices quoted for transport between South Africa and Zambia (likely of consumers goods to South-African owned retailers in Zambia) and the prices are inflated because of the built-in assumption that trucks going from South Africa to Zambia would return to South Africa empty due to uni-directional trade between the two countries. Transport costs drop to around $45/ton if trucking companies are assured a backhaul load from Zambia. Zambian soya exports to South Africa could thus mean cheaper backhauls for soya, which can then be delivered in Gauteng at price that is competitive against deep-sea imports. Taking the January 2017 figures, this means that Zambian soya could be landed in South Africa at $440/ton compared to $490/ton for deep-sea imports.16 Efficient logistics and border operations mean that transport costs between Zambia and South Africa should be sustainably around $40-$50/t given the distance.
In the oilseeds value chain, the high price of land transport is also a concern. Transport cost is a significant cost component of oil-based consumer goods, second only to the cost of purchasing crude oil or seed itself.17 Much of this cost is added by roadfreight. South African processors report that the total cost of transporting oil from Indonesia to Durban harbor (about 6000 nautical miles) is $42 - $45/ton ($23/ton excluding insurance and finance). The cost of transporting oil from Durban to Johannesburg (just 562km) is the same at $43/ton.
Tanzania’s deep-sea port gives it a cost advantage over landlocked countries like Zambia in terms of exporting goods to South Africa but though seafreight is less costly than road transport, it is also less flexible. A bulk oil tanker requires large and consistent volumes of oil while smaller mixed loads can
16 Note than the relatively high price of road transport divides South Africa into two distinct regions, a coastal region and an inland region. In the oilseeds value chain, for example, it is cheaper to transport oil via bulk tanker from Eastern Europe to Durban than to transport the oil from oil-producing regions in the north of the country via road to Durban. Demand for crude oil in coastal provinces is thus met by deep sea imports while the inland provinces consume locally-produced oilseeds. Similarly, Zambian soybean would compete against the ‘inland price’ of soybeans, which includes costly road transport between Durban and the Gauteng/Reef area. 17 Interview with large South African oil processor.

42
be transported cost-effectively via road. To compete with existing import markets, Tanzania must be able to export large quantities of seed or crude oil at globally competitive prices consistently.
Lastly, consideration should also be given to the cost and state of transport within countries, from production regions to ports (land or sea), is also a major constraint. The state of ‘feeder’ and national road has been mentioned as a major challenge in both Tanzania and Zambia (Chisoro, Jahari, Kilama, & Paremoer, forthcoming and Chapoto & Chisanga, 2016). Intra-country transport links from production areas to ports can be the deciding factor in whether countries are able to integrate into regional value chains.
ii. Grading/quality of beans and seeds
In many agro-processing value chains, small improvements in the handling of products add significant value to the product. In oilseeds, processors say that the first step in adding value to oilseeds is to invest in cleaning, sorting and grading the seeds (Chisoro et al., forthcoming ). This allows producers to realise greater by exporting higher grade seed and crushing lower grade seed that would fetch a low price on seed export markets into high-value oil.
Investing in globally recognised grading systems would also allay some of the concerns that South African processors expressed about sourcing soybean from Zambia and oilseeds from Tanzania. The grading systems provides all necessary information for processors to assess the value of the produce and to facilitate trading. Grading is also an important prerequisite for a functioning commodities exchange, which is discussed below.
iii. Commodities exchange/forecasting future prices
Tanzania does not currently have a functioning commodities exchange system.18 Futures trading is more established in Zambia, where the Zambian Agricultural Commodities Exchange (ZAMACE) has established a warehouse receipt system accepted by local banks as collateral for extending finance (Zambia Business Times, 2017). ZAMACE currently has 6 certified warehouses with total storage capacity of 750 000 tons. Two of its certified warehouse operators are South African agro-conglomerates (Afgri and NWK Limited), 2 are Zambian firms (Zdenakie Limited and CHC Commidities Limited) and one is the Tanzanian agro-conglomerate Mount Meru Millers (Chulu, 2017).
ZAMACE has also entered into an agreement with the Johannesburg Stock Exchange (JSE) to start trading Zambian futures for soya, wheat and white maize on the JSE in May 2017. This facilitates price discovery (at assured quality) and paves the way for increased physical trade between Zambian farmers and South African consumers, an important development for the deepening of the regional soya to animal feed value chain. The contract is traded in US dollars and is traded as a standardized 10-ton futures contract ex Lusaka (JSE, 2017). A similar agreement with the Tanzanian government could facilitate oilseeds trade between South Africa and Tanzania.
18 A Tanzanian commodities exchange was established in 2015, but had not yet become operational. See Masare, A (16 September 2017), Tanzania’s Commodity Exchange Market halted. Available here.

43
3.2 The sugar to sugar confectionery value chain19
The main constraints in the oilseeds to animal feed and edible oil value chains were increasing production to meet a regional deficit and improving coordination along the value chain to link producers and consumers of soybeans, oilcake and edible oil. The challenges in the sugar value chain are different. South Africa and Zambia are large net exporters of sugar and Zambia is the lowest cost producer in the region (Ellis, Singh and Musonda, 2010). Both countries are well placed to exploit the opportunities associated with access to low cost sugar to develop low to medium technology value-added products in the sugar and baked confectionery value chain (das Nair, Nkhonjera and Ziba, 2017).
However, in Zambia, low production costs do not actually translate into low domestic prices of either retail or industrial sugar and Zambia actually has some of the highest cost industrial sugar in the world, which stifles downstream processing (Chisanga, Meyer, Winter-Nelson, & Sitko, 2015). South African processors also cite the high cost of industrial sugar as a constraint to processing. So, while South Africa and Zambia are both low-cost sugar producers and have processing capabilities at the downstream level to produce sugar confectionery products (though South Africa’s sugar confectionery industry is larger and more established than that of Zambia), there is a sustained deficit in sugar confectionery products in SADC. The main question in the sugar value chain is not about increasing production but about why this deficit is not met by leveraging existing capabilities and what the constraints to growth are in the downstream processing sector. These questions are explored below. First, we review the trade data for sugar and sugar confectionery products for the five countries in this study.
Figure 16 shows that all countries except Tanzania are large net exporters of cane sugar. In 2016, Tanzania imported most of its cane sugar demand from outside the SADC region with only 16.4% sourced from Malawi and 1.6% from Mozambique. The rest was imported from a range of countries including the UAE (20.6%), India (20.6%) and Brazil (14.5%). These imports are quite large in value, ranging from $28.5 million in 2008 to $169 million in 2016. As an illustration of the potential to replace this with regional trade, we compare Zambian exports against Tanzanian imports and find that Zambia could have met Tanzanian imports in all years except 2012, 2013 and 2016.20
Table 16: Cane or beet sugar and chemically pure sucrose, in solid form (HS Code 1701)
2007 2008 2009 2010 2011 2012 2013 2014 2015 2016 Imports by Tanzania (USD millions)
62.4 28.6 46.7 81.3 112.7 169.0 132.9 96.6 98.4 134.1
Exports by Zambia (USD millions)
82.4 57.9 96.1 141.6 148.6 123.5 122.0 132.4 115.0 69.2
EX (Zambia) - IM (TZ), USD millions 20.0 29.4 49.4 60.3 35.9 - 45.5 - 10.9 35.9 16.7 - 64.9
Source: IT Trademap
19 This section focuses on Zambia and South Africa. Though sugar is also an important crop in Mauritius and both Tanzania and Mozambique show potential for increased production, the interviews and research from which this section draws focused on Zambia and South Africa. 20 Trademap data for 2016 reflects mirror data and may not account for Zambia’s total exports.

44
Figure 16:Trade in sugar (HS Code 1701)
Source: ITC Trademap
Figure 17 shows trade in sugar confectionery products. All countries have large imports of sugar confectionery products in absolute terms. South Africa has a deficit in sugar confectionery products in the earlier years (2007 – 2011) but turns this around in 2012 when it records a surplus. In 2013 it is again in a net import position but maintains a trade surplus from 2014 to 2016. Zambia is a net exporter of sugar confectionery products over the whole period, but its imports are growing over time. Mozambique, Tanzania, and Mauritius are all large net importers of sugar confectionery products over the whole period. This is surprising for Mauritius, a sugar producer and net sugar exporter, showing that it faces constraints in the development of its downstream sugar confectionery industry.

45
Figure 17: Trade in sugar confectionery (HD Code 1704)
3.2.1 Factors limiting regional trade in sugar
The sugar sector is heavily subsidized the world over and the world price for sugar is commonly held to be well below fair costs of production. Consequently, national sugar industries are protected worldwide. The SADC region is no different. Several regional and national agreements and legislation protect the local sugar industry from competition (das Nair, Nkhonjera, & Ziba, 2017).
South African sugar producers are offered protection from low world sugar prices through the ‘Equitable Export Obligations’ imposed by the Southern African Customs Union (SACU). The price of South African sugar exports is substantially below the domestic price of sugar so producers who sell a greater share of their output in the export market would be disadvantaged relative to as-efficient competitors who sell most of their sugar in the domestic market. To prevent this, redistribution of proceeds from the sale of sugar is effected via the South African Sugar Association (SASA) in terms of the Sugar Act (1978) and the Sugar Industry Agreement (2000).
This works as follows; the Sugar Association allocates each mill a quota for both the local and export markets. The quota is allocated for refined white sugar and brown sugar in proportion with each mill's total saleable production of sugar. If a mill sells more than their allocated quota on the local market (an ‘over-performing’ mill), they are obliged to pay an amount for redistribution purposes calculated as the excess quantity sold by that mill during that quarter multiplied by the weighted average of the notional local market price less the financial levy imposed by SASA and less a manufacturing allowance determined according to rules laid down by SASA (das Nair, Nkhonjera, & Ziba, 2017). Exports are closely managed by the SA Sugar Export Corporation (Proprietary) Limited who is effectively the sole exporter of bulk raw sugar. Any South African mill that wishes to export sugar above its local quota informs the Sugar Export Corporation who is then obliged to buy the full export quota from millers at prices determined by the Sugar Association (das Nair, Nkhonjera, & Ziba, 2017). These quotas have the effect of controlling local volumes available (and hence local prices), as well as controlling what is available for export to the region.

46
The SADC Sugar Cooperation Agreement, which is incorporated into the SADC Trade Protocol, was put in place with the stated aim of promoting the growth, competitiveness and integration in the regional sugar industry but seems to be a veiled protectionist measure to protect domestic sugar producers against low-priced sugar imports. In effect, the Sugar Cooperation Agreement restricts Zambia, and other non-SACU SADC countries’, sugar exports to South Africa. The agreement provides for partial access of the SACU market by other surplus sugar producers in SADC. This partial access is in the form of import quotas governed by a formula that allocates access based on the size of each country’s surplus sugar production, and the level of market growth in SACU (das Nair, Nkhonjera, & Ziba, 2017). The rationale is to offer non-SACU surplus producers (Malawi, Mauritius, Mozambique, Zambia and Zimbabwe) the chance to export some sugar to the SACU region duty-free and achieve higher prices than they can get in global markets. The effect of the agreement is to limit the volume of sugar that SADC countries can send to South Africa on a duty-free basis and any exports in excess of the agreed volume would attract duties (das Nair, Nkhonjera, & Ziba, 2017).
In Zambia, the sugar sector is effectively protected from external competition by the legal requirement that all household sugar meant for direct consumption be fortified with Vitamin A. No other country has this requirement, so the fortification requirement essentially acts as a non-tariff trade barrier that protects local Zambian sugar producers. This trade barrier was in fact intentional.
USAID was a partner in implementing the fortification programme in Zambia. In a USAID report discussing the Vitamin A fortification programme, they indicate that the sugar industry was not the initial focus of the fortification programme but that the Zambian government initially considered fortifying maize meal. However, the Zambian maize meal industry is highly decentralised characterised by hundreds of small local hammer mills which mill maize for local markets. This makes it difficult to implement and monitor fortification in the maize industry. The sugar industry, by contrast, was highly centralised with one producer (Zambia Sugar) producing about 99% of household sugar consumed in Zambia (the company still has a market share of about 90%). The USAID report also states that a reason for Zambia Sugar’s interest in the fortification program was that there was “an increase in less expensive sugar flooding the Zambian market.” Zambia Sugar was said to be “feeling pressure from legal and illegal imports of sugar from Malawi and Zimbabwe in amounts they estimated to reach 25 percent of Zambia’s domestic market” and “requested” that the sugar fortification requirement be accompanied by legislation ensuring that only fortified household sugar be sold in Zambia. The report says that the resultant trade-off (that is, prohibiting the sale of unfortified sugar in exchange for mandatory fortification) was “an example of coinciding public and private interest” (Serlemitsos & Fusco, 2001). However, rather than being an overwhelming victory in the public interest, the fortification programme also seems to have entrenched Zambia Sugar’s dominant position in the Zambian market and has protected it from lower-priced regional or international imports. The high price of industrial sugar has also stifled downstream production, making it clear that the trade-off was not unambiguously positive.
Another factor that affects regional trade in sugar (and limits access to markets, particularly in South Africa) is the changing retail landscape with large formal retailers becoming a key route to market for many producers of sugar and baked confectionery products. Formal retailers are known to have strict quality, packaging and labelling requirements (often far stricter than national food health and safety regulations) that make it more difficult for new and smaller processors to access their shelves (das Nair & Chisoro, 2016). This has been raised as a concern in Zambia where the Zambian Bureau of Standards sets lower minimum domestic quality and food safety standards specifically to accommodate local firms struggling to compete with imports. Formal retailers, many of which are headquartered in South Africa, impose additional requirements in line with their standards in the South Africa market with less concern for the objectives of capability acquisition than the Zambian government body. The discrepancy in

47
requirements may lock Zambian producers into local markets and prevent them from accessing regional and global value chains (das Nair, Nkhonjera, & Ziba, 2017).
In summary, the challenges in the sugar sector are primarily about the continued protection of dominant upstream sugar producers and millers and the stifling effect that this has on the downstream light manufacturing in the agro-processing sector. The sugar industry is a strong lobby in both South Africa and Zambia and this example shows that the development of regional value chains may be blocked by lobbying of powerful lead firms within the value chain. The questions that are raised by the sugar case study are very different to those raised in the oilseeds value chain and rest on how to sponsor rivalry and facilitate entry of new processors and millers to counter the market power of larger players.
3.3 Policy Proposals for strengthening regional value chains in oilseeds and sugar
This section provides low cost, practical policy proposal to address the constraints in both the oilseeds and sugar value chains. It does not try to address all concerns, but attempts to identify issues that could be addressed relatively easily but could nonetheless deliver significant benefits. Where possible, we identify a person or institution within each country to lead the implementation of the proposal. In some cases, there is a need for greater understanding of the dynamics in the value chain or the behaviour and strategies of large firms and the proposals suggest additional research or independent reviews to provide a more concrete fact-base from which to suggest proposals.
3.3.1 Solving the backhaul constraint between Zambia and South Africa
The high cost of transport between Zambia and South Africa could reduce the competitiveness of Zambian soya against deep-sea imports. The Zambian National Farmers’ Union, with support from the European Union, developed a web-based transportation information system called Transzam to solve a similar transport constraint within Zambia. The application was designed to connect parties who require transportation with transporters by notifying registered users of the availability of transport and the associated costs. The Transzam application could be revised and extended to include regional freight.
Improvements in cross-border transport and facilitating the transport of mixed loads will likely to be more beneficial to smaller suppliers and transporters since large players typically enter into long-term contracts with large logistics companies, partly due to insurance and other related services that large transporters are able to offer. The application is likely to reduce search costs and increase competition in the market for the transportation of goods.
Potential partner: All work in Zambia was conducted in partnership with Dr Mwilola Imakando, an agricultural economist and member of the Zambian Parliament. Dr Imakando is also a former member president of the Economics Association of Zambian and an executive director of the Zambia Institute for Policy and Research (ZIPAR). He has extensive experience in managing agricultural cooperatives and has an extensive network within both the public and private sector to support initiatives within the soya value chain and could lead initiatives in this area. Any work on Transzam, which is a trademark of the Zambian National Farmers’ Union, will be conducted in partnership with the ZNFU. Transzam already has some level of regional dimension in that it services routes between several districts in Zambia and Durban in South Africa, and Harare in Zimbabwe.
We note that any initiative to increase trade in soya may meet resistance from the local livestock and poultry sector, who may be concerned that this will create a domestic shortage and increase the price of soya in the domestic market. The involvement of organisation such as the ZNFU and consultation with the relevant senior officials in the Minsitry of Livestock will thus be crucial to the success of a regional value chain in soya to animal feed.

48
3.3.2 Sponsoring rivalry: developing a regional supermarket pact
In Zambia; Shoprite, a South African retailer, supported the growth of a rival sugar supplier, Kafue Sugar, by selling Kafue’s sugar at a discount to Zambia Sugar’s rival products. This is mutually beneficial in that it promotes Kafue Sugar’s products and establishes the brand in the market while also giving Shoprite a rival brand to strengthen its negotiating position relative to Zambia Sugar (das Nair, Nkhonjera, & Ziba, 2017). Partnerships between supermarkets and smaller or new processors to promote rivalry should form part of a coordinated regional agenda to revitalize light manufacturing. The partnerships would work best if they are led by the retailer to solve an existing commercial concern (such as the market power of Zambia Sugar in this case). These ‘supermarket pacts’ could be voluntary but require the buy-in of large retailers to be effective.
As a matter of practicality, the pacts should be negotiated with individual retailers that have an extensive footprint across southern Africa and need not be multilateral initiatives involving all stakeholder governments. The greatest potential lies in getting the buy-in of Shoprite and Pick ‘n Pay, South African retailers with a large and growing footprint across southern Africa.
However, even if the big retailers do support the initiative, large incumbent suppliers may retaliate by offering the retailers lower (even predatory) prices. The supermarket pacts should thus be implemented in consultation with competition authorities who can monitor any anticompetitive response by dominant incumbents. Supermarkets may not immediately recognize the value of these pacts for dynamism and rivalry in the consumer goods market and a firmer directive from local departments of commerce and industry may be required until the commercial benefits and imperatives of such a policy are understood.
Potential Partner: The proposal is to start this discussion with South African-based retailers and, as such, it would be important to find a partner within the South African Department of Trade and Industry to lead negotiations with supermarkets. We understand that Nigel Gwynne-Evans, Chief Director in the Africa Industrialisation may be spearheading a similar project and could be approached to understand support required.
3.3.3 Harmonisation of standards within SADC for key commodities
Quality standards, health standards and product specifications can become important non-tariff barriers in food and processed food markets, limiting the ease with which goods can be traded across borders or increasing costs as products undergo multiple testing procedures in different countries. The East African Community, of which Tanzania is a member, is addressing this constraint through a coordinated Standards Harmonization and Conformity Testing Programme supported by TradeMark East Africa. After its first two years, the programme reported a 59% reduction in product testing cost and a 74% reduction in average testing time across the region, along with a 23% increase in trade values and 50% increase in trade volumes across the region (TradeMark East Africa, 2016).
An independent analysis on the benefits of a similar programme within the SADC region should be undertaken, particularly within the highly traded products identified in this paper (oilseeds, edible oil, oilcake, sugar, sugar confectionery and processed meat and fish). While harmonization of standards will improve trade and enhance regional integration in SADC, a multilateral process will certainly be cumbersome and require sufficient resources and commitment among member states. A phased approach should thus be considered. SADC countries could enter into bilateral arrangements regarding standards and exports of selected products. For instance, the Zambia Bureau of Standards (ZABS) has a Memorandum of Understanding with Botswana on the export of groundnuts, and with Namibia for various products (Bosiu et al., 2017). Similar arrangements can be made with the other countries in this study.

49
Potential Partner: The bureaus of standards, and ministries of industry will be the primary drivers of the process. In the case of South Africa and Zambia, the Department of Trade and Industry (DTI) and the Ministry of Commerce, Trade and Industry (MCTI) respectively can be approached to initiate conversations with South African Bureau of Standards (SABS) and ZABS for the soya to animal feed and sugar confectionery value chain. Following any in-principle agreements, additional ministries in charge of health and agriculture will also need to be consulted..
3.3.4 Review of policies related to the sugar sector
The longstanding agreements protecting incumbent sugarcane growers and millers across the SADC region must be reviewed. The agreements seem to keep domestic sugar prices high, constraining the development of downstream sugar processing businesses. With increasing constraints on water as climate change progresses, it is also by no means clear that sugarcane production should continue to be protected in South Africa, but water should potentially be diverted to higher value horticultural crops. As a matter of concern, access to water licenses, smallholder irrigation schemes and land tenure have been identified as constraints for agricultural development in South Africa’s Industrial Policy Action Plan (IPAP) iterations.
The existing policies may protect a production structure that no longer makes sense given the changes in climate and rainfall. An independent review of the macro-economic impact of the policies, agreements and legislation in the sugar industry should be conducted to assess the relative benefit of maintaining protection while downstream processing industries stagnate. This is particularly important because rainfed crops such as sugarcane, which are vulnerable to periodic droughts, have significant implications for water use. Thus, crop diversification and potential reorientation of agriculture may need to be explored. For reasons set out above, the interest of incumbent firms will not be served by a review that challenges market power and rents that accrue from protectionist policy. There will likely be significant resistance from incumbents to any changes to the status quo. The support of policy departments responsible for industrial development and competition policy would be useful for such a review to succeed.
3.3.5 Building capacity for understanding firm conduct and strategy
There is a lack of information on the enterprise landscape in many countries across SADC. In conducting this study, it was difficult to find information on trends in production and processing within Mozambique and to a lesser extent in Tanzania and Zambia, aside from a few studies at disparate times. This makes it very difficult to understand changes in market structure, the entry and exit of large firms and smaller rivals, and the linkages and strategies of large firms. It would be beneficial to create a ‘living’ database or ‘market observatory’ of sorts to track firm conduct and build an understanding of the regional strategies of large firms.
However the implementation of this may be challenging since some of the data on firms is not publicly available, except for companies listed on stock exchanges. The Centre for Competition, Regulation and Economic Development (CCRED), based at the University of Johannesburg, has conducted a couple of studies tracking the investment decisions and strategies of large firms listed on the Johannesburg Stock Exchange (JSE) (see for example Bosiu et al, 2017b; Bell et al, 2017; Nhundu et al, 2017; das Nair & Chisoro, 2017; and Mondliwa et al, 2017). A similar approach can be adopted since most of the large regional players are listed on different stock exchanges, although the challenge will still remain for smaller unlisted firms which are not obliged to make their information public.

50
3.3.6 Increasing storage capacity in Zambia and Tanzania
Data from interviews with Tanzanian oilseeds farmers indicate that small farmers could double their income if they could store all or part of the crop and sell at times of lower supply. The Zambian Agricultural Commodity Exchange has also encouraged Zambian farmers to consider storing their crops to realise greater value at times of lower supply. Often, however, these farmers simply do not have access to storage facilities. The need to invest in storage facilities is important, given that one of the largest feed producers in Botswana indicated the poor quality of soybeans from Zambia was due to a lack of storage (Ncube et al., 2017).
Potential proposal and partner: Several low-cost storage options are available on the South African market, from smaller 30-ton steel silos that cost approximately R45 000 (about $3200) to larger silos capable of storing upwards of 1000 tonnes. These larger silos can be constructed at R2000/ton, including the cost of civil works required to erect the silo (for 1000 tons, this equates to about $146 000). ABC Hansen, a subsidiary of the ABC Africa Group, provides these (and other) storage solutions within South Africa and across the region. The firm also manufactures and sells a range of oil processing equipment suitable for oilseeds and groundnuts. They have experience working in Zambia and Tanzania and may be a good partner to approach (in so doing, there is a value proposition for South Africa as well).

51
4 Some conclusions
The analysis of patterns of food production and trade across the five selected countries provides a number of key insights. Before summarizing these insights we note again the important differences between the countries. South Africa and Mauritius have much higher levels of GDP per capita (at around $7500 and $10 000 respectively) than the SADC average, however, Mauritius is a small country and economy with notable successes in industrialisation. South Africa is by far the largest economy in SADC and has an advanced food processing sector which underpins substantial net exports from South Africa to the region. Zambia has higher GDP per capital than Tanzania and Mozambique and has made important strides in the past decade in growing agro-processing along with agricultural production. Mozambique and Tanzania have extensive potential to increase agricultural production and have recorded high growth rates in this regard, with a very low level of industrialisation in terms of food processing.
The SADC region has a sustained deficit in processed foods, driven by a small number of products; wheat and rice in the cereals category and palm oil in edible oils. The trade deficit seems to be getting worse in some products such as sugar confectionery where countries continue to export raw sugar and import processed confectionery products. All five countries in the study have large imports of wheat, rice and palm oil, but there is variation in other food imports driven by incomes and industrial priorities. South Africa, for example, has large imports of poultry products which is not (yet) seen in the other countries. Zambia, Mozambique and Mauritius have large fish imports but for Mauritius these are inputs into a fish processing value chain. Tanzania’s largest processed food import was edible oil and it has developed a strategy to increase local production and has successfully reduced non-palm imports.
Import trends also show the impact of climate variability on trade patterns, particularly in South Africa where production was heavily affected by the 2015/16 drought. In drought years, South Africa’s imports of maize increased sharply, and its reliance on grain imports is likely to increase with increasing variability in rainfall. Zambia, Tanzania and Mozambique weathered the El Nino drought better than South Africa, suggesting that South Africa should look to the rest of the SADC region for cereal imports and shift its water use to higher value crops.
There have been notable examples of very high growth in agricultural production reflecting the response to appropriate policies. Zambia has over a period of 10 years gone from negligible soya output to producing around double domestic demand. This has been largely based on supply of oilcake into poultry feed. In 2016/17 Zambia started exporting soya and derivatives to South Arica. Tanzania has also achieved notable successes in growing sesame and sunflower output, with sesame being export oriented and sunflower mainly to meet local demand. Tanzania’s sunflower production surpassed South Africa’s in 2012. While Zambian soya is produced by a mix of large and small farmers, Tanzania’s sunflower is produced by small farmers. By comparison, Mozambique has seen tobacco production and export, with large firms leading out-grower schemes, and similar observations have been made with regard to multinational investment in large-scale production of other crops such as rice and sugar in Mozambique.
South African agricultural production has fluctuated. The country is a large net importer of wheat, rice and soya while in years of good rains is self-sufficient and an exporter of maize. The adoption of GMO has seen higher yields and drought resistant varieties being introduced. However, of the five countries it faces the largest expected reductions in rainfall. It has an interest in growing agricultural production across the region to ensure production of field crops to meet its own demand.
Increasing food processing, as part of structural transformation to move to more productive, higher-value and more complex activities is a challenge across the five countries, noting that the countries start from very different bases. Urbanisation and population growth in Tanzania and Mozambique imply

52
rapidly growing demand for processed food products which will be met by increased imports unless appropriate policies support local production. Given the strong capabilities which exist in South Africa, there is the potential for regional industrialisation initiatives to leverage these capabilities through cooperation agreements. South Africa could support regional industrialisation through services exports in packaging design, process and product upgrading and supporting institutions that implement and improve quality standards. These partnerships are also part of developing common standards across SADC which aids deeper regional integration along with regional industrialisation.
South Africa’s substantial deep-sea imports in a number of products represent opportunities for Zambia and Mozambique given their proximity. The example of animal feed illustrates the potential for South Africa’s imports from countries such as Argentina to instead be sourced from countries in the region, especially imports to meet the inland demand in the greater Johannesburg (Gauteng) region of South Africa. This depends on efficient transport and logistics. And, so, there is a role for stronger regional value chains, but this requires overcoming coordination failures and presenting a credible case of mutually beneficial growth in a situation where other SADC countries are (understandably) concerned about a possible mercantilist agenda in South Africa and where South African firms have, in many cases, not even considered regional suppliers as a viable alternative to existing partners.
In the end, debates about the potential for regional value chains are also being overtaken by the reality of climate change which requires measures to build wider and deeper markets for greater resilience against climate shocks. Greater integration of value chains across the SADC region makes better use of regional water resources and can reduce the impact of extreme water events on any one country in the region. Wider and deeper markets would also reduce price volatility associated with climate change as the supply-side shocks in one area would be proportionately less in a wider market which encompasses areas which had good rains and production. This also requires an appropriate set of policies within and across countries supporting more effective use of agricultural land by increasing fertiliser use, providing extension services, storage facilities etc. The effects of climate change on the regional food system has not been incorporated into national and regional industrial development strategies, and the urgency of doing so cannot be overstated.

53
5 Bibliography
Ackbarally, N. (2014, June 10). Mauritian Sugar Farmers Squeezed by Low Prices as Bagasse and Ethanol become Popular By-products. Retrieved from Inter Press Service News Agency: http://www.ipsnews.net/2014/06/mauritian-sugar-farmers-squeezed-by-low-prices-as-bagasse-and-ethanol-become-popular-by-products/
AFBIO. (2016). Transitioning out of GM maize: Towards nutrition security, climate adaptation, agro-ecology and social justice.
Arndt, C., & Thurlow, J. (2015). Climate uncertainty and economic development: evaluating the case of Mozambique to 2050. Climatic Change, 130:63-75.
Arndt, C., Strzepeck, K., Tarp, F., Thurlow, J., Fant, C., & L, W. (September 2010). Adapting to Climate Change: An Integrated Biophysical and Economic Assessment for Mozambique. UNUWider Wroking Paper 2010/101.
Arslan, A., McCarthy, N., Lipper, L., Asfaw, S., Cattaneo, A., & Kokwe, M. (2015). Climate Smart Agriculture? Assessing the Adaptation Implications in Zambia . Journal of Agricultural Economics. Vol 66. Issue 33, 753-780.
Bagopi, E., Chokwe, E., Halse, P., Hausiku, J., Humavindu, M, & Kalapula, W. a. (2014). Competition Dynamics and Regional Trade Flows in the Poultry Sector: The Case of South. Pre-ICN Forum. Marrakech: International Competition Network.
Bell, J., Nhundu, N., Paelo, A., Thosago, M.O. and Vilakazi, T. (2017). Growth and Strategies of Large and Lead Firms: Metals, Machinery and Equipment Sector. Johannesburg: Centre for Competition, Regulation, and Economic Development.
Bosiu, T., Chinanga, F., das Nair, R., Mondliwa, P., Phiri, M. and Ziba, F. (2017)a. Growth and Development in the Cosmetics, Soaps and Detergents Regional Value Chains: South Africa and Zambia. Johannesburg: Centre for Competition, Regulation, and Economic Development.
Bosiu, T., Nhundu, N., Paelo, A., Thosago, M.O. and Vilakazi, T. (2017)b. Growth and Strategies of Large and Lead Firms: Top 50 JSE Firms. Johannesburg: Centre for Competition, Regulation, and Economic Development.
Behuria, P. (2017, June 12). The Cautious Return of Import Substitution in Africa . Retrieved from London School of Economics : http://blogs.lse.ac.uk/africaatlse/2017/06/12/the-cautious-return-of-import-substitution-in-africa/
Byerlee, D., Falcon, W., & Naylor, R. (2016). The Tropical Oil Crop Revolution: Food, Feed, Fuel, and Forests. Oxford : Oxford University Press.
Chapoto, A., & Chisanga, B. (2016). Zambia Agricultural Status Report 2016. Lusaka: IAPRI.
Chilufya, W. (2017, February 8). Fall army worm maize attack: a case for diversity from farm to fork. Retrieved from Reliefweb: https://reliefweb.int/report/zambia/fall-army-worm-maize-attack-case-diversity-farm-fork
Chisanga, B., Meyer, F., Winter-Nelson, A., & Sitko, N. (2015). Does the Current Sugar Market Structure Benefit Consumers and Sugarcane Growers? 1st Annual Competition and Economic Regulation (ACER) Conference (pp. 1-34). Victoria Falls : Centre for Competition, Regulation, and Economic Development.

54
Chisoro, S., Jahari, C., Kilama, B., & Paremoer, T. (forthcoming ). Development of an oilseeds value chain between South Africa and Tanzania . Johannesburg : Centre for Competition, Regulation, and Economic Development .
Chulu, K. (2017, July 25). ZAMACE: Solution to farmers’ problems. Retrieved from Zambia Daily Mail Limited : https://www.daily-mail.co.zm/zamace-solution-to-farmers-problems/
Cramer, C., & Sender, J. (2015). Agro-processing, wage employment and export revenue: Opportunities for strategic intervention. Pretoria: TIPS.
das Nair, R., & Chisoro, S. (2016). The expansion of regional supermarket chains and implications for local suppliers: A comparison of findings from South Africa, Botswana, Zambia and Zimbabwe. Helsinki: UNU-Wider.
das Nair, R. and Chisoro, S. (2017). Growth and strategies of large, lead firms - Supermarkets. Johannesburg: Centre for Competition, Regulation and Economic Development .
das Nair, R., Nkhonjera, M., & Ziba, F. (2017). Growth and Development in the Sugar to Confectionery Value Chains in Zambia and South Africa. Johannesburg: Centre for Competition, Regulation and Economic Development .
Fessehaie, J., Roberts, S., & Takala-Greenish, L. (2015). Key findings from case studies of mining capital equipment, infrastructure inputs and soy agro-processing in Southern Africa and implications for regional industrial development agenda. Pretoria: TIPS.
Fischer, G., Hizsnyik, E., H, V., D, W., & Hermann, S. (2013). Climate, Land, Energy & Water Strategies. A Case Study of Mauritius . Laxenburg: International Institute for Applied Systems Analysis .
Food and Agriculture Organization of the United Nations. (2016). FAO. Retrieved November 10, 2016, from http://www.fao.org/3/a-i6030e.pdf
Food Business Africa . (2017, September 19). Edible Oil Manufacturers call for VAT removal . Retrieved from Food Business Africa : http://www.foodbusinessafrica.com/2017/09/19/edible-oil-manufacturers-call-for-vat-removal/
Gereffi, G. (2014). Global value chains in a post-Washington Consensus world. Review of International Political Economy, 21(1), 9-37.
Gereffi, G., & Fernandez-Stark, K. (2011). Global Value Chain Analysis: A Primer . North Carolina, USA: Center on Globalization, Governance & Competitiveness (CGGC), Duke University .
GRAIN SA . (2017, October 21). Production Reports . Retrieved from Grain SA : http://www.grainsa.co.za/pages/industry-reports/production-reports
Hausman, R. (2008). International Panel on Growth . Pretoria : National Treasury .
IFIS (International Food Information Service). (2009 ). Dictionary of Food Science & Technology . Reading, UK: Wiley-Blackwell.
Imakando, M. (2017). Initiative to Increase Trade and Regional Industrialisation: Soya Bean Value Chain. Johannesburg: CCRED.
Jack, A. (2015, September 23). Sugar producers in Mauritius aim to find a sweeter future . Retrieved from Financial Times: https://www.ft.com/content/e7e53fc4-562d-11e5-9846-de406ccb37f2

55
JSE. (2017, October 23). Zambia Grain Contracts. Retrieved from Johannesburg Stock Exchange : https://www.jse.co.za/trade/derivative-market/commodity-derivatives/zambian-grain
Koster, H. (2016, October). Consultant: Grain Council. (T. Paremoer, & S. Roberts, Interviewers)
Lusaka Times . (2017, February 2). Govt bans importation of edible oils . Retrieved from Lusaka Times: https://www.lusakatimes.com/2017/02/02/govt-bans-importation-edible-oils/
Ministry of Industry, Trade and Investment. (2016). United Republic of Tanzania Sunflower Development Strategy . Geneva & Dar es Salaam : International Trade Centre & Ministry of Industry, Trade and Investment in Tanzania .
Mozambique Ministry of Industry and Trade. (2007). Ministry of Industry and Trade. Retrieved November 25, 2016, from http://www.trademarksa.org/sites/default/files/publications/Mozambique%20Industrial%20Policy%20and%20Strategy%202007.pdf
Mulenga, D. (2017, May 9). The fall armyworm resurfaces in Zambia. Retrieved from African Farming.com: https://www.africanfarming.com/fall-armyworm-resurfaces-zambia/
Nava Bharat Ventures Limited . (2017, October 19 ). Business Overview. Retrieved from Nava Bharat Ventures Limited : http://www.nbventures.com/business_overview.htm
Ncube, P., Roberts, S., & Vilakazi, T. (2015). Study of Competition in the Road Freight Sector in the SADC Region - Case Study of Fertiliser Transport and Trading in Zambia, Tanzania and Malawi. Johannesburg : Centre for Competition, Regulation and Economic Development .
Ncube, P., Roberts, S., & Zengeni, T. (2016). Development of the animal feed to poultry value chain across Botswana, South Africa and Zimbabwe, WIDER Working Paper 2016/2. Helsinki: UNU-WIDER.
Ncube, P., Roberts, S., & Zengeni, T. (2017). The Southern African poultry value chain, WIDER Working Paper 2017/97. Helsinki: UNU-WIDER.
Ncube, P., Roberts, S., Zengeni, T., & Samboko, P. (2017). Idenitfying growth opportunities in the Southern African Development Community through regional value chains, WIDER Working Paper 2017/4. Helsinki: UNU-WIDER.
OECD. (2017, July 10). Meat Consumption . Retrieved from OECD-FAO Agricultural Outlook: http://www.oecd-ilibrary.org/agriculture-and-food/oecd-fao-agricultural-outlook_19991142
Paelo, A. & Vilakazi, T (2017). Understanding intra-regional transport: Competition in road transportation between Malawi, Mozambique, South Africa, Zambia, and Zimbabwe. WIDER Working Paper 2017/46. Helsinki: UNU-WIDER.
SADC. (2015). SADC Industrialisation Strategy and Roadmap. Botswana: Southern African Development Community .
Serlemitsos, J., & Fusco, H. (2001). Vitamin A fortification of sugar in Zambia 1998 - 2001. Arlington: The USAID Micronutrient Program.
Sihlobo, M. W. (2017, April 13). Agricultural Economist, Agbiz . (T. Paremoer, & S. Chisoro, Interviewers)

56
Technoserve. (2011, February ). Southern Africa Regional Soybean Roadmap. Retrieved from Technoserve : http://www.technoserve.org/files/downloads/technoserve-bmgf-regional-presentation.pdf
Thurlow, J., Zhu, T., & Diao, X. (2011). Current Climate Variability and Future Climate Change: Estimated Growth and Poverty Impacts for Zambia . WIDER Working Paper, No. 2011/85.
TradeMark East Africa. (2016, May 3). Standards Harmonization contributes to increased Intra-EAC trade. Retrieved from TradeMark East Africa: https://www.trademarkea.com/news/standards-harmonization-contributes-to-increased-intra-eac-trade/
Tralac. (2017, March 3). Edible oils now on EAC list of sensitive goods. Retrieved from Tralac: https://www.tralac.org/news/article/11352-edible-oils-now-on-eac-list-of-sensitive-goods.html
UNCTAD. (2015). World Investment Report.
University of Missouri. (2017, October 22). Soybean Shatter . Retrieved from University of Missouri Extension : http://extension.missouri.edu/harrison/documents/Soybean%20Shatter.pdf
Zambia Business Times. (2017, July 31). Zambia’s Commodities Exchange gears up for grain Price Discovery. Retrieved from Zambia Business Times: https://zambiabusinesstimes.com/2017/07/31/zambias-commodities-exchange-gears-up-for-grain-price-discovery/
Zambian National Farmers Union . (2017, October 4). Reaction to 2018 Budget: Agriculture. Retrieved from ZNFU: http://www.znfu.org.zm/article/reaction-2018-budget-agriculture

57
6 Appendices
6.1 Appendix 1: Regional responses to climate change
Regional climate change initiatives
The SADC Policy Paper on Climate Change published in 2012 provides a summary of observed and expected climate change in SADC countries as a baseline for the development of adaptation strategies, and to promote regional integration and socio-economic development in the SADC region. 21 It also proposes a SADC climate change programme which includes establishing a Permanent Commission on Climate Change and refining the regional strategic action plan on climate change.
The SADC Water Sector Climate Change Adaption Strategy aims to improve climate resilience in the region by ensuring that water management systems can cope with climate variability.22 It creates an overarching framework for implementing adaptation strategies such as the SADC Treaty, the Regional Indicative Development Plan (RISDP), the Regional Water Policy, the Protocol on Shared Watercourses, River Basin agreements, the Regional Water Strategy, and the 3rd phase of the Regional Strategy Action Plan (RSAP III) on Integrated Water Resources Development and Management. The SADC’s Regional Climate Change Programme for 2009 – 201423 evaluated the impact of climate change on individual transboundary basins in more detail and proposed interventions around water allocation, groundwater management and infrastructure financing requirements.
The SADC support programme on Reducing Emissions from Deforestation and Forest Degradation (REDD) for 2012-201524 provides a framework to improve the capacities of Member States to design national REDD programmes.
The SADC Agriculture Policy and the Regional Indicative Strategic Development Plan (RISDP) 25 published in 2004 promotes the production, protection, processing and storage of all crops in the SADC region to secure food security in the face of the impact of climate change. It also promotes irrigation and addresses impacts of climate change on livestock production.
SADC has also established several bodies to monitor climatic conditions, develop early warning systems and respond to associated challenges such as the effect of adverse weather events on food security, agricultural production and the regional economy at large. Bodies responsible for monitoring and early detection include:
i. The Drought Management Centre, established in the early 90s to conduct climate monitoring and develop early warning systems for droughts, floods and other extreme weather events;
ii. The Southern Africa Regional Climate Outlook Forum (SARCOF)26 which brings together climate scientists from SADC National Meteorological and Hydrological Services (NMHSs) and the Drought Monitoring Centre (DMC) to prepare reports on seasonal climate status and outlook;
iii. The SADC Regional Remote Sensing Unit which was established in 1988 as a centre of technical expertise facilitating training programmes and technical support in the field of Remote Sensing, Agrometeorology and GIS;
21See Lesolle (2011). No update on progress since publication 22 Climate change adaptation in SADC. A Strategy for the Water Sector 2011. There are no updates on implementation since publication 23 Climate Change Adaptation: Perspectives for the Southern African Development Community (SADC). Long Term Adaptation Scenarios Flagship Research Program (LTAS) Phase 2 (june 2013 – june 2014) 24 SADC (2011) 25 SADC Website. No update on the implementation 26 Southern Africa Sub-Regional Framework of Climate Change Programmes

58
iv. The SADC Task Force for Monitoring Weather Conditions which was established in the 90s and comprises the Regional Early Warning Unit, the Regional Remote Sensing Project, the Drought Monitoring Centre and the Famine Early Warning System Project and was established to monitor weather conditions; and
v. SADC Regional El-Niño Response Team27 which was established in response to the impacts of the 2015/2016 El-Niño phenomenon to perform monitoring and evaluation of the response to allow for effective decision making and make recommendations for future disasters
The SADC Programme on Early Warning Systems (EWS) is an overarching programme that coordinates the actions of national government and facilitates information sharing. The programme provides information on food crop yields, food supplies and food requirements. National Early Warning Units have been established in all Member States to collect, analyse and disseminate early warning information at country level. The programme faces significant challenges with respect to the quality and availability of data, and thus with information sharing.
Regional insurance mechanisms against adverse weather events
SADC has plans to establish a Regional Drought Fund for member countries but the most comprehensive regional insurance scheme at present is the African Union’s ‘African Risk Capacity’. Established in 2012 as a Specialised Agency of the AU, African Risk Capacity (ARC) is a risk management and resilience-building platform that provides AU Member States with the financial tools and infrastructure they need to manage natural disaster risk and adapt to climate change. Its package includes Early Warning, Contingency Planning, Climate Risk Insurance, and Climate Adaptation Finance. Through a regionally-driven risk transfer and risk-sharing mechanism, ARC provides early disbursement of emergency response services and funds in affected areas.
One of the products offered by ARC is the ‘Extreme Climate Facility’ which is a new financial mechanism that secures direct access for African governments to climate finance to respond to the impact of increased climate volatility. It aims to provide an additional $500 million in climate adaptation financing capacity.
With an initial $90 million the ARC issued drought insurance policies totalling nearly $130 million in coverage for a total premium cost of $17 million to a first group of African governments (Kenya, Mauritania, Niger and Senegal) in May 2014. The first insurance pay-outs of just over $26 million were made to Mauritania, Niger and Senegal because of drought conditions in 2014. After five additional countries joined the pool in May 2015, the drought coverage has increased to over $190 million for the 2015/16 rainfall seasons. ARC aims to reach as many as 30 countries with $1.5 billion of coverage against drought, flood and cyclones, indirectly insuring around 150 million Africans by 2020. Not not all SADC members have ratified the ARC Establishment Agreement. Only Mozambique and Zambia in the five countries under review are signatories.
27 SADC (2016). No update since announcement.

59
6.2 Appendix 2: National responses to climate change
National interventions
Tanzania
The Government of Tanzania has put in place several initiatives to address the challenges of climate change. These include the National Adaptation Programme of Action (NAPA -2007), National Adaptation Strategy and Action Plan (2009), the National Climate Change Strategy (2012) and the Agriculture Climate Resilience Plan (2014). The implementation of these strategies however appears to have progressed slowly due to challenges such as inadequate information on climate change impacts and vulnerability, inadequate capacity of address climate change impacts, and competing policy priorities.
Tanzania’s National Adaptation Plans of Action was established in 2007 to develop adaptation measures across key sectors including agriculture, energy, forestry and wetlands, health, human settlements, coastal, marine and freshwater resources.
The National Climate Change Strategy was developed in 2012 with the goal of enabling Tanzania to effectively adapt to climate change and participate in global efforts to mitigate climate change in line with the Tanzania Development Vision 2025 as well as national sectoral policies.
Tanzania has also developed an Agriculture Climate Resilience Plan. Following the publication of the National Climate Change Strategy in 2012, the Ministry of Agriculture, Food Security, and Co-operatives (MAFC) developed a sector-specific response which was published in 2014. The plan seeks to address the establishment of pest, disease, and early warning systems, the development of policy briefs and financial incentives to assist with mainstreaming climate smart agriculture into agricultural programmes, the updating of irrigation master plans to consider availability and climate, and incentivising the development of water management technologies.
The government of Tanzania has identified climate change as a key priority and seems to be incorporating climate adaptation into its agricultural policy planning processing. It has also set up a Monitoring and Evaluation Framework to assist responsible authorities to track progress and evaluate the impact of the adaptation initiatives in addressing the impacts of climate change.
Zambia
Zambia has been implementing climate change interventions over the years with specific strategic policy documents on adaptation and mitigation, including the 2007 National Adaptation Plan of Action (NAPA), the National Climate Change Response Strategy (NCCRS), the Nationally Appropriate Mitigation Action (NAMA), and the National Policy on Climate Change (NPCC). Despite these efforts, Zambia still faces several challenges that affect the implementation and effectiveness of these initiatives, including collecting climate-related data, monitoring the impact of climate change, moving from the development of adaptation plans to implementation by the line ministries, and addressing capacity and financial constraints to adaptation. Furthermore, there is a tendency for efforts to come and go with disasters, and institutional mechanisms tend to become virtually defunct between major disasters.
Consultations for the development of the National Policy on Climate Change started in 2010 led by the Ministry of Lands, Natural Resources and Environmental Protection (MLNREP) with support from the United Nations Development Programme (UNDP). A draft of the NPCC was developed and submitted in September 2015 to the Policy Advisory Committee (PAC), an advisory office under Cabinet Office.

60
The Policy is aimed at enabling the country to re-align its climate sensitive sectors of the economy and its society in order to meet its developmental goals through adaptation and mitigation interventions.
The National Climate Change Response Strategy (NCCRS) was developed in 2010. The strategy provides a comprehensive national institutional and implementation framework through which climate change adaptation, mitigation, technology, financing, public education, and awareness-related activities in Zambia can be coordinated and harmonized. It also emphasizes the importance of focusing on the most vulnerable sectors of the economy and mainstreaming climate change into development plans.
Nationally Appropriate Mitigation Action (NAMA) are currently being developed for four sectors: agriculture, transport, forestry, and waste management. NAMAs are concrete projects, policies, and/or programmes that shift a technology or sector in a country onto a low-carbon development trajectory.
Mozambique
The Government of Mozambique has developed few adaptation initiatives up to date. These include the National Adaptation Programme of Action (NAPA) (2007) and the 2012 National Climate Change Strategy for 2013-2025. The country has experienced a number of implementation challenges resulting in relatively slow progress. These include developing adequate early warning systems, strengthening planning capacity at the national and local levels, and addressing capacity and financial constraints to carry out adaptation related activities. A lack of coordination and cooperation between the various governmental departments has also been highlighted as the major weakness. However, a Climate Change Coordination Unit was established in 2014 to improve coordination.
The National Adaptation Programme of Action aims to coordinate the development and implementation of an action plan for adaptation to climate change for various economic and social development sectors, with an emphasis on disaster risk reduction, early warning systems, agriculture, fisheries, energy, water resources, ecosystems, and coastal zones.
The National Climate Change Strategy was launched in 2013 for the 2013 – 2025 period to shift the focus from mere adaptation to mitigation, adaptation and financing. The measures that were highlighted include strengthening early warning systems, strengthening capacity to prepare for and respond to climate risks, increasing capacity to manage water resources; increasing access to, and capacity to collect, store, treat and distribute water, increasing the resilience of agriculture, livestock and fisheries and assuring adequate food security and nutrition.
Mauritius
Mauritius developed a National Climate Change Action Plan in 1998 and ratified the United Nations Framework Convention on Climate Change (UNFCCC) in 1992. In 2010, it took further steps to include climate adaptation, mitigation and response in government policy with the establishment of a new Climate Change Office within the Ministry of Environment and Sustainable Development (MESD), which includes an Adaptation Unit.
So far, the Climate Change Office has managed to deliver several initiatives including a National Climate Change Adaptation Policy Framework, Disaster Risk Reduction and Management Strategic Framework and Action Plan, Technology Action Plan for an enhanced Climate Change Adaptation and Mitigation, and Climate Change Information Centre. However, implementation seems to have stalled due to lack of funding, insufficient human resources and the lack of a designated institution responsible for the action identified.
South Africa

61
Climate change adaptation activities in South Africa currently fall under the ambit of the Department of Environment Affairs. South Africa’s first climate change policy, the National Climate Change Response Policy (NCCRP), was developed in 2011. The country is also currently developing a National Adaptation Strategy.
However, there have also been several implementation challenges that have prevented the mainstreaming of climate change response and adaptation into the work of the national, regional and local government. Challenges include competing policy priorities given the significant levels of vulnerability in South Africa, the lack of resources (at all levels of government) to develop adaptation responses, and a lack climate data to monitor effects and design responses.
The National Climate Change Response Policy (2011) was the first comprehensive outline of national government's responsibilities relating to mitigation and adaptation. The NCCRP identifies and prioritises short- and medium-term adaptation interventions through a risk-based process. It has also been able to support the integration of climate change into various policies and frameworks including the medium-term strategic framework that set priorities for the 2014 – 2019 electoral term. Further, as a result of this policy, in 2016 all provinces had either completed or were in the process of revising their strategies.
The first draft South Africa National Adaptation Strategy was released in 2016. It recommends the creation, capacitation and operationalisation of an institutional structure that allows for integration and coordination between climate change adaptation efforts across sectors and at all levels of government, as well as alignment between climate change mitigation and adaptation in South Africa.
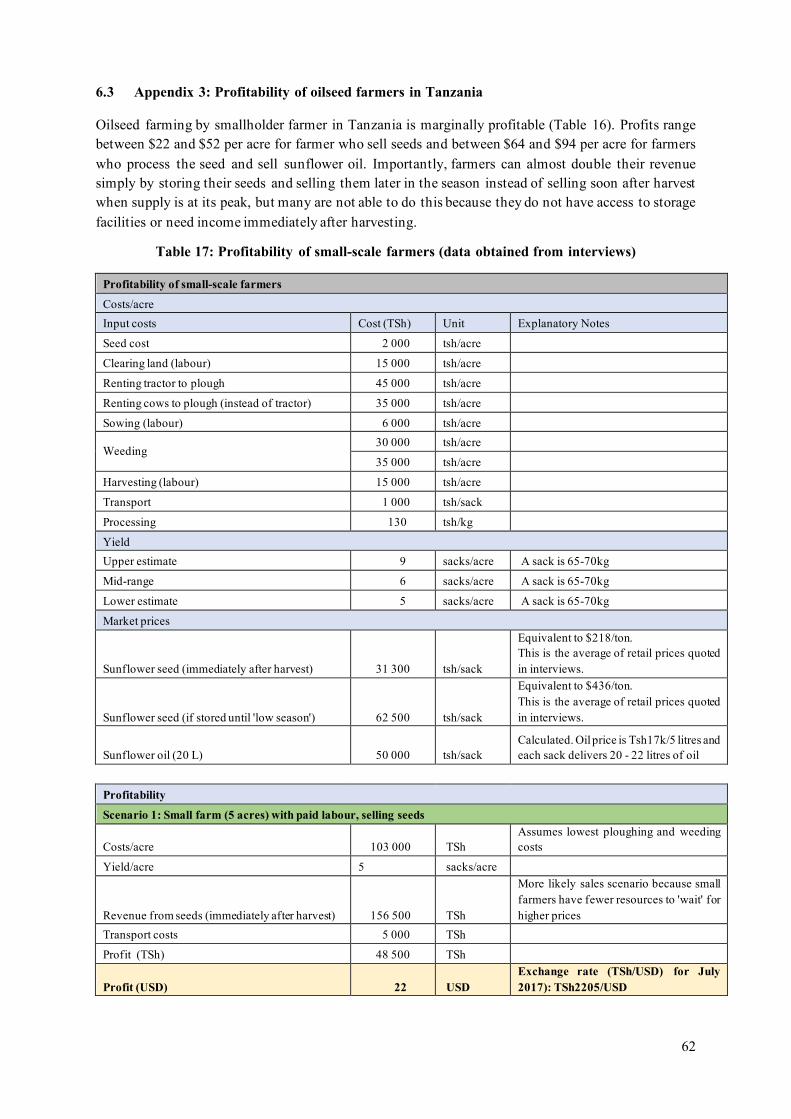
62
6.3 Appendix 3: Profitability of oilseed farmers in Tanzania
Oilseed farming by smallholder farmer in Tanzania is marginally profitable (Table 16). Profits range between $22 and $52 per acre for farmer who sell seeds and between $64 and $94 per acre for farmers who process the seed and sell sunflower oil. Importantly, farmers can almost double their revenue simply by storing their seeds and selling them later in the season instead of selling soon after harvest when supply is at its peak, but many are not able to do this because they do not have access to storage facilities or need income immediately after harvesting.
Table 17: Profitability of small-scale farmers (data obtained from interviews)
Profitability of small-scale farmers
Costs/acre Input costs Cost (TSh) Unit Explanatory Notes
Seed cost 2 000 tsh/acre
Clearing land (labour) 15 000 tsh/acre
Renting tractor to plough 45 000 tsh/acre
Renting cows to plough (instead of tractor) 35 000 tsh/acre
Sowing (labour) 6 000 tsh/acre
Weeding 30 000 tsh/acre
35 000 tsh/acre
Harvesting (labour) 15 000 tsh/acre
Transport 1 000 tsh/sack
Processing 130 tsh/kg
Yield Upper estimate 9 sacks/acre A sack is 65-70kg
Mid-range 6 sacks/acre A sack is 65-70kg
Lower estimate 5 sacks/acre A sack is 65-70kg
Market prices
Sunflower seed (immediately after harvest) 31 300 tsh/sack
Equivalent to $218/ton. This is the average of retail prices quoted in interviews.
Sunflower seed (if stored until 'low season') 62 500 tsh/sack
Equivalent to $436/ton. This is the average of retail prices quoted in interviews.
Sunflower oil (20 L) 50 000 tsh/sack Calculated. Oil price is Tsh17k/5 litres and each sack delivers 20 - 22 litres of oil
Profitability
Scenario 1: Small farm (5 acres) with paid labour, selling seeds
Costs/acre 103 000 TSh Assumes lowest ploughing and weeding costs
Yield/acre 5 sacks/acre
Revenue from seeds (immediately after harvest) 156 500 TSh
More likely sales scenario because small farmers have fewer resources to 'wait' for higher prices
Transport costs 5 000 TSh
Profit (TSh) 48 500 TSh
Profit (USD) 22 USD Exchange rate (TSh/USD) for July 2017): TSh2205/USD

63
Scenario 2: Small farm (5 acres) without paid labour, selling seeds
Costs/acre 37 000 TSh
Yield/acre 5 sacks/acre
Revenue from seeds (immediately after harvest) 156 500 TSh
Transport costs 5 000 TSh Profit (TSh) 114 500 TSh
Profit (USD) 52 USD Exchange rate (TSh/USD) for July 2017): TSh2205/USD
Scenario 3: Small farm (5 acres) with paid labour, selling oil
Costs/acre 103 000 TSh
Assumes lowest ploughing and weeding costs, & oilcake left in lieu of processing cost
Yield/acre 5 sacks/acre
Revenue from oil 250 000 TSh
More likely sales scenario because small farmers have fewer resources to 'wait' for higher prices
Transport costs 5 000 TSh Transport of seed to processor (lower end; excludes transport of oil back to market)
Profit (TSh) 142 000 TSh
Profit (USD) 64 USD Exchange rate (TSh/USD) for July 2017): TSh2205/USD
Scenario 4: Small farm (5 acres) without paid labour, selling oil
Costs/acre 37 000 TSh Assumes oilcake left in lieu of payment for processing
Yield/acre 5 sacks/acre Revenue from oil 250 000 TSh
Transport costs 5 000 TSh
Profit (TSh) 208 000 TSh
Profit (USD) 94 USD Exchange rate (TSh/USD) for July 2017): TSh2205/USD
Source: Compiled by authors based on interviews in Dodoma and Iringa