regional review on aquaculture development 7. north america...
TRANSCRIPT

FAO Fisheries Circular No. 1017/7 FIRI/C1017/7 ISSN 0429-9329
REGIONAL REVIEW ON AQUACULTURE DEVELOPMENT 7. NORTH AMERICA – 2005

Copies of FAO publications can be requested from: Sales and Marketing Group
Information Division FAO
Viale delle Terme di Caracalla 00100 Rome, Italy
E-mail: [email protected] Fax: (+39) 06 57053360

FAO Fisheries Circular No. 1017/7 FIRI/C1017/7
REGIONAL REVIEW ON AQUACULTURE DEVELOPMENT 7. NORTH AMERICA – 2005 by Paul G. Olin University of California Davis, United States of America With additional contributions from: Rohana Subasinghe FAO Fisheries Department
FOOD AND AGRICULTURE ORGANIZATION OF THE UNITED NATIONS Rome, 2006

The designations employed and the presentation of material in this information product do not imply the expression of any opinion whatsoever on the part of the Food and Agriculture Organization of the United Nations concerning the legal or development status of any country, territory, city or area or of its authorities, or concerning the delimitation of its frontiers or boundaries.
All rights reserved. Reproduction and dissemination of material in this information product for educational or other non-commercial purposes are authorized without any prior written permission from the copyright holders provided the source is fully acknowledged. Reproduction of material in this information product for resale or other commercial purposes is prohibited without written permission of the copyright holders. Applications for such permission should be addressed to the Chief, Electronic Publishing Policy and Support Branch, Information Division, FAO, Viale delle Terme di Caracalla, 00100 Rome, Italy or by e-mail to [email protected]
© FAO 2006

iii
FOREWORD The world population is on the rise, as is the demand for aquatic food products. Production from capture fisheries at the global level is levelling off and most of the main fishing areas have reached their maximum potential. Sustaining fish supplies from capture fisheries will, therefore, not be able to meet the growing global demand for aquatic food. At present, the aquaculture sector contributes a little over 40 million tonnes (excluding aquatic plants) to the world aquatic food production. According to recent FAO predictions, in order to maintain the current level of per capita consumption at the minimum, global aquaculture production should reach 80 million tonnes by 2050. Aquaculture has great potential to meet this increasing demand for aquatic food in most regions of the world. However, in order to achieve this, the sector (and aqua-farmers) will face significant challenges. A major task ahead for sustainable aquaculture production will be to develop approaches that will increase the contribution of aquaculture to the global food supply. These approaches must be realistic and achievable within the context of current social, economic, environmental and political circumstances. Accurate and timely information on the aquaculture sector is essential in order to evaluate the efficacy of these approaches and how they can be improved. Under the FAO Fisheries Department’s current work programme, the Inland Water Resources and Aquaculture Service (FIRI) of the Fishery Resources Division, using a wide-ranging consultative process, regularly conducts reviews on the status and trends in aquaculture development (FAO Fisheries Circular No. 886 – Review of the State of World Aquaculture and FAO Fisheries Circular No. 942 – Review of the State of World Inland Fisheries). The last review (both regional and global) was conducted in 1999/2000 and was published following the Global Conference on Aquaculture in the Third Millennium held in Bangkok, Thailand, in 2000 (NACA/FAO, 2001, Aquaculture in the Third Millennium). These reviews are seen as important milestones and the documents produced are recognized as significant reference materials for planning, implementing and managing responsible and sustainable aquaculture development worldwide. As part of this continuing process and with the current objective of preparing a global aquaculture development status and trends review, FIRI had embarked on a series of activities. These are:
• National Aquaculture Sector Overviews – NASOs – in all major aquaculture producing countries in the world;
• five regional workshops to discuss the status and trends in aquaculture development in Asia and the Pacific, Central and Eastern Europe, Latin America and the Caribbean, Near East and North Africa, and sub-Saharan Africa; and
• seven regional aquaculture development status and trends reviews in Asia and the Pacific, Central and Eastern Europe, Latin America and the Caribbean, Near East and North Africa, North America, sub-Saharan Africa and Western Europe.
This document presents the North America regional synthesis of all the information collected from the above activities.

iv
ACKNOWLEDGEMENTS Appreciation is extended to the author, Paul Olin (University of California) together with Rohana Subasinghe (FAO, Inland Water Resources and Aquaculture Service) for their valuable inputs and comments, and to Rine Sola (FAO, Marine Resources Service) for formatting the regional synthesis. Olin, P.G. Regional review on aquaculture development. 7. North America – 2005. FAO Fisheries Circular. No. 1017/7. Rome, FAO. 2006. 25 pp.
ABSTRACT The aquaculture industry in North America is a relative newcomer in the agricultural sector and has become well established in the last 25 years. Channel catfish (Ictalurus punctatus) and Atlantic salmon (Salmo salar) are the two major species cultured. The governments of Canada and the United States of America (USA) support the continued expansion of the aquaculture sector and are engaged with the industry to facilitate this development. At the same time there is a strong sentiment within the industry that regulatory agencies should take a much more proactive role to eliminate overlapping jurisdictions, resolve conflicting mandates and establish clear guidelines for industry expansion. A significant constraint to future aquaculture development is public concern about environmental risks associated with aquaculture, the safety of aquacultured products, and the potential impact of fish farms on marine ecosystems. The industry is responding to these concerns with the development of best management practices and environmental codes of practice to insure the long-term sustainability of land based, coastal and offshore aquaculture systems. Current production technology and the extensive environmental regulatory processes in place in Canada and the USA are effective in preventing these concerns from becoming problems. The document analyses the state and the trends in aquaculture development over the past few years in the North American region.

v
CONTENTS
Page Foreword .................................................................................................................................. iii Acknowledgements.................................................................................................................. iv Abstract .................................................................................................................................... iv List of figures........................................................................................................................... vi List of tables............................................................................................................................. vi Abbreviations and acronyms................................................................................................... vii 1. CHARACTERISTICS, STRUCTURE OF THE SECTOR ........................................1
1.1 Overview....................................................................................................................1 1.1.1 General information...........................................................................................1 1.1.2 History................................................................................................................3
1.2 Human resources........................................................................................................4 1.3 Distribution and characteristics..................................................................................5 1.4 Culture species and practices .....................................................................................8 1.5 Sector performance ..................................................................................................10
2. AQUACULTURE PRODUCTION, SPECIES AND VALUES ................................15 3. LEGAL, INSTITUTIONAL AND MANAGEMENT ASPECTS .............................18
3.1 Promotion and management of the Sector ...............................................................18 4. TREND ISSUES AND DEVELOPMENT...................................................................21
4.1 Social impacts and employment and poverty reduction ..........................................21 4.2 Aquacultures contribution to food security..............................................................21 4.3 Economics and trade ................................................................................................22 4.4 Institutions to support responsible development of aquaculture..............................22
5. REFERENCES...............................................................................................................23

vi
LIST OF FIGURES
Page
Figure 1 North American primary species value (US$1 000) (FAO, 2005a)....................... 4Figure 2 Total North American production by culture environment (FAO, 2005a)............ 5Figure 3 United States aquaculture farms by region (USDA, 1998).................................... 5Figure 4 Production methods in United States aquaculture (USDA, 1998)......................... 6Figure 5 North American fish production 2003 (tonnes) (FAO, 2005a).............................. 7Figure 6 North American fish value by species 2003 (US$1 000) (FAO, 2005a)............... 7Figure 7 Canada fish production 2004 (tonnes) (FAO, 2005a)............................................ 8Figure 8 US fish production 2003 (tonnes) (FAO, 2005a)................................................... 8Figure 9 North American invertebrate production 2003 (tonnes) (FAO, 2005a)................. 9Figure 10 North American invertebrate value 2003 (US$1 000) (FAO, 2005a).................... 9Figure 11 North American capture and production volumes 2003 (tonnes) (FAO 2005a).. 10Figure 12 Total aquaculture production within North America (tonnes) (FAO, 2005a)........ 10Figure 13 Total value of aquaculture production in North America (US$1 000) (FAO,
2005a)......................................................................................................................
10Figure 14 Relationship between growth of capture fisheries and aquaculture sector within
North America (tonnes) (FAO, 2005a)...................................................................
11Figure 15 Relationship between growth of North American capture fisheries and aqua-
culture sector (aquaculture rescaled on secondary axis tonnes) (FAO, 2005a)......
11Figure 16 North American aquaculture volume production trends (FAO, 2005a)................ 16Figure 17 North American aquaculture revenue trend (FAO, 2005a)..................................... 16
LIST OF TABLES
Table 1 North American demographics 2005..................................................................... 2Table 2 North American demographics 2025..................................................................... 2Table 3 Economic indicators for the United States and Canada 2004................................ 3Table 4 States comprising five US regions......................................................................... 5Table 5 GPS Coordinates of North American primary aquaculture production areas....... 6Table 6 North American species production and value by country 2003 (FAO, 2005a)... 12Table 7 Canadian primary provincial aquaculture production 2004................................. 13Table 8 Canadian primary provincial aquaculture value 2004.......................................... 14Table 9 Total North American value and aquaculture production by major ISSCAAP
grouping (FAO, 2005a)..........................................................................................
14

vii
ABBREVIATIONS AND ACRONYMS AAC Aquaculture Association of Canada ACRDP Aquaculture Collaborative Research and Development Program BC British Columbia BSE Bovine Spongiform Encephalopathy CAIA Canadian Aquaculture Industry Alliance CSREES Cooperative State Research Education and Extension Service DFO Department of Fisheries and Oceans, Canada EPA Environmental Protection Agency FAO/FIRI Inland Water Resources and Aquaculture Service GDP Gross Domestic Product GNP Gross National Product ISSCAAP International Standard Statistical Classification of Aquatic Animals and Plants of FAO NASOs National Aquaculture Sector Overviews NOAA National Oceanographic and Atmospheric Administration NPDES National Pollutant Discharge Elimination System PCB Polychlorinated Biphenyls USDA US Department of Agriculture WAS World Aquaculture Society

viii

1
1. CHARACTERISTICS, STRUCTURE OF THE SECTOR
The aquaculture industry in North America is a relative newcomer in the agricultural sector and has become well established in the last 25 years. Channel catfish (Ictalurus punctatus) production in 2004 valued at US$480 million and Atlantic salmon (Salmo salar) worth US$339 million place these two species as the industry leaders. Aquaculture is an agricultural industry developing in a modern regulatory climate and there have been and will continue to be challenges to meet stringent environmental safeguards and address high production costs, in order to remain competitive in the global marketplace. The governments of Canada and the United States of America (USA) support the continued expansion of the aquaculture sector and are engaged with the industry to facilitate this development. At the same time there is a strong sentiment within the industry that regulatory agencies should take a much more proactive role to eliminate overlapping jurisdictions, resolve conflicting mandates and establish clear guidelines for industry expansion. This is especially true with regard to leasing and tenure of public trust coastal and marine locations. Limited supplies of freshwater and high land values dictate that any significant production increases will likely occur in these nearshore and offshore marine waters. Advancing new technologies in cage culture design, feed delivery, production and harvesting systems will support this move offshore. The challenge will be for the respective governments to manage conflicting uses and establish a supportive regulatory framework that does not stifle continued growth of the industry. A significant constraint to future aquaculture development is public concern about environmental risks associated with aquaculture, the safety of aquacultured products, and the potential impact of fish farms on marine ecosystems. The industry is responding to these concerns with the development of best management practices and environmental codes of practice to ensure the long-term sustainability of land based, coastal, and offshore aquaculture systems. Current production technology and the extensive environmental regulatory processes in place in Canada and the USA are effective in preventing these concerns from becoming problems. North American producers have a significant advantage resulting from the infrastructure in place to support industry development. This includes a network of government and university researchers, transportation infrastructure, feed manufacturing plants, processing facilities, veterinary services, and a well-educated work force. Finally, close proximity to one of the world’s largest seafood markets is a decided advantage. The USA alone imports US$11 billion in seafood products annually (NOAA, 2004). 1.1 Overview 1.1.1 General information The North American population is expected to increase 15 percent by 2025, from 328.5 million to 387.8 million, an additional 59.3 million people (US Census Bureau, 2005) (Tables 1 and 2). At current consumption levels of 7.5 kg/person, this increase alone will require an additional 445 000 tonnes. In both Canada and the USA there are slightly more women than men with the North American population breakdown of 51 percent female and 49 percent male. The age distribution in North America is undergoing a fundamental shift as the post Second World War “baby boom” generation retires. By 2020 there will be 70 million Americans over the age of 60 representing around 18 percent

2
of the population. It has been shown that older consumers eat more seafood and this is likely to increase seafood consumption beyond that expected by population increase alone (Johnson, 2004). Additionally, these older consumers are generally affluent, health conscious, and possess the expendable income to eat in restaurants more often where a significant percentage of seafood sales occur. Median household income in the USA was US$44 389 as a three year average from 2002–2004. Compared with 1967, the first year for which household income statistics are available, real median household income was up 30 percent (US Census Bureau, 2005). The gross domestic product (GDP) per person for Canada and the USA in 2004 was US$31 884 and US$39 919, respectively (UNECE, 2005). For the fourth consecutive year the US poverty rate rose, from 12.5 percent in 2003 to 12.7 percent in 2004. The number of people in poverty increased also, by 1.1 million, to 37 million in 2004 (USDA, 2004). In both Canada and the USA there is an increasing gap in income between the richest and poorest segments of society. Rural Canadian populations had lower poverty rates than urban areas at 13.6 and 17.3 percent respectively. North America is a largely urbanized region with only 17 percent of Americans and 20 percent of Canadians living in rural areas in 2004 (UNECE, 2005; Statistics Canada, 2005a). The population in the USA has a wide range of educational backgrounds with 20 percent not completing secondary school, 29 percent completing secondary, 24 percent graduating from college, and the remaining 27 percent having completed secondary school and some college. In the last decade, the proportion of Canadians with a college or university degree increased. In 2001, 61 percent of all Canadians aged 25–34 had at least some education beyond high school. This marks an increase over a decade earlier when only 49 percent of people in that age category had any post-secondary education. Table 1. North American demographics 20051
2005 Statistics United States Canada North America
Population2 295 734 32 805 328 539 Males 145 309 16 216 161 525 Females 150 425 16 589 167 014 Fertility rate 2.1 1.6 n/a Growth rate 0.9% 0.9% n/a Life expectancy 77.7% 80.1% n/a 1US Census Bureau 2Population numbers in 1 000s
Table 2. North American demographics 20251
2025 Statistics United States Canada North America
Population2 349 666 38 165 387 831 Males 171 918 18 764 190 682 Females 177 748 19 401 197 149 Fertility rate 2.2 1.7 n/a Growth rate 0.8% 0.6% n/a Life expectancy 80.5% 82.2% n/a 1US Census Bureau 2Population numbers in 1 000s
In 2005 fertility rates in the USA and Canada were 2.1 and 1.6 respectively, with the projection that they would each increase 0.1 percent by 2025 (Tables 1 and 2). Population growth was 0.9 percent in both countries in 2005, with 2005 projections calling for declines to 0.8 percent for the USA and

3
0.6 percent in Canada. Canadians enjoy a longer life expectancy than Americans, 80.1 compared to 77.7 years. By 2025, American life expectancy should increase to 80.5 years, while that for Canadians is expected to increase to 82.2 years. The Gross National Product (GNP) is the total dollar value of all final goods and services produced for consumption in a particular time period and for the USA was US$11.6 trillion while that for Canada was US$993 billion in 2004. Both countries have successful market driven economies with a strong industrial and agricultural base. Both the Canadian and American economies have recovered solidly from the recessions of the early and late-1990s as a result of controlled inflation rates, low interest rates and low dollar values relative to other major currencies. The Gross Domestic Product (GDP) measures output generated through production by labour and property physically located within a country and was US$12.2 trillion in the USA and US$906 billion in Canada in 2004 (Table 3) (World Bank, 2005). Employment growth in Canada declined slightly from 1.9 in 2003 to 1.7 percent in 2004, while in the USA it increased slightly from 0.9 to 1.1 percent during the same time period. The unemployment rates declined in both countries in 2004 to 7.2 percent in Canada and 5.5 percent in the USA.
Table 3. Economic indicators for the United States of America and Canada 20041,2
Value United States Canada North America
Gross Domestic Product US$11.6 trillion US$993 billion US$12.6 trillion
Gross National Product US$12.2 trillion US$906 billion US$13.1 trillion Employment growth* 1.1% 1.7% n/a Unemployment* 5.5% 7.2% n/a 1UNECE, 2005 2US Census Bureau, 2005
1.1.2 History
Aquaculture production in North America has a long tradition beginning with the activities of federal, state and provincial agencies to enhance sportfishing opportunities. The US Fish and Fisheries Commission was established in 1871 and one main goal was to propagate fish, including trout and channel catfish for stocking in streams, lakes, reservoirs and farm ponds. The first fish hatchery opened in Madison, Wisconsin in 1887, and by 1922 Wisconsin had 12 hatcheries planting upwards of 100 million fish each year. Similar hatcheries were developed in other states and provinces and early research at these hatcheries refined technology to spawn and rear salmonids and channel catfish, providing the technical foundation for these industries to develop in the mid to late-1900s. Spawning of channel catfish in ponds was first attempted in 1906 and after several repeated attempts the first successful spawning in ponds was reported in 1914 (Tucker et al., 2004). Channel catfish were routinely propagated in hatchery ponds of many state and federal facilities during the 1920s for stocking. In the early-1960s, catfish farming for food fish began in earnest and by 1966 over 4 000 ha were farmed in Arkansas. In 1967, a group of catfish farmers formed a partnership to construct a processing plant, and in 1971 the first feed mill was built by a farmer’s cooperative. These developments provided the infrastructure to support significant industry expansion and from 1982 to 2002 the pond area approximately doubled and production increased six-fold. In 2003 catfish represented 64 percent of North American production value generating US$384 million in income (Figure 1). Harvest yields vary considerably but the industry average is 4 000/kg/ha (Tucker et al., 2004).

4
Atlantic salmon production began in the 1970s in North America as an industry with a small number of entrepreneurs using ocean net pens in the Pacific Northwest. Opposition developed around concerns over environmental impacts and prevented the industry from significant expansion in the USA. In 1982, Norwegian investors interested in expanding the industry brought Norwegian technology and investment to British Columbia and created the beginnings of what would become the world’s fourth largest producer of farmed Atlantic salmon. Conducted primarily in coastal waters of British Columbia and New Brunswick, Canadian production in 2004 reached 96 744 tonnes valued at
US$339 million (Statistics Canada, 2005a). The industry in the USA has been constrained by conflicts over coastal uses, environmental regulation, and on the Atlantic coast, concerns about competition with endangered wild stocks. Nonetheless, the US industry in 2003 produced 16 315 tonnes valued at US$44 million (FAO, 2005a). Production density varies from stocking to harvest but a range of 15–25 kg/m3 is standard in the industry. Production costs are in the range of US$5–7/kg (Forster, 2002). Using British Columbia (BC) as a benchmark, Chile has the lowest production costs at 86.8 percent of that in BC, while New Brunswick is the highest at 106 percent, due primarily to disease related losses (Price Waterhouse Coopers, 2003). Norway and the United Kingdom of Great Britain and Northern Ireland (UK) rank at 95 percent. 1.2 Human resources Employment in the aquaculture sector in the USA is estimated at 180 000 and this includes direct and indirect occupations (US DOC, 2000). Sixty-seven percent of US farms are individual or family farms while the remaining 33 percent are in partnerships, corporations, or another form of ownership (USDA, 2004). Fifty-eight percent of US farmers list farming as their primary occupation. Seventy-one percent of operators are over 45 years old and sixty-eight percent are full owners. Fifty-five percent of farms have only one operator (USDA, 2004). In Canada direct aquaculture employment is estimated at between 5 000 and 6 000 people, with an additional 9 000 supporting the industry indirectly (Mathews, 2004). This employment is concentrated in the Provinces of British Columbia and New Brunswick, with each having just over one-third of total direct employment concentrated in the farmed salmon industry. More than 80 percent of Canadian aquaculturists are employed full time. In contrast with the USA, almost half are young between age 21 and 35, while a further 34 percent are age 36 to 50. There is a gender imbalance in the Canadian aquaculture work force with about 72 percent male and 28 percent female. First Nation peoples average 5.8 percent of aquaculture workers in Canada (Mathews, 2004). Skills required in the aquaculture employment sector vary considerably in relation to position and responsibilities. Direct employment involves low to moderately skilled employees involved with production aspects including water quality management, feeding and harvesting, with more highly skilled individuals in management positions overseeing these operations. Secondary and post secondary education is typical with postgraduate degrees common in the research and academic community. A highly specialized sector involves research and development that includes aquaculture engineering, veterinary diagnostics, fish health, development of therapeutants, diet formulation, reproductive physiology, larval rearing and nutrition.
Atlantic salmonUS$301 806 (33%)
OtherUS$227 353 (25%)
Channel catfish US$384 071 (42%)
Figure 1. North American primary species value (US$1 000) (FAO, 2005a)

5
1.3 Distribution and characteristics There are 8 218 active aquaculture farms in North America representing a combination of fish and shellfish firms, with 55.4 percent of production in freshwater and 44.5 percent of production in marine systems (Figure 2) (USDA, 2004; FAO, 2005a). There are 129 798 ha under freshwater production in the USA, and 25 793 ha of coastal waters support farms (USDA, 1998). The US Department of Agriculture’s most recent agriculture census
reports 6 653 aquaculture farms in the USA (USDA, 2004). Significant production capacity has developed in the last 25 years with the expansion of the catfish industry in Mississippi, Alabama, Arkansas and Louisiana, which together accounted for 95 percent of the US total sales in 2004 (USDA, 2005). The 2 738 farms found in the southeastern US region represent 68 percent of the US total and illustrate the importance of the catfish industry in the region (Figure 3, USDA, 1998). States comprising the five US regions can be found in Table 4.
Table 4. States comprising five US regions
Region States Northeast Connecticut, Delaware, Maine, Maryland, Massachusetts, New Hampshire, New
Jersey, New York, Pennsylvania, Rhode Island, Vermont, West Virginia
Southern Arkansas, Florida, Georgia, Kentucky, Louisiana, Mississippi, North Carolina, Oklahoma, South Carolina, Tennessee, Texas, Virginia
North Central Illinois, Indiana, Iowa, Kansas, Michigan, Minnesota, Missouri, Nebraska, North Dakota, Ohio, South Dakota, Wisconsin
Western Alaska, Arizona, California, Colorado, Idaho, Montana, Nevada, New Mexico, Oregon, Utah, Washington, Wyoming
Pacific Hawaii
The top producing area in the southeast region is known as the Delta, and includes the alluvial valley along the Mississippi River in western Mississippi, northeastern Louisiana, and southeastern Arkansas. This region has 34 642 ha in ponds and includes 86 percent of the land area in catfish production (Mathews, 2004). A secondary production center is about 300 km to the east in the Blackland Prarie at the center of the border between Mississippi and Alabama. Geographic coordinates for these regions can be found in Table 5.
Marinewater 309 642 tonnes
(44.5%)Brackishwater 260 tonnes
(<0.1%)
Freshwater 385 691 tonnes
(55.4%)
Figure 2. Total North American production by culture environment (FAO, 2005a)
Figure 3. United States aquaculture farms by region (USDA, 1998)
Southern68%
Northeastern11%
Tropical/Subtropical2%
North Central9%
Western10%

6
Table 5. GPS Coordinates of North American primary aquaculture production areas
Sector coordinates
Mississippi Delta
Blackland Prarie
Canadian Maritimes Vancouver Island
Southeast 32◦51’17.00” N 90◦29’03.00” W
32◦35’17.00” N 87◦19’04.00” W
45◦10’08.00” N 61◦07’07.00” W
48◦49’36.00” N 123◦11’04.00” W
Southwest 32◦51’03.00” N 91◦03’15.00” W
32◦26’22.00” N 87◦43’09.00” W
44◦22’41.00” N 64◦04’22.00” W
48◦15’34.00” N 124◦08’10.00” W
Northwest 33◦44’56.00” N 90◦57’30.00” W
33◦17’25.00” N 88◦37’30.00” W
46◦58 50.00” N 64◦25’23.00” W
51◦01’58.00” N 127◦44’10.00” W
Northeast 33◦41’40.00” N 90◦18’39.00” W
33◦17’01.00” N 88◦14’29.00” W
46◦28’52.00” N 61◦19’58.00” W
50◦39’58.00” N 128◦39’10.00” W
The western region of the USA has 407 farms and contributes 17 percent of aquaculture production comprised of a variety of species including channel catfish, hybrid striped bass (Morone saxatilis x M. chrysops), tilapia (Tilapia sp.), trout (Oncorhynchus mykiss), and sturgeon (Acipenser transmontanus) (USDA, 1998). Shellfish are produced in estuaries along the Pacific coast including mussels (Mytilus galloprovincialis), Manila clams (Tapes philippinarum), geoduck clams (Panopea abrupta), and Pacific cupped oysters (Crassostrea gigas). Abalone (Haliotis rufescens) are produced in land based raceways and ocean cages. While 47 000 tonnes of shellfish valued at US$90 million are produced from Alaska to California, the industry is centered in Washington State where 2004 production of 39 000 tonnes had a value of US$76.3 million (Downey, 2004). In the northeastern region of the country there are 436 farms producing 13 percent of aquaculture production including blue mussels (Mytilus edulis), eastern cupped oysters (Crassostrea virginica) and hard clams (Mercenaria mercenaria). Net pen culture of salmon is centered primarily in the state of Maine. The north central regions 362 farms are all freshwater and produce three percent of the value of US aquaculture. The subtropical state of Hawaii has 85 farms, or two percent of the total. Culture practices vary widely depending on the species being raised but the vast majority of finfish culture takes place in embankment ponds for catfish and ocean net pens for Atlantic salmon. In the USA, 63 percent of farms use ponds and 14 percent utilize flow through raceways or tanks (Figure 4). Recirculating systems are used by seven percent of farms, primarily raising tilapia, sturgeon and hybrid striped bass. Shellfish aquaculture producers employ a wide variety of gear, but oysters and clams are predominantly grown on cultch or in plastic mesh bags on intertidal mudflats, while mussels are planted on longlines. In the USA, most coastal regions are heavily developed or protected and there is increasing competition for access to coastal areas for aquaculture. This limited coastal access and finite freshwater resources inland are significant constraints to further industry development of any magnitude. While there are 133 312 km of coastline, there are few areas with protected waters and this dictates that any significant growth in aquaculture production will likely occur in offshore areas.
Figure 4. Production methods in United States aquaculture (USDA, 1998)
Ponds63%Flow through
raceways or tanks14%
Cages3%
Net Pens1%
Closed re-circulation tanks- 7%
Prepared bottoms7%
Other methods5%

7
Canada has capitalized on its 265 000 km coastline, the availability of investment capital, technology transfer, and a skilled labour force to create a dynamic industry producing Atlantic salmon and shellfish. Aquaculture production has risen dramatically in the last decade on the Pacific coast in British Columbia and in the Atlantic Canadian Maritime Provinces of New Brunswick, Prince Edward Island, Nova Scotia, Newfoundland and Labrador. Production in British Columbia and New Brunswick is predominantly Atlantic salmon which accounts for two-thirds of all aquaculture production in Canada. Prince Edward Island is the leader in production of blue mussels, and along with British Columbia and New Brunswick is also a significant producer of Pacific cupped oysters. Interior provinces in central and western Canada support land based trout farms producing food fish and stockers for the recreational fishing sector. As offshore technology develops further, Canada has 2.9 million km2 of continental shelf as a resource that could come into play. The Canadian industry is centered largely in sparsely populated coastal regions and supports remote rural communities, many of which are affected by declines in timber harvest and traditional fisheries. Of Canada’s population, 24 percent live within 100 km of the coast, in contrast to the USA where 43 percent of the people are coastal dwellers and the global average of 39 percent. This has the potential to reduce but not eliminate user conflicts relating to coastal access for continued aquaculture development. Additionally, there are many square kilometers of protected coastal embayments that could support continued aquaculture expansion. Channel catfish and Atlantic salmon combined account for 75 percent of North American finfish value and 87 percent of volume (Figures 5 and 6). These two species have benefited from genetic selection programs that have dramatically improved performance. While the finfish industry is clearly dominated by catfish and Atlantic salmon, there is a large diversity of species cultured in North America which collectively account for 23 percent of total finfish production and 25 percent of total value. These include rainbow trout, cyprinids, tilapia, hybrid striped bass, chinook and coho salmon, and other trout species. To foster future industry expansion, there is considerable interest in North America to develop culture technology for a number of new species including southern flounder, red drum, Atlantic cod, halibut, wolffish, yellowtail flounder, witch flounder, yellowtail and cobia. In particular, cobia is viewed as a leading candidate for significant expansion of ocean net pen culture with the development of fingerling
Figure 5. North American fish production 2003 (tonnes) (FAO, 2005a)
Rainbow trout24 155 (5%)
Chinook salmon15 700 (3%)
Trouts nei6 830 (1%)
Tilapias nei9 000 (2%)
Coho salmon1 400 (<1%)
Striped bass, hybrid5 192 (1%)
Cyprinids nei6 329 (1%)
Atlantic salmon106 465 (23%)
Channel catfish300 056 (64%)
Figure 6. North American fish value by species 2003 (US$1 000) (FAO, 2005a)
Chinook salmon26 297 (3%)
Trouts nei22 832 (3%)
Coho salmon4 369 (<1%)Tilapias nei
37 710 (4%)
Striped bass, hybrid30 425 (3%)
Cyprinids nei45 759 (5%)
Rainbow trout59 961 (7%)
Channel catfish384 072 (42%)
Atlantic salmon301 806 (33%)

8
production capacity and extraordinary growth rates to 6 kg in one year. One pilot scale facility is now raising cobia near Puerto Rico and two facilities are using ocean net pens in Hawaiian waters raising Hawaiian yellowtail and moi. 1.4 Culture species and practices Channel catfish are the largest aquaculture crop and the most valuable in North America with a 2003 harvest of 300 000 tonnes valued at US$384 million (Table 6) This represents 42 percent of the volume of North American finfish production and 33 percent of the value (Figures 5 and 6). The industry grew rapidly from 1980 to 2000 as a result of the availability of inexpensive land, readily available low cost labour and abundant groundwater supplies, coupled with a strong expanding domestic market. There are currently 1 155 farms in 16 States, but 94 percent of combined production area is in the states of Mississippi, Arkansas, Alabama, and Louisiana and more than 90 percent of crop value is generated in the region (USDA, 2004). Production is predominantly in embankment ponds from 3–6 ha filled with groundwater to 1–2 m depth. The average size farm is 65 ha. Production levels range from 2 700 to 7 900 kg/ha and the reported industry average is around 4 000 kg/ha (Mathews, 2004). Production costs are highly variable depending primarily on feed costs. In one analysis, breakeven price above variable costs was US$1.12/kg and increased to US$1.50/kg to cover total costs (Engle and Whitis, 2000). Atlantic salmon production in the region of 106 465 tonnes is valued at US$302 million, which is 22 percent of North American finfish production and 33 percent of crop value (FAO, 2005a) (Figures 5 and 6). Production is centered in the Canadian Provinces of British Columbia and New Brunswick with reported 2003 provincial production of 72 678 tonnes and 33 000 tonnes having a value of US$224 million and US$157 million respectively (Statistics Canada, 2005a). Coordinates for the main salmon and shellfish production regions around Vancouver Island in the Pacific and the Canadian Maritimes in the Atlantic can be found in Table 5. Canada is the fourth largest producer in the world, and BC is responsible for about two-thirds of Canadian production. However, BC's production is dwarfed by that of the top three producers – Norway, Chile and the UK, which together account for 85 percent of a total global production of 1.2 million tonnes. Since 1980, Atlantic salmon production in British Columbia has increased such that it is now the province’s largest agricultural export. The states of Washington and Maine had a combined 2003 production of 16 315 tonnes worth US$55 million. Production takes place in net pens in coastal waters and production densities are in the range of 15–25 kg/m3. The relative importance of catfish and salmon to the USA and Canadian industries is evident from the country finfish production profiles with 2004 Canadian data and US figures from 2003 (Statistics Canada, 2005a; FAO, 2005a) (Figures 7 and 8). Oyster production evolved in North America from localized fisheries established by indigenous people and European settlers, to managed fisheries with transplantation of shellstock from one region to another, and finally into hatchery based field growout where hatchery seed are outplanted into
Figure 7. Canada fish production 2004 (tonnes) (FAO, 2005a)
Salmon96 774 (90%)
Other Finfish5 448 (5%)
Steelhead(<1%)
Trout4 871 (5%)
Figure 8. US fish production 2003 (tonnes) (FAO, 2005a)
Catfish300 056 (83%)
Baitfish6 329 (2%)
Salmon16 315 (5%)
Striped bass5 192 (1%)
Trout 23 005 (6%)
Tilapia9 000 (3%)

9
coastal embayments using a variety of growout techniques. These include oyster seed on cultch grown on the bottom, and on stakes, tubes and lines. Cultchless seed are typically marketed as a half shell product following growout in bags on the bottom, in floating bags, or on racks. Production is highly variable and is dependent on the culture system, temperature, and productivity of growing waters, but 13 000 to 14 000 litres of shucked meats/ha is typical for bottom culture. This produces around 13 000 kg/ha of shucked meats. North American production of Pacific cupped oysters in 2003 of 49 756 tonnes was valued at US$41.4 million (FAO, 2005a) (Figures 9 and 10). Industry estimates from Washington State where most Pacific cupped oyster production occurs are higher with a reported 2003 crop value of US$76 million (Downey, 2004). The Pacific industry relies on the nonindigenous Pacific cupped oyster (Crassostrea gigas) originally imported from Japan in the early-1900s. There is currently some controversy over this oyster as an exotic species even though it has been cultured for almost a century. Early importations of seed and shellstock did result in the inadvertent introductions of predatory oyster drills from Japanese waters and the eastern Atlantic. The American cupped oyster industry in the Gulf of Mexico and along the Atlantic coast of North America produced 71 416 tonnes representing 34 percent of total shellfish production and 16 percent of value at US$33.9 million (Figures 9 and 10). Together, Pacific and American oysters comprise 57 percent of shellfish production and 36 percent of value. Red swamp crawfish production amounted to 33 498 tonnes in 2003 valued at US$48.6 million and is concentrated in the southeastern USA. Northern quahog production of 31 934 tonnes was valued at US$36.7 million in 2003, comprising 16 percent of total shellfish production. The blue mussel is an example of a localized success in shellfish aquaculture where growers on Prince Edward Island in Canada have established an industry that grew from 20 tonnes in 1988 to 16 826 tonnes in 2003 worth US$20.6 million (Statistics Canada, 2005a). This represents 76 percent of North American mussel production and provides direct and indirect employment to 2 500 people in the island province. Shellfish growers in North America are interested in increasing current production levels and developing culture protocols for new species to further expand production and create new markets. The geoduck clam is one good example of this and other species of interest include sea cucumbers, sea urchins, sea scallops and soft shell clams.
Figure 9. North American invertebrate production 2003 (tonnes) (FAO, 2005a)
Red swamp crawfish
33 498 (16%)
Northern quahog 31 934 (15%)
Blue mussel 22 055 (10%)
Pacific cupped oyster
49 756 (23%)
American cupped oyster
71 416 (34%)
Whiteleg shrimp4 577 (2%)
American cupped oyster Pacific cupped oyster Red swamp crawfish Northern quahog Blue mussel Whiteleg shrimp
Figure 10. North American invertebrate value 2003 (US$1 000) (FAO, 2005a)
Pacific cupped oyster
41 377 (20%)
Red swamp crawfish
48 572 (23%)
Northern quahog 36 724 (18%)
Blue mussel 25 545 (12%)
American cupped oyster
33 954 (16%) Whiteleg shrimp
23 205 (11%)
American cupped oyster Pacific cupped oyster Red swamp crawfish Northern quahog Blue mussel Whiteleg shrimp

10
1.5 Sector performance Global production from capture fisheries over the last decade has hovered in the 80–86 million tonnes range and is not expected to increase significantly (FAO, 2004). Capture fisheries in North America harvested 6 087 409 tonnes in 2003 up slightly from the 2002 harvest of 6 064 297 tonnes (FAO, 2004). The United States capture fisheries account for 74 percent of combined aquaculture and fisheries production in the region and Canada’s fisheries account for 16 percent (Figure 11). In comparison, aquaculture production in North America was 695 593 tonnes, or about 10 percent of the regions total seafood production with 8 percent from the USA and 2 percent from Canada. The United States produces 78.3 percent of the North American aquaculture production, but only 69 percent of the value, reflecting the higher value of salmon produced in Canada relative to the catfish that dominate US production (Figures 12 and 13). Worldwide, the aquaculture sector has grown at an average rate of 8.9 percent per year since 1970, compared with only 1.2 percent for capture fisheries over the same period (FAO, 2004). Aquaculture in North America during this same period has grown at an average rate of 4.3 percent. In 1990, North American capture fisheries peaked at 7 305 929 tonnes and subsequently declined to around 6 million tonnes where they have remained since 1995 (Figure 14). During this same time period aquaculture production in the region has almost doubled, rising from 356 664 tonnes to 695 593 tonnes (Figure 15). On a global scale, most aquaculture production has occurred in countries in Asia which accounted for 91.2 percent of the production quantity and 81.9 percent of the value in 2003. North America in contrast produced only 1.6 percent of global aquaculture output representing 2.7 percent of total value in 2003.
Figure 11. North American capture and production volumes 2003 (tonnes) (FAO 2005a)
US Production 544 329 (8%)
Canada Production 151,264 (2%)
Canada Capture1 098 718 (16%)
US Capture4 988 691 (74%)
Figure 12. Total aquaculture production within North America (tonnes) (FAO, 2005a)
United States of America
544 329 tonnes (78.3%)
Canada151 264 tonnes
(21.7%)
Figure 13. Total value of aquaculture production in North America (US$1 000) (FAO, 2005a)
Canada US$354 420
United States of America
US$804 533

11
The North American industry in 2003 continued to be dominated by marine cage production of 106 465 tonnes of Atlantic salmon along the Atlantic and Pacific coasts of Canada, and freshwater pond culture of 300 056 tonnes of channel catfish in the southeastern United States (Table 6). These two species combined represented 75 percent of total finfish aquaculture value in 2003 (Figure 6). Rainbow trout follows with production of 24 155 tonnes valued at US$59.9 million, 92 percent of which is produced in the USA. Chinook salmon produced in Canada generate US$26 million from production of 15 700 tonnes (Figures 5 and 6). Tilapia production of 9 000 tonnes in the USA is marketed primarily as a live product and generates US$37.7 million in revenue. Farming of trout species other than rainbow trout occurs in Canada with combined production of 6 830 tonnes worth US$22.8 million. Mixed carp species are produced in the USA, and the combined 6 329 tonnes
Figure 14. Relationship between growth of capture fisheries and aquaculture sector within North America (tonnes) (FAO, 2005a)
0
1000000
2000000
3000000
4000000
5000000
6000000
7000000
80000001970 1975 1980 1985 1990 1995 2000
CaptureAquaculture
Figure 15. Relationship between growth of North American capture fisheries and aquaculture sector (aquaculture rescaled on secondary axis tonnes) (FAO, 2005a)
0
1000000
2000000
3000000
4000000
5000000
6000000
7000000
80000001970 1975 1980 1985 1990 1995 2000
0
100000
200000
300000
400000
500000
600000
700000
800000
CaptureAquaculture

12
produced in 2003 were worth US$45.8 million. Hybrid striped bass are also farmed in the USA generating US$30.4 million from production of 5 192 tonnes. In 2004, catfish growers in the southeastern USA had sales of US$480 million, up 13 percent from the previous year (NASS, 2005). The top four States (Mississippi, Alabama, Arkansas and Louisiana) accounted for 95 percent of total US sales. Sales of foodsize fish increased 14 percent from 2003 to US$451 million. Fingerlings and fry sales totalled US$22.2 million, an increase of four percent from 2003. Sales of stockers decreased one percent totalling US$6.26 million in 2004. Direct sales to processors accounted for 94 percent of the total sales of foodsize fish. The water surface in catfish production ponds in 2004 totalled 72 200 ha, down two percent from 2003. An additional 330 ha are expected to enter production in 2005.
Table 6. North American species production and value by country 2003 (FAO, 2005a)
Species
North America volume (tonnes)
Canada volume
(%)
United States
volume (%)
North America
value (1 000 US$)
Canada value (%)
United States value (%)
Finfish Channel catfish 300 056 0 100 384 072 0 100 Atlantic salmon 106 465 85 15 301 806 82 18 Rainbow trout 24 155 5 95 59 961 8 92 Chinook salmon 15 700 100 0 26 297 100 0 Tilapias nei 9 000 0 100 37 710 0 100 Trouts nei 6 830 100 0 22 832 100 0 Cyprinids nei 6 329 0 100 45 759 0 100 Hybrid striped bass 5 192 0 100 30 425 0 100 Shellfish American cupped oyster 71 416 8 92 33 954 23 77 Pacific cupped oyster 49 756 14 86 41 377 13 87 Red swamp crawfish 33 498 0 100 48 572 0 100 Northern quahog 31 934 0 100 36 724 0 100 Blue mussel 22 055 93 7 25 545 86 14 Whiteleg shrimp 4 577 0 100 23 205 0 100
Production of American and Pacific cupped oysters amount to 57 percent of primary shellfish species produced with a combined value of US$75 million. The USA is the primary producer accounting for 92 and 86 percent (Table 6). Red swamp crawfish production of 33 498 tonnes in the southeastern USA worth US$49 million is the most valuable shellfish crop. Canada is the largest producer of blue mussels with production of 22 055 tonnes valued at US$26 million. This represents 93 percent of North American production and 86 percent of the crops value (Table 6). Ornamental fish are a significant industry in the state of Florida where 178 producers raise 700 species that generated US$47 million in farm gate value in 2003 (FASS, 2004). The overall value of the industry with multipliers is estimated at US$175 million (Watson and Shireman, 1996). Average farm gate prices for all catfish sold in 2004 were US$1.53/kg, up US$0.25 from 2003. Price paid to processors for all fish sold were US$4.91/kg, up US$0.40 from 2003. Final retail prices are generally two–three times that paid to processors. Fresh product sales account for 36 percent of the market and frozen products comprise the remaining 64 percent. Of the fresh market, 31 percent is whole fish and 57 percent is sold as fillets. In contrast, whole fish are only 6 percent of the frozen market with fillets comprising 61 percent. Other frozen product forms constitute the remaining
13
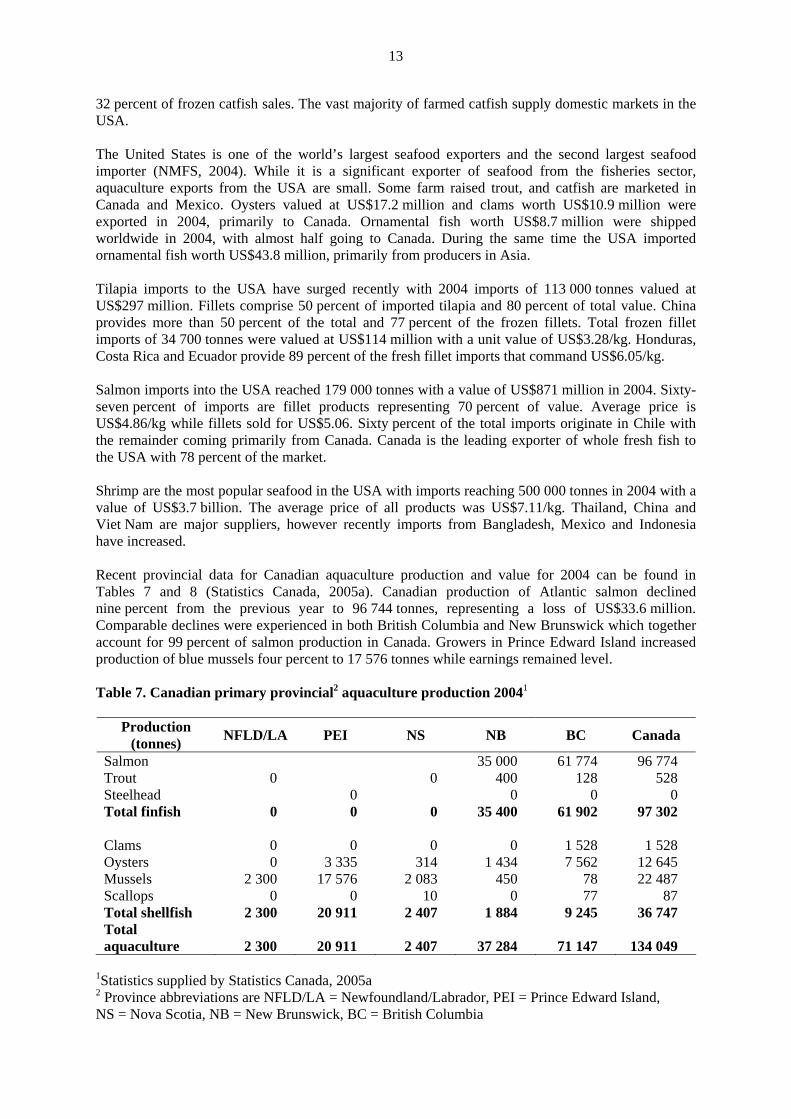
32 percent of frozen catfish sales. The vast majority of farmed catfish supply domestic markets in the USA. The United States is one of the world’s largest seafood exporters and the second largest seafood importer (NMFS, 2004). While it is a significant exporter of seafood from the fisheries sector, aquaculture exports from the USA are small. Some farm raised trout, and catfish are marketed in Canada and Mexico. Oysters valued at US$17.2 million and clams worth US$10.9 million were exported in 2004, primarily to Canada. Ornamental fish worth US$8.7 million were shipped worldwide in 2004, with almost half going to Canada. During the same time the USA imported ornamental fish worth US$43.8 million, primarily from producers in Asia. Tilapia imports to the USA have surged recently with 2004 imports of 113 000 tonnes valued at US$297 million. Fillets comprise 50 percent of imported tilapia and 80 percent of total value. China provides more than 50 percent of the total and 77 percent of the frozen fillets. Total frozen fillet imports of 34 700 tonnes were valued at US$114 million with a unit value of US$3.28/kg. Honduras, Costa Rica and Ecuador provide 89 percent of the fresh fillet imports that command US$6.05/kg. Salmon imports into the USA reached 179 000 tonnes with a value of US$871 million in 2004. Sixty-seven percent of imports are fillet products representing 70 percent of value. Average price is US$4.86/kg while fillets sold for US$5.06. Sixty percent of the total imports originate in Chile with the remainder coming primarily from Canada. Canada is the leading exporter of whole fresh fish to the USA with 78 percent of the market. Shrimp are the most popular seafood in the USA with imports reaching 500 000 tonnes in 2004 with a value of US$3.7 billion. The average price of all products was US$7.11/kg. Thailand, China and Viet Nam are major suppliers, however recently imports from Bangladesh, Mexico and Indonesia have increased. Recent provincial data for Canadian aquaculture production and value for 2004 can be found in Tables 7 and 8 (Statistics Canada, 2005a). Canadian production of Atlantic salmon declined nine percent from the previous year to 96 744 tonnes, representing a loss of US$33.6 million. Comparable declines were experienced in both British Columbia and New Brunswick which together account for 99 percent of salmon production in Canada. Growers in Prince Edward Island increased production of blue mussels four percent to 17 576 tonnes while earnings remained level. Table 7. Canadian primary provincial2 aquaculture production 20041
Production (tonnes) NFLD/LA PEI NS NB BC Canada
Salmon 35 000 61 774 96 774 Trout 0 0 400 128 528 Steelhead 0 0 0 0 Total finfish 0 0 0 35 400 61 902 97 302
Clams 0 0 0 0 1 528 1 528 Oysters 0 3 335 314 1 434 7 562 12 645 Mussels 2 300 17 576 2 083 450 78 22 487 Scallops 0 0 10 0 77 87 Total shellfish 2 300 20 911 2 407 1 884 9 245 36 747 Total aquaculture 2 300 20 911 2 407 37 284 71 147 134 049
1Statistics supplied by Statistics Canada, 2005a 2 Province abbreviations are NFLD/LA = Newfoundland/Labrador, PEI = Prince Edward Island, NS = Nova Scotia, NB = New Brunswick, BC = British Columbia

14
Table 8. Canadian primary provincial2 aquaculture value 20041
Value (US$1 000) NFLD/LA PEI NS NB BC Canada
Salmon 153 150 185 564 338 714 Trout 3 501 625 4 126 Steelhead 0 0 0 0 Total finfish 0 0 0 156 651 186 189 342 840
Clams 0 0 0 0 6 172 6 172 Oysters 0 5 837 786 1 317 6 243 14 183 Mussels 4 424 20 346 2 799 438 243 28 250 Scallops 0 0 84 0 501 585 Total shellfish 4 424 26 183 3 669 1 755 13 159 49 190 Total aquaculture 4 424 26 183 3 669 158 406 199 348 392 030
1Statistics supplied by Statistics Canada, 2005a 2 Province abbreviations are NFLD/LA = Newfoundland/Labrador, PEI = Prince Edward Island, NS = Nova Scotia, NB = New Brunswick, BC = British Columbia The majority of Canadian salmon production is exported to the USA and to a lesser degree Japan, Taiwan (Province of China) and France. Canada exported US$370 million in seafood products in 2004 with American markets accounting for almost 95 percent of the total. Canada holds 47 percent of the nearly US$1 billion US salmon market, competing primarily with Chile which holds a similar market share. Looking at aquaculture production by the International Standard Statistical Classification of Aquatic Animals and Plants of FAO (ISSCAAP) species groups it is once again apparent how channel catfish, Atlantic salmon, and oysters are the top crops in production volume, and the dominance of catfish and salmon is even more apparent when looking at relative value (Table 9). Table 9. Total North American value and aquaculture production by major ISSCAAP grouping
(FAO, 2005a)
Aquaculture production
Value of aquaculture production
(tonnes) (US$ million) Miscellaneous freshwater fishes 300 569 387 743.8 Salmons, trouts, smelts 154 590 415 507.4 Oysters 121 507 76 752.8 Clams, cockles, arkshells 37 211 59 260.3 Freshwater crustaceans 33 547 49 008.2 Mussels 22 055 25 544.5 Tilapias and other cichlids 9 000 37 710.0 Carps, barbels and other cyprinids 6 358 45 955.9 Miscellaneous diadromous fishes 5 192 30 425.1 Shrimps, prawns 4 577 23 205.4 Miscellaneous marine molluscs 582 4 353.5

15
Aquaculture expansion is supported by the governments of both Canada and the USA but considerable public opposition has been generated over environmental concerns. These center around nutrient pollution, escapes, competition with wild fish, disease transmission and seafood safety. This results in part from recent reports highlighting the presence of PCB’s in farmed salmon, although measured contaminants were well within guidelines established by food safety agencies in the USA, Canada and the United Kingdom (Santerre, 2004; Health Canada, 2004; Department of Fisheries and Oceans, 2004; Hites et al., 2004). There is considerable misinformation being circulated regarding aquaculture, its environmental effects, and the health risks of consuming cultured products. Indeed, shellfish aquaculture is arguably the most benign form of animal agriculture (Shumway et al., 2003). Aquaculture industry organizations and governments in both countries are seeking to educate consumers about sustainable aquaculture, the need for aquaculture development to meet future seafood needs and provide for food security, the myriad health benefits of consuming fish high in omega three fatty acids, and the economic benefits to communities and the region. The regulation of aquaculture products in the marketplace in North America is a multi-agency responsibility which includes local and federal components. In the USA the lead agency is the federal Food and Drug Administration while in Canada the federal Canadian Food Inspection Agency has primary responsibility. Import and export of live products is handled by the US Fish and Wildlife Service and the Canada Customs and Revenue Agency. Labeling requirements vary slightly between the USA and Canada but the primary information required is the same. This includes product description using approved names, form, quantity or weight, date packaged or shelf life information, quality designations, and information on any additives (Health Canada, 2005). In addition, if products have been previously frozen or irradiated this must be stated on the label. These labeling requirements are designed to protect consumer health and allow purchasers to be fully knowledgeable about their purchase. Recent legislation in the USA also requires country of origin labeling. Aquaculture production in North America contributes significantly to local economies in regions of the USA and Canada characterized by low levels of economic development and high rates of unemployment. In the southeastern USA, marginally profitable agricultural land coupled with available water, and soils suitable for pond construction combined to provide the foundation for development of the channel catfish industry. The US$480 million in farm gate sales in 2004 generated an economic impact of billions of dollars through production, processing, feed manufacture, and associated goods and services. From 1995 through 2002 the number of processors alone has ranged from 19 to 26 (Tucker et al., 2004). Localized impacts can be highly significant. For example, catfish farming in Chicot County, Arkansas, generates a total economic impact of US$359 million, providing US$20 million in tax revenues and 2 534 jobs, accounting for 46 percent of total employment in the county (Kaliba and Engle, 2004). In Canada, Atlantic salmon aquaculture accounts for more than 90 percent of the total value of Canadian production and has developed in British Columbia and New Brunswick, provinces where the resource extractive industries of timber harvesting and commercial fishing have declined significantly (Alain, 2004). In British Columbia for example, salmon farming creates 1 800 direct year-round full time jobs and over 2 000 indirect jobs. Ninety percent of salmon farming employment is in rural areas and the total economic activity attributed to the farmed salmon sector is worth US$523 million. Given that more than 85 percent of aquaculture production is exported, the value of this sector in generating outside revenue is amplified. 2. AQUACULTURE PRODUCTION, SPECIES AND VALUES Aquaculture has dramatically expanded in North America in the last decade primarily as a result of intensification of production of channel catfish culture and net pen culture of Atlantic salmon. In the last few years, however, Atlantic salmon production has declined slightly as a result of intense international competition and outbreaks of disease on salmon farms in Atlantic Canada (Figure 16). It is expected that the industry will restore lost production in the coming years as improved animal health programs are put in place. Despite strong competition from imported basa fish, American

16
catfish farmers continued to increase production through intensification although revenues declined and approximately 15 percent of market share was lost (Figures 16 and 17). North American aquaculture production of 695 593 tonnes had a value of US$1.16 billion in 2003. Aquaculture is a small component of animal agriculture in the region compared to the total terrestrial mammal (including beef, pork, mutton, and lamb) meat production of 31.3 tonnes valued at US$42.2 billion (USDA, 2004). The US production of cattle and calves in 2003 was 19.2 million tonnes and was valued at US$32.1 billion. The USA produced 12 million tonnes of pork worth US$9.7 billion.
Figure 16. North American aquaculture volume production trends (FAO, 2005a)
0
200000
400000
600000
800000
1000000
1200000
1400000
1600000
1970
1972
1974
1976
1978
1980
1982
1984
1986
1988
1990
1992
1994
1996
1998
2000
2002
Year
Vol
ume
(tonn
es)
TOTAL CanadaUnited States of America
Figure 17. North American aquaculture revenue trend (FAO, 2005a)
0
500000
1000000
1500000
2000000
2500000
3000000
1984
1985
1986
1987
1988
1989
1990
1991
1992
1993
1994
1995
1996
1997
1998
1999
2000
2001
2002
2003
Valu
e (U
S$1
000
TOTAL CanadaUnited States of America

17
The US production of poultry in 2003 was 23.8 million tonnes and was worth US$23.3 billion. The poultry market is dominated by broiler chickens less than 13 weeks old which constitute 84 percent of the poultry produced. Canadian aquaculture production in 2003 was 157 472 tonnes worth US$510.4 million from both fish and shellfish, relatively small compared to production of beef and veal which was 1.2 million tonnes valued at US$4.5 billion (Statistics Canada, 2005b). Canadians produced 1.9 million tonnes of pork and 1.1 million tonnes of poultry meat worth US$1.8 billion. On 20 May 2003, Canada’s beef industry exports plummeted when it was announced that a single breeder cow in northern Alberta had tested positive for bovine spongiform encephalopathy (BSE), more commonly known as mad cow disease. Prior to the ensuing worldwide ban on Canadian beef products, Canada was the third largest exporter of beef in the world (Statistics Canada, 2005c). In 2002, this export market was worth about US$4.1 billion. After the ban, the value of these Canadian exports in June, July and August dropped to virtually zero. Canada exports about 90 percent of beef products to the USA, the world’s largest beef-importing country. As a component of total aquaculture, mariculture constitutes 44.5 percent of production by culture environment, 27 percent by production volume, 37 percent of finfish value, and 84 percent of shellfish value. Total value of mariculture products in 2003 reached US$493 million, with finfish valued at US$332 million and shellfish at US$161 million. Mariculture of shellfish has a long standing tradition while farming of Atlantic salmon is an industry sector that began in the 1980s. Cultured shellfish include oysters, clams and mussels. In the USA there is some small scale farming of alligators in Florida and Louisiana with 2001 production of around 260 000 hides worth US$23.5 million. Farming of ornamental fish is a well established industry in the state of Florida with 178 producers growing more than 700 species that generated farm gate sales of US$47 million in 2003 (Watson and Shireman, 1996; FASS, 2005). Farm gate value of ornamental fish is a small contributor to the national economy but a significant component of Florida’s aquaculture industry. However, when considering multipliers in the tropical fish and aquarium industry this sector generates billions in economic activity. The total area under freshwater aquaculture production in the USA is 129 798 ha almost all of which is embankment catfish ponds. In coastal waters shellfish are farmed on 25 793 ha. The Atlantic salmon farming industry’s net pens would fit into a few square kilometers. Aquaculture of introduced species can be controversial and no new species have been introduced in North America in the last decade, except for the experimental introduction of the oyster Crassostrea ariakensis in the Chesapeake Bay where sterile animals are being evaluated for aquaculture and to restore the oyster fishery. Many currently cultured species are nonindigenous or are being farmed outside their native range. Theses include Atlantic salmon cultured in the Eastern Pacific, the Pacific cupped oyster, Manila clams, Gallo mussels, Kumamoto oysters, Belon oysters, striped bass, hybrid striped bass and catfish in the western USA, and Asian carps throughout North America. In North America both Canada and the USA have significant aquaculture feed manufacturing infrastructure with at least 15 major manufacturing facilities and numerous smaller feed mills. Both countries are major producers of fishmeal, corn, and soybeans as primary feed ingredients. In Canada 35 percent of the volume of capture fisheries biomass is used to make fishmeal, accounting for four percent of the fisheries value. In the USA 92 percent of fishmeal is produced from processed menhaden (Miles and Jacob, 2003). In 2004 the USA imported 70 921 tonnes of fishmeal primarily from Peru, Iceland and Canada. During the same year, 140 983 tonnes of fishmeal was exported with more than half destined for China. The USA exported 50 097 tonnes of fish oil in 2004 (NMFS, 2005b). Fish farms in North America used approximately 820 132 tonnes of fish feed in 2003. In 2004, Canadian growers
18
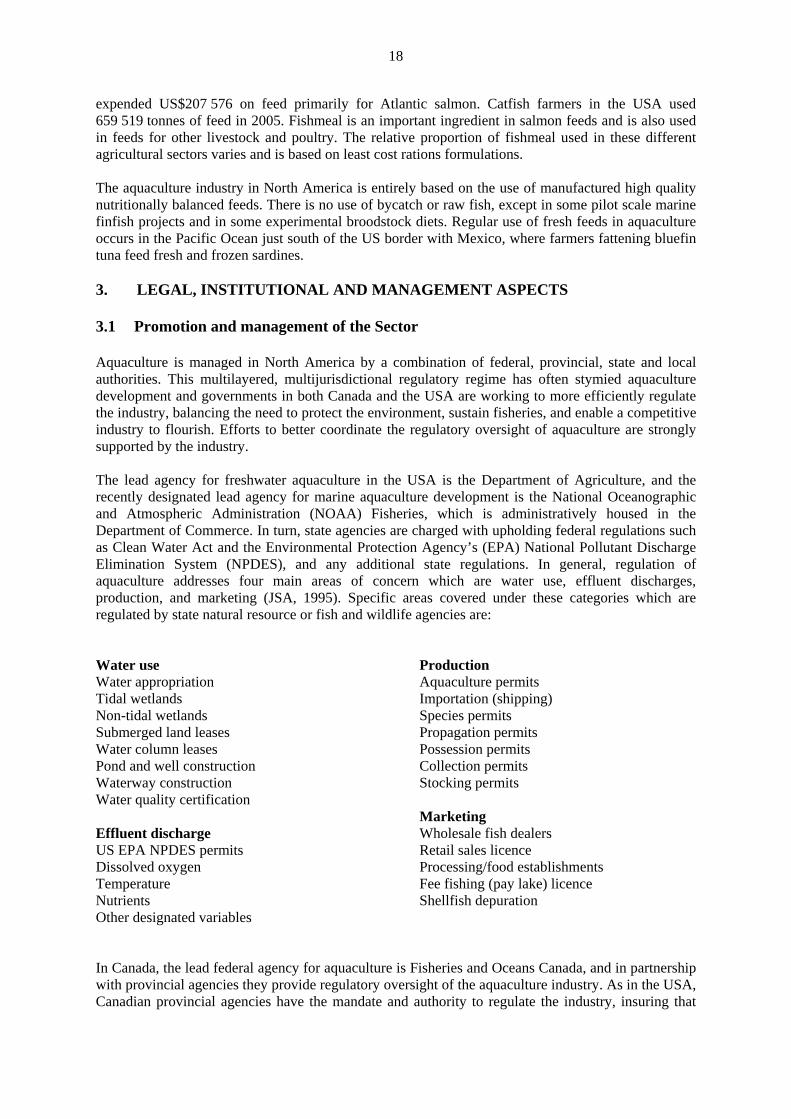
expended US$207 576 on feed primarily for Atlantic salmon. Catfish farmers in the USA used 659 519 tonnes of feed in 2005. Fishmeal is an important ingredient in salmon feeds and is also used in feeds for other livestock and poultry. The relative proportion of fishmeal used in these different agricultural sectors varies and is based on least cost rations formulations. The aquaculture industry in North America is entirely based on the use of manufactured high quality nutritionally balanced feeds. There is no use of bycatch or raw fish, except in some pilot scale marine finfish projects and in some experimental broodstock diets. Regular use of fresh feeds in aquaculture occurs in the Pacific Ocean just south of the US border with Mexico, where farmers fattening bluefin tuna feed fresh and frozen sardines. 3. LEGAL, INSTITUTIONAL AND MANAGEMENT ASPECTS 3.1 Promotion and management of the Sector Aquaculture is managed in North America by a combination of federal, provincial, state and local authorities. This multilayered, multijurisdictional regulatory regime has often stymied aquaculture development and governments in both Canada and the USA are working to more efficiently regulate the industry, balancing the need to protect the environment, sustain fisheries, and enable a competitive industry to flourish. Efforts to better coordinate the regulatory oversight of aquaculture are strongly supported by the industry. The lead agency for freshwater aquaculture in the USA is the Department of Agriculture, and the recently designated lead agency for marine aquaculture development is the National Oceanographic and Atmospheric Administration (NOAA) Fisheries, which is administratively housed in the Department of Commerce. In turn, state agencies are charged with upholding federal regulations such as Clean Water Act and the Environmental Protection Agency’s (EPA) National Pollutant Discharge Elimination System (NPDES), and any additional state regulations. In general, regulation of aquaculture addresses four main areas of concern which are water use, effluent discharges, production, and marketing (JSA, 1995). Specific areas covered under these categories which are regulated by state natural resource or fish and wildlife agencies are: Water use Water appropriation Tidal wetlands Non-tidal wetlands Submerged land leases Water column leases Pond and well construction Waterway construction Water quality certification Effluent discharge US EPA NPDES permits Dissolved oxygen Temperature Nutrients Other designated variables
Production Aquaculture permits Importation (shipping) Species permits Propagation permits Possession permits Collection permits Stocking permits Marketing Wholesale fish dealers Retail sales licence Processing/food establishments Fee fishing (pay lake) licence Shellfish depuration
In Canada, the lead federal agency for aquaculture is Fisheries and Oceans Canada, and in partnership with provincial agencies they provide regulatory oversight of the aquaculture industry. As in the USA, Canadian provincial agencies have the mandate and authority to regulate the industry, insuring that

19
federal, provincial and local ordinances are enforced. At the federal level these include the Fisheries Act, the Fish Inspection Regulations, the Navigable Waters Protection Act, and the Canadian Environmental Assessment Act. Provincial agencies collectively regulate the following sectors of the aquaculture industry:
• Finfish aquaculture facilities • Fish processors and cold-storage facilities • Fish buyers • Fish brokers • Marine plants • Wild oysters
The following are examples of Canadian provincial ministries in British Columbia and their specific responsibilities in aquaculture regulation. Ministry of Agriculture, Fisheries and Food
• Issuance of licences to sell medicated feeds and veterinary drugs • Regulation of medicated feeds and veterinary drugs • Predator control • Preventing escapees • Monitoring operations • Issuance and monitoring of licences • Issuance of waste discharge permits
Ministry of Small Business, Tourism and Culture
• Protection of land that possesses heritage value to British Columbia • Coordination of land use planning processes • Collection and maintenance of coastal resource inventories and mapping
Ministry of Environment, Lands and Parks
• Issuance of permits to trap or kill small mammals when out of season • Control of fish and fish product transportation • Collection of fines • Siting and leasing of land for farm sites
Applied and basic research, education and training are essential to foster continued growth and maintain the competitiveness of the aquaculture sector in North America. Both Canada and the USA have significant research capabilities with research laboratories networked throughout North America with funding from federal, state, and provincial governments. Broad research priorities are determined through strategic planning by funding agencies with industry input and identified in calls for research proposals. In addition to federal priority setting, provinces, states, and individual laboratories engage in strategic planning and priority setting to address local needs. Many research trials involve on farm participatory research and research results are communicated to end users through the extension services of US Department of Agriculture (USDA) Cooperative Extension and Sea Grant, and in Canada by the Department of Fisheries and Oceans (DFO) and provincial researchers, staff and partners. In the United States primary research funding for aquaculture is through the USDA Agricultural Research Service, the Cooperative State Research Education and Extension Service (CSREES), USDA Regional Aquaculture Centers, NOAA Fisheries, and the National Sea Grant Program. NOAA

20
Fisheries is targeting development of offshore marine aquaculture with a new National Marine Aquaculture Initiative and recently submitted to congress The National Offshore Aquaculture Act of 2005 which, among other things, would establish a regulatory framework for offshore aquaculture. The National Sea Grant College Program is a federal and state partnership supporting research, extension and communication to improve management of coastal and marine resources. It comprises a network of 31 programs at land grant universities in coastal and Great Lakes States supporting programs in aquaculture, fisheries and coastal resources. The USDA maintains a network of five Regional Aquaculture Centers in the Northeast, Southeast, North-Central, West, and the Tropical and Sub-Tropical regions. These centers support research and extension programming under the guidance of extension, technical, and industry advisory committees. The USDA CSREES program is a funding partnership with land grant universities throughout the USA. CSREES supports basic and applied research to improve knowledge of the biological, physical and social sciences in support of agriculture, including aquaculture. The partnership includes:
• More than 130 colleges of agriculture • 59 agricultural experiment stations • 57 cooperative extension services • 63 schools of forestry • Tuskegee University, West Virginia State College, and the other 16 historically black colleges
and universities • 27 colleges of veterinary medicine • 42 schools and colleges of family and consumer sciences • 33 Native American land-grant institutions • 17 Alaskan native-serving and Hawaiian native-serving institutions • More than 160 Hispanic-serving institutions
NOAA Fisheries has a network of 28 research laboratories located at the Seafood Technology Lab, and five centers throughout the USA that maintain research programs in support of aquaculture, fisheries and marine resource management. These research centers and the locations of laboratories associated with them are found below.
• Northeast Fisheries Science Center: Woods Hole, MA; Narragansett, RI; Milford, CT; Sandy Hook, NJ (James J. Howard Lab); National Systematics Lab in Washington D.C.
• Southeast Fisheries Science Center: Galveston, TX; Bay St. Louis, MS; Pascagoula, MS; Panama City, FL; Miami, FL; Charleston, SC; Beaufort, NC; Oxford, MD
• National Seafood Inspection Lab: Pascagoula, MS • Alaska Fisheries Science Center: Seattle, WA (Sand Point); Auke Bay, AK; Little Port
Walter, AK; Kodiak, AK • Northwest Fisheries Science Center: Seattle, WA (Montlake); Manchester, WA • Mukilteo, WA; Pasco, WA; Pt. Adams, OR; Newport, OR • Southwest Fisheries Science Center: Honolulu, HI; La Jolla, CA; Pacific Grove, CA;
Tiburon, CA In Canada aquaculture research is supported through the DFO and a network of regional aquaculture research facilities. The Aquaculture Collaborative Research and Development Program (ACRDP) is a DFO initiative to increase the level of collaborative research and development activity between the aquaculture industry and DFO researchers. The key goals of the program are to improve the competitiveness of the Canadian aquaculture industry through collaborative research with industry and to facilitate technology transfer. AquaNet is another federally funded Canadian program that supports collaborative aquaculture research initiatives with university and industry partners.

21
Additional aquaculture research is supported provincially through aquaculture research and development committees, research collaborations, and university partnerships. Research priorities include fish health, nutrition, environmental interactions, new species development, broodstock improvement, biotechnology, shellfish production and finfish enhancement. The five DFO regional research facilities are: Pacific region:
• Pacific Biological Station – Nanaimo, BC • West Vancouver Laboratory - West-Vancouver, BC
Central and Arctic region: • The Freshwater Institute – Winnipeg, Manitoba • Great Lakes Laboratory for Fisheries and Aquatic Sciences – Burlington, Ontario • Experimental Lakes Area – Kenora, Ontario and Parry Sound, Ontario
Laurentian region: • Maurice Lamontagne Institute – Mont-Joli, QC
Gulf region: • Gulf Fisheries Centre – Moncton, NB
Maritimes region: • St. Andrews Biological Station – St. Andrews, NB • Bedford Institute of Oceanography – Darmouth/Halifax, NS
Newfoundland region: • Northwest Atlantic Fisheries Centre, St. John’s, Newfoundland
4. TREND ISSUES AND DEVELOPMENT 4.1 Social impacts and employment and poverty reduction The two primary aquaculture sectors in North America have evolved in parallel fashion with regard to consolidation of a number of small farms over time into fewer and more efficient larger operations. This has occurred with channel catfish and salmon, and follows the model observed across the terrestrial agricultural sector. Even in the organic movement, which once held small farm status as part of its appeal, larger corporations are producing organic crops more efficiently and successfully competing in the marketplace. This evolution towards fewer and more efficient larger operations is driven largely by the need for economies of scale to lower production costs and remain competitive as production increases and aquaculture products make the transition from products to commodities. Women are capable of gainful employment in every sector of the aquaculture industry but are underrepresented. There is a gender imbalance in the Canadian aquaculture work force with about 72 percent male and 28 percent female (Mathews, 2004). The situation in the USA is likely to be similar, but comparable data are not available. 4.2 Aquacultures contribution to food security Aquacultured products are not a significant factor in providing food for the poorer segments of society in North America. In fact, seafood consumption is highest among older more affluent consumers (Johnson, 2004). In general, aquacultured products are some of the more expensive products such as salmon and shrimp, and to a lesser degree catfish. One exception is imported frozen farmed tilapia which is imported at a cost of US$1.19/kg (Harvey, 2005). Most seafood products sell for two–four times their import value. The least expensive frozen tilapia fillet imports from China are imported at US$3.08/kg. With the availability of these inexpensive tilapia imports, virtually all of the tilapia cultured in North America is sold as a live product to attract the premium price necessary to cover production costs.

22
Shrimp imports in the first six months 2005 were priced wholesale at US$6.71/kg (Harvey, 2005), while salmon was US$4.55/kg. Fresh fish from capture fisheries are available at retail ranging in price from US$11.00 to US$19.80/kg, with some specialty fish such as fresh tuna, halibut, sablefish and others commanding premium prices. Consumption trends for seafood products in 2004 were positive with increases in per capita consumption from 7.4 kg in 2003 to 7.5 kg in 2004, an increase of two percent. This is the third year in a row that US per capita seafood consumption has increased. A record 1.9 kg of shrimp were consumed per person in 2004. North Americans are also major consumers of beef and the per capita consumption of beef and veal in 2003 was 42.8 kg in the USA and 31.28 kg in Canada (FAO, 2005b). The per capita consumption of pork was 30.5 kg in the USA and 31.1 kg in Canada, while consumption of chicken broilers was 53.4 kg in the USA and 30.5 kg in Canada. 4.3 Economics and trade North America is one of the leaders worldwide in the development of aquaculture technology and has tremendous potential to be a significant global producer as well. To realize this potential the governments of Canada and the USA need to create a supportive regulatory and permitting structure. The US Commission on Ocean Policy directs NOAA to expand marine aquaculture research, development and technology transfer. The President’s Ocean Action Plan made a commitment to develop the National Offshore Aquaculture Act of 2005 to establish a regulatory structure for offshore aquaculture. This legislation is being considered in the current congress and if passed, would grant the Secretary of Commerce new authority to issue permits for offshore aquaculture in federal ocean waters, while providing environmental safeguards. If this legislation is successful, it will pave the way for significant aquaculture growth and create the opportunity for US aquaculture production to reach the US$5 billion goal in 2025 set by the Department of Commerce’s Aquaculture Policy. A similar situation exists in Canada with the recognition that a revised regulatory structure is necessary for significant new aquaculture development. The Office of the Commissioner for Aquaculture Development was established by the Minister of Fisheries and Oceans in December of 1998 to be the champion for aquaculture within the federal government, and to accelerate aquaculture development. They have developed a 15-year vision that would address short and long-term constraints and impediments that are stifling industry growth. If they are successful, Canadian fish and shellfish growers have great opportunities for significant industry growth. In North America it is likely that new finfish species cultured in net-pens will dominate industry expansion. These include yellowtail, cobia, halibut, flounder and a number of other species in the experimental phase of production. 4.4 Institutions to support responsible development of aquaculture The World Aquaculture Society (WAS) headquarters is in the USA and serves as a professional organization dedicated to aquaculture research, development and information exchange within the global aquaculture community. The WAS is truly an international organization with chapters in the Asian Pacific region, Latin America, USA and Japan. In North America, there are also national, regional, provincial, state and commodity and supplier associations dedicated to supporting the continued growth and expansion of aquaculture in the region. In Canada the principal national groups are the Aquaculture Association of Canada (AAC) and the Canadian Aquaculture Industry Alliance (CAIA) that work on the national level to support aquaculture development. The AAC works specifically to promote the study of aquaculture, foster information exchange and increase public awareness. The CAIA is a national industry association that represents Canadian suppliers, manufacturers and producers. There are 14 additional Canadian provincial and commodity
23
associations that represent the interests of the industry (AAC, 2005). In the USA, the National Aquaculture Association is an industry association promoting the interests of members. In concert with the US Chapter of the WAS, these two organizations provide national leadership. There are more than 150 state, regional and commodity associations in the USA (Aquanic, 2005). Collectively these associations represent their constituents and work to guide policy development supportive of the industry. The total value of agriculture in North America dwarfs the fledgling aquaculture industry which was valued at US$1.16 billion in 2003 (FAO, 2005a). This compares to North American terrestrial agriculture production of US$283.1 billion in 2004. The US share of this total is US$241.2 billion and Canadian agriculture was valued at US$41.9 billion the same year. 5. REFERENCES AAC. 2005. Aquaculture Association of Canada. Provincial Associations. Available at:
<http://www.aquacultureassociation.ca/links.html> Alain, B. 2004. Taking Stock: A profile of Canada’s aquaculture industry. Vista on the Agri-Food
Industry and Farm Community. Agriculture Division, Statistics Canada. Available at: <http://dsp-psd.pwgsc.gc.ca/Collection/Statcan/21-004-X/21-004-XIE2005005.pdf> Aquanic. 2005. Aquaculture Associations. Available at: <http://aquanic.org/publicat/govagen/nal/associat.htm> Department of Fisheries and Oceans (DFO). 2004. Food safety and contaminants in salmon.
Available at: <http://www.dfo-mpo.gc.ca/media/infocus/2004/20040817> Downey, R. 2004. Pacific Coast Shellfish Aquaculture: A Growing Business. Presentation at Pacific
Aquaculture Caucus Fisheries-Aquaculture Ideas Start Here Conference, 14–16 September 2004, Port Angeles, Washington.
Engle, C.R. & Whitis, G. 2000. Costs and returns of catfish production in watershed ponds.
Cooperative Extension Program FSA 9084, University of Arkansas at Pine Bluff, Pine Bluff, Arkansas, USA.
FAO. 2004. The State of World Fisheries and Aquaculture. FAO Fisheries Department. Rome.
153 pp. Available at: <http://www.fao.org/docrep/007/y5600e/y5600e00.htm> FAO. 2005a. FISHSTAT PLUS [online]. Universal software for fishery statistical time series [Version
2005–11–02]. Release date: March 2005. Available at: <http://www.fao.org/fi/statist/FISOFT/FISHPLUS.asp> FAO. 2005b. FAOSTAT. Available at: <http://faostat.fao.org/> FASS. 2004. Florida Agricultural Statistics Service, Aquaculture Census 2003. Available at:
<http://www.nass.usda.gov/Statistics_by_State/Florida/Publications/Aquaculture/index.asp> Forster, J. 2002. One on One. SeaFood Business magazine. ed. Peter Redmayne. Available at:
<http://www.seafoodbusiness.com/archives/02jan/oneonone.htm> Harvey, D.J. 2004. US Department of Agriculture Aquaculture Situation and Outlook. March 2004.
Available at: <http://www.ers.usda.gov/publications/so/view.asp?f=livestock/ldp-aqs/> Harvey, D.J. 2005. US Department of Agriculture Aquaculture Situation and Outlook. October 2004.
Available at: <http://www.ers.usda.gov/publications/so/ view.asp?f=livestock/ldp-aqs/>

24
Health Canada. 2004. Q's & A's on PCBs in salmon and food safety. Available at: <http://www.hc-sc.gc.ca/ahc-asc/media/nr-cp/2004/2004_pcb-bpcbk1_e.html> Health Canada. 2005. Food and Nutrition. Available at: <http://www.hc-sc.gc.ca/food-aliment/cs-ipc/fr-ra/e_pbde_fish.html> Hites, R.A., Foran, J.A., Carpenter, D.O., Hamilton, M.C., Knuth, B.A. & Schwager, S.J. 2004.
Global assessment of organic contaminants in farmed salmon. Science, 303(5655): 226–229. Available at: <http://www.sciencemag.org> and <http://seafood.ucdavis.edu/>
Johnson, H. 2004. Annual Report on the United States Seafood Industry, Twelfth Edition. Howard
M. Johnson & Associates Jacksonville, OR. JSA. 1995. State/Territory Permits And Regulations Impacting The Aquaculture Industry. Prepared
for the Joint Subcommittee on Aquaculture. Contributing authors: Maryland Department of Agriculture, National Association of State Aquaculture Coordinators. Available at: <http://aquanic.org/jsa/> and <http://aquanic.org/publicat/state/md/perprefa.pdf>
Kaliba, A. & Engle, C.R. 2004. The economic impact of the catfish industry on Chicot County,
Arkansas. Journal of Applied Aquaculture, 15(1/2) Matthews, R. 2004. The Canadian AquacultureEmployment Study:Executive Summary. Department
of Anthropology and Sociology, The University of British Columbia, Vancouver, Canada, 13 pp. Available at:
<http://www.aquaculture.ca/English/IndustryProfile/Aquaculture%20Employment%20Study.pdf> Miles, R.D. & Jacob, J. 2003. Fishmeal: Understanding why this feed ingredient is so valuable in
poultry diets. Animal Science Department, Florida Cooperative Extension Service, Institute of Food and Agricultural Sciences, University of Florida. Available at: <http://edis.ifas.ufl.edu>
NOAA (National Oceanic and Atmospheric Administration). 2004. Harvard Graphics: Miscellaneous
Fish Trade Graphics. National Marine Fisheries Service, National Oceanic and Atmospheric Administration. Available at: <http://www.nmfs.noaa.gov/trade/2003ustrade.pdf>
NMFS. 2004. World Fisheries. Available at: <http://www.st.nmfs.gov/st1/fus/fus04/04_world2004.pdf> NMFS. 2005a. US Annual Per Capita Consumption Seafood and Shellfish, Canned Fishery Products
and Certain Fishery Items. Personal communication from the National Marine Fisheries Service, Fisheries Statistics Division, Silver Spring, MD. Available at:
<http://www.noaanews.noaa.gov/stories2005/pdf/seafood-consumption11-09-2005.pdf> NMFS. 2005b. Fish Meal. Personal communication from the National Marine Fisheries Service,
Fisheries Statistics Division, Silver Spring, MD. Available at: <http://www.st.nmfs.gov/st1/market_news/doc76.txt> Price Waterhouse Coopers. 2003. A competitiveness survey of the British Columbia salmon farming
industry. Aquaculture Development Branch, Ministry of Agriculture Food and Fisheries. 24 pp. Available at: <http://www.agf.gov.bc.ca/fisheries/reports/Competitiveness_Survey.pdf>
Santerre, C.R. 2004. Review of Hites. 2004. Global Assessment of Organic Contaminants in Farmed
Salmon. Purdue News. 8 January 2004.

25
Shumway, S.A., Davis, C., Downey, R., Karney, R., Kraueter, J., Parsons, R. Rheault, J.R. & Wilkfors, G. 2003. Shellfish aquaculture—in praise of sustainable economies and environments. World Aquaculture 34(4).
Statistics Canada. 2005a. Canadian Agriculture Statistics – Provincial Aquaculture. Available at:
<http://www.statcan.ca/english/freepub/23-222-XIE/23-222-XIE2004000.pdf> Statistics Canada. 2005b. Canadian Agriculture at a glance. Tables by subject. Livestock. Available
at: <http://www40.statcan.ca/l01/ind01/l3_920_2553. htm?hili_prim50> Statistics Canada. 2005c. Beef Statistics. Statistics Canada. 2005d. Aquaculture Summary Table. Available at:
<http://www40.statcan.ca/l01/cst01/prim56a.htm> Tucker, C., Avery, J., Engle, C. & Goodwin, A. 2004. Industry Profile: Pond-Raised Channel
Catfish: A review developed for the National Risk Management Feasibility Program for Aquaculture. Mississippi State University, Agreement No. RMA 01-IE-0831-127. 92 pp. Available at: <http://www.agecon.msstate.edu/Aquaculture/pubs/Catfish_Industry_Profile.pdf>
UNECE. 2005. United Nations Economic Commission for Europe. Trends in North America and
Europe. Available at: <http://www.unece.org/stats/trends2005/atlas/Economy.pdf> US Census Bureau. 2005. Available at: <http://factfinder.census.gov/home/saff/main.html> USDA, NASS 1998. Census of Aquaculture – 1997. Available at:
<http://www.nass.usda.gov/census/census97/aquaculture/general.htm> USDA, NASS. 2004. USDA Census of Agriculture – 2002. Available at:
<http://www.nass.usda.gov/Census_of_Agriculture/index.asp> USDA, NASS. 2005. National Agricultural Statistics Service Catfish Production. Available at:
http://usda.mannlib.cornell.edu/reports/nassr/other/pcf-bbc/ http://usda.mannlib.cornell.edu/reports/erssor/livestock/ldp-aqs/2004/aqs20.pdf USDA. 2006. Catfish Feed Deliveries. National Agricultural Statistics Service, Agricultural Statistics
Board. Available at: <http://usda.mannlib.cornell.edu/reports/nassr/other/pcf-bbf/2006/> US DOC. 2000. US Department of Commerce Aquaculture Policy. Available at:
<http://www.nmfs.noaa.gov/trade/DOCAQpolicy.htm#Top> Watson, C.E. & Shireman, J.V. 1996. Production of Ornamental Aquarium Fish. Document # FA-
35, Department of Fisheries and Aquatic Sciences, Florida Cooperative Extension Service, Institute of Food and Agricultural Sciences, University of Florida. 4 pp. Available at: <http://www.aces.edu/dept/fisheries/education/ras/publications/Update/FL%20ornamental%20production.pdf>
World Bank. 2005. Economic statistics. Available at: <http://siteresources.worldbank.org/DATASTATISTICS/Resources/GDP.pdf> <http://siteresources.worldbank.org/DATASTATISTICS/Resources/GNI.pdf>

TR/D/A0636E/1/7.06/1300