regional resource assessments - massecon.com · *many prof/tech/creative/it services companies are...
TRANSCRIPT
REGIONAL RESOURCE ASSESSMENTS
Southeast Region
Massachusetts Alliance for Economic DevelopmentMassachusetts Alliance for Economic Development
April 2008
Moran, Stahl & BoyerConnecting Companies With CommunitiesTM
E.M. Pemrick & Company

Regional Resource Assessments & Market OverviewsRegional Resource Assessments & Market Overviewsmassachusetts alliance for economic development
Topics for Discussionp
• Economic development resource assessment process
• Target industries by region
• Life cycles of businesses and impact on resource needs
• Regional assessment
Q lit f lif t f li i d h i• Quality of life: cost of living and housing
• University R&D that supports target industries
• College and university enrollment as a labor sourceCollege and university enrollment as a labor source
• Transportation resources
• Real estate and utilities
1
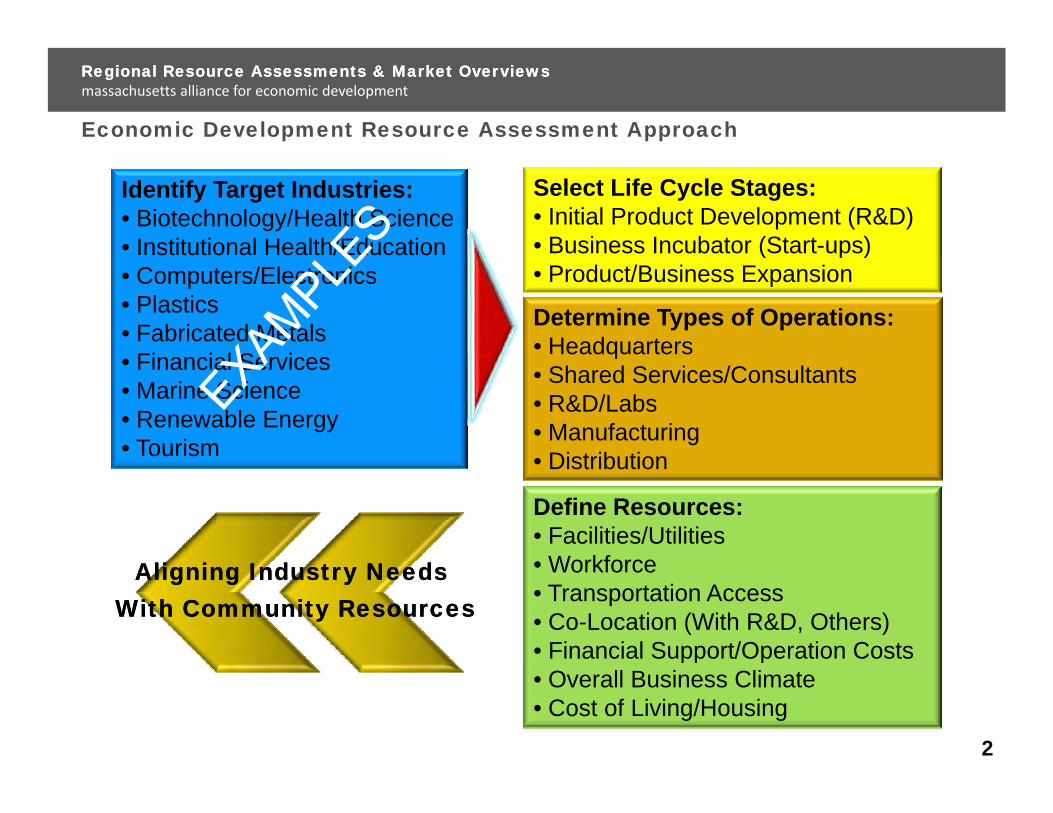
Economic Development Resource Assessment Approach
Regional Resource Assessments & Market OverviewsRegional Resource Assessments & Market Overviewsmassachusetts alliance for economic development
Identify Target Industries: • Biotechnology/Health Science• Institutional Health/Education
Select Life Cycle Stages:• Initial Product Development (R&D)• Business Incubator (Start-ups)Institutional Health/Education
• Computers/Electronics• Plastics• Fabricated Metals
Fi i l S i
Determine Types of Operations:• Headquarters
Business Incubator (Start ups)• Product/Business Expansion
• Financial Services• Marine Science• Renewable Energy• Tourism
q• Shared Services/Consultants• R&D/Labs • Manufacturing• Distribution• Distribution
Define Resources:• Facilities/Utilities
Workforce• Workforce • Transportation Access• Co-Location (With R&D, Others)• Financial Support/Operation Costs
Aligning Industry Needs Aligning Industry Needs With Community ResourcesWith Community Resources
pp p• Overall Business Climate• Cost of Living/Housing
2

Target Industry Overview by Region
Regional Resource Assessments & Market OverviewsRegional Resource Assessments & Market Overviewsmassachusetts alliance for economic development
Industry/Segment Berkshire WesternCentral
No.Central
So.Metro West
Merrimack Valley
Greater Boston Southeast
Cape & Islands
• Biotech/Pharmaceuticals
• Medical Equipment
• Marine Science
• Computers/Electronics
• Food Processing
• Fabricated Metals• Fabricated Metals
• Plastics (Resin/Parts/Products)
• Renewable/Alternative Energy
• Aerospace/Defense/Security
• Institutional Healthcare Services
• Institutional Education Services
• University R&D
• Financial ServicesFinancial Services
• Prof/Tech/Creative/IT Services*
• Transportation/Distribution
• Hospitality/Rec./Culture/Tourism
• Mgmt. of Companies/HQ
State Target Industry
*Many Prof/Tech/Creative/IT Services companies are very small and operated from homes.3
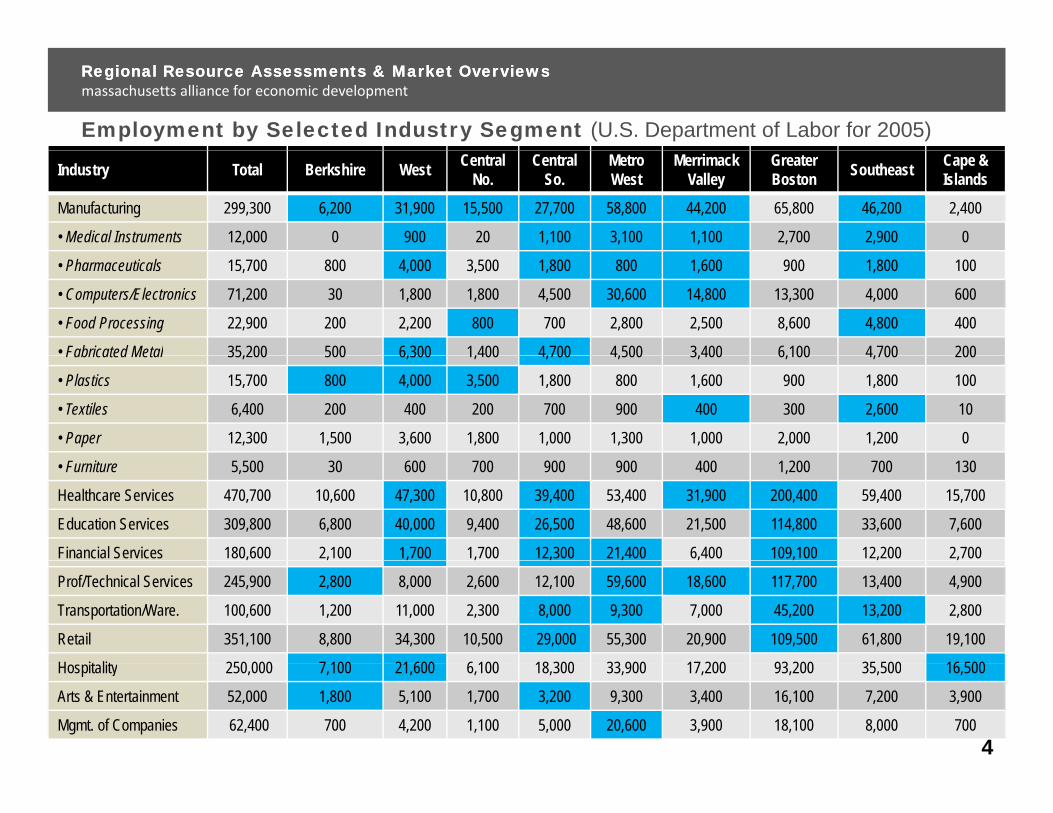
Employment by Selected Industry Segment (U.S. Department of Labor for 2005)
Regional Resource Assessments & Market OverviewsRegional Resource Assessments & Market Overviewsmassachusetts alliance for economic development
Industry Total Berkshire West Central No.
Central So.
Metro West
Merrimack Valley
Greater Boston Southeast Cape &
Islands
Manufacturing 299,300 6,200 31,900 15,500 27,700 58,800 44,200 65,800 46,200 2,400
• Medical Instruments 12,000 0 900 20 1,100 3,100 1,100 2,700 2,900 0
• Pharmaceuticals 15,700 800 4,000 3,500 1,800 800 1,600 900 1,800 100
• Computers/Electronics 71,200 30 1,800 1,800 4,500 30,600 14,800 13,300 4,000 600
• Food Processing 22,900 200 2,200 800 700 2,800 2,500 8,600 4,800 400
• Fabricated Metal 35 200 500 6 300 1 400 4 700 4 500 3 400 6 100 4 700 200Fabricated Metal 35,200 500 6,300 1,400 4,700 4,500 3,400 6,100 4,700 200
• Plastics 15,700 800 4,000 3,500 1,800 800 1,600 900 1,800 100
• Textiles 6,400 200 400 200 700 900 400 300 2,600 10
• Paper 12,300 1,500 3,600 1,800 1,000 1,300 1,000 2,000 1,200 0
• Furniture 5,500 30 600 700 900 900 400 1,200 700 130
Healthcare Services 470,700 10,600 47,300 10,800 39,400 53,400 31,900 200,400 59,400 15,700
Education Services 309,800 6,800 40,000 9,400 26,500 48,600 21,500 114,800 33,600 7,600
Financial Services 180,600 2,100 1,700 1,700 12,300 21,400 6,400 109,100 12,200 2,700
Prof/Technical Services 245,900 2,800 8,000 2,600 12,100 59,600 18,600 117,700 13,400 4,900
Transportation/Ware. 100,600 1,200 11,000 2,300 8,000 9,300 7,000 45,200 13,200 2,800
Retail 351,100 8,800 34,300 10,500 29,000 55,300 20,900 109,500 61,800 19,100
H it lit 250 000 7 100 21 600 6 100 18 300 33 900 17 200 93 200 35 500 16 500Hospitality 250,000 7,100 21,600 6,100 18,300 33,900 17,200 93,200 35,500 16,500
Arts & Entertainment 52,000 1,800 5,100 1,700 3,200 9,300 3,400 16,100 7,200 3,900
Mgmt. of Companies 62,400 700 4,200 1,100 5,000 20,600 3,900 18,100 8,000 7004
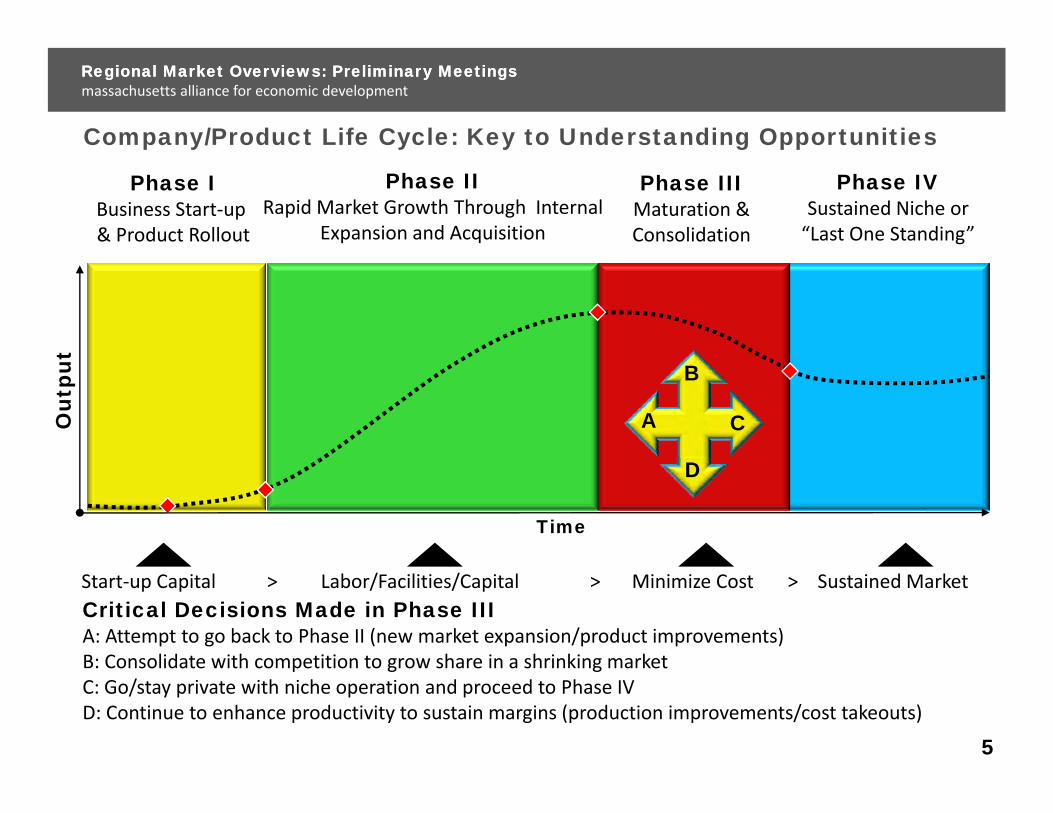
Company/Product Life Cycle: Key to Understanding Opportunities
Regional Market Overviews: Preliminary MeetingsRegional Market Overviews: Preliminary Meetingsmassachusetts alliance for economic development
Phase IIIMaturation &Consolidation
Phase IIRapid Market Growth Through Internal
Expansion and Acquisition
Phase IBusiness Start‐up & Product Rollout
Phase IVSustained Niche or“Last One Standing”
tO
utpu
t
A
B
C
Time
D
Start‐up Capital > Labor/Facilities/Capital > Minimize Cost > Sustained MarketCritical Decisions Made in Phase IIIA: Attempt to go back to Phase II (new market expansion/product improvements)B: Consolidate with competition to grow share in a shrinking marketB: Consolidate with competition to grow share in a shrinking marketC: Go/stay private with niche operation and proceed to Phase IVD: Continue to enhance productivity to sustain margins (production improvements/cost takeouts)
5
Regional Resource Assessments & Market OverviewsRegional Resource Assessments & Market Overviewsmassachusetts alliance for economic development
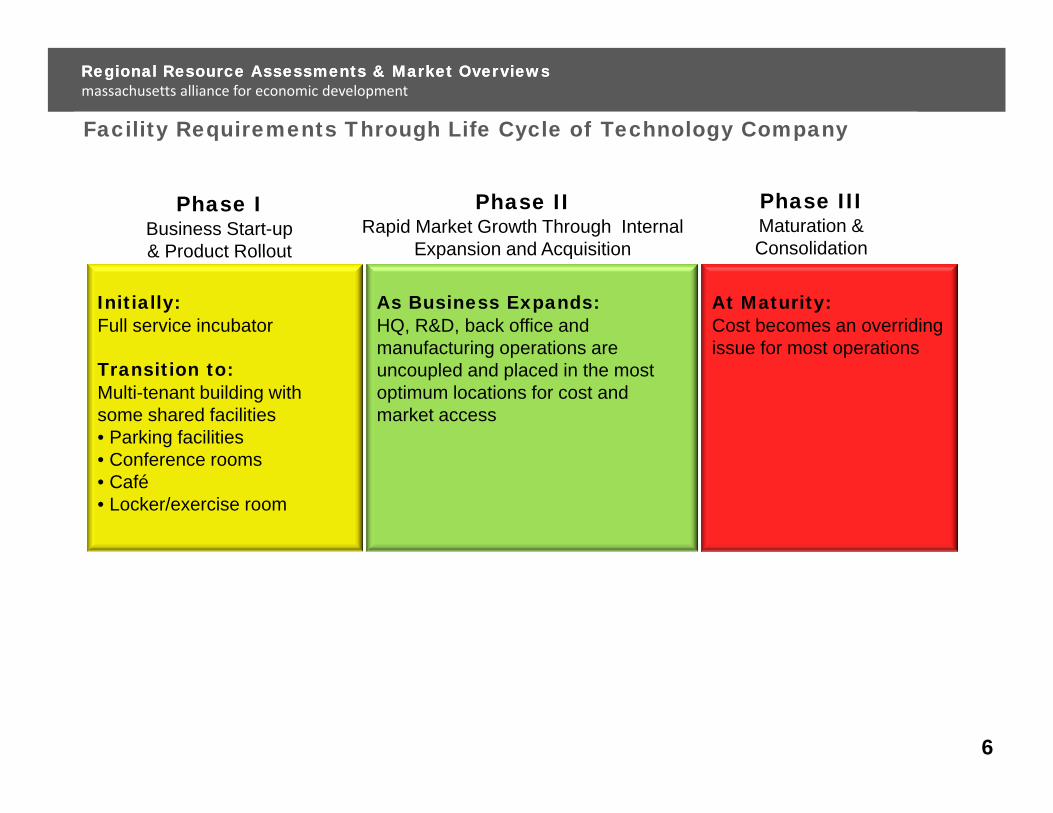
Facility Requirements Through Life Cycle of Technology Company
Phase IIIMaturation &Consolidation
Phase IIRapid Market Growth Through Internal
Expansion and Acquisition
Phase IBusiness Start-up & Product Rollout
Initially: Full service incubator
At Maturity:Cost becomes an overriding issue for most operations
As Business Expands:HQ, R&D, back office and manufacturing operations are
ConsolidationExpansion and Acquisition& Product Rollout
Transition to:Multi-tenant building with some shared facilities• Parking facilities• Conference rooms
pg puncoupled and placed in the most optimum locations for cost and market access
• Conference rooms• Café• Locker/exercise room
6
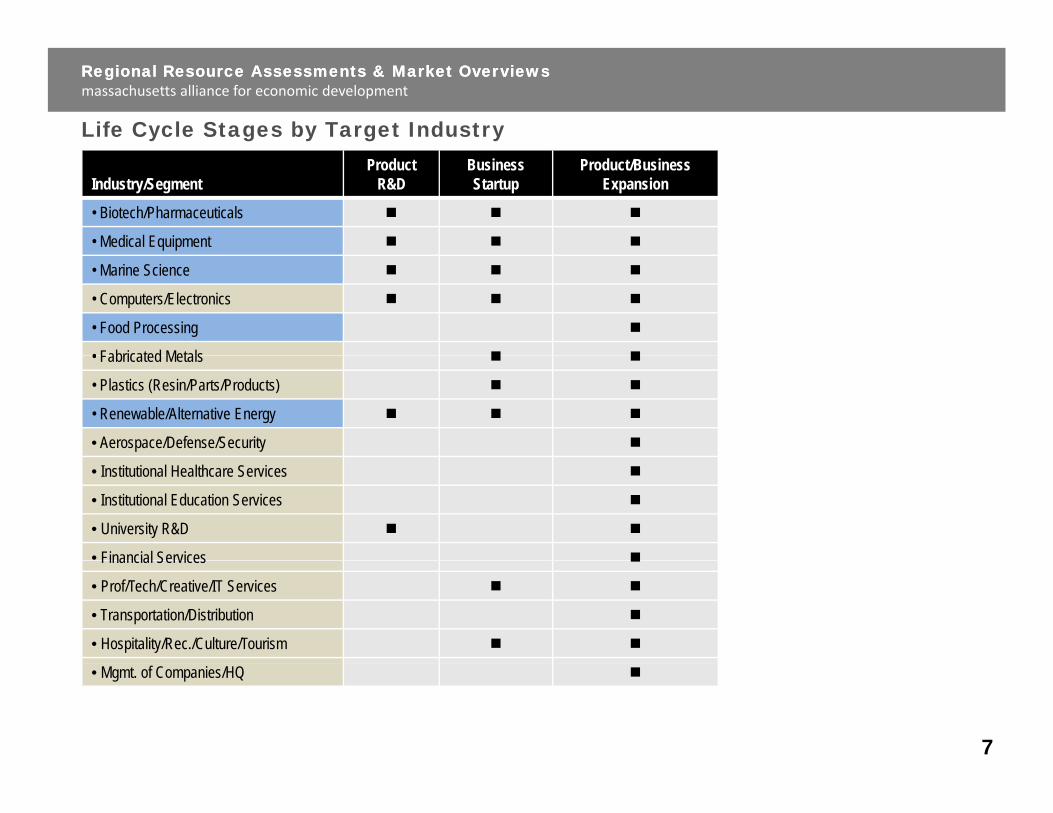
Life Cycle Stages by Target Industry
Regional Resource Assessments & Market OverviewsRegional Resource Assessments & Market Overviewsmassachusetts alliance for economic development
Industry/SegmentProduct
R&DBusiness Startup
Product/Business Expansion
• Biotech/Pharmaceuticals
• Medical Equipment
• Marine Science
• Computers/Electronics
• Food Processing
• Fabricated Metals• Fabricated Metals
• Plastics (Resin/Parts/Products)
• Renewable/Alternative Energy
• Aerospace/Defense/Security
• Institutional Healthcare Services
• Institutional Education Services
• University R&D
• Financial ServicesFinancial Services
• Prof/Tech/Creative/IT Services
• Transportation/Distribution
• Hospitality/Rec./Culture/Tourism
• Mgmt. of Companies/HQ
7
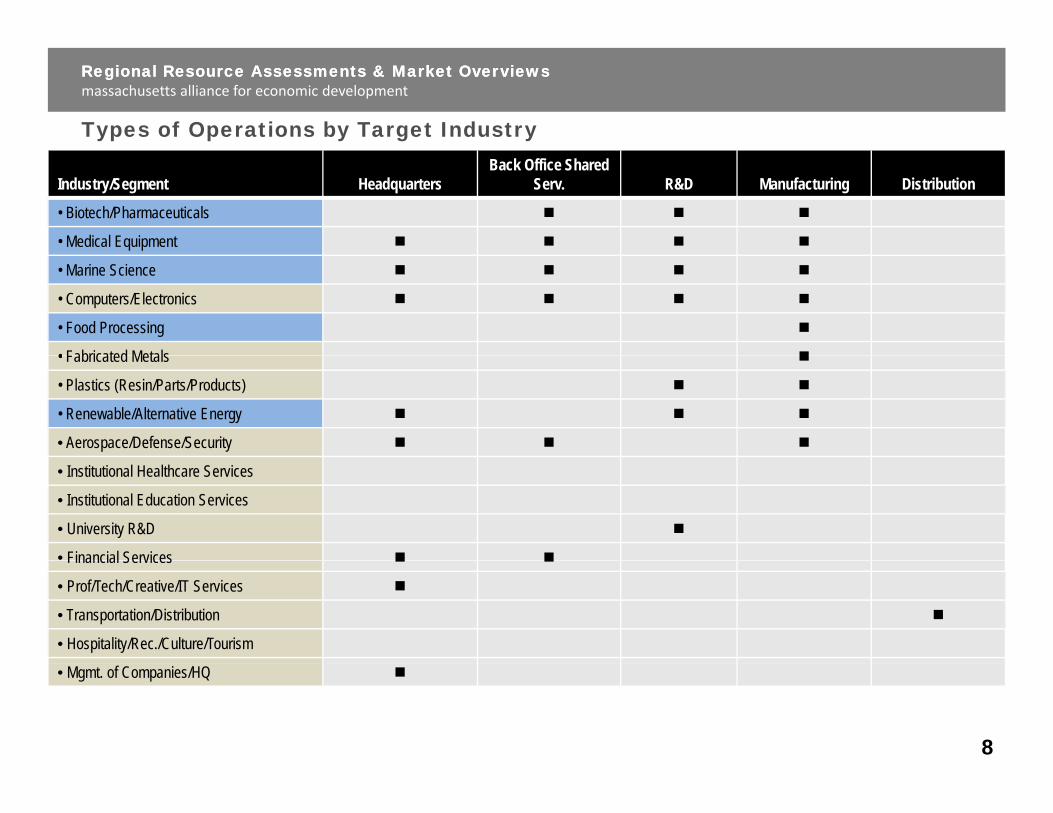
Types of Operations by Target Industry
Regional Resource Assessments & Market OverviewsRegional Resource Assessments & Market Overviewsmassachusetts alliance for economic development
Industry/Segment HeadquartersBack Office Shared
Serv. R&D Manufacturing Distribution
• Biotech/Pharmaceuticals
• Medical Equipment
• Marine Science
• Computers/Electronics
• Food Processing
• Fabricated Metals• Fabricated Metals
• Plastics (Resin/Parts/Products)
• Renewable/Alternative Energy
• Aerospace/Defense/Security
• Institutional Healthcare Services
• Institutional Education Services
• University R&D
• Financial ServicesFinancial Services
• Prof/Tech/Creative/IT Services
• Transportation/Distribution
• Hospitality/Rec./Culture/Tourism
• Mgmt. of Companies/HQ
8
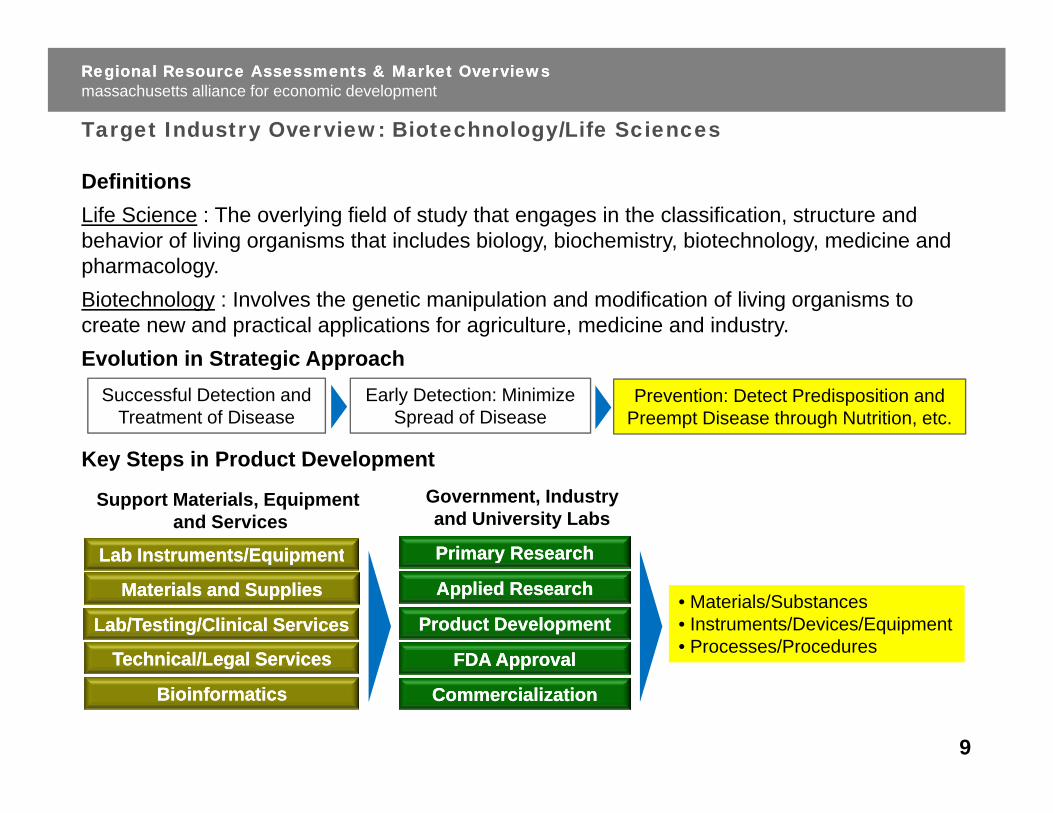
Target Industry Overview: Biotechnology/Life Sciences
Regional Resource Assessments & Market OverviewsRegional Resource Assessments & Market Overviewsmassachusetts alliance for economic development
DefinitionsLife Science : The overlying field of study that engages in the classification, structure and behavior of living organisms that includes biology, biochemistry, biotechnology, medicine and pharmacology.Biotechnology : Involves the genetic manipulation and modification of living organisms to create new and practical applications for agriculture, medicine and industry.Evolution in Strategic ApproachEvolution in Strategic Approach
Key Steps in Product Development
Prevention: Detect Predisposition and Preempt Disease through Nutrition, etc.
Early Detection: Minimize Spread of Disease
Successful Detection and Treatment of Disease
Key Steps in Product Development
Primary Research Primary Research
Support Materials, Equipment and Services
Lab Instruments/EquipmentLab Instruments/Equipment
Government, Industryand University Labs
yy
Applied ResearchApplied Research
Product DevelopmentProduct Development
FDA ApprovalFDA Approval
Lab Instruments/EquipmentLab Instruments/Equipment
Materials and SuppliesMaterials and Supplies
Lab/Testing/Clinical ServicesLab/Testing/Clinical Services
Technical/Legal ServicesTechnical/Legal Services
• Materials/Substances• Instruments/Devices/Equipment• Processes/Procedures
FDA ApprovalFDA Approval
CommercializationCommercialization
Technical/Legal ServicesTechnical/Legal Services
BioinformaticsBioinformatics
9
Target Industry Overview: Pharmaceuticals/Medicines (NAICS 3254)
Regional Resource Assessments & Market OverviewsRegional Resource Assessments & Market Overviewsmassachusetts alliance for economic development
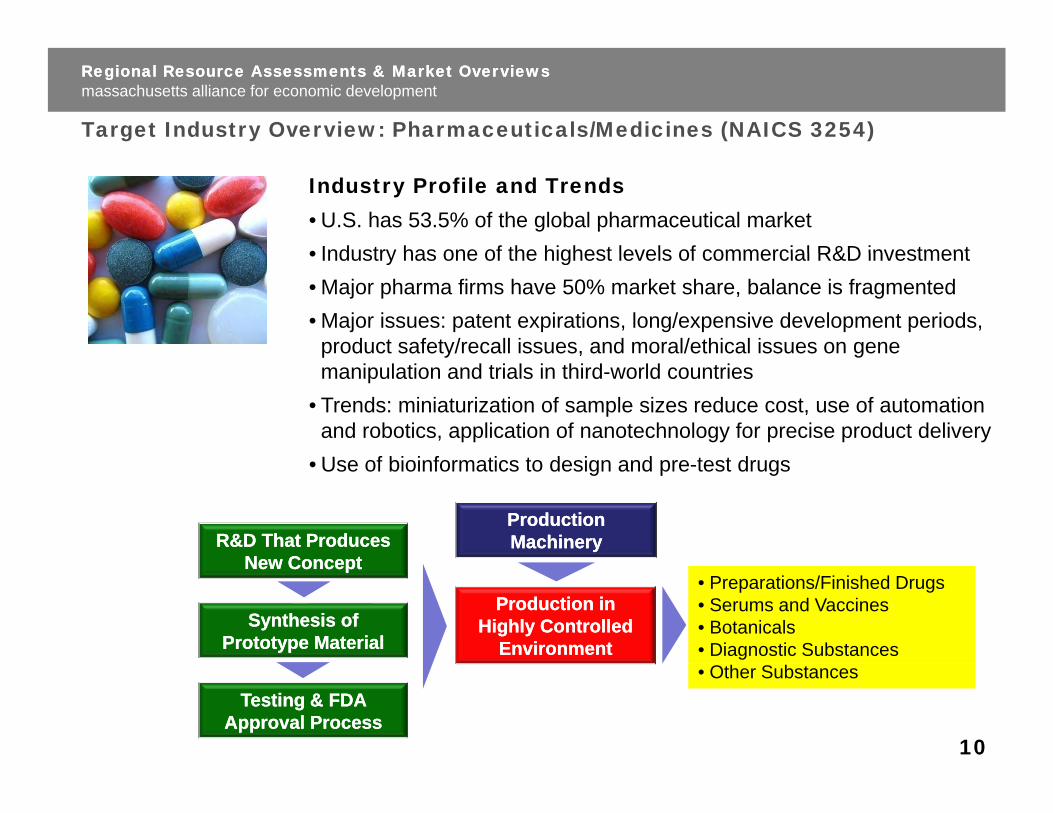
Industry Profile and Trends• U.S. has 53.5% of the global pharmaceutical market• Industry has one of the highest levels of commercial R&D investment• Industry has one of the highest levels of commercial R&D investment• Major pharma firms have 50% market share, balance is fragmented• Major issues: patent expirations, long/expensive development periods,
product safety/recall issues, and moral/ethical issues on gene p y , gmanipulation and trials in third-world countries
• Trends: miniaturization of sample sizes reduce cost, use of automation and robotics, application of nanotechnology for precise product deliveryU f bi i f ti t d i d t t d• Use of bioinformatics to design and pre-test drugs
R&D That Produces R&D That Produces New ConceptNew Concept
Production Production MachineryMachinery
Production in Production in Highly Controlled Highly Controlled
EnvironmentEnvironment
New ConceptNew Concept
Synthesis of Synthesis of Prototype MaterialPrototype Material
• Preparations/Finished Drugs• Serums and Vaccines• Botanicals • Diagnostic Substances
Testing & FDA Testing & FDA Approval ProcessApproval Process
• Other Substances
10
Target Industry Overview: Pharmaceuticals/Medicines (NAICS 3254)
Regional Resource Assessments & Market OverviewsRegional Resource Assessments & Market Overviewsmassachusetts alliance for economic development
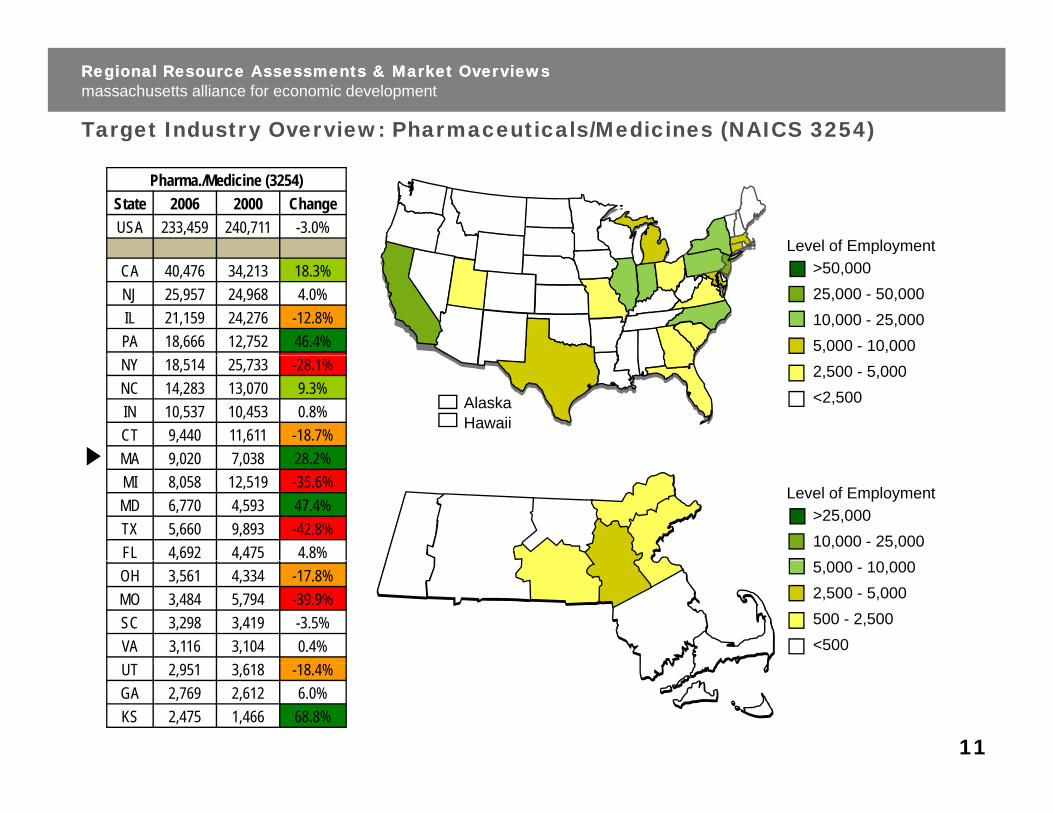
Pharma./Medicine (3254)State 2006 2000 ChangeUSA 233,459 240,711 -3.0%
Level of EmploymentCA 40,476 34,213 18.3%NJ 25,957 24,968 4.0%IL 21,159 24,276 -12.8%PA 18,666 12,752 46.4%
>50,00025,000 - 50,000 10,000 - 25,0005,000 - 10,000
p y
NY 18,514 25,733 -28.1%NC 14,283 13,070 9.3%IN 10,537 10,453 0.8%CT 9,440 11,611 -18.7%MA 9 020 7 038 28 2%
2,500 - 5,000<2,500Alaska
Hawaii
MA 9,020 7,038 28.2%MI 8,058 12,519 -35.6%MD 6,770 4,593 47.4%TX 5,660 9,893 -42.8%FL 4,692 4,475 4.8%
B
F
G
AD >25,000
10,000 - 25,000
Level of Employment
OH 3,561 4,334 -17.8%MO 3,484 5,794 -39.9%SC 3,298 3,419 -3.5%VA 3,116 3,104 0.4% J
I
FC E 5,000 - 10,0002,500 - 5,000500 - 2,500<500
UT 2,951 3,618 -18.4%GA 2,769 2,612 6.0%KS 2,475 1,466 68.8%
11
Target Industry Overview: Medical Equipment and Supplies (NAICS 3391)
Regional Resource Assessments & Market OverviewsRegional Resource Assessments & Market Overviewsmassachusetts alliance for economic development
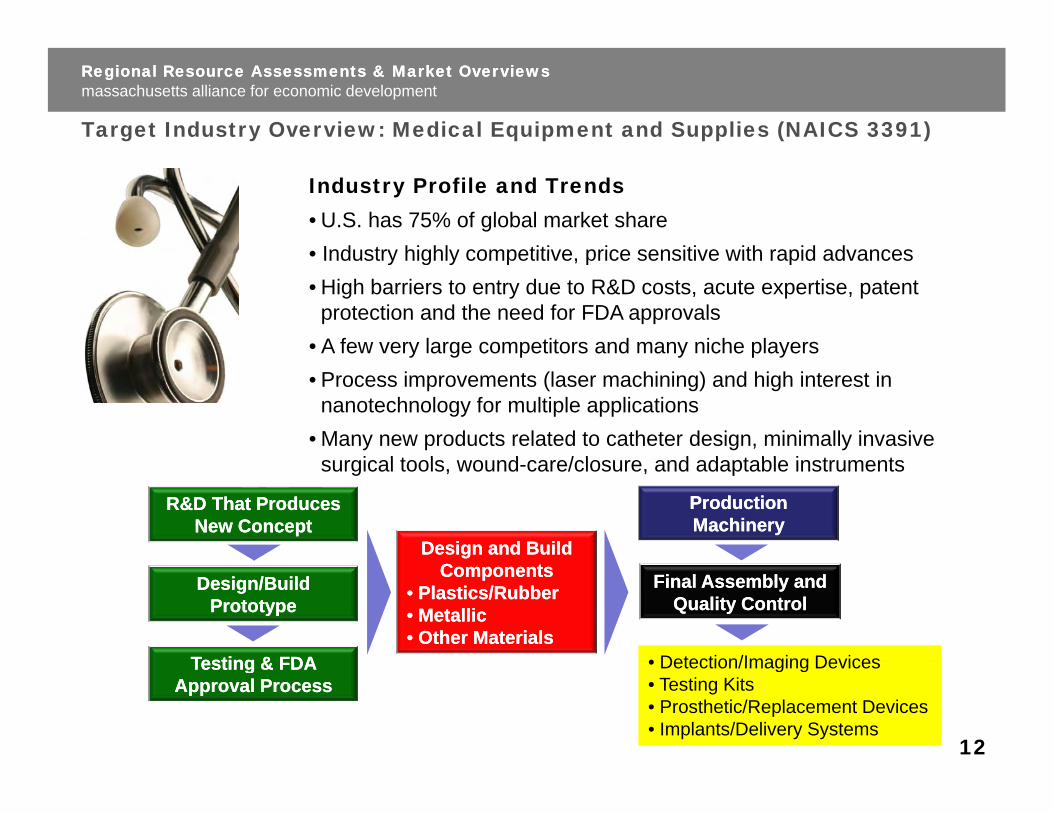
Industry Profile and Trends• U.S. has 75% of global market share• Industry highly competitive price sensitive with rapid advances• Industry highly competitive, price sensitive with rapid advances• High barriers to entry due to R&D costs, acute expertise, patent
protection and the need for FDA approvals• A few very large competitors and many niche playersy g p y p y• Process improvements (laser machining) and high interest in
nanotechnology for multiple applications• Many new products related to catheter design, minimally invasive
i l t l d / l d d t bl i t tsurgical tools, wound-care/closure, and adaptable instruments
Design and Build Design and Build
R&D That Produces R&D That Produces New ConceptNew Concept
Production Production MachineryMachinery
ComponentsComponents•• Plastics/RubberPlastics/Rubber•• MetallicMetallic•• Other MaterialsOther Materials
Testing & FDATesting & FDA
Final Assembly and Final Assembly and Quality ControlQuality Control
Design/Build Design/Build PrototypePrototype
• Detection/Imaging DevicesTesting & FDA Testing & FDA Approval ProcessApproval Process
• Detection/Imaging Devices• Testing Kits• Prosthetic/Replacement Devices• Implants/Delivery Systems
12
Target Industry Overview: Medical Instruments and Supplies (NAICS 3391)
Regional Resource Assessments & Market OverviewsRegional Resource Assessments & Market Overviewsmassachusetts alliance for economic development
Level of Employment
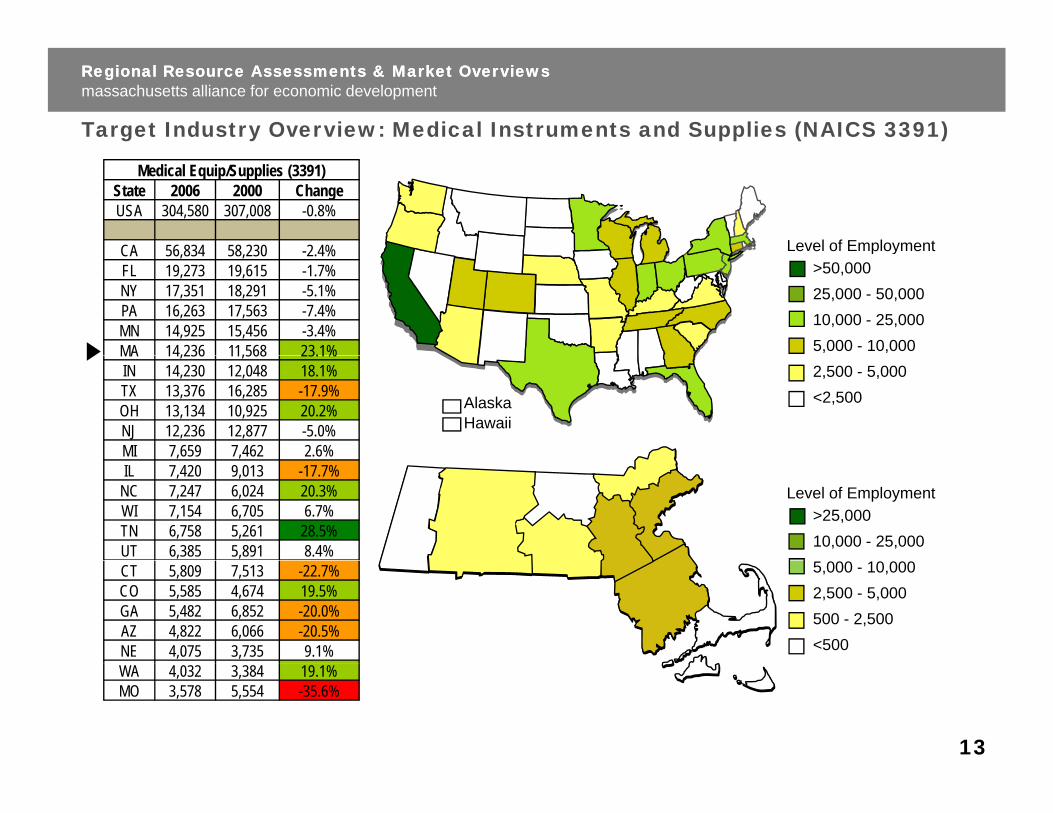
Medical Equip/Supplies (3391)State 2006 2000 ChangeUSA 304,580 307,008 -0.8%
CA 56 834 58 230 -2 4%>50,00025,000 - 50,000 10,000 - 25,0005,000 - 10,000
p yCA 56,834 58,230 2.4%FL 19,273 19,615 -1.7%NY 17,351 18,291 -5.1%PA 16,263 17,563 -7.4%MN 14,925 15,456 -3.4%MA 14,236 11,568 23.1%
2,500 - 5,000<2,500Alaska
Hawaii
MA 14,236 11,568 23.1%IN 14,230 12,048 18.1%TX 13,376 16,285 -17.9%OH 13,134 10,925 20.2%NJ 12,236 12,877 -5.0%MI 7,659 7,462 2.6%, ,IL 7,420 9,013 -17.7%
NC 7,247 6,024 20.3%WI 7,154 6,705 6.7%TN 6,758 5,261 28.5%UT 6,385 5,891 8.4%
B
F
G
AC
D
E>25,00010,000 - 25,000
Level of Employment
CT 5,809 7,513 -22.7%CO 5,585 4,674 19.5%GA 5,482 6,852 -20.0%AZ 4,822 6,066 -20.5%NE 4,075 3,735 9.1%
JI
5,000 - 10,0002,500 - 5,000500 - 2,500<500
WA 4,032 3,384 19.1%MO 3,578 5,554 -35.6%
13
Regional Resource AssessmentRegional Resource Assessment Southeast RegionSoutheast Regionmassachusettsmassachusetts alliance for economic developmentalliance for economic development
Southeast RegionSoutheast Region
14
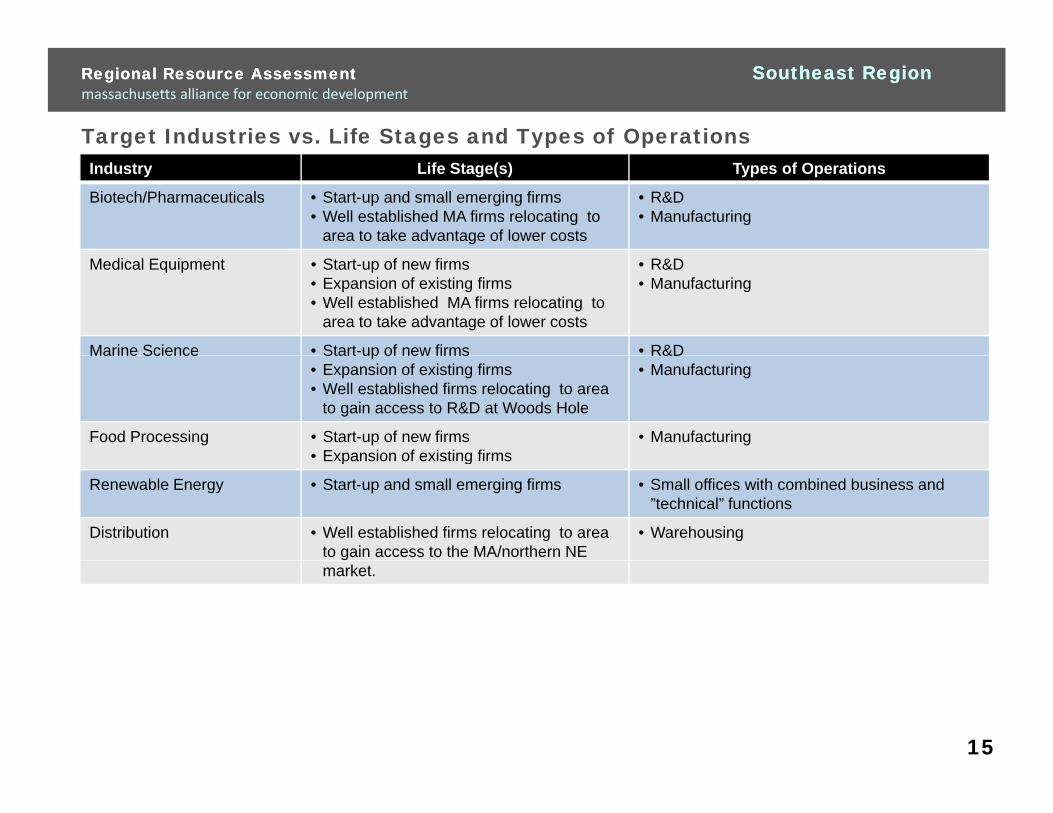
Target Industries vs. Life Stages and Types of Operations
Regional Resource AssessmentRegional Resource Assessment Southeast RegionSoutheast Regionmassachusetts alliance for economic development
Industry Life Stage(s) Types of Operations
Biotech/Pharmaceuticals • Start-up and small emerging firms• Well established MA firms relocating to
area to take advantage of lower costs
• R&D• Manufacturing
Medical Equipment • Start-up of new firms• Expansion of existing firms• Well established MA firms relocating to
area to take advantage of lower costs
• R&D• Manufacturing
Marine Science • Start-up of new firms • R&DMarine Science Start up of new firms• Expansion of existing firms• Well established firms relocating to area
to gain access to R&D at Woods Hole
R&D• Manufacturing
Food Processing • Start-up of new firms• Expansion of existing firms
• ManufacturingExpansion of existing firms
Renewable Energy • Start-up and small emerging firms • Small offices with combined business and ”technical” functions
Distribution • Well established firms relocating to area to gain access to the MA/northern NE
• Warehousing
market.
15
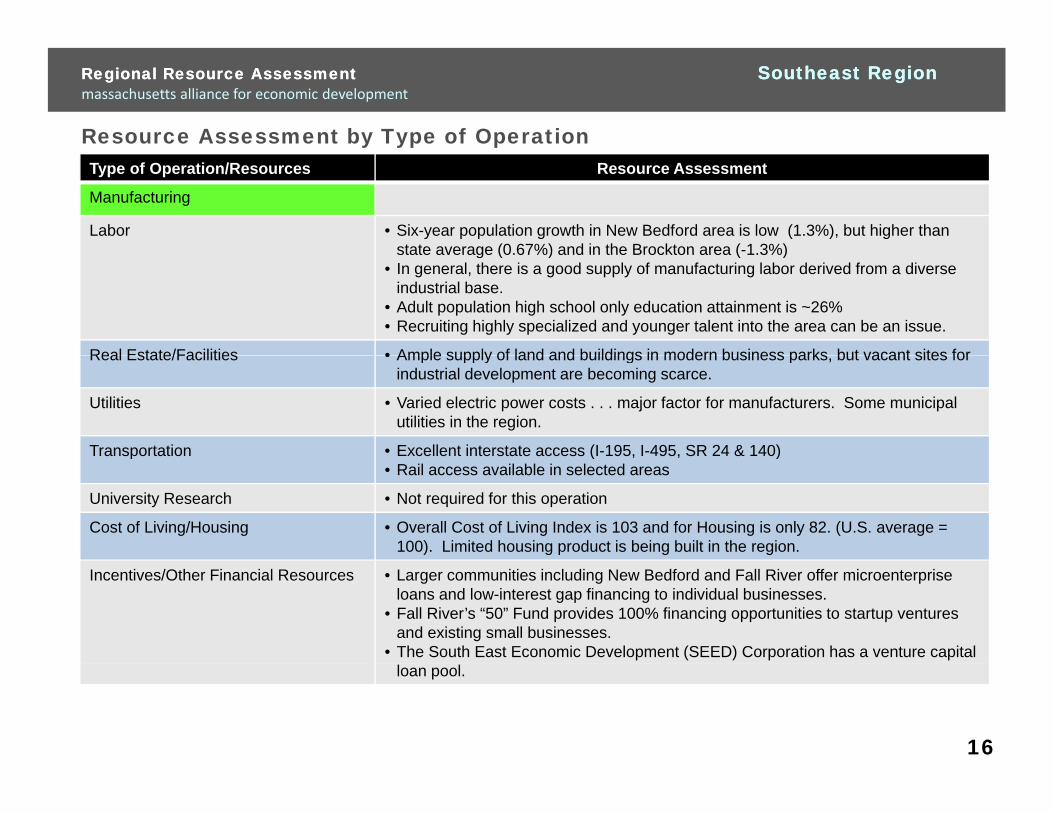
Resource Assessment by Type of Operation
Regional Resource AssessmentRegional Resource Assessment Southeast RegionSoutheast Regionmassachusetts alliance for economic development
Type of Operation/Resources Resource Assessment
Manufacturing
Labor • Six-year population growth in New Bedford area is low (1.3%), but higher than state average (0 67%) and in the Brockton area (-1 3%)state average (0.67%) and in the Brockton area ( 1.3%)
• In general, there is a good supply of manufacturing labor derived from a diverse industrial base.
• Adult population high school only education attainment is ~26% • Recruiting highly specialized and younger talent into the area can be an issue.
Real Estate/Facilities • Ample supply of land and buildings in modern business parks but vacant sites forReal Estate/Facilities • Ample supply of land and buildings in modern business parks, but vacant sites for industrial development are becoming scarce.
Utilities • Varied electric power costs . . . major factor for manufacturers. Some municipal utilities in the region.
Transportation • Excellent interstate access (I-195, I-495, SR 24 & 140)p ( , , )• Rail access available in selected areas
University Research • Not required for this operation
Cost of Living/Housing • Overall Cost of Living Index is 103 and for Housing is only 82. (U.S. average = 100). Limited housing product is being built in the region.
Incentives/Other Financial Resources • Larger communities including New Bedford and Fall River offer microenterprise loans and low-interest gap financing to individual businesses.
• Fall River’s “50” Fund provides 100% financing opportunities to startup ventures and existing small businesses.
• The South East Economic Development (SEED) Corporation has a venture capital loan pool.
16
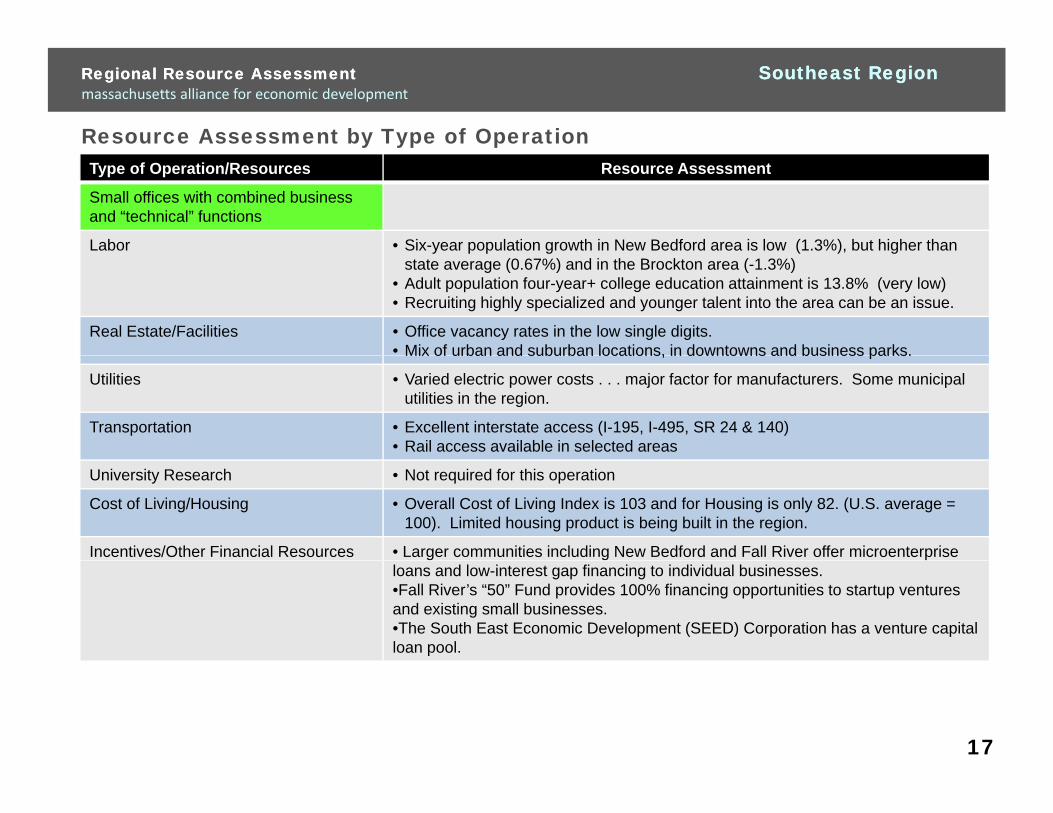
Resource Assessment by Type of Operation
Regional Resource AssessmentRegional Resource Assessment Southeast RegionSoutheast Regionmassachusetts alliance for economic development
Type of Operation/Resources Resource Assessment
Small offices with combined business and “technical” functions
Labor • Six-year population growth in New Bedford area is low (1.3%), but higher than y p p g ( ) gstate average (0.67%) and in the Brockton area (-1.3%)
• Adult population four-year+ college education attainment is 13.8% (very low)• Recruiting highly specialized and younger talent into the area can be an issue.
Real Estate/Facilities • Office vacancy rates in the low single digits.• Mix of urban and suburban locations, in downtowns and business parks.Mix of urban and suburban locations, in downtowns and business parks.
Utilities • Varied electric power costs . . . major factor for manufacturers. Some municipal utilities in the region.
Transportation • Excellent interstate access (I-195, I-495, SR 24 & 140)• Rail access available in selected areas
University Research • Not required for this operation
Cost of Living/Housing • Overall Cost of Living Index is 103 and for Housing is only 82. (U.S. average = 100). Limited housing product is being built in the region.
Incentives/Other Financial Resources • Larger communities including New Bedford and Fall River offer microenterprise loans and low-interest gap financing to individual businesses.•Fall River’s “50” Fund provides 100% financing opportunities to startup ventures and existing small businesses.•The South East Economic Development (SEED) Corporation has a venture capital loan pool.
17

Resource Assessment by Type of Operation
Regional Resource AssessmentRegional Resource Assessment Southeast RegionSoutheast Regionmassachusetts alliance for economic development
Type of Operation/Resources Resource Assessment
R&D Operations
Labor • Six-year population growth in New Bedford area is low (1.3%), but higher than state average (0.67%) and in the Brockton area (-1.3%)g ( ) ( )
• Adult population four-year+ college education attainment is 13.8% (very low)• Recruiting highly specialized and younger talent into the area can be an issue.• Opportunity to recruit locally from UMass-Dartmouth and Woods Hole Oceanic
Institute
Real Estate/Facilities • Incubator space for technology-based companies available at UMassReal Estate/Facilities Incubator space for technology based companies available at UMass Dartmouth’s Advanced Manufacturing and Technology Center and at the Quest Center in New Bedford.
• Land and buildings available at modern industrial parks.• Opportunities for revitalization of old mill buildings for R&D.
Utilities • Power not a major issue for R&D operations but backup may be neededUtilities Power not a major issue for R&D operations, but backup may be needed.• Water quality can be an issue for certain types of operations.
Transportation • Excellent interstate access (I-195, I-495, SR 24 & 140)• Rail access available in selected areas
University Research • Opportunity to partner locally with UMass-Dartmouth and Woods Hole Oceanic Institute, Brown University
• Distance partnering with Boston area universities
Cost of Living/Housing • Overall Cost of Living Index is 103 and for Housing is only 82. (U.S. average = 100). Limited housing product is being built in the region.
I ti /Oth Fi i l R L iti i l di N B df d d F ll Ri ff i t iIncentives/Other Financial Resources • Larger communities including New Bedford and Fall River offer microenterprise loans and low-interest gap financing to individual businesses.
• Fall River’s “50” Fund provides 100% financing opportunities to startup ventures and existing small businesses.
• The SEED Corporation has a venture capital loan pool. 18

Resource Assessment by Type of Operation
Regional Resource AssessmentRegional Resource Assessment Southeast RegionSoutheast Regionmassachusetts alliance for economic development
Type of Operation/Resources Resource Assessment
Warehousing Operations
Labor • Six-year population growth in New Bedford area is low (1.3%), but higher than state average (0.67%) and in the Brockton area (-1.3%)g ( ) ( )
• In general, there is a good supply of labor for warehousing operations• Unemployment rate for 2007 was 6.1% in New Bedford area • Adult population high school only education attainment is ~26%
Real Estate/Facilities • Ample supply of land and buildings in modern business parks, but vacant sites for industrial development are becoming scarce.industrial development are becoming scarce.
Utilities • Varied electric power costs . . . not a major factor for warehousing operations. Some municipal utilities in the region.
Transportation • Excellent interstate access (I-195, I-495, SR 24 & 140)• Rail access available in selected areas
University Research • Not required for this operation
Cost of Living/Housing • Overall Cost of Living Index is 103 and for Housing is only 82. (U.S. average = 100). Limited housing product is being built in the region.
Incentives/Other Financial Resources • Larger communities including New Bedford and Fall River offer low-interest gap financing to individual businesses.
19
Population/Demographics
Regional Resource AssessmentRegional Resource Assessment Southeast RegionSoutheast Regionmassachusetts alliance for economic development
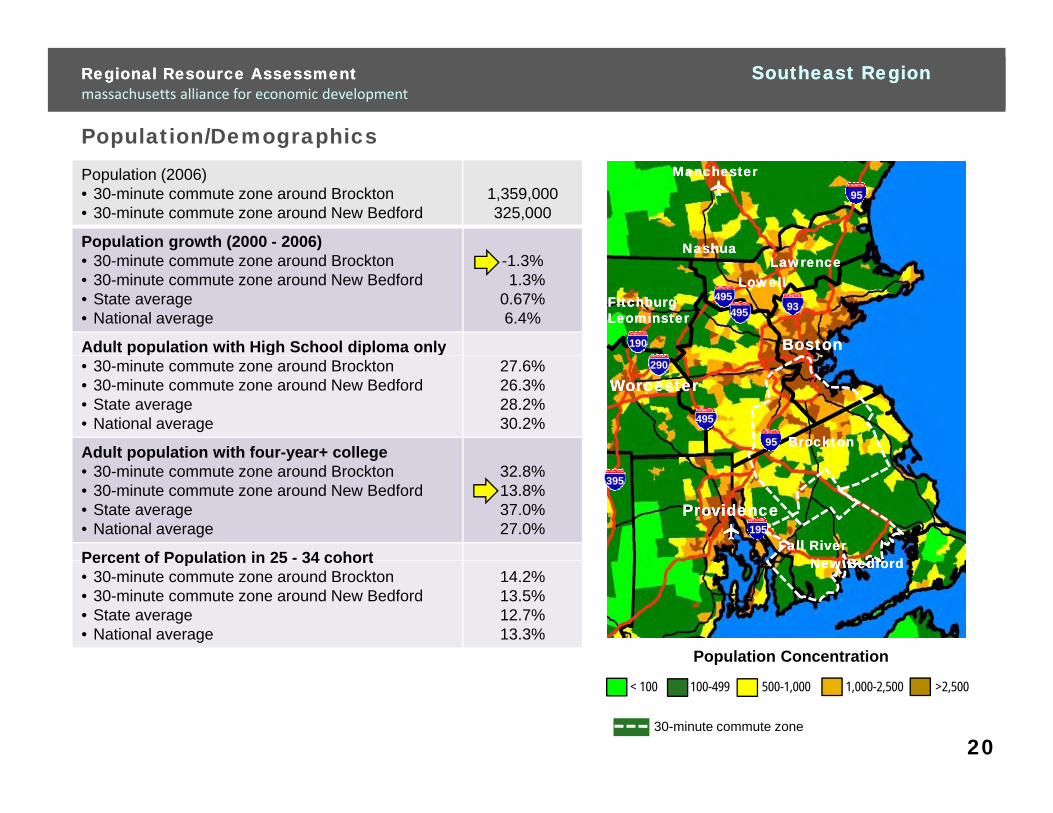
Population (2006) • 30-minute commute zone around Brockton• 30-minute commute zone around New Bedford
1,359,000325,000
Population growth (2000 - 2006)
95
ManchesterManchester
NashuaNashua• 30-minute commute zone around Brockton• 30-minute commute zone around New Bedford• State average• National average
-1.3%1.3%
0.67%6.4%
Adult population with High School diploma only
495FitchburgLeominsterFitchburgLeominster
LowellLowell
190
NashuaNashua
93
LawrenceLawrence
BostonBoston
495
g y• 30-minute commute zone around Brockton• 30-minute commute zone around New Bedford• State average• National average
27.6%26.3%28.2%30.2%
Adult population with four-year+ college
290
WorcesterWorcester
95 BrocktonBrockton
495
p p y g• 30-minute commute zone around Brockton• 30-minute commute zone around New Bedford• State average• National average
32.8%13.8%37.0%27.0%
Percent of Population in 25 - 34 cohort
ProvidenceProvidence
N B df dN B df d
395
195Fall RiverFall River
Percent of Population in 25 34 cohort• 30-minute commute zone around Brockton• 30-minute commute zone around New Bedford• State average• National average
14.2%13.5%12.7%13.3%
New BedfordNew Bedford
Population Concentration
< 100 100-499 500-1,000 1,000-2,500 >2,500
30-minute commute zone
p
20
Population/Demographics
Regional Resource AssessmentRegional Resource Assessment Southeast RegionSoutheast Regionmassachusetts alliance for economic development
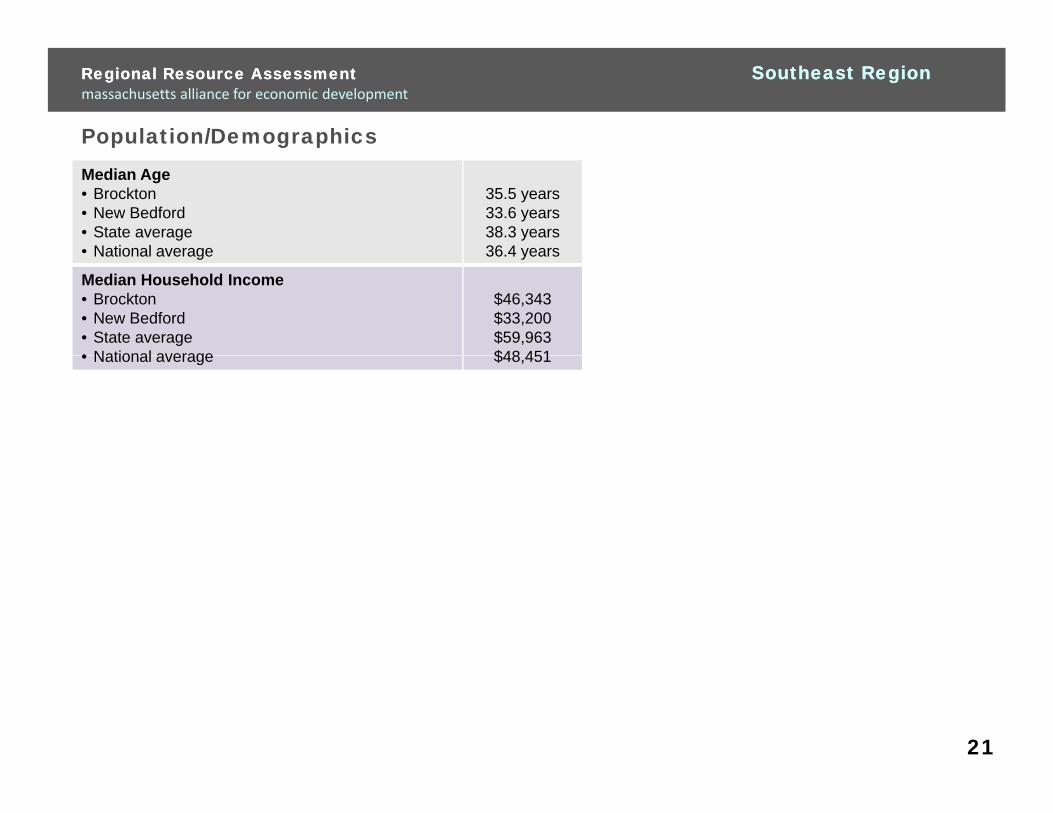
Median Age• Brockton• New Bedford• State average• National average
35.5 years33.6 years38.3 years36 4 yearsNational average 36.4 years
Median Household Income• Brockton• New Bedford• State average• National average
$46,343$33,200$59,963$48 451• National average $48,451
21
Labor Supply and Cost
Regional Resource AssessmentRegional Resource Assessment Southeast RegionSoutheast Regionmassachusetts alliance for economic development
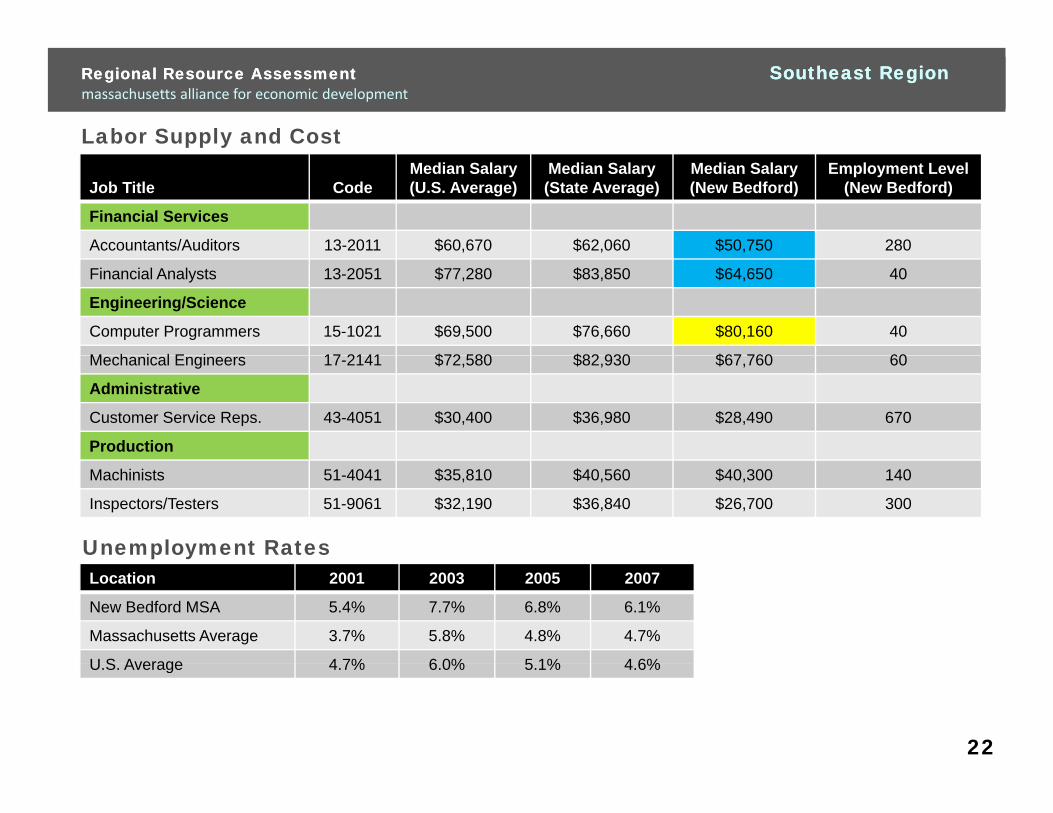
Job Title CodeMedian Salary (U.S. Average)
Median Salary(State Average)
Median Salary(New Bedford)
Employment Level(New Bedford)
Financial Services
Accountants/Auditors 13-2011 $60,670 $62,060 $50,750 280
Financial Analysts 13-2051 $77,280 $83,850 $64,650 40
Engineering/Science
Computer Programmers 15-1021 $69,500 $76,660 $80,160 40
M h i l E i 17 2141 $72 580 $82 930 $67 760 60Mechanical Engineers 17-2141 $72,580 $82,930 $67,760 60
Administrative
Customer Service Reps. 43-4051 $30,400 $36,980 $28,490 670
Production
Machinists 51-4041 $35,810 $40,560 $40,300 140
Inspectors/Testers 51-9061 $32,190 $36,840 $26,700 300
Unemployment RatesLocation 2001 2003 2005 2007
New Bedford MSA 5.4% 7.7% 6.8% 6.1%
Massachusetts Average 3.7% 5.8% 4.8% 4.7%
U S Average 4 7% 6 0% 5 1% 4 6%U.S. Average 4.7% 6.0% 5.1% 4.6%
22
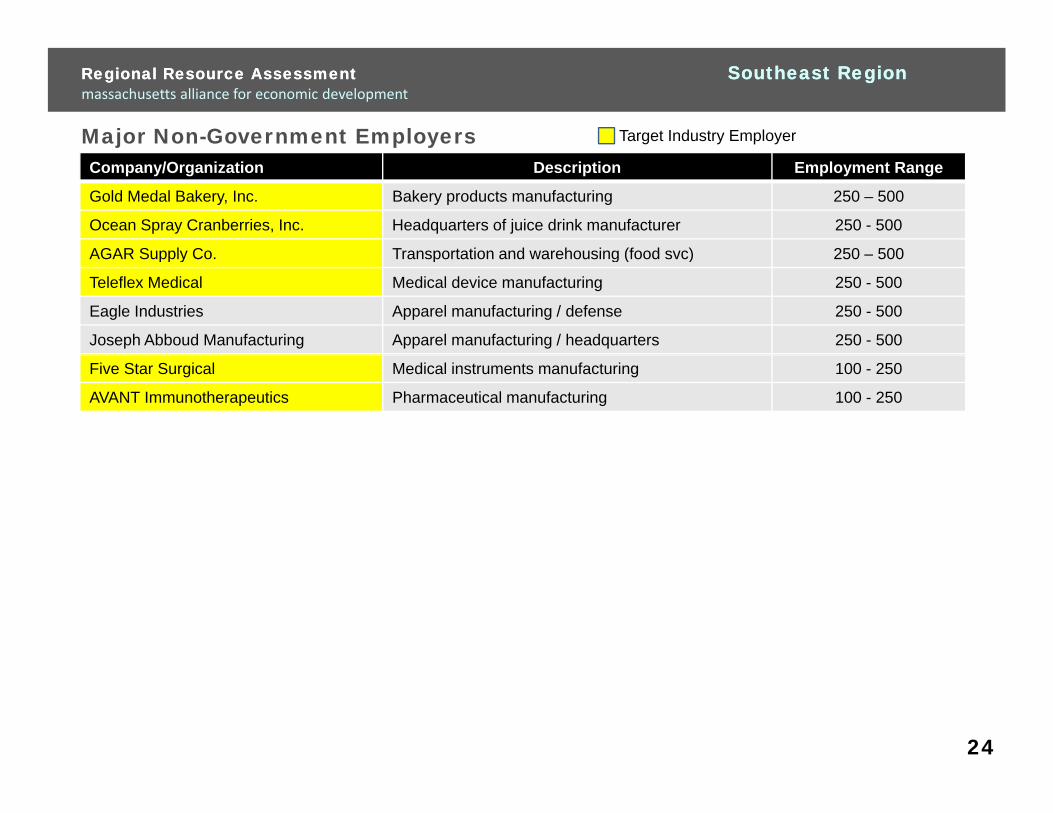
Major Non-Government Employers
Regional Resource AssessmentRegional Resource Assessment Southeast RegionSoutheast Regionmassachusetts alliance for economic development
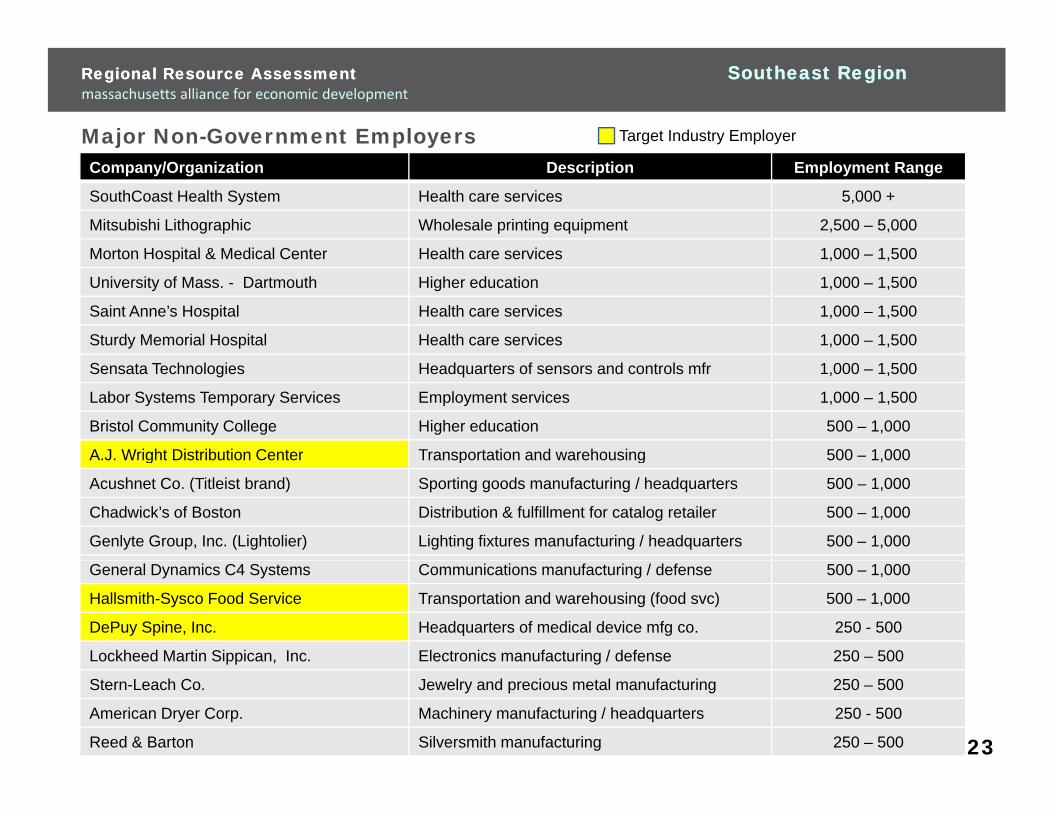
Target Industry Employer
Company/Organization Description Employment Range
SouthCoast Health System Health care services 5,000 +
Mitsubishi Lithographic Wholesale printing equipment 2,500 – 5,000
Morton Hospital & Medical Center Health care services 1 000 1 500Morton Hospital & Medical Center Health care services 1,000 – 1,500
University of Mass. - Dartmouth Higher education 1,000 – 1,500
Saint Anne’s Hospital Health care services 1,000 – 1,500
Sturdy Memorial Hospital Health care services 1,000 – 1,500
Sensata Technologies Headquarters of sensors and controls mfr 1,000 – 1,500
Labor Systems Temporary Services Employment services 1,000 – 1,500
Bristol Community College Higher education 500 – 1,000
A J Wright Distribution Center Transportation and warehousing 500 – 1 000A.J. Wright Distribution Center Transportation and warehousing 500 1,000
Acushnet Co. (Titleist brand) Sporting goods manufacturing / headquarters 500 – 1,000
Chadwick’s of Boston Distribution & fulfillment for catalog retailer 500 – 1,000
Genlyte Group, Inc. (Lightolier) Lighting fixtures manufacturing / headquarters 500 – 1,000
General Dynamics C4 Systems Communications manufacturing / defense 500 – 1,000
Hallsmith-Sysco Food Service Transportation and warehousing (food svc) 500 – 1,000
DePuy Spine, Inc. Headquarters of medical device mfg co. 250 - 500
Lockheed Martin Sippican, Inc. Electronics manufacturing / defense 250 – 500pp , g
Stern-Leach Co. Jewelry and precious metal manufacturing 250 – 500
American Dryer Corp. Machinery manufacturing / headquarters 250 - 500
Reed & Barton Silversmith manufacturing 250 – 500 23
Major Non-Government Employers
Regional Resource AssessmentRegional Resource Assessment Southeast RegionSoutheast Regionmassachusetts alliance for economic development
Target Industry Employer
Company/Organization Description Employment Range
Gold Medal Bakery, Inc. Bakery products manufacturing 250 – 500
Ocean Spray Cranberries, Inc. Headquarters of juice drink manufacturer 250 - 500
AGAR Supply Co Transportation and warehousing (food svc) 250 500AGAR Supply Co. Transportation and warehousing (food svc) 250 – 500
Teleflex Medical Medical device manufacturing 250 - 500
Eagle Industries Apparel manufacturing / defense 250 - 500
Joseph Abboud Manufacturing Apparel manufacturing / headquarters 250 - 500
Five Star Surgical Medical instruments manufacturing 100 - 250
AVANT Immunotherapeutics Pharmaceutical manufacturing 100 - 250
24
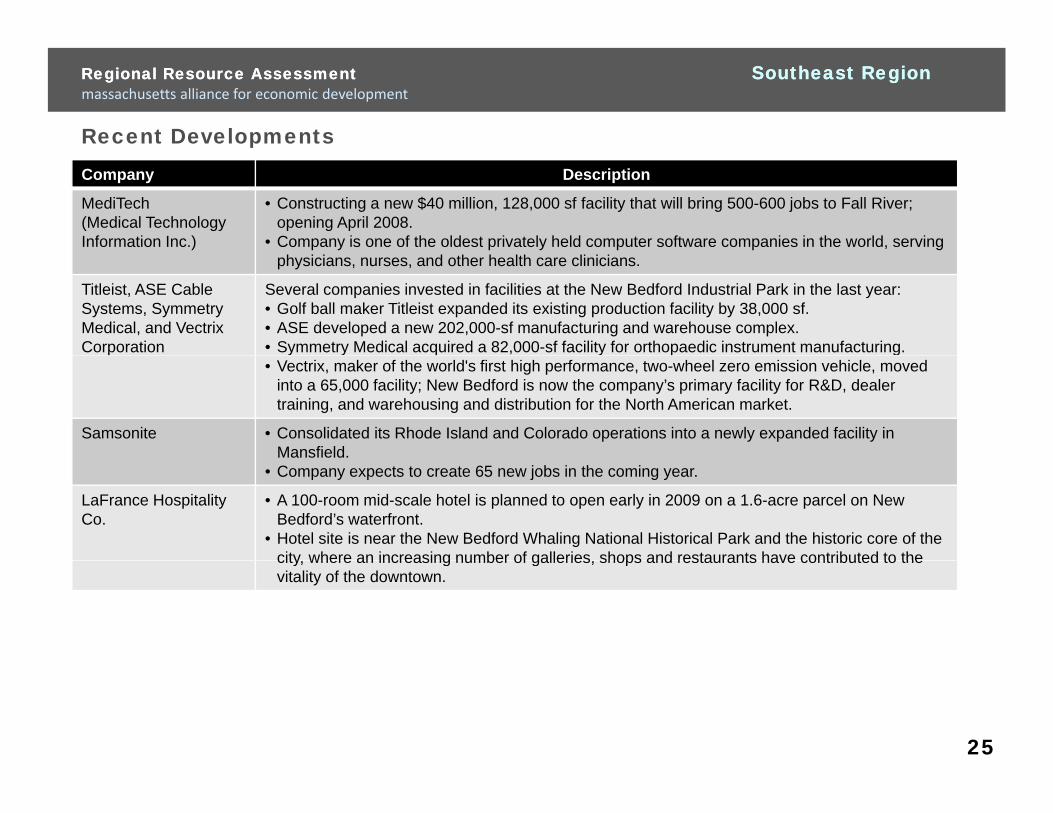
Recent Developments
Regional Resource AssessmentRegional Resource Assessment Southeast RegionSoutheast Regionmassachusetts alliance for economic development
Company Description
MediTech(Medical Technology Information Inc.)
• Constructing a new $40 million, 128,000 sf facility that will bring 500-600 jobs to Fall River; opening April 2008.
• Company is one of the oldest privately held computer software companies in the world, serving physicians, nurses, and other health care clinicians.
Titleist, ASE Cable Systems, Symmetry Medical, and Vectrix Corporation
Several companies invested in facilities at the New Bedford Industrial Park in the last year: • Golf ball maker Titleist expanded its existing production facility by 38,000 sf.• ASE developed a new 202,000-sf manufacturing and warehouse complex.• Symmetry Medical acquired a 82,000-sf facility for orthopaedic instrument manufacturing.y y y g• Vectrix, maker of the world's first high performance, two-wheel zero emission vehicle, moved
into a 65,000 facility; New Bedford is now the company’s primary facility for R&D, dealer training, and warehousing and distribution for the North American market.
Samsonite • Consolidated its Rhode Island and Colorado operations into a newly expanded facility in Mansfield.
• Company expects to create 65 new jobs in the coming year.
LaFrance Hospitality Co.
• A 100-room mid-scale hotel is planned to open early in 2009 on a 1.6-acre parcel on New Bedford’s waterfront.
• Hotel site is near the New Bedford Whaling National Historical Park and the historic core of the city where an increasing number of galleries shops and restaurants have contributed to thecity, where an increasing number of galleries, shops and restaurants have contributed to the vitality of the downtown.
25
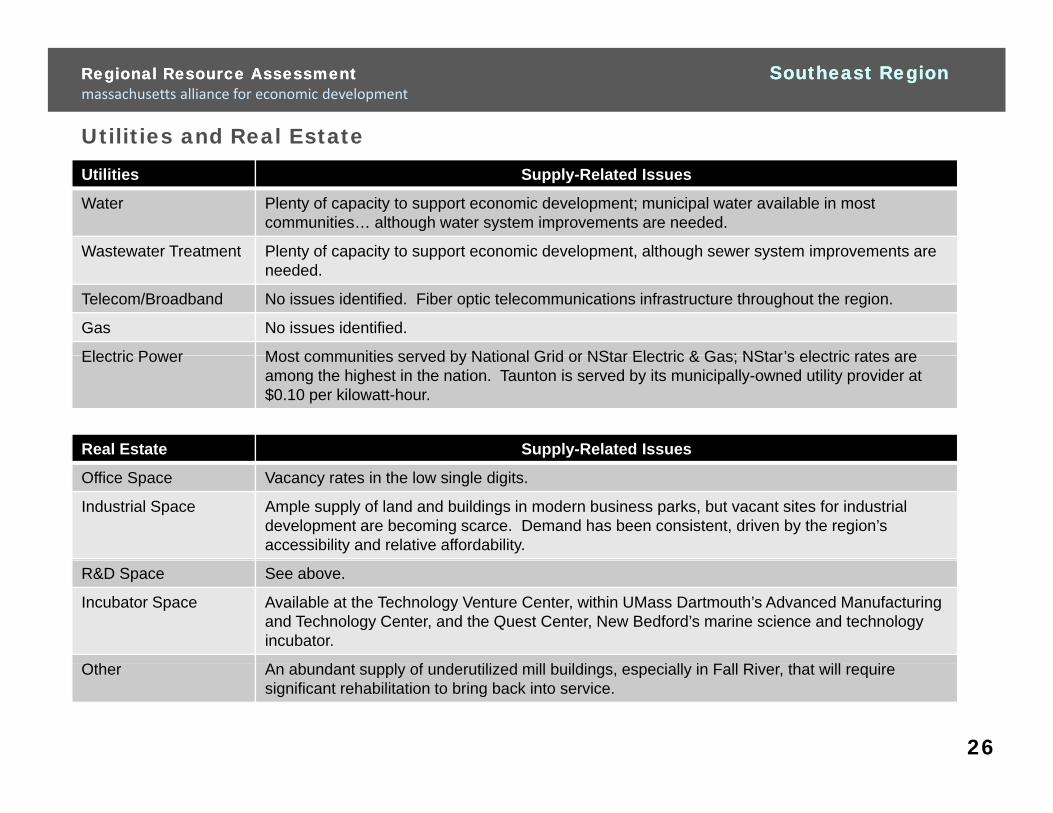
Utilities and Real Estate
Regional Resource AssessmentRegional Resource Assessment Southeast RegionSoutheast Regionmassachusetts alliance for economic development
Utilities Supply-Related Issues
Water Plenty of capacity to support economic development; municipal water available in most communities… although water system improvements are needed.
Wastewater Treatment Plenty of capacity to support economic development although sewer system improvements areWastewater Treatment Plenty of capacity to support economic development, although sewer system improvements are needed.
Telecom/Broadband No issues identified. Fiber optic telecommunications infrastructure throughout the region.
Gas No issues identified.
Electric Power Most communities served by National Grid or NStar Electric & Gas; NStar’s electric rates areElectric Power Most communities served by National Grid or NStar Electric & Gas; NStar s electric rates are among the highest in the nation. Taunton is served by its municipally-owned utility provider at $0.10 per kilowatt-hour.
Real Estate Supply-Related Issues
Office Space Vacancy rates in the low single digits.
Industrial Space Ample supply of land and buildings in modern business parks, but vacant sites for industrial development are becoming scarce. Demand has been consistent, driven by the region’s accessibility and relative affordability.
R&D Space See above.
Incubator Space Available at the Technology Venture Center, within UMass Dartmouth’s Advanced Manufacturing and Technology Center, and the Quest Center, New Bedford’s marine science and technology incubator.
O fOther An abundant supply of underutilized mill buildings, especially in Fall River, that will require significant rehabilitation to bring back into service.
26
Regional Resource Assessments & Market OverviewsRegional Resource Assessments & Market Overviewsmassachusetts alliance for economic development
Quality of LifeyCost of Living and Housing
27
Regional Resource Assessments & Market OverviewsRegional Resource Assessments & Market Overviewsmassachusetts alliance for economic development
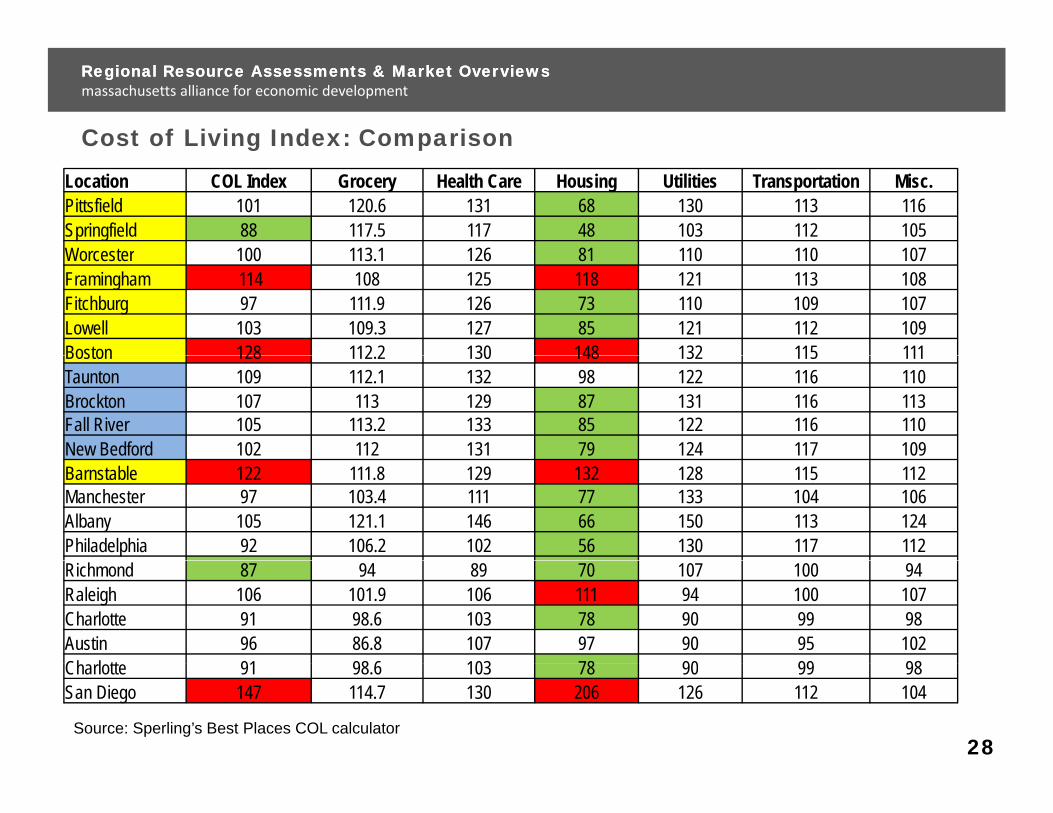
Cost of Living Index: Comparisong p
Location COL Index Grocery Health Care Housing Utilities Transportation Misc.Pittsfield 101 120.6 131 68 130 113 116Springfield 88 117.5 117 48 103 112 105Worcester 100 113 1 126 81 110 110 107Worcester 100 113.1 126 81 110 110 107Framingham 114 108 125 118 121 113 108Fitchburg 97 111.9 126 73 110 109 107Lowell 103 109.3 127 85 121 112 109Boston 128 112 2 130 148 132 115 111Boston 128 112.2 130 148 132 115 111Taunton 109 112.1 132 98 122 116 110Brockton 107 113 129 87 131 116 113Fall River 105 113.2 133 85 122 116 110New Bedford 102 112 131 79 124 117 109Barnstable 122 111.8 129 132 128 115 112Manchester 97 103.4 111 77 133 104 106Albany 105 121.1 146 66 150 113 124Philadelphia 92 106.2 102 56 130 117 112Richmond 87 94 89 70 107 100 94Raleigh 106 101.9 106 111 94 100 107Charlotte 91 98.6 103 78 90 99 98Austin 96 86.8 107 97 90 95 102Ch l tt 91 98 6 103 78 90 99 98Charlotte 91 98.6 103 78 90 99 98San Diego 147 114.7 130 206 126 112 104
Source: Sperling’s Best Places COL calculator28
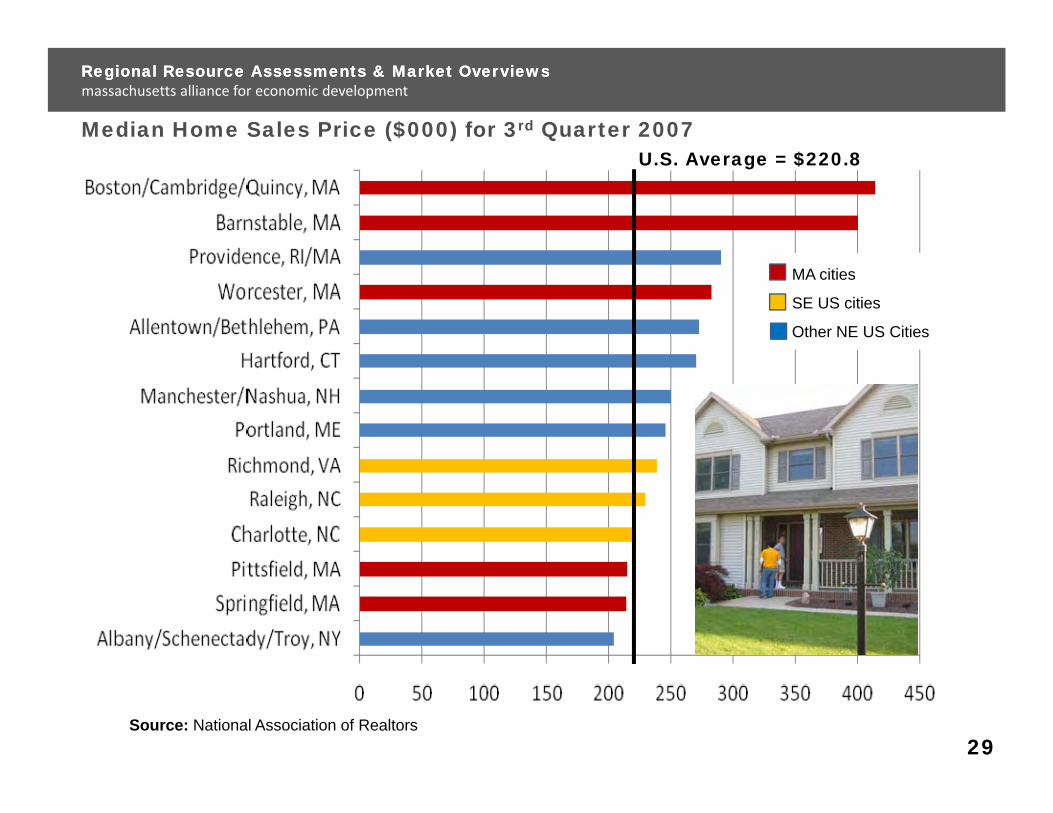
Median Home Sales Price ($000) for 3rd Quarter 2007
Regional Resource Assessments & Market OverviewsRegional Resource Assessments & Market Overviewsmassachusetts alliance for economic development
U.S. Average = $220.8
MA cities
SE US cities
Other NE US Cities
Source: National Association of Realtors29
Regional Resource Assessments & Market OverviewsRegional Resource Assessments & Market Overviewsmassachusetts alliance for economic development
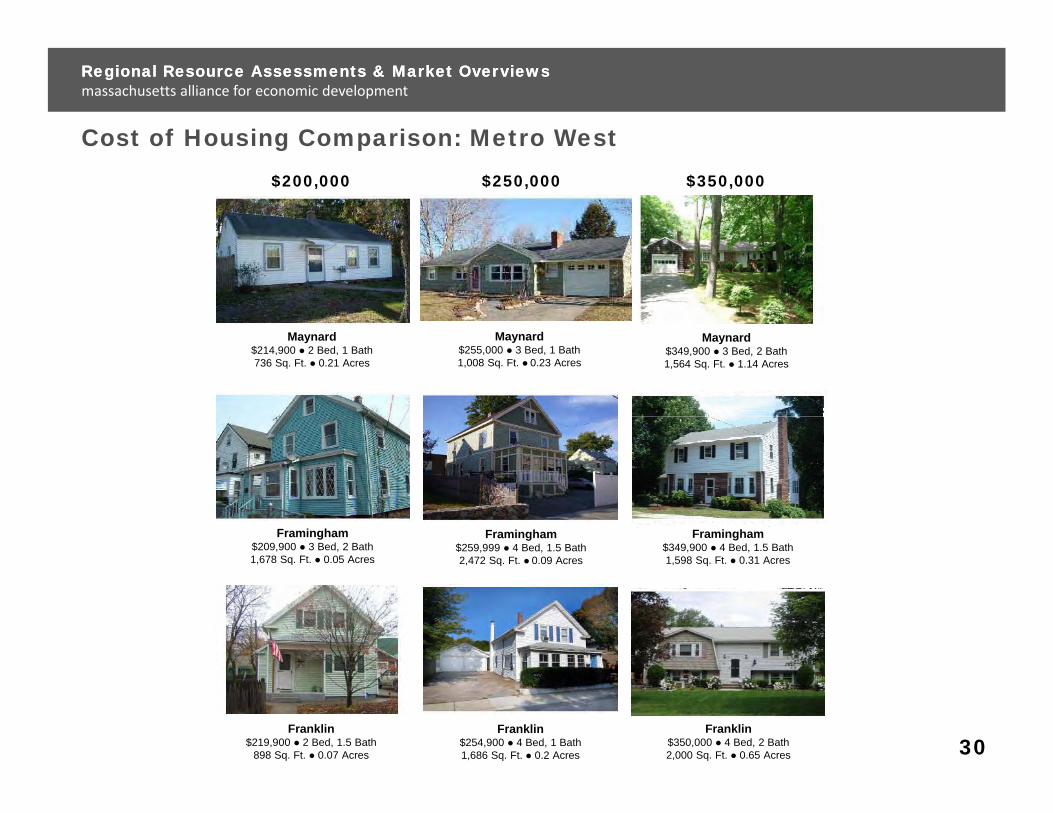
Cost of Housing Comparison: Metro Westg p$200,000 $250,000 $350,000
Maynard$214,900 2 Bed, 1 Bath
Maynard$255,000 3 Bed, 1 Bath
Maynard$349,900 3 Bed, 2 Bath
736 Sq. Ft. 0.21 Acres 1,008 Sq. Ft. 0.23 Acres$ , ,1,564 Sq. Ft. 1.14 Acres
Framingham$209,900 3 Bed, 2 Bath 1 678 Sq Ft 0 05 Acres
Framingham$349,900 4 Bed, 1.5 Bath 1 598 Sq Ft 0 31 Acres
Framingham$259,999 4 Bed, 1.5 Bath 2 472 Sq Ft 0 09 Acres1,678 Sq. Ft. 0.05 Acres 1,598 Sq. Ft. 0.31 Acres2,472 Sq. Ft. 0.09 Acres
Franklin$219,900 2 Bed, 1.5 Bath
898 Sq. Ft. 0.07 Acres
Franklin$254,900 4 Bed, 1 Bath 1,686 Sq. Ft. 0.2 Acres
Franklin$350,000 4 Bed, 2 Bath 2,000 Sq. Ft. 0.65 Acres 30
Regional Resource Assessments & Market OverviewsRegional Resource Assessments & Market Overviewsmassachusetts alliance for economic development
University R&D yResearch Centers That Support Economic Development
31

Major Academic and R&D Institutions
Regional Resource Assessments & Market OverviewsRegional Resource Assessments & Market Overviewsmassachusetts alliance for economic development
VERMONTVERMONT NEW HAMPSHIRENEW HAMPSHIRE
AlbanyAlbany
Manchester Manchester Manchester
LawrenceLawrenceLawrenceLawrenceAlbanyAlbany
NEW YORKNEW YORK
MASSACHUSETTSMASSACHUSETTS
Worcester Worcester Worcester
Pittsfield Pittsfield Pittsfield Fitchburg/Leominster Fitchburg/Leominster Fitchburg/Leominster Fitchburg/Leominster
LowellLowell
MarlboroughMarlboroughAmherst Amherst Amherst Amherst BostonBostonBostonBostonMarlboroughMarlborough
CONNECTICUTCONNECTICUT RHODERHODEISLANDISLAND
Springfield
Providence Providence Providence Hartford Hartford Hartford Hartford Hartford Hartford Hartford Hartford
F ll RiF ll Ri
Springfield Springfield
Fall RiverFall RiverFall RiverNew BedfordNew BedfordNew BedfordNew Bedford
Major Institutions (>5,000 students) with R&DMajor Institutions (>5,000 students) without R&DI tit ti ith R&D d <5 000 t d tInstitution with R&D and <5,000 students
32
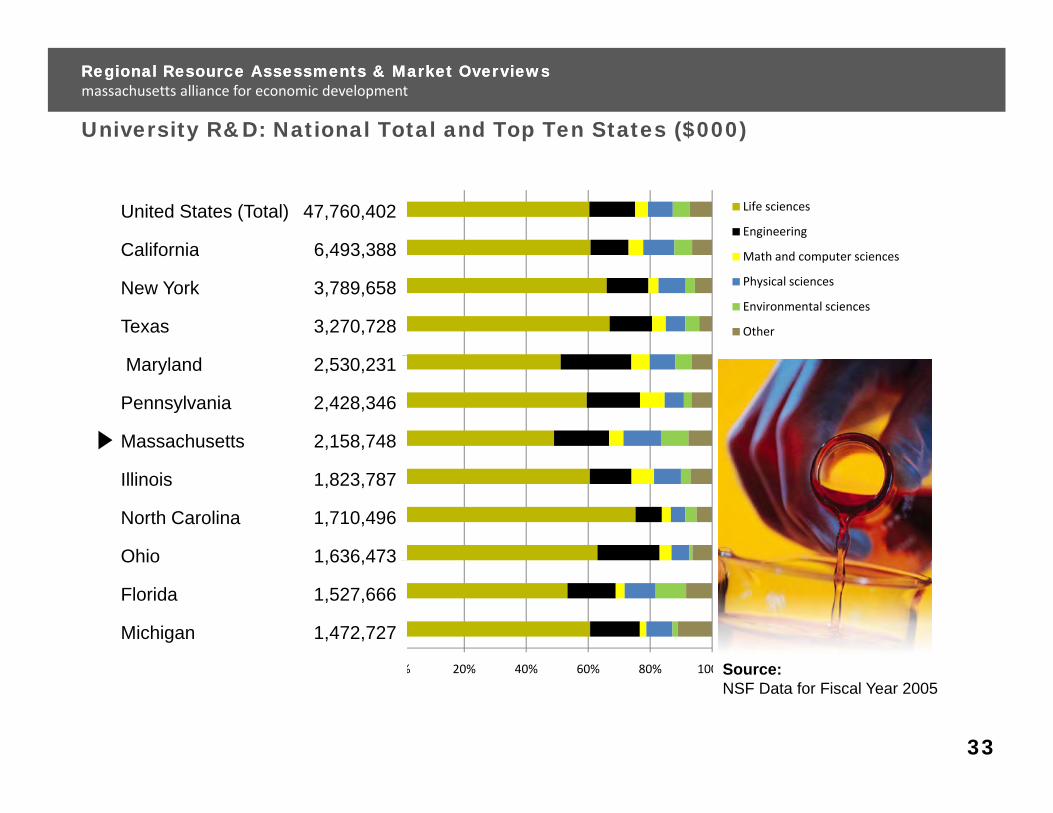
University R&D: National Total and Top Ten States ($000)
Regional Resource Assessments & Market OverviewsRegional Resource Assessments & Market Overviewsmassachusetts alliance for economic development
California
United States Life sciences
Engineering
M th d t i
United States (Total) 47,760,402
California 6 493 388
Texas
New York
Math and computer sciences
Physical sciences
Environmental sciences
Other
California 6,493,388
New York 3,789,658
Texas 3,270,728
Massachusetts
Pennsylvania
MarylandMaryland 2,530,231
Pennsylvania 2,428,346
Massachusetts 2,158,748
Ohio
North Carolina
IllinoisIllinois 1,823,787
North Carolina 1,710,496
Ohio 1,636,473
Michigan
Florida
Ohio 1,636,473
Florida 1,527,666
Michigan 1,472,727
S0% 20% 40% 60% 80% 100%Source:NSF Data for Fiscal Year 2005
33
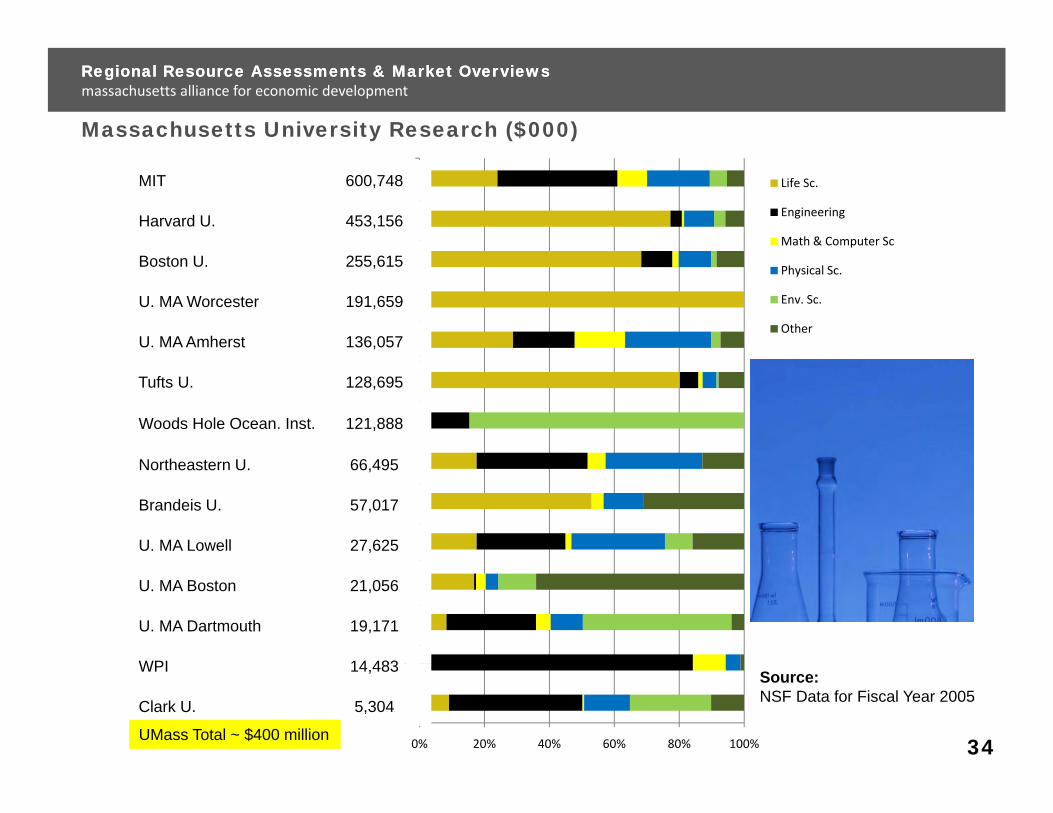
Massachusetts University Research ($000)
Regional Resource Assessments & Market OverviewsRegional Resource Assessments & Market Overviewsmassachusetts alliance for economic development
Harvard U.
MIT Life Sc.
Engineering
Math & Computer Sc
MIT 600,748
Harvard U. 453,156
U. MA Amherst
U. MA Worcester
Boston U.Physical Sc.
Env. Sc.
Other
Boston U. 255,615
U. MA Worcester 191,659
U. MA Amherst 136,057
N th t U
Woods Hole Ocean. Inst.
Tufts U.Tufts U. 128,695
Woods Hole Ocean. Inst. 121,888
U. MA Lowell
Brandeis U.
Northeastern U.Northeastern U. 66,495
Brandeis U. 57,017
U. MA Lowell 27,625
WPI
U. MA Dartmouth
U. MA BostonU. MA Boston 21,056
U. MA Dartmouth 19,171
WPI 14 483
0% 20% 40% 60% 80% 100%
Clark U.
WPIWPI 14,483
Clark U. 5,304
Source:NSF Data for Fiscal Year 2005
UMass Total ~ $400 million 34
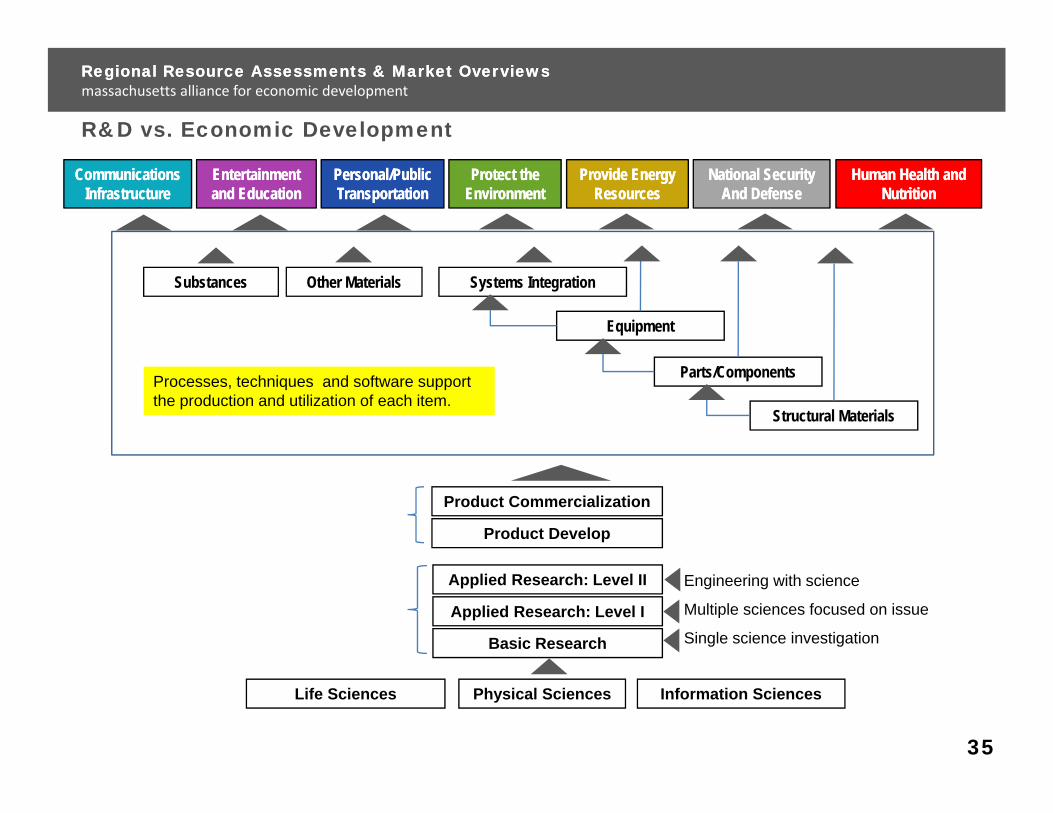
R&D vs. Economic Development
Regional Resource Assessments & Market OverviewsRegional Resource Assessments & Market Overviewsmassachusetts alliance for economic development
Personal/Public Personal/Public TransportationTransportation
EntertainmentEntertainmentand Educationand Education
Protect theProtect theEnvironmentEnvironment
Provide EnergyProvide EnergyResourcesResources
National SecurityNational SecurityAnd DefenseAnd Defense
Human Health and Human Health and NutritionNutrition
Communications Communications InfrastructureInfrastructure
Systems Integration
Equipment
Substances Other Materials
Parts/Components
Structural Materials
Processes, techniques and software support the production and utilization of each item.
Product Develop
Product Commercialization
Applied Research: Level I
Applied Research: Level II
Basic Research
Engineering with science
Multiple sciences focused on issue
Single science investigation
Information SciencesLife Sciences Physical Sciences
35
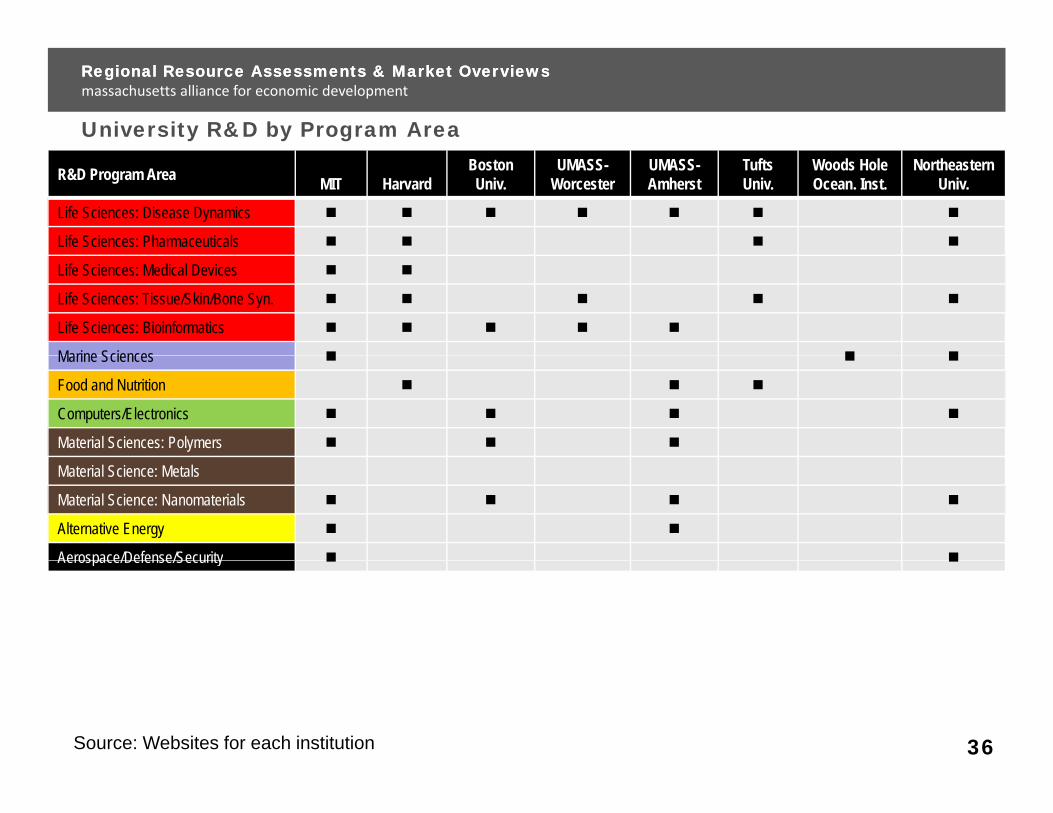
University R&D by Program Area
Regional Resource Assessments & Market OverviewsRegional Resource Assessments & Market Overviewsmassachusetts alliance for economic development
R&D Program Area MIT HarvardBoston Univ.
UMASS-Worcester
UMASS-Amherst
Tufts Univ.
Woods Hole Ocean. Inst.
Northeastern Univ.
Life Sciences: Disease Dynamics
Life Sciences: Pharmaceuticals
Life Sciences: Medical Devices
Life Sciences: Tissue/Skin/Bone Syn.
Life Sciences: Bioinformatics
Marine SciencesMarine Sciences
Food and Nutrition
Computers/Electronics
Material Sciences: Polymers
Material Science: Metals
Material Science: Nanomaterials
Alternative Energy
Aerospace/Defense/SecurityAerospace/Defense/Security
Source: Websites for each institution 36

University R&D by Program Area
Regional Resource Assessments & Market OverviewsRegional Resource Assessments & Market Overviewsmassachusetts alliance for economic development
R&D Program Area Brandeis Univ.
UMASS -Lowell
UMASS -Boston
UMASS-Dartmouth WPI Clark Univ.
Life Sciences: Disease Dynamics
Life Sciences: Pharmaceuticals
Life Sciences: Medical Devices
Life Sciences: Tissue/Skin/Bone Syn.
Life Sciences: Bioinformatics
Marine SciencesMarine Sciences
Food and Nutrition
Computers/Electronics
Material Sciences: Polymers
Material Science: Metals
Material Science: Nanomaterials
Alternative Energy
Aerospace/Defense/SecurityAerospace/Defense/Security
Source: Websites for each institution 37
Regional Resource Assessments & Market OverviewsRegional Resource Assessments & Market Overviewsmassachusetts alliance for economic development
Colleges & UniversitiesgEnrollment and Graduates Within Specific Programs
38
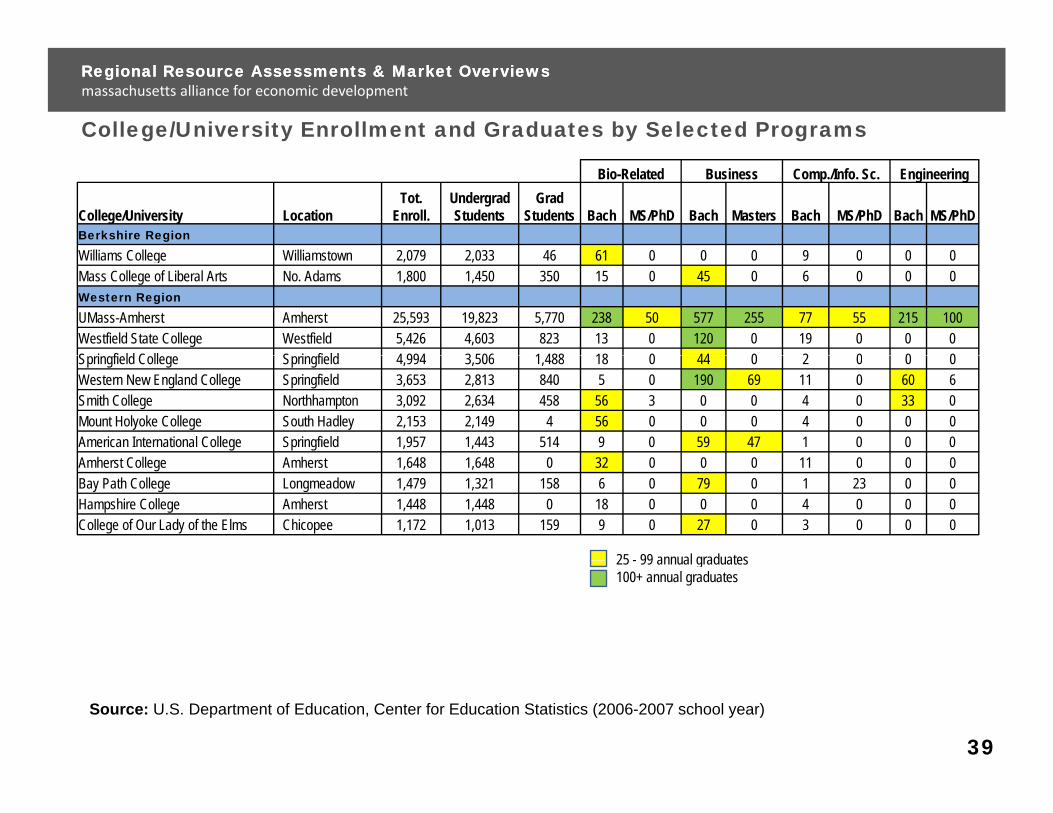
College/University Enrollment and Graduates by Selected Programs
Regional Resource Assessments & Market OverviewsRegional Resource Assessments & Market Overviewsmassachusetts alliance for economic development
Bio-Related Business Comp./Info. Sc. Engineering
College/University LocationTot.
Enroll.Undergrad Students
Grad Students Bach MS/PhD Bach Masters Bach MS/PhD Bach MS/PhD
Berkshire Region
Williams College Williamsto n 2 079 2 033 46 61 0 0 0 9 0 0 0Williams College Williamstown 2,079 2,033 46 61 0 0 0 9 0 0 0Mass College of Liberal Arts No. Adams 1,800 1,450 350 15 0 45 0 6 0 0 0Western Region
UMass-Amherst Amherst 25,593 19,823 5,770 238 50 577 255 77 55 215 100Westfield State College Westfield 5,426 4,603 823 13 0 120 0 19 0 0 0S i fi ld C ll S i fi ld 4 994 3 506 1 488 18 0 44 0 2 0 0 0Springfield College Springfield 4,994 3,506 1,488 18 0 44 0 2 0 0 0Western New England College Springfield 3,653 2,813 840 5 0 190 69 11 0 60 6Smith College Northhampton 3,092 2,634 458 56 3 0 0 4 0 33 0Mount Holyoke College South Hadley 2,153 2,149 4 56 0 0 0 4 0 0 0American International College Springfield 1,957 1,443 514 9 0 59 47 1 0 0 0A h t C ll A h t 1 648 1 648 0 32 0 0 0 11 0 0 0
25 - 99 annual graduates
Amherst College Amherst 1,648 1,648 0 32 0 0 0 11 0 0 0Bay Path College Longmeadow 1,479 1,321 158 6 0 79 0 1 23 0 0Hampshire College Amherst 1,448 1,448 0 18 0 0 0 4 0 0 0College of Our Lady of the Elms Chicopee 1,172 1,013 159 9 0 27 0 3 0 0 0
25 - 99 annual graduates100+ annual graduates
Source: U.S. Department of Education, Center for Education Statistics (2006-2007 school year)
39
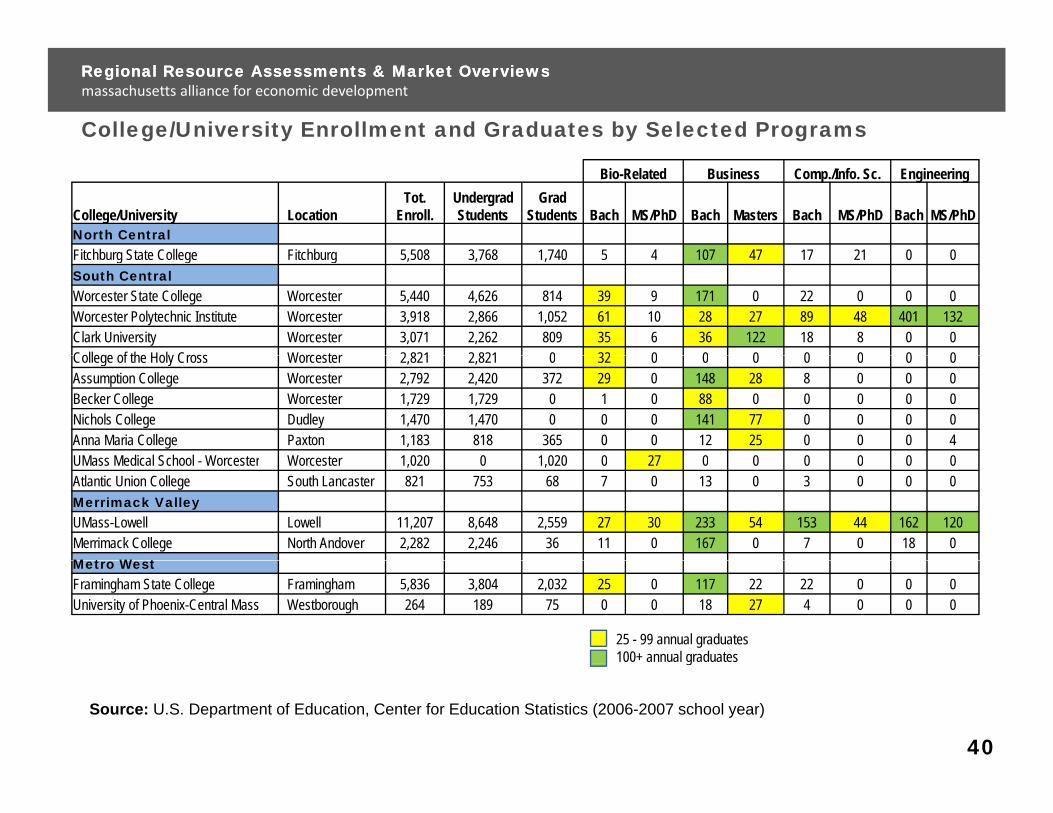
College/University Enrollment and Graduates by Selected Programs
Regional Resource Assessments & Market OverviewsRegional Resource Assessments & Market Overviewsmassachusetts alliance for economic development
Bio-Related Business Comp./Info. Sc. Engineering
College/University LocationTot.
Enroll.Undergrad Students
Grad Students Bach MS/PhD Bach Masters Bach MS/PhD Bach MS/PhD
North CentralFitchburg State College Fitchburg 5 508 3 768 1 740 5 4 107 47 17 21 0 0Fitchburg State College Fitchburg 5,508 3,768 1,740 5 4 107 47 17 21 0 0South CentralWorcester State College Worcester 5,440 4,626 814 39 9 171 0 22 0 0 0Worcester Polytechnic Institute Worcester 3,918 2,866 1,052 61 10 28 27 89 48 401 132Clark University Worcester 3,071 2,262 809 35 6 36 122 18 8 0 0College of the Holy Cross Worcester 2 821 2 821 0 32 0 0 0 0 0 0 0College of the Holy Cross Worcester 2,821 2,821 0 32 0 0 0 0 0 0 0Assumption College Worcester 2,792 2,420 372 29 0 148 28 8 0 0 0Becker College Worcester 1,729 1,729 0 1 0 88 0 0 0 0 0Nichols College Dudley 1,470 1,470 0 0 0 141 77 0 0 0 0Anna Maria College Paxton 1,183 818 365 0 0 12 25 0 0 0 4UMass Medical School Worcester Worcester 1 020 0 1 020 0 27 0 0 0 0 0 0UMass Medical School - Worcester Worcester 1,020 0 1,020 0 27 0 0 0 0 0 0Atlantic Union College South Lancaster 821 753 68 7 0 13 0 3 0 0 0Merrimack ValleyUMass-Lowell Lowell 11,207 8,648 2,559 27 30 233 54 153 44 162 120Merrimack College North Andover 2,282 2,246 36 11 0 167 0 7 0 18 0M t W t Metro West Framingham State College Framingham 5,836 3,804 2,032 25 0 117 22 22 0 0 0University of Phoenix-Central Mass Westborough 264 189 75 0 0 18 27 4 0 0 0
25 - 99 annual graduates100+ annual graduatesg
Source: U.S. Department of Education, Center for Education Statistics (2006-2007 school year)
40
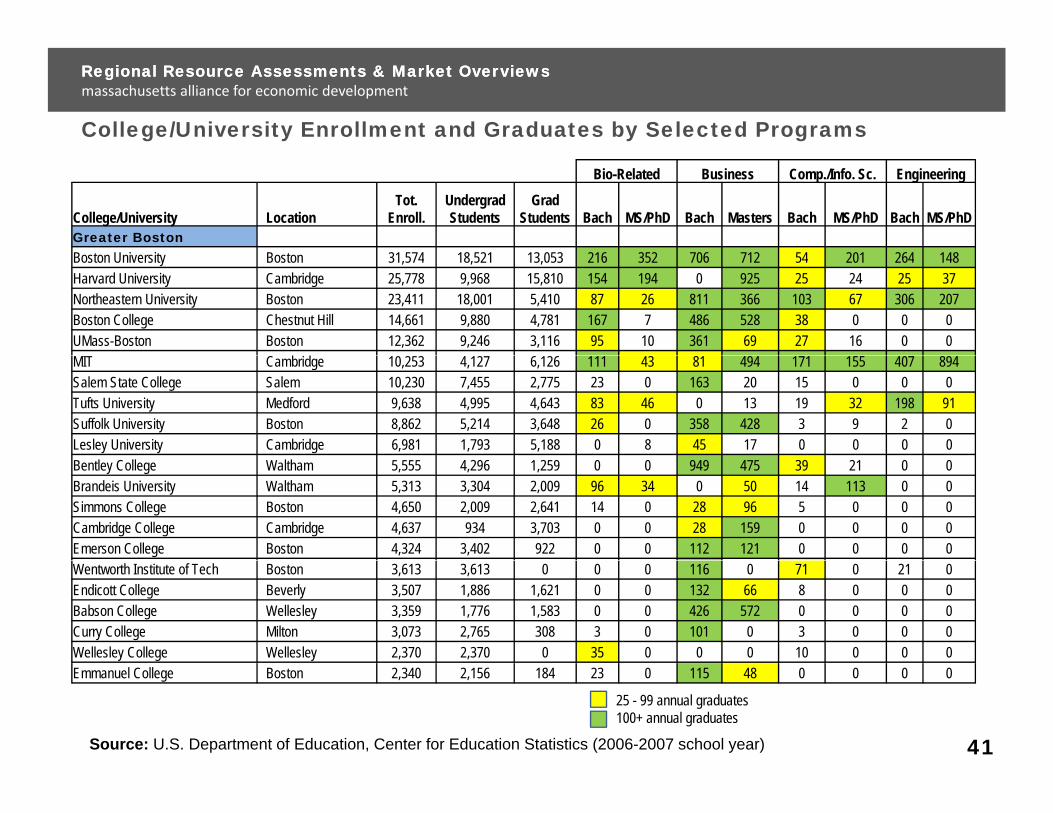
College/University Enrollment and Graduates by Selected Programs
Regional Resource Assessments & Market OverviewsRegional Resource Assessments & Market Overviewsmassachusetts alliance for economic development
Bio-Related Business Comp./Info. Sc. Engineering
College/University LocationTot.
Enroll.Undergrad Students
Grad Students Bach MS/PhD Bach Masters Bach MS/PhD Bach MS/PhD
Greater BostonB t U i it B t 31 574 18 521 13 053 216 352 706 712 54 201 264 148Boston University Boston 31,574 18,521 13,053 216 352 706 712 54 201 264 148Harvard University Cambridge 25,778 9,968 15,810 154 194 0 925 25 24 25 37Northeastern University Boston 23,411 18,001 5,410 87 26 811 366 103 67 306 207Boston College Chestnut Hill 14,661 9,880 4,781 167 7 486 528 38 0 0 0UMass-Boston Boston 12,362 9,246 3,116 95 10 361 69 27 16 0 0MIT Cambridge 10,253 4,127 6,126 111 43 81 494 171 155 407 894Salem State College Salem 10,230 7,455 2,775 23 0 163 20 15 0 0 0Tufts University Medford 9,638 4,995 4,643 83 46 0 13 19 32 198 91Suffolk University Boston 8,862 5,214 3,648 26 0 358 428 3 9 2 0Lesley University Cambridge 6,981 1,793 5,188 0 8 45 17 0 0 0 0Bentley College Waltham 5,555 4,296 1,259 0 0 949 475 39 21 0 0Brandeis University Waltham 5,313 3,304 2,009 96 34 0 50 14 113 0 0Simmons College Boston 4,650 2,009 2,641 14 0 28 96 5 0 0 0Cambridge College Cambridge 4,637 934 3,703 0 0 28 159 0 0 0 0Emerson College Boston 4,324 3,402 922 0 0 112 121 0 0 0 0Wentworth Institute of Tech Boston 3,613 3,613 0 0 0 116 0 71 0 21 0Endicott College Beverly 3,507 1,886 1,621 0 0 132 66 8 0 0 0Babson College Wellesley 3,359 1,776 1,583 0 0 426 572 0 0 0 0Curry College Milton 3,073 2,765 308 3 0 101 0 3 0 0 0Wellesley College Wellesley 2,370 2,370 0 35 0 0 0 10 0 0 0Emmanuel College Boston 2,340 2,156 184 23 0 115 48 0 0 0 0
25 - 99 annual graduates100+ annual graduates
Source: U.S. Department of Education, Center for Education Statistics (2006-2007 school year) 41
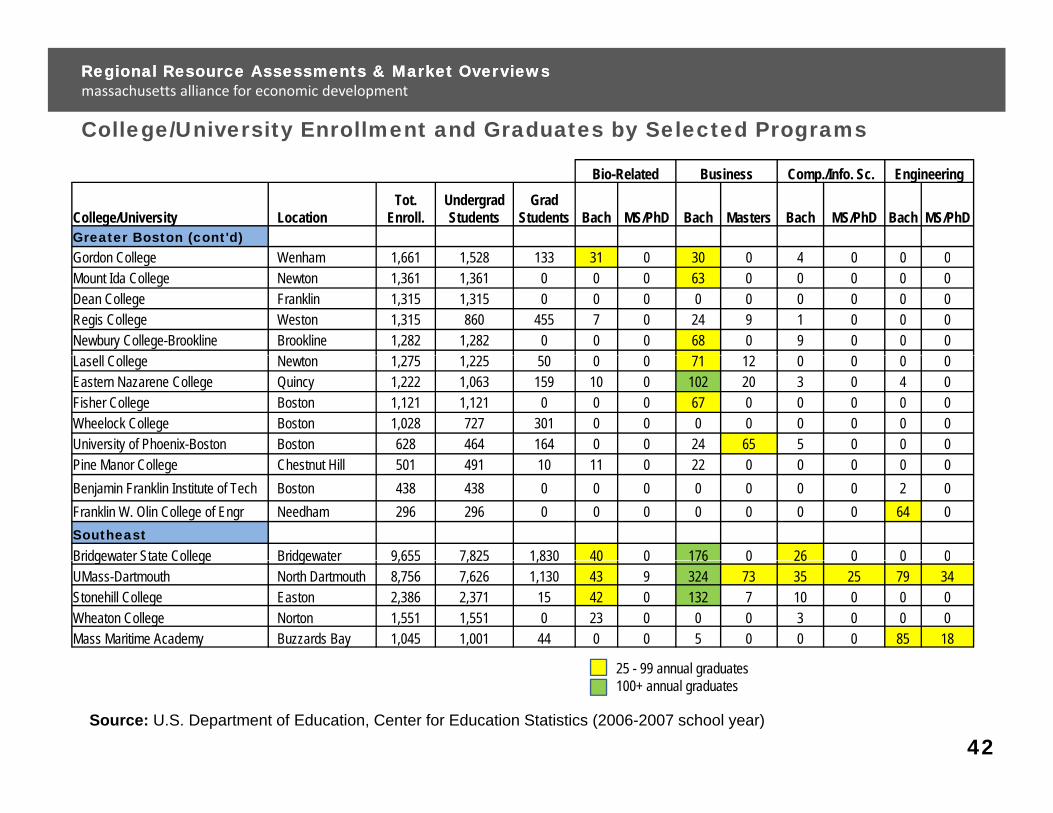
College/University Enrollment and Graduates by Selected Programs
Regional Resource Assessments & Market OverviewsRegional Resource Assessments & Market Overviewsmassachusetts alliance for economic development
Bio-Related Business Comp./Info. Sc. Engineering
College/University LocationTot.
Enroll.Undergrad Students
Grad Students Bach MS/PhD Bach Masters Bach MS/PhD Bach MS/PhD
Greater Boston (cont'd)G d C ll W h 1 661 1 528 133 31 0 30 0 4 0 0 0Gordon College Wenham 1,661 1,528 133 31 0 30 0 4 0 0 0Mount Ida College Newton 1,361 1,361 0 0 0 63 0 0 0 0 0Dean College Franklin 1,315 1,315 0 0 0 0 0 0 0 0 0Regis College Weston 1,315 860 455 7 0 24 9 1 0 0 0Newbury College-Brookline Brookline 1,282 1,282 0 0 0 68 0 9 0 0 0Lasell College Newton 1,275 1,225 50 0 0 71 12 0 0 0 0Eastern Nazarene College Quincy 1,222 1,063 159 10 0 102 20 3 0 4 0Fisher College Boston 1,121 1,121 0 0 0 67 0 0 0 0 0Wheelock College Boston 1,028 727 301 0 0 0 0 0 0 0 0University of Phoenix-Boston Boston 628 464 164 0 0 24 65 5 0 0 0Pine Manor College Chestnut Hill 501 491 10 11 0 22 0 0 0 0 0Benjamin Franklin Institute of Tech Boston 438 438 0 0 0 0 0 0 0 2 0Franklin W. Olin College of Engr Needham 296 296 0 0 0 0 0 0 0 64 0SoutheastBridgewater State College Bridgewater 9,655 7,825 1,830 40 0 176 0 26 0 0 0Bridgewater State College Bridgewater 9,655 7,825 1,830 40 0 176 0 26 0 0 0UMass-Dartmouth North Dartmouth 8,756 7,626 1,130 43 9 324 73 35 25 79 34Stonehill College Easton 2,386 2,371 15 42 0 132 7 10 0 0 0Wheaton College Norton 1,551 1,551 0 23 0 0 0 3 0 0 0Mass Maritime Academy Buzzards Bay 1,045 1,001 44 0 0 5 0 0 0 85 18
25 99 l d25 - 99 annual graduates100+ annual graduates
Source: U.S. Department of Education, Center for Education Statistics (2006-2007 school year)
42
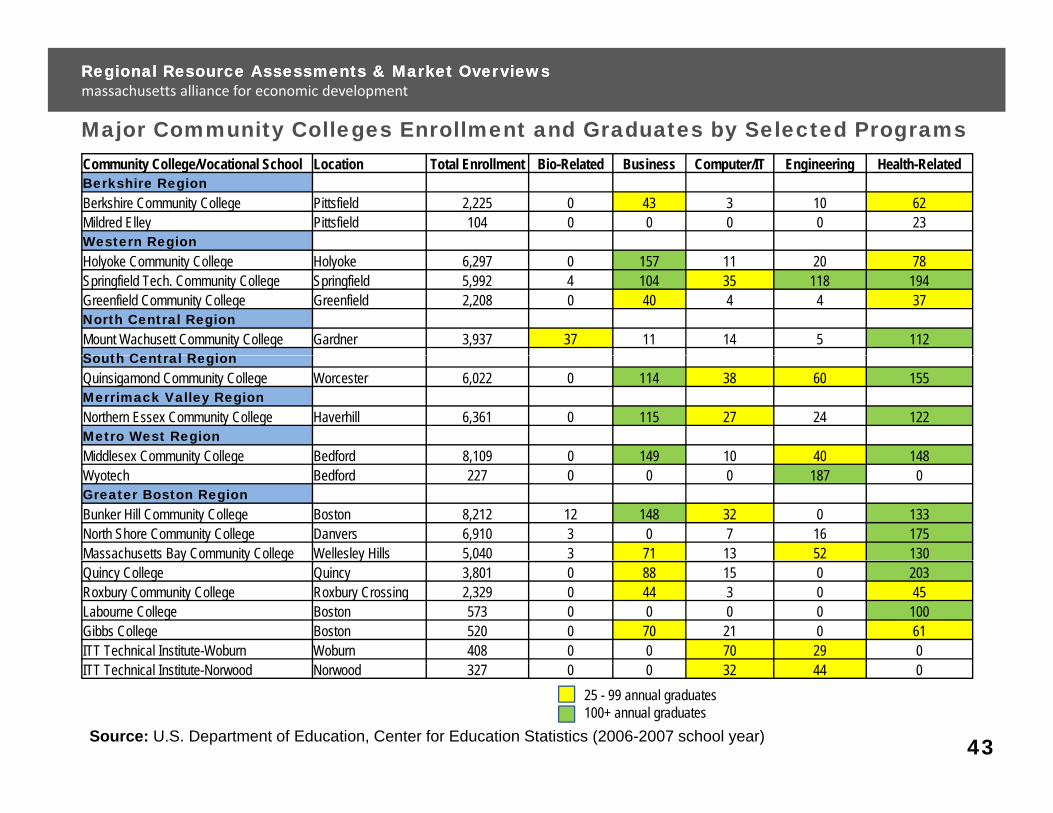
Major Community Colleges Enrollment and Graduates by Selected Programs
Regional Resource Assessments & Market OverviewsRegional Resource Assessments & Market Overviewsmassachusetts alliance for economic development
Community College/Vocational School Location Total Enrollment Bio-Related Business Computer/IT Engineering Health-RelatedBerkshire RegionBerkshire Community College Pittsfield 2,225 0 43 3 10 62Mildred Elley Pittsfield 104 0 0 0 0 23Western RegionHolyoke Community College Holyoke 6,297 0 157 11 20 78Springfield Tech. Community College Springfield 5,992 4 104 35 118 194Greenfield Community College Greenfield 2,208 0 40 4 4 37North Central RegionMount Wachusett Community College Gardner 3,937 37 11 14 5 112S th C t l R iSouth Central RegionQuinsigamond Community College Worcester 6,022 0 114 38 60 155Merrimack Valley RegionNorthern Essex Community College Haverhill 6,361 0 115 27 24 122Metro West RegionMiddlesex Community College Bedford 8 109 0 149 10 40 148Middlesex Community College Bedford 8,109 0 149 10 40 148Wyotech Bedford 227 0 0 0 187 0Greater Boston RegionBunker Hill Community College Boston 8,212 12 148 32 0 133North Shore Community College Danvers 6,910 3 0 7 16 175Massachusetts Bay Community College Wellesley Hills 5,040 3 71 13 52 130y y g yQuincy College Quincy 3,801 0 88 15 0 203Roxbury Community College Roxbury Crossing 2,329 0 44 3 0 45Labourne College Boston 573 0 0 0 0 100Gibbs College Boston 520 0 70 21 0 61ITT Technical Institute-Woburn Woburn 408 0 0 70 29 0ITT Technical Institute-Norwood Norwood 327 0 0 32 44 0
25 - 99 annual graduates100+ annual graduates
Source: U.S. Department of Education, Center for Education Statistics (2006-2007 school year) 43
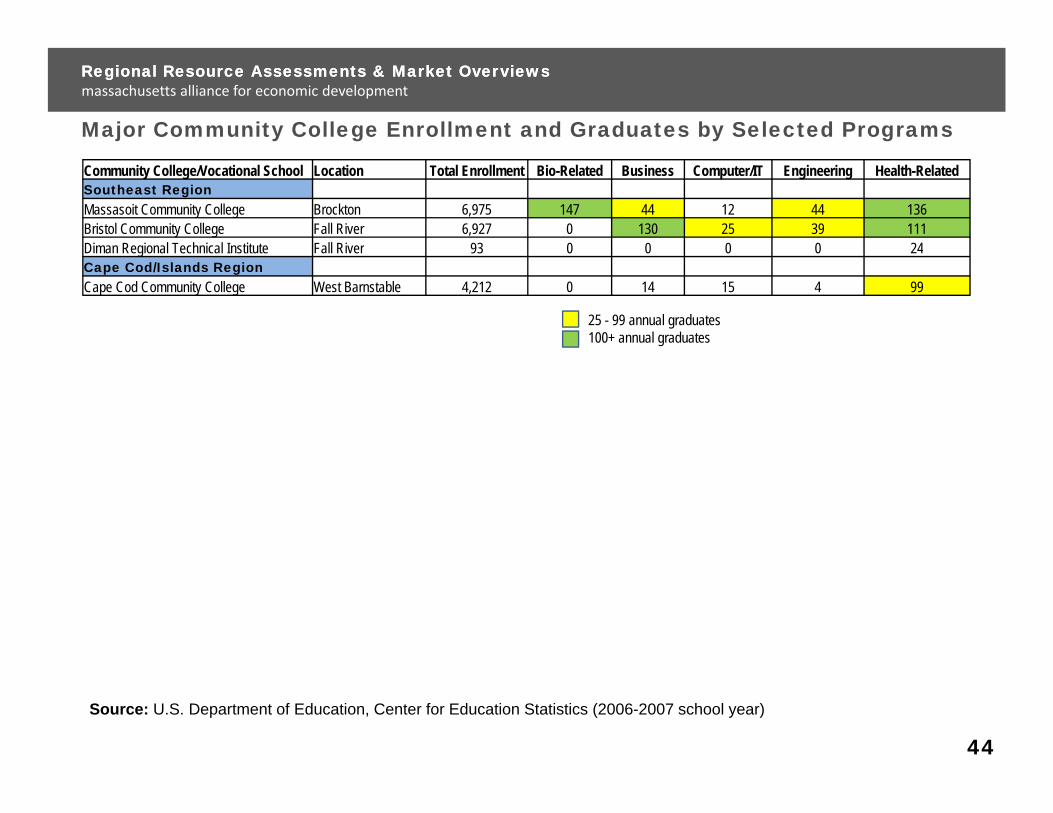
Major Community College Enrollment and Graduates by Selected Programs
Regional Resource Assessments & Market OverviewsRegional Resource Assessments & Market Overviewsmassachusetts alliance for economic development
Community College/Vocational School Location Total Enrollment Bio-Related Business Computer/IT Engineering Health-RelatedSoutheast RegionMassasoit Community College Brockton 6,975 147 44 12 44 136Bristol Community College Fall River 6,927 0 130 25 39 111Diman Regional Technical Institute Fall River 93 0 0 0 0 24Diman Regional Technical Institute Fall River 93 0 0 0 0 24Cape Cod/Islands RegionCape Cod Community College West Barnstable 4,212 0 14 15 4 99
25 - 99 annual graduates100+ annual graduates
Source: U.S. Department of Education, Center for Education Statistics (2006-2007 school year)
44
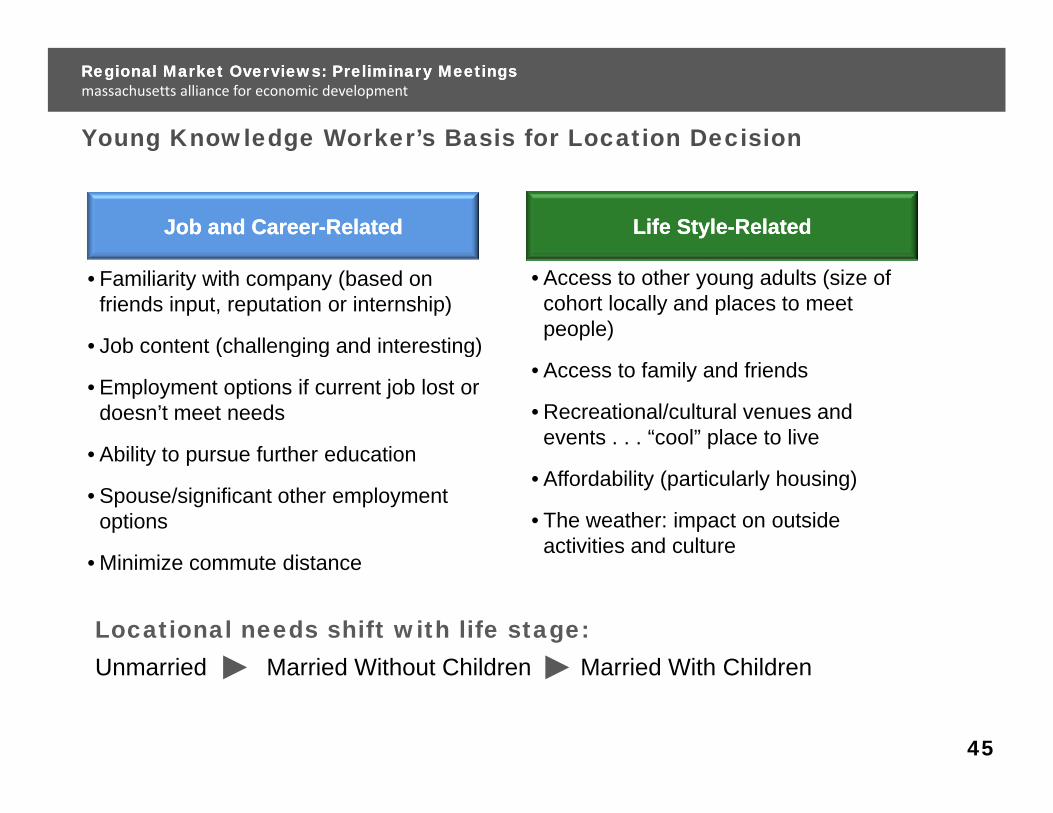
Young Knowledge Worker’s Basis for Location Decision
Regional Market Overviews: Preliminary MeetingsRegional Market Overviews: Preliminary Meetingsmassachusetts alliance for economic development
Job and CareerJob and Career--RelatedRelated Life StyleLife Style--RelatedRelated
g g
• Familiarity with company (based on friends input, reputation or internship)
• Job content (challenging and interesting)
• Access to other young adults (size of cohort locally and places to meet people)
( g g g)
• Employment options if current job lost or doesn’t meet needs
• Ability to pursue further education
• Access to family and friends
• Recreational/cultural venues and events . . . “cool” place to live
Ability to pursue further education
• Spouse/significant other employment options
• Minimize commute distance
• Affordability (particularly housing)
• The weather: impact on outside activities and culture
• Minimize commute distance
Locational needs shift with life stage:Unmarried Married Without Children Married With ChildrenUnmarried Married Without Children Married With Children
45
Regional Resource Assessments & Market OverviewsRegional Resource Assessments & Market Overviewsmassachusetts alliance for economic development
Transportation pLimited Access Highways and Commercial Airports
46
Regional Resource Assessments & Market OverviewsRegional Resource Assessments & Market Overviewsmassachusetts alliance for economic development
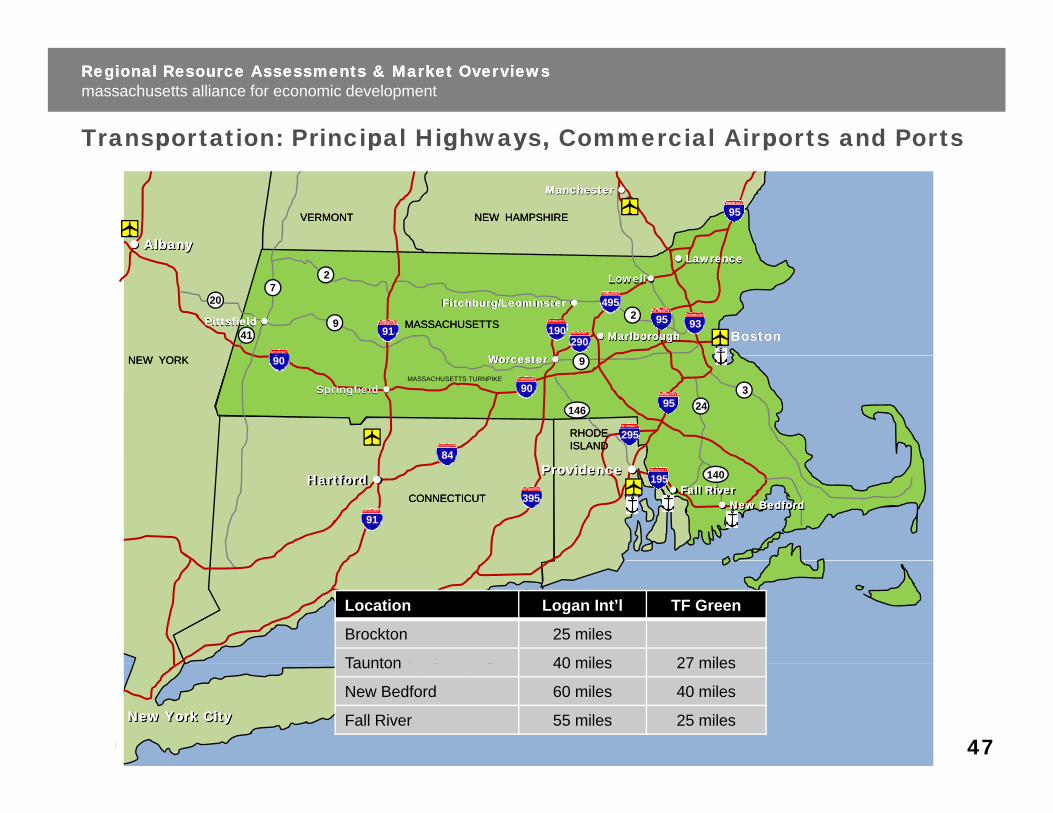
Transportation: Principal Highways, Commercial Airports and Portsp p g y , p
VERMONTVERMONT NEW HAMPSHIRENEW HAMPSHIRE
AlbanyAlbany
Manchester
AlbanyAlbany
Manchester Manchester
95
MASSACHUSETTSMASSACHUSETTS
W t W t
BostonBostonBostonBostonPittsfield
Fitchburg/Leominster Fitchburg/Leominster Fitchburg/Leominster Fitchburg/Leominster
LowellLowell
LawrenceLawrenceLawrenceLawrence
MarlboroughMarlboroughMarlboroughMarlborough29091
495
9319095Pittsfield Pittsfield 9
720
41
2
2
NEW YORKNEW YORK
Springfield
Worcester Worcester Worcester MASSACHUSETTS TURNPIKE
Springfield
90
90
84
95
9
324146
RHODERHODEISLANDISLAND
295
CONNECTICUTCONNECTICUT
Providence Fall RiverFall RiverFall River
New BedfordNew BedfordNew BedfordNew Bedford
Hartford Hartford
84
91
395
195 140Providence Providence
Location Logan Int’l TF Green
Brockton 25 miles
Taunton 40 miles 27 miles
New York CityNew York CityNew York CityNew York City
Taunton 40 miles 27 miles
New Bedford 60 miles 40 miles
Fall River 55 miles 25 miles
47
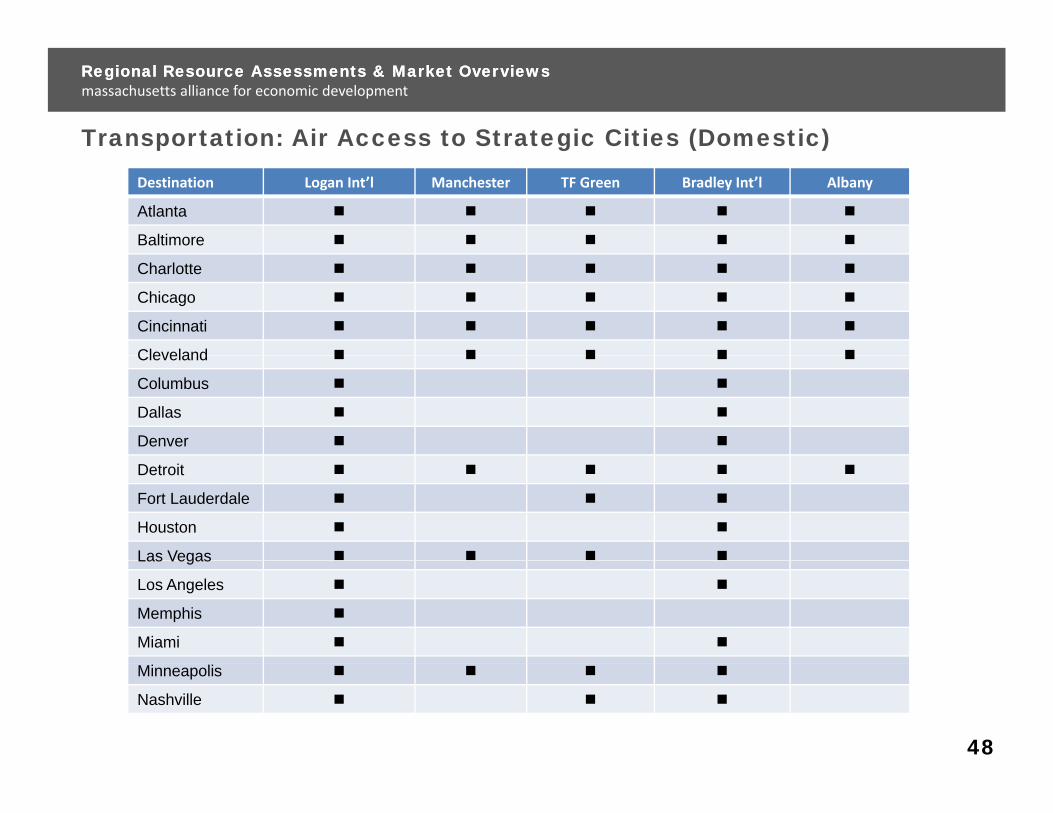
Transportation: Air Access to Strategic Cities (Domestic)
Regional Resource Assessments & Market OverviewsRegional Resource Assessments & Market Overviewsmassachusetts alliance for economic development
p g ( )Destination Logan Int’l Manchester TF Green Bradley Int’l Albany
Atlanta
Baltimore
Charlotte
Chicago
Cincinnati
ClevelandCleveland
Columbus
Dallas
Denver
Detroit
Fort Lauderdale
Houston
Las VegasLas Vegas
Los Angeles
Memphis
Miami
Minneapolis
Nashville
48
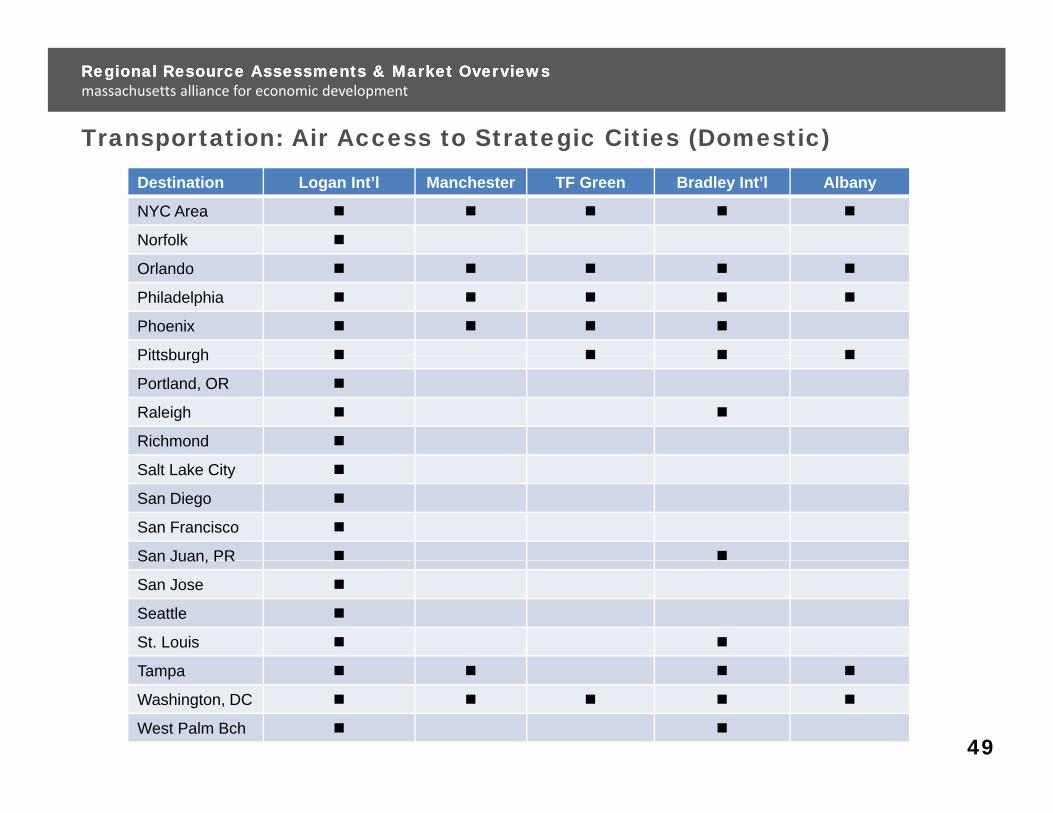
Transportation: Air Access to Strategic Cities (Domestic)
Regional Resource Assessments & Market OverviewsRegional Resource Assessments & Market Overviewsmassachusetts alliance for economic development
p g ( )
Destination Logan Int’l Manchester TF Green Bradley Int’l Albany
NYC Area
Norfolk
Orlando
Philadelphia
Phoenix
PittsburghPittsburgh
Portland, OR
Raleigh
Richmond
Salt Lake City
San Diego
San Francisco
San Juan, PRSan Juan, PR
San Jose
Seattle
St. Louis
Tampa
Washington, DC
West Palm Bch49
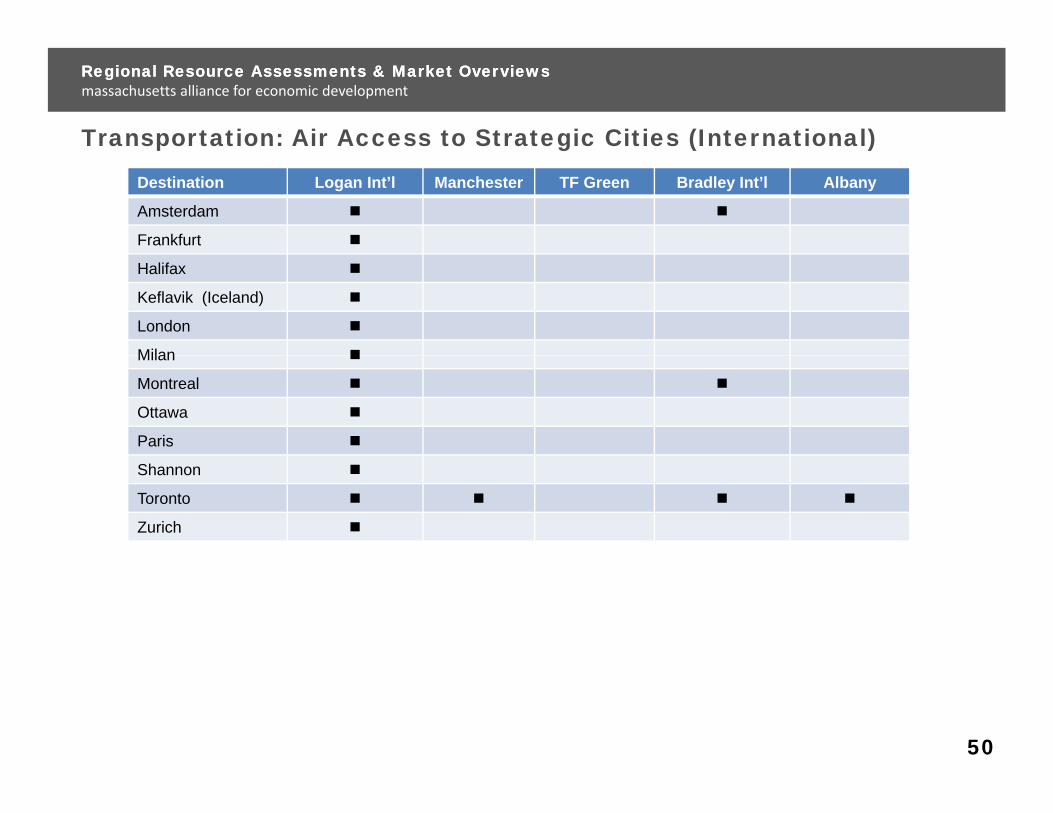
Transportation: Air Access to Strategic Cities (International)
Regional Resource Assessments & Market OverviewsRegional Resource Assessments & Market Overviewsmassachusetts alliance for economic development
p g ( )
Destination Logan Int’l Manchester TF Green Bradley Int’l Albany
Amsterdam
Frankfurt
Halifax
Keflavik (Iceland)
London
MilanMilan
Montreal
Ottawa
Paris
Shannon
Toronto
Zurich
50
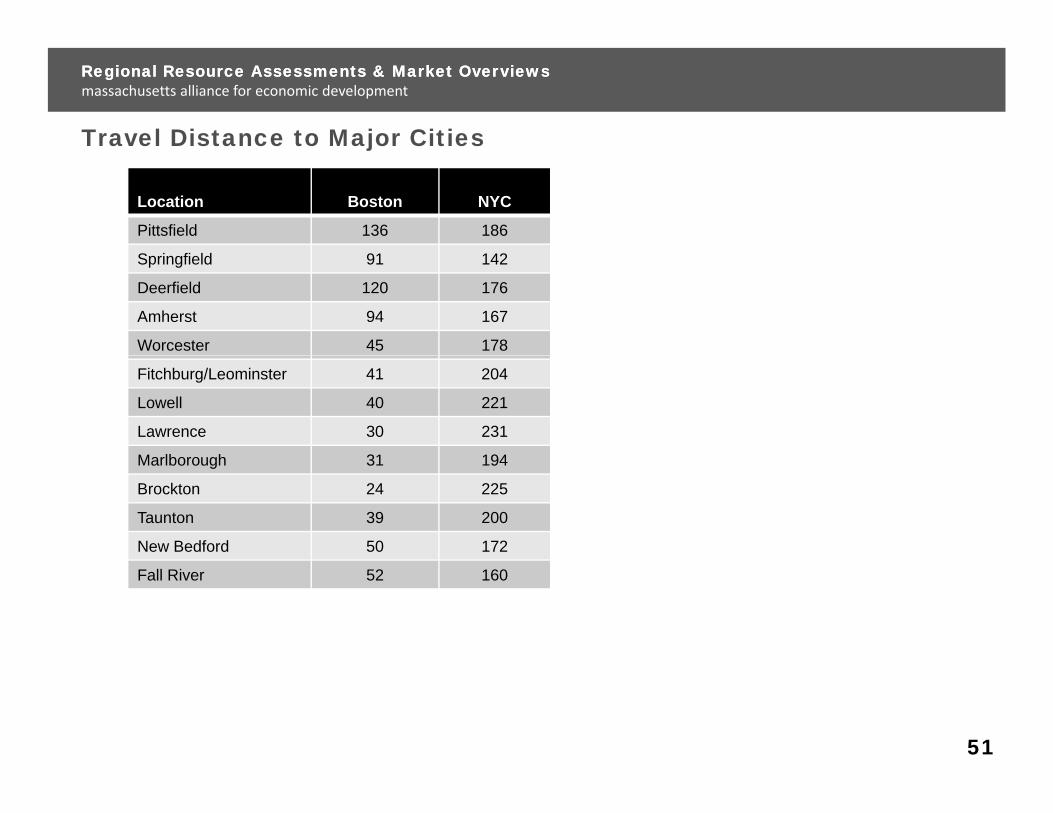
Travel Distance to Major Cities
Regional Resource Assessments & Market OverviewsRegional Resource Assessments & Market Overviewsmassachusetts alliance for economic development
j
Location Boston NYC
Pittsfield 136 186
S fSpringfield 91 142
Deerfield 120 176
Amherst 94 167
Worcester 45 178
Fitchburg/Leominster 41 204
Lowell 40 221
Lawrence 30 231
Marlborough 31 194Marlborough 31 194
Brockton 24 225
Taunton 39 200
New Bedford 50 172
Fall River 52 160
51
Regional Resource Assessments & Market OverviewsRegional Resource Assessments & Market Overviewsmassachusetts alliance for economic development
Real Estate and Utilities
52

Site Requirements/Potential Concerns vs. Type of Operation
Regional Resource Assessments & Market OverviewsRegional Resource Assessments & Market Overviewsmassachusetts alliance for economic development
Description Office R&D Manufacturing Distribution
Level of Readiness Required Back Office: within 3 mos.HQ: may opt to build in 12-18 mos.
Within 3 mos. or build on fast track (9-12 mos.)
Within 3 mos. or build on fast track (9-12 mos.)
Within 3 mos.
Overall Image of Site Park and Important: reflects on company Important: reflects on company Varies VariesOverall Image of Site, Park and Building
Important: reflects on company image and helps attract talent.
Important: reflects on company image and helps attract talent.
Varies Varies
Specialized Space Required Meeting/Training Spaces Labs/Pilot Facilities Certain Processes
Local Amenities (restaurants, shopping, daycare, etc.) Important Important Variesg y )
Adequate Parking (urban area) Important Important
Truck Traffic Varies Heavy
Access to Interstate Commuter accessBrand exposure for some
Commuter access Truck access (varies by type and size of operation)
Track accessp
Security an issue for othersyp p )
Public Transportation Important near metro areas Important near metro areas Important for low income employees
Rail Access Some operations Some operations
Reuse Potential for Community High Varies Varies High
Ability for Company to Easily Liquidate Facility
Back Office: LeaseHQ: Lease or own (harder to liquidate due to specialized layouts)
Tend not to build with liquidation as a consideration
Tend not to build with liquidation as a consideration
Tend to be generic buildings that are easier to liquidate
Sewer/Water Requirements Water quality an issue Volume varies
Cost of Energy Moderate Moderate Critical issue Moderate
Access to University R&D Important if HQ and R&D are co-located
Local and distance access to university R&D partners
Having access to technical support 53
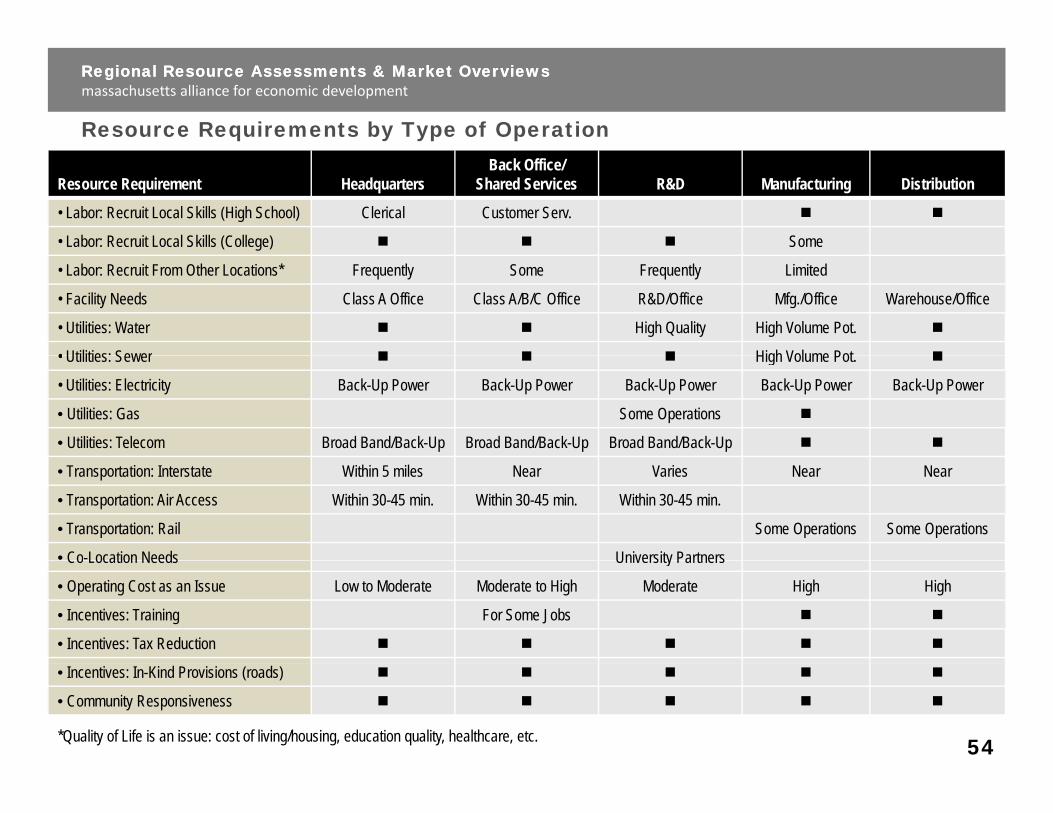
Resource Requirements by Type of Operation
Regional Resource Assessments & Market OverviewsRegional Resource Assessments & Market Overviewsmassachusetts alliance for economic development
Resource Requirement HeadquartersBack Office/
Shared Services R&D Manufacturing Distribution
• Labor: Recruit Local Skills (High School) Clerical Customer Serv.
• Labor: Recruit Local Skills (College) Some
• Labor: Recruit From Other Locations* Frequently Some Frequently Limited
• Facility Needs Class A Office Class A/B/C Office R&D/Office Mfg./Office Warehouse/Office
• Utilities: Water High Quality High Volume Pot.
• Utilities: Sewer High Volume Pot• Utilities: Sewer High Volume Pot.
• Utilities: Electricity Back-Up Power Back-Up Power Back-Up Power Back-Up Power Back-Up Power
• Utilities: Gas Some Operations
• Utilities: Telecom Broad Band/Back-Up Broad Band/Back-Up Broad Band/Back-Up
• Transportation: Interstate Within 5 miles Near Varies Near Near
• Transportation: Air Access Within 30-45 min. Within 30-45 min. Within 30-45 min.
• Transportation: Rail Some Operations Some Operations
• Co-Location Needs University PartnersCo Location Needs University Partners
• Operating Cost as an Issue Low to Moderate Moderate to High Moderate High High
• Incentives: Training For Some Jobs
• Incentives: Tax Reduction
• Incentives: In-Kind Provisions (roads)
• Community Responsiveness
*Quality of Life is an issue: cost of living/housing, education quality, healthcare, etc. 54
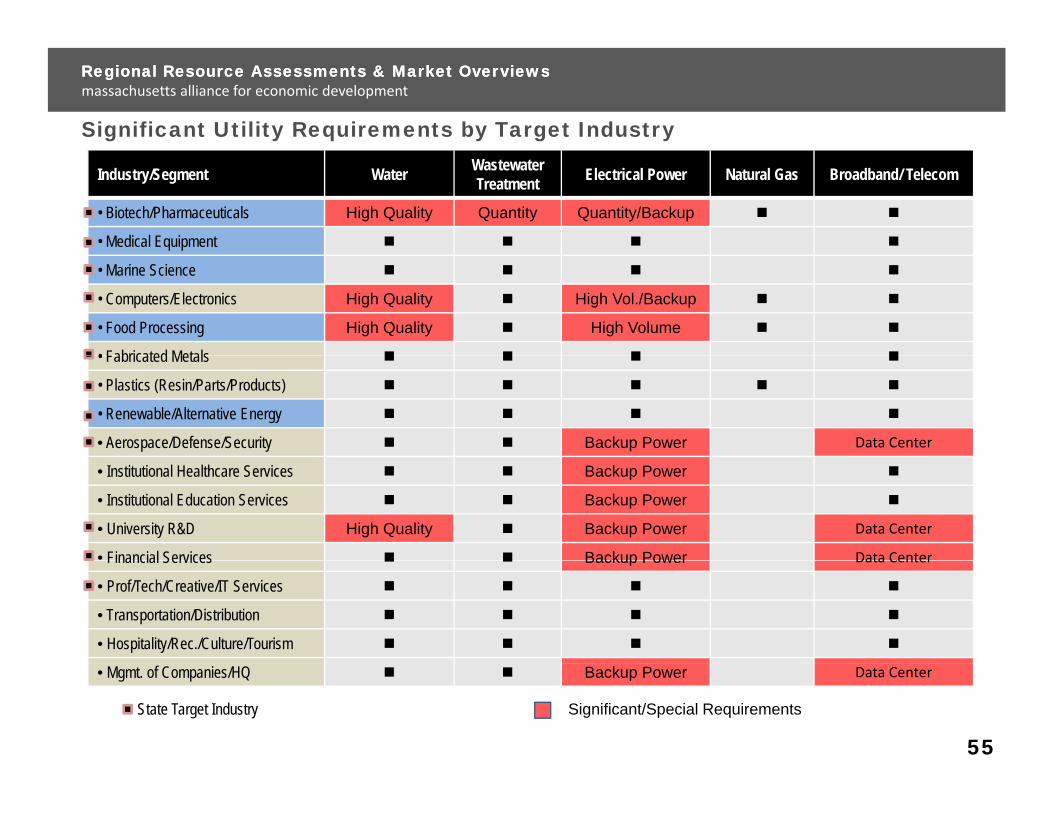
Significant Utility Requirements by Target Industry
Regional Resource Assessments & Market OverviewsRegional Resource Assessments & Market Overviewsmassachusetts alliance for economic development
Industry/Segment Water Wastewater Treatment Electrical Power Natural Gas Broadband/ Telecom
• Biotech/Pharmaceuticals High Quality Quantity Quantity/Backup
• Medical Equipment
• Marine Science
• Computers/Electronics High Quality High Vol./Backup
• Food Processing High Quality High Volume
• Fabricated Metals• Fabricated Metals
• Plastics (Resin/Parts/Products)
• Renewable/Alternative Energy
• Aerospace/Defense/Security Backup Power Data Center
• Institutional Healthcare Services Backup Power
• Institutional Education Services Backup Power
• University R&D High Quality Backup Power Data Center
• Financial Services Backup Power Data CenterFinancial Services Backup Power Data Center
• Prof/Tech/Creative/IT Services
• Transportation/Distribution
• Hospitality/Rec./Culture/Tourism
• Mgmt. of Companies/HQ Backup Power Data Center
State Target Industry Significant/Special Requirements
55
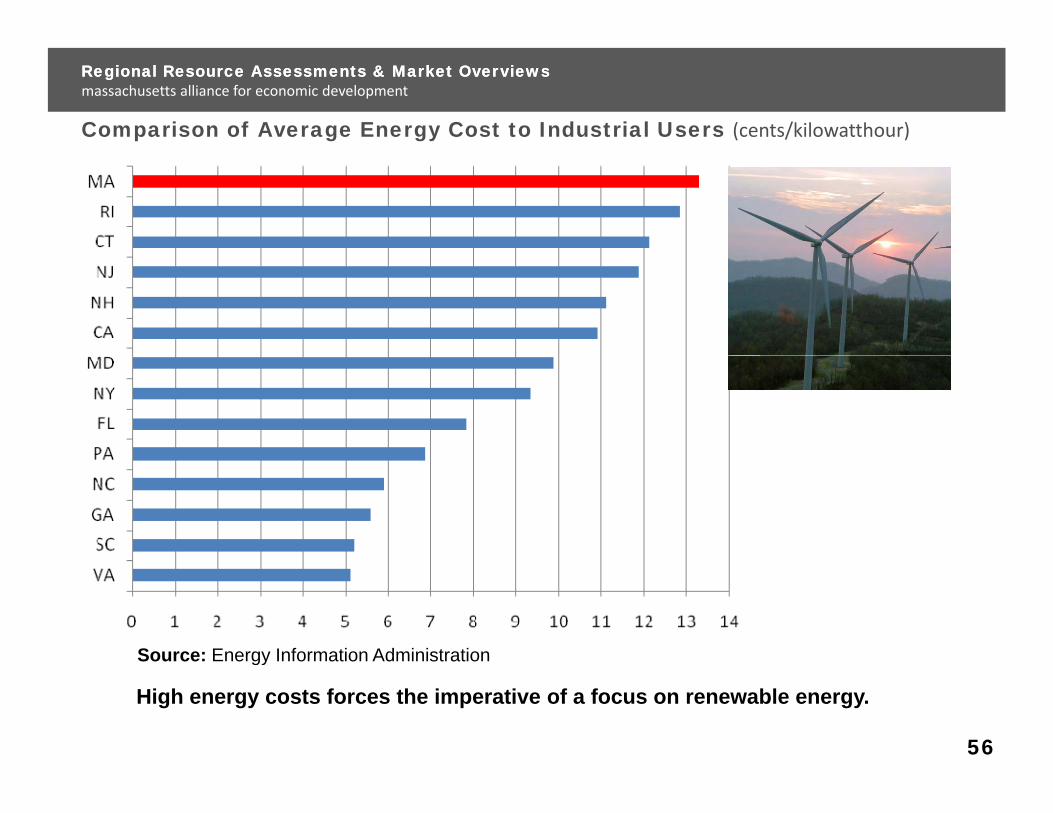
Comparison of Average Energy Cost to Industrial Users (cents/kilowatthour)
Regional Resource Assessments & Market OverviewsRegional Resource Assessments & Market Overviewsmassachusetts alliance for economic development
Source: Energy Information Administrationgy
High energy costs forces the imperative of a focus on renewable energy.
56
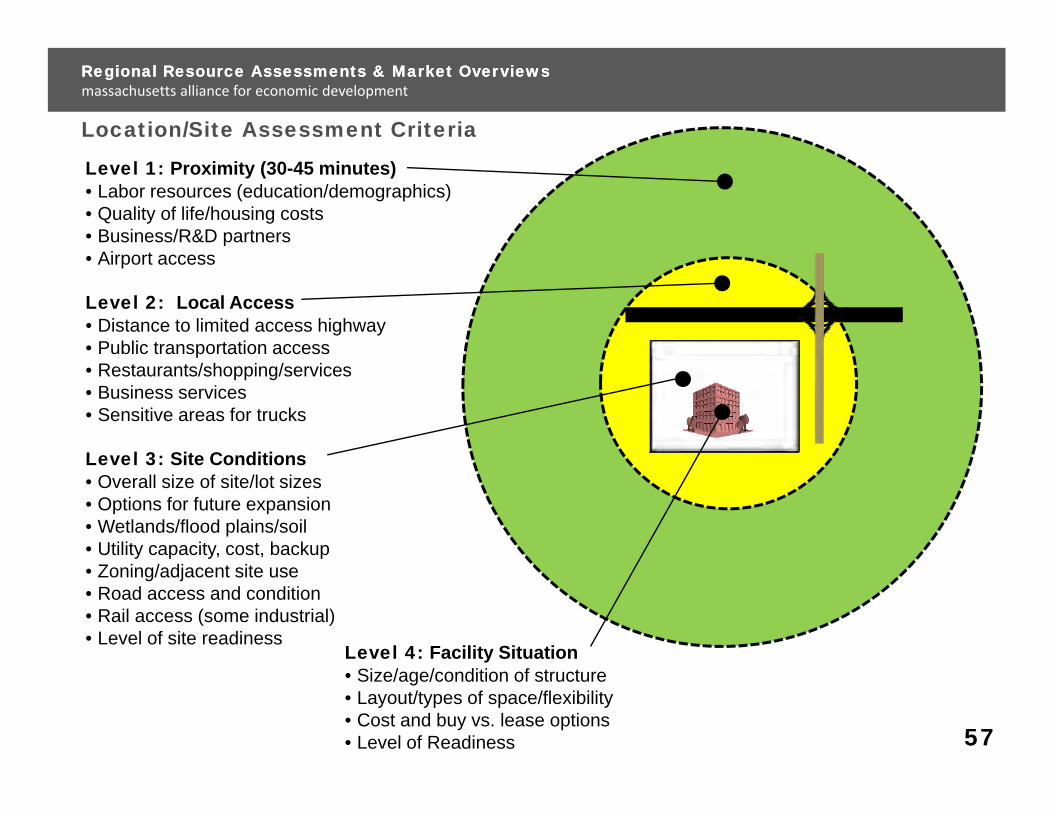
Location/Site Assessment Criteria
Regional Resource Assessments & Market OverviewsRegional Resource Assessments & Market Overviewsmassachusetts alliance for economic development
Level 1: Proximity (30-45 minutes)• Labor resources (education/demographics)• Quality of life/housing costs• Business/R&D partners
Ai t• Airport access
Level 2: Local Access• Distance to limited access highway• Public transportation accessp• Restaurants/shopping/services• Business services• Sensitive areas for trucks
Level 3: Site ConditionsLevel 3: Site Conditions• Overall size of site/lot sizes• Options for future expansion• Wetlands/flood plains/soil• Utility capacity, cost, backup• Zoning/adjacent site use• Road access and condition • Rail access (some industrial)• Level of site readiness
Level 4: Facility Situation• Size/age/condition of structure• Layout/types of space/flexibility• Cost and buy vs. lease options• Level of Readiness 57
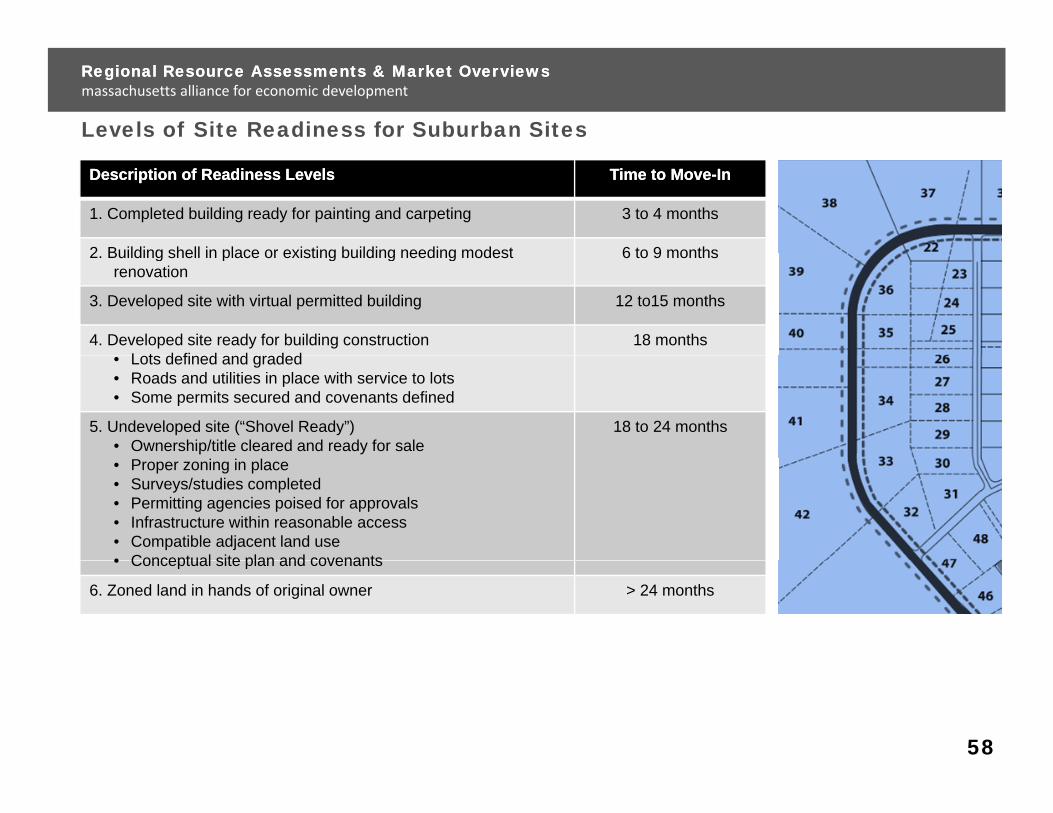
Levels of Site Readiness for Suburban Sites
Regional Resource Assessments & Market OverviewsRegional Resource Assessments & Market Overviewsmassachusetts alliance for economic development
Description of Readiness LevelsDescription of Readiness Levels Time to MoveTime to Move--InIn
1. Completed building ready for painting and carpeting 3 to 4 months
2 Building shell in place or existing building needing modest 6 to 9 months2. Building shell in place or existing building needing modest renovation
6 to 9 months
3. Developed site with virtual permitted building 12 to15 months
4. Developed site ready for building construction L t d fi d d d d
18 months• Lots defined and graded• Roads and utilities in place with service to lots• Some permits secured and covenants defined
5. Undeveloped site (“Shovel Ready”)• Ownership/title cleared and ready for sale
18 to 24 months
• Proper zoning in place• Surveys/studies completed• Permitting agencies poised for approvals• Infrastructure within reasonable access• Compatible adjacent land use• Conceptual site plan and covenants• Conceptual site plan and covenants
6. Zoned land in hands of original owner > 24 months
58
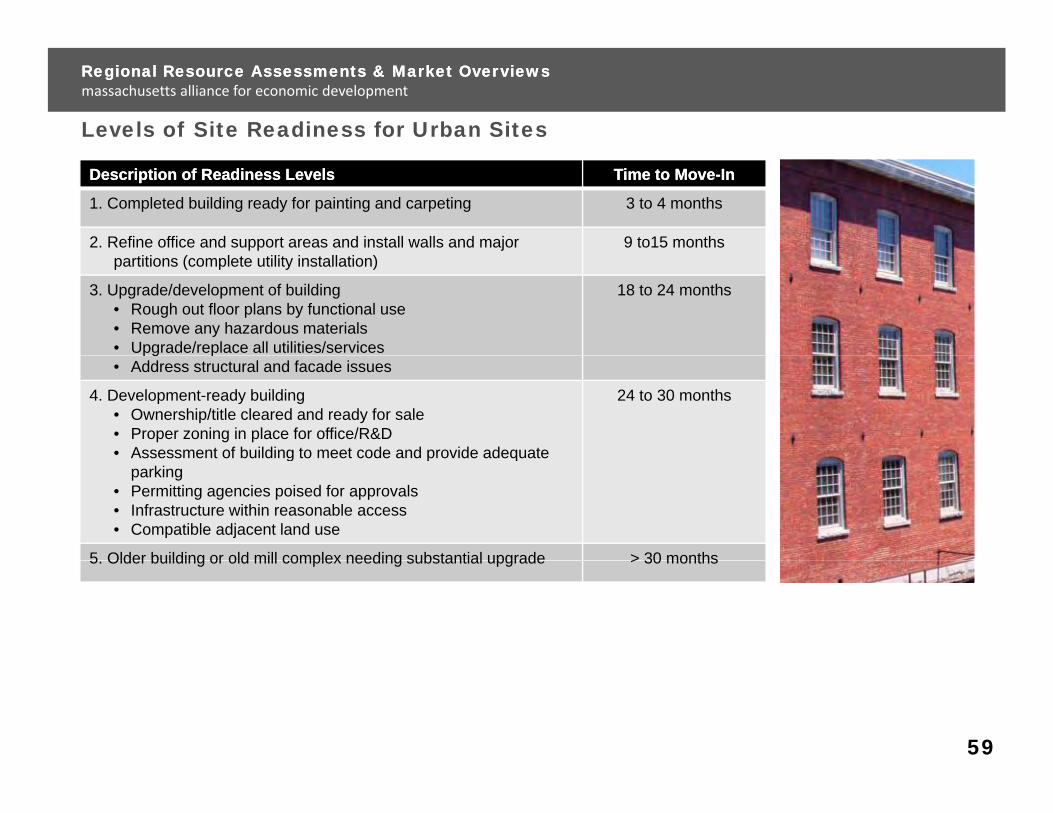
Levels of Site Readiness for Urban Sites
Regional Resource Assessments & Market OverviewsRegional Resource Assessments & Market Overviewsmassachusetts alliance for economic development
Description of Readiness LevelsDescription of Readiness Levels Time to MoveTime to Move--InIn
1. Completed building ready for painting and carpeting 3 to 4 months
2. Refine office and support areas and install walls and major 9 to15 monthspartitions (complete utility installation)
3. Upgrade/development of building • Rough out floor plans by functional use• Remove any hazardous materials• Upgrade/replace all utilities/services
18 to 24 months
pg p• Address structural and facade issues
4. Development-ready building• Ownership/title cleared and ready for sale• Proper zoning in place for office/R&D• Assessment of building to meet code and provide adequate
24 to 30 months
Assessment of building to meet code and provide adequate parking
• Permitting agencies poised for approvals• Infrastructure within reasonable access• Compatible adjacent land use
5 Older building or old mill complex needing substantial upgrade > 30 months5. Older building or old mill complex needing substantial upgrade > 30 months
59
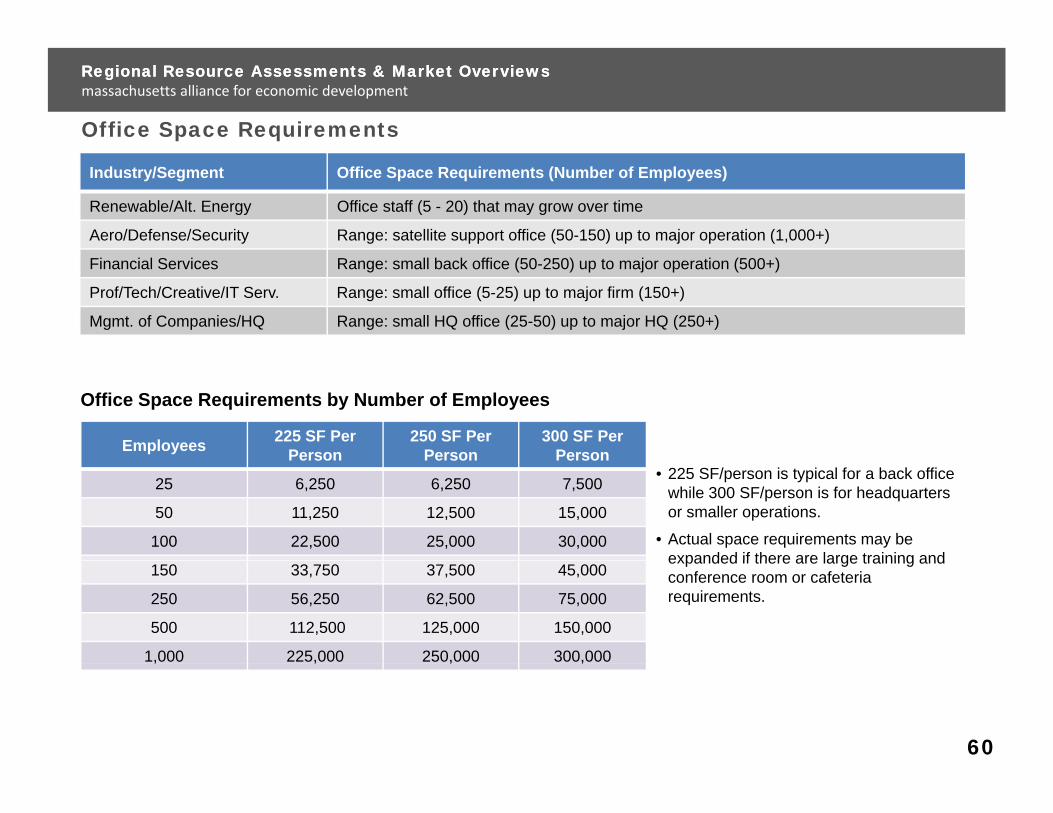
Office Space Requirements
Regional Resource Assessments & Market OverviewsRegional Resource Assessments & Market Overviewsmassachusetts alliance for economic development
Industry/Segment Office Space Requirements (Number of Employees)
Renewable/Alt. Energy Office staff (5 - 20) that may grow over time
Aero/Defense/Security Range: satellite support office (50-150) up to major operation (1,000+)
Financial Services Range: small back office (50-250) up to major operation (500+)
Prof/Tech/Creative/IT Serv. Range: small office (5-25) up to major firm (150+)
Mgmt. of Companies/HQ Range: small HQ office (25-50) up to major HQ (250+)
Employees 225 SF Per Person
250 SF Per Person
300 SF Per Person
Office Space Requirements by Number of Employees
Person Person Person
25 6,250 6,250 7,500
50 11,250 12,500 15,000
100 22,500 25,000 30,000
• 225 SF/person is typical for a back office while 300 SF/person is for headquarters or smaller operations.
• Actual space requirements may be expanded if there are large training and
150 33,750 37,500 45,000
250 56,250 62,500 75,000
500 112,500 125,000 150,000
1,000 225,000 250,000 300,000
expanded if there are large training and conference room or cafeteria requirements.
, , , ,
60
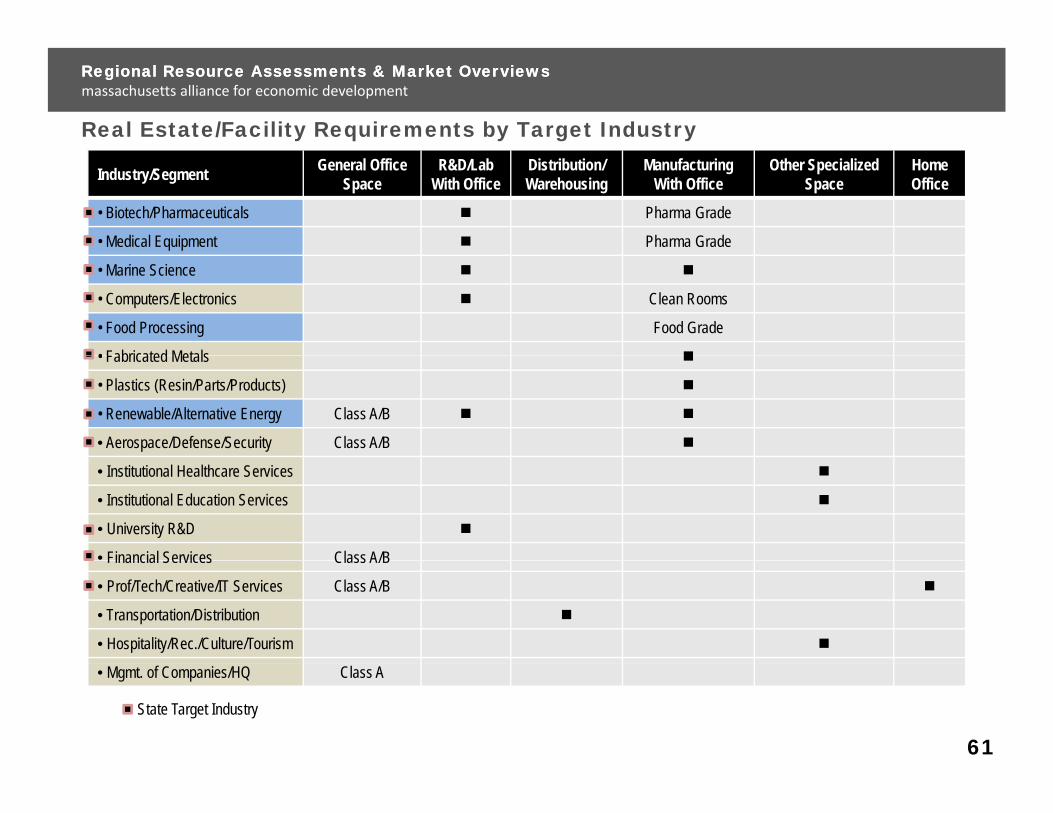
Real Estate/Facility Requirements by Target Industry
Regional Resource Assessments & Market OverviewsRegional Resource Assessments & Market Overviewsmassachusetts alliance for economic development
Industry/Segment General Office Space
R&D/Lab With Office
Distribution/ Warehousing
Manufacturing With Office
Other Specialized Space
Home Office
• Biotech/Pharmaceuticals Pharma Grade
• Medical Equipment Pharma Grade
• Marine Science
• Computers/Electronics Clean Rooms
• Food Processing Food Grade
• Fabricated Metals• Fabricated Metals
• Plastics (Resin/Parts/Products)
• Renewable/Alternative Energy Class A/B
• Aerospace/Defense/Security Class A/B
• Institutional Healthcare Services
• Institutional Education Services
• University R&D
• Financial Services Class A/BFinancial Services Class A/B
• Prof/Tech/Creative/IT Services Class A/B
• Transportation/Distribution
• Hospitality/Rec./Culture/Tourism
• Mgmt. of Companies/HQ Class A
State Target Industry
61

Regional Market Overviews: Preliminary MeetingsRegional Market Overviews: Preliminary Meetingsmassachusetts alliance for economic development
Location Selection Decision Process by Prospective Companies
1. Screen “A”G hi f
y p p
> Geographic preference> Metro area size preference
2. Screen “B” . . . Value Proposition> Logistic positioning (time of travel)g p g ( )> Air access (cost and flights)> Industry presence> Workforce (quantity/quality of skills)> Education and training resources> Overall costs (real estate labor> Overall costs (real estate, labor,
taxes, insurance, energy, etc.)> Ability to recruit staff to an area
(quality of life/cost of housing)
3. On-Site Tour and Incentive Analysis> Availability of real estate> Costs and incentives analysis
4 Final Decision4. Final Decision
62
Regional Resource Assessments & Market OverviewsRegional Resource Assessments & Market Overviewsmassachusetts alliance for economic development
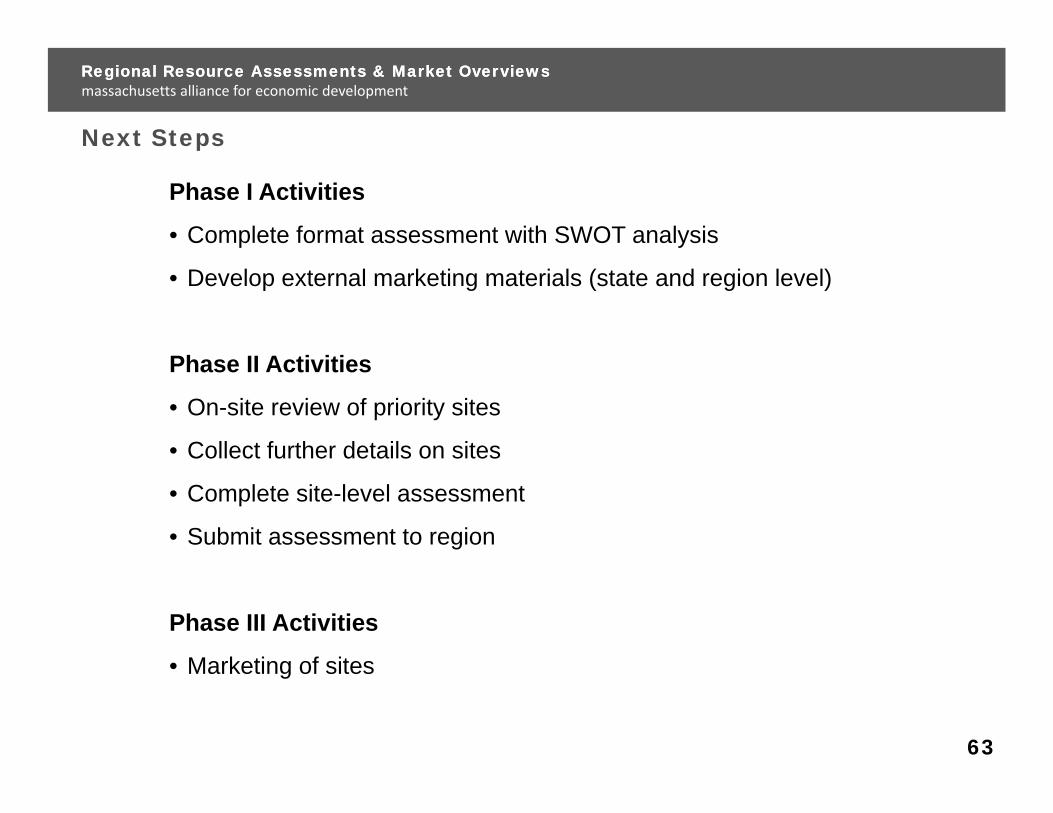
Next Stepsp
Phase I Activities
• Complete format assessment with SWOT analysis
• Develop external marketing materials (state and region level)
Ph II A ti itiPhase II Activities
• On-site review of priority sites
• Collect further details on sitesCollect further details on sites
• Complete site-level assessment
• Submit assessment to region
Phase III Activities
• Marketing of sites• Marketing of sites
63