regional police collaboration using gis and crime analysis ......regional police collaboration and...
TRANSCRIPT

Regional Police Collaboration and
Community Engagement Using GIS and Crime Analysis Dashboards
Jason McKinley City of Ann Arbor
Matthew Brown San Diego Harbor Police

Data Analytics and Dashboard Technology Help Police Cut Crime
• CLEMIS PROJECT CASE STUDY: • A dashboard project is now actively underway to deploy a
turnkey dashboard solution implemented by The Omega Group in partnership with ESRI, CLEMIS and member agencies. All participating CLEMIS agencies (nearly 90) have seamless access to analyze near real-time crime data in exciting new ways across the political boundaries criminals typically like to ignore.

Data Analytics and Dashboard Technology Help Police Cut Crime
PROJECT VISION STATEMENT: Fully incorporate into Police operations integrated "best crime analysis practices" through the use of a dashboard in an effort to both:
• analyze crime trends and
• strategically deploy critical police resources
PROJECT BACKGROUND: Police agencies across southeast Michigan have been exploring ways to better analyze crime trends and strategically deploy critical police resources. The challenge is in dealing with large volumes of data dispersed across multiple agencies, that are difficult to convert into actionable information.
Data Analytics and Dashboard Technology Help Police Cut Crime
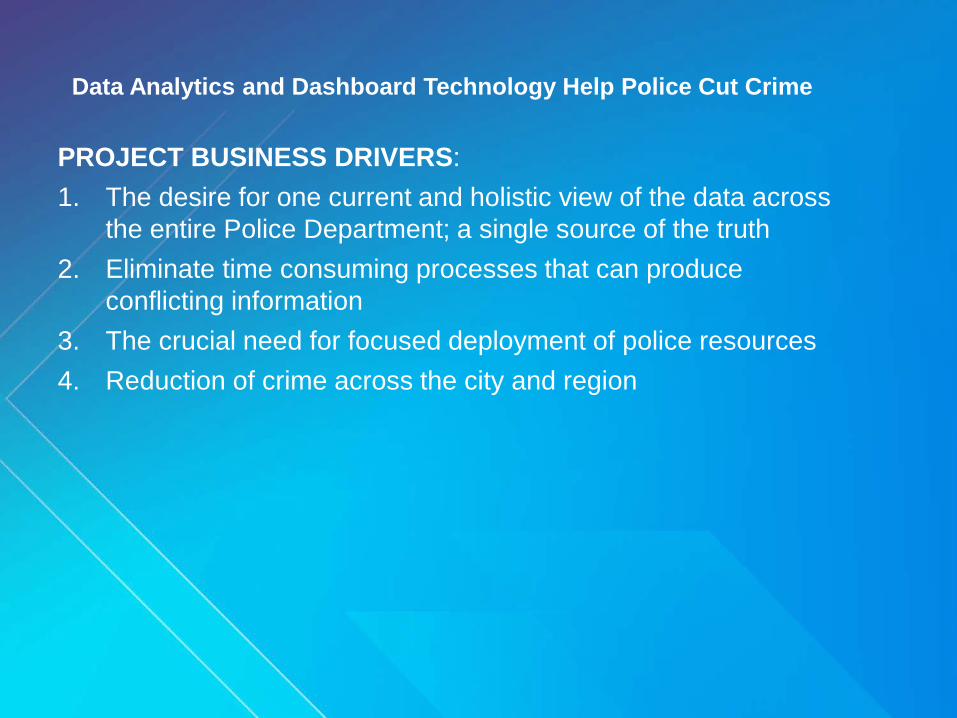
PROJECT BUSINESS DRIVERS: 1. The desire for one current and holistic view of the data across
the entire Police Department; a single source of the truth 2. Eliminate time consuming processes that can produce
conflicting information 3. The crucial need for focused deployment of police resources 4. Reduction of crime across the city and region

Data Analytics and Dashboard Technology Help Police Cut Crime PROJECT OBJECTIVES:
• Enhance the output of crime analysis: have multiple views available such as CAD data, RMS data, accident data, parolee and sexual offender data within a single dashboard
• Implement a dashboard solution that is user-friendly and empowers staff to easily analyze data that traditionally was trapped in the “system”
• Improve the quality and accessibility of CAD and RMS information for decision support and resource planning
• Eliminate redundant “shadow systems” where crime data is exported from the primary system and processed in another, thereby improving operational productivity by spending more time analyzing and less time processing data
• Add analytical functionality that supports intelligence-led, data driven policing (DDACTs)
• Incorporate local GIS mapping information in order to enhance investigations

Data Analytics and Dashboard Technology Help Police Cut Crime
PROJECT CRITICAL SUCCESS FACTORS (Challenges): • Ensuring that all of the reporting and statistical needs of the
City and Police Department are thoroughly defined, documented and understood
• Ensuring that staff time is not wasted during this process, but also ensuring that appropriate staff has input into the process
• Active and candid feedback from project participants regarding functional requirements
• Obtaining buy-in from the police department

Data Analytics and Dashboard Technology Help Police Cut Crime PROJECT SOLUTION:
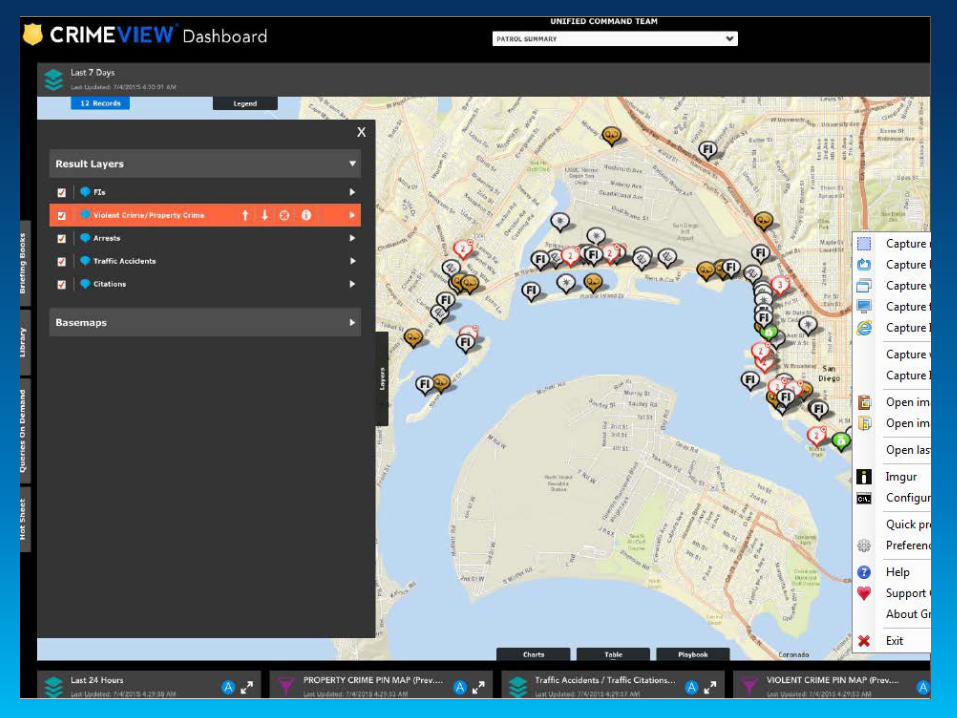
CrimeView Dashboard is a web-based application by the Omega Group that is accessible by authorized law enforcement personnel within the CLEMIS consortium. The CrimeView Dashboard solution can be configured to support different organizational contexts. These contexts may include shared end user roles such as: • Patrol (Beat / Neighborhood / Service Area Book) • Supervisory (Patrol Brief) • Executive (Command Brief, Mayor Brief) • Task force (Gang, Drug, Violent Crimes, etc.) • Specific initiatives such as, Data Driven Approaches to Crime
and Traffic Safety (DDACTS), and directed patrols.

Data Analytics and Dashboard Technology Help Police Cut Crime
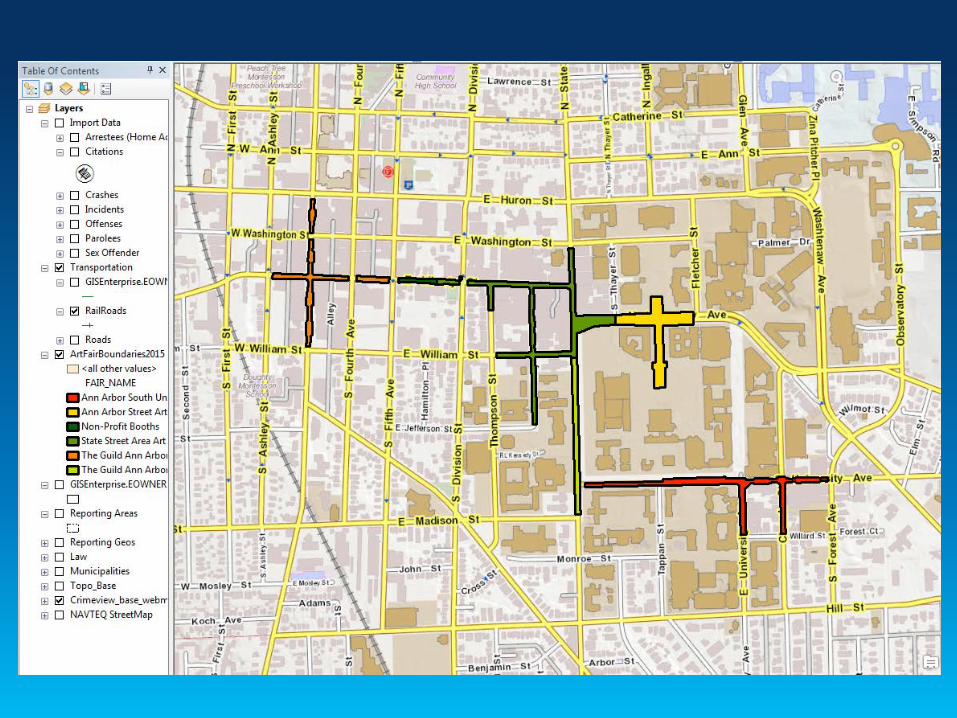
Demonstration: • DDACTS • Trend Analysis • Daily Briefing • The Ann Arbor
Art Fair

Data Analytics and Dashboard Technology Help Police Cut Crime

Data Analytics and Dashboard Technology Help Police Cut Crime
PROJECT NEXT STEPS: • Advanced Reporting: Briefing

Data Analytics and Dashboard Technology Help Police Cut Crime PROJECT NEXT STEPS: • Advanced Reporting: Statistics

Data Analytics and Dashboard Technology Help Police Cut Crime PROJECT NEXT STEPS: • Fire Department
Data Analytics and Dashboard Technology Help Police Cut Crime
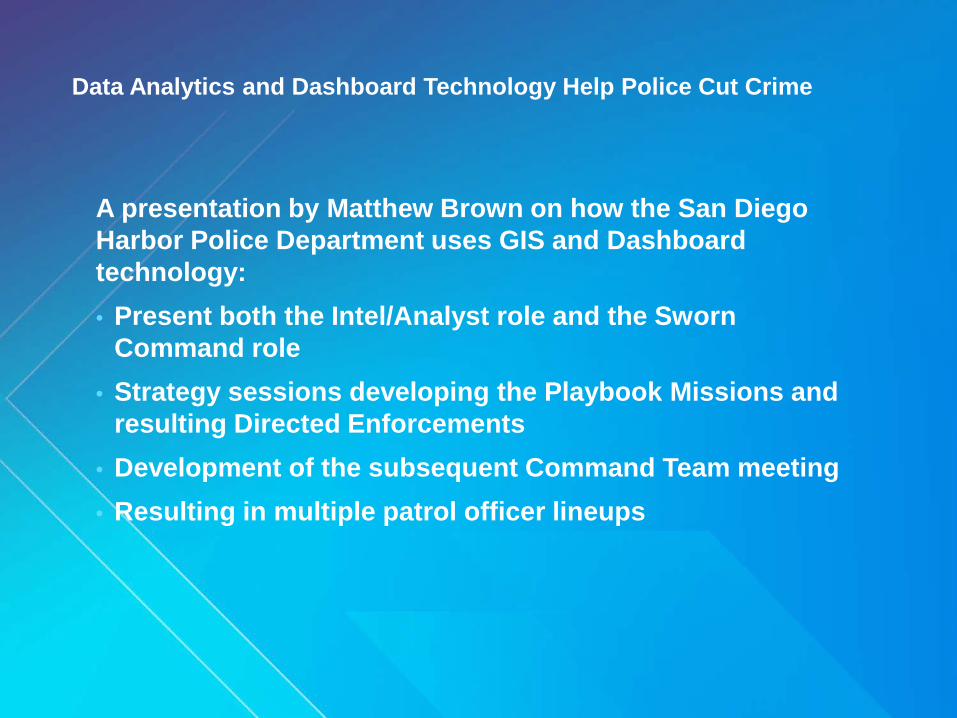
A presentation by Matthew Brown on how the San Diego Harbor Police Department uses GIS and Dashboard technology: • Present both the Intel/Analyst role and the Sworn
Command role • Strategy sessions developing the Playbook Missions and
resulting Directed Enforcements • Development of the subsequent Command Team meeting • Resulting in multiple patrol officer lineups


Thank You Have a great UC!

“There are lies, damned lies, and statistics”
Jason McKinley [email protected]
Matthew Brown [email protected]