regional materials - kim eng fortnightly research | june 19, 2014 see page 13 for important...
TRANSCRIPT

Regi
onal
Fo
rtni
ghtl
y Re
sear
ch|
June 19, 2014
SEE PAGE 13 FOR IMPORTANT DISCLOSURES AND ANALYST CERTIFICATIONS
Regional Materials Gems, Picks & Shovels Material Headlines Iron ore prices maintain their downtrend, approaching 2009
lows (LDB). The gap with steel prices in China is narrowing helping lift company profit margins from low/negative levels.
India mining: new environmental minister proposes simplifying forest mining regulations (BBG). Positive for those with stalled bauxite, iron ore, and coal mining projects (see picks below).
Indian government may approve the sale of its residual 30% stake in Hindustan Zinc via offer to Sesa Sterlite (Business Today). Zinc prices are moving in a positive direction due to rising Chinese imports and falling LME inventory.
The European steel producers’ group Eurofer has filed unfair trade cases against imports of stainless steel from China and Taiwan (Reuters). This is more potential bad news for China’s producers (nickel ore ban) and positive for those in Europe.
Is China backing up its tough new pollution measures? China’s Ministry of Environmental Protection has handed out its largest ever fines to 19 industrial companies totaling USD66m (SBB).
Impact on Share Recommendations Maanshan Steel initiated at BUY (323 HK; HKD1.62; BUY;
TP2.00) – a high beta trade on a short-term recovery in industry profit margins on lower ore costs, with a resurgent railway business from stepped up China government spending.
A pair trade is long Maanshan and short Angang Steel (347 HK; HKD4.80; SELL; TPHKD4.00), which it has underperformed, yet has higher earnings leverage to iron ore and rising value added steel sales (railway and flat steel for autos/appliances).
A pair trade on the stainless steel trends is long Finnish producer Outokumpu (OUT1V FH; Not rated) and short TISCO (000825 CH; Not rated) China’s largest stainless producer.
The correction in nickel appears well advanced. Our Top Pick is Vale Indonesia (INCO IJ; IDR3,720; BUY; TP IDR4,600), and for copper/zinc MMG (1208 HK; HKD2.02; BUY; TP HKD2.45).
Recent reports Bumi Res. Minerals – Restructuring getting closer (6/17/14)
Maanshan Steel – Riding the railway wheel of fortune (6/17/14)
Nickel Asia - An early preview of 1H14; Maintain Hold (11/6/14)
Atlas Mining - Full effect of improvements coming (23/5/14)
Indonesia Basic Materials - marketing takeaways(12/5/14)
Sarine Technologies - Another glittering quarter (12/5/14)
Contributing analysts HK/CHINA Alexander Latzer (metals, coal, steel) Regional Sector Head INDIA Anubhav Gupta (metals, steel) INDONESIA Isnaputra Iskandar, CFA (metals, coal, cement) PHILIPPINES Ramon Adviento (metals, coal) (Full materials team details on page 2) Iron ore/ steel price gap narrowing*
Source:Bloomberg.*Iron ore in USD/t, rebar in CNY/t.
Nickel price correction well advanced
Source:Bloomberg.
Zinc price showing renewed vigor
Source:Bloomberg.
2,000
3,000
4,000
5,000
6,000
7,000
0
50
100
150
200
250
Jan
07Ju
l 07
Jan
08Ju
l 08
Jan
09Ju
l 09
Jan
10Ju
l 10
Jan
11Ju
l 11
Jan
12Ju
l 12
Jan
13Ju
l 13
Jan
14Ju
l 14
Iron ore (CIF China, 62%, LHS)Rebar price China (VAT incl., RHS)
6.0
7.0
8.0
9.0
10.0
120
200
280
360
440
Aug-
13
Sep-
13
Oct
-13
Nov
-13
Dec
-13
Jan-
14
Feb-
14
Mar
-14
Apr-
14
May
-14
Jun-
14
LME Inventory (LHS, '000 t)LME price (RHS, US$/lb)
0.80
0.84
0.88
0.92
0.96
1.00
200
400
600
800
1000
1200
Aug-
13
Sep-
13
Oct
-13
Nov
-13
Dec
-13
Jan-
14
Feb-
14
Mar
-14
Apr-
14
May
-14
Jun-
14
LME Inventory (LHS, '000 t)LME price (RHS, US$/lb)

June 19, 2014 2
Regional Materials Sector
Our View of Material News India mining sector: new environmental minister proposes
simplifying forest mining regulations (BBG). Positive for those with stalled bauxite, iron ore, and coal mining projects.
Last week, the new environment minister said he will seek to reduce the list of criteria for violations that apply to projects that cut through certain forested areas. Further, from 1 July, all projects will be able to apply for a forest and environmental clearance online.
Indian government may approve the sale of its residual 30% stake in Hindustan Zinc via offer to Sesa Sterlite (Business Today). Zinc prices are moving in a positive direction due to rising Chinese imports and falling LME inventory.
The Indian government is likely to sell its 30% stake in Hindustan Zinc (HZ IN; Not rated) for INR200b (USD3.3b) via offer for sale to Sesa Sterlite. It is reportedly seeking regulatory approval for the transaction. It is possible that the deal may be concluded by the end of September. Once approved, the government may also fast track the sale of Bharat Aluminium (BALCO; 1042Z IN; Not rated), with a value of about INR30b (USD500m).
What’s Our View?
The easing regulatory burden on mining in forested areas is positive for companies like Sesa Sterlite, Coal India (COAL IN; Not Rated), NMDC Ltd (NMDC IN; Not Rated), Steel Authority of India (SAIL IN; INR98.95; SELL) whose bauxite/iron ore/coal mining projects have stalled due to the gridlock in obtaining permits for mining in forested areas. If the new rules are implemented, it would lead to a revival of these projects.
The acquisition of the government’s stake in HZ would increase SSLT's ownership to 94% from 65%. The deal is valued at the current market cap., which equates to 1.6x PBR 6.0x FY16 EV/EBITDA. We see this as fair for the business as it should be valued at the mid-to-high end of commodity company valuations because of its low operating cost and long reserve life.
The zinc price is moving in a positive direction supported by a global market deficit on healthy Chinese demand. According to the ILZSG, the global zinc market was in deficit through April this year by 107,000t (1% of demand) supported by a 7.5% YoY increase in consumption and a 4.1% increase in production. China’s net zinc imports rose 39% YoY to 261,000t with consumption up 12%. Yet the zinc price has increased only 1% YTD and 7% from the low in mid-March vs. the 27% decrease in LME inventories.
Figure 1: Zinc prices inching higher Figure 2: Inventory trend moving in a positive direction
Source: Bloomberg. Source: Bloomberg.
0.75
0.83
0.90
0.98
1.05
1.13
1.20
200
400
600
800
1,000
1,200
1,400
Dec
-12
Jan-
13Fe
b-13
Mar
-13
Apr-
13M
ay-1
3Ju
n-13
Jul-
13Au
g-13
Sep-
13O
ct-1
3N
ov-1
3D
ec-1
3Ja
n-14
Feb-
14M
ar-1
4Ap
r-14
May
-14In
vent
ory
(ton
nes
'000
)
LME Inventories LME Spot Price
Price (U
S $ per
Regional Materials Team HK/CHINA Alexander Latzer (metals, coal, steel) (852) 2268 0647 [email protected] INDIA Jigar Shah (cement, oil/gas) (91) 22 6623 2601 [email protected] Anubhav Gupta (metals, steel) (91) 22 6623 2605 [email protected] INDONESIA Isnaputra Iskandar, CFA (metals, coal, cement) (62) 21 2557 1129 [email protected] MALAYSIA Lee Yen Ling (steel, building materials) (603) 2297 8691 [email protected] PHILIPPINES Ramon Adviento (metals, coal) (63) 2 849 8845 [email protected] Lovell Sarreal (cement, consumer, media) (63) 2 849 8841 [email protected] SINGAPORE Yeak Chee Keong, CFA (oil/gas services, gem technology) (65) 6432 1460 [email protected] THAILAND Sutthichai Kumworachai (coal, energy, oil/gas, petrochemical) (66) 2658 6300 x 1400 [email protected] Surachai Pramualcharoenkit (steel, construction, contractors, automotive) (66) 2658 6300 x 1470 [email protected] VIETNAM Trung Thai (construction, materials, property) (84) 444 55 58 88 x 8180 [email protected]

June 19, 2014 3
Regional Materials Sector
Iron ore prices maintain downtrend, approaching 2009 lows (LDB). The gap with steel prices in China is narrowing helping lift steel company profit margins from low/negative levels.
We forecast improvement in steel company profit margins in China near term on lower iron ore prices relative to steel. We recently lowered our 2014 iron ore price forecast by 12% (-24% YoY), and our rebar price forecast by 2% (-9% YoY). The Chinese government also has stepped up spending on the electrical grid and the railway network, which should help lift demand for companies with exposure to these sectors.
What’s Our View?
During 2015, we forecast iron ore prices to move slightly higher from low levels early in the year as domestic mine supply wanes due to low profitability and seasonal factors. During 2H14 and 2015, we expect significant new iron ore capacity to enter the market equal to about 10% of current capacity from existing and emerging suppliers putting renewed downwards pressure on prices. The surplus is already evident in high port stockpiles in China and the weak price trend.
We forecast that steel prices will follow the long-term trend in raw material costs lower but with slightly less downside allowing for moderate improvement in industry profit margins from very low levels. The graph below compares the cost/tonne of raw materials with the trend in the U.S. and Chinese HRC steel prices. Steel prices in China have been the lowest worldwide, despite stronger but slowing demand growth.
Figure 3: Long-term raw materials and China steel price forecasts
Source: Steelhome, Maybank Kim Eng forecasts.
We recently initiated coverage of Maanshan Steel with a BUY. We prefer it to Angang, which it has underperformed YTD, because of its higher earnings leverage to a recovery in industry profit margins and with rising railway earnings as support.
Maanshan is benefitting from a surge in China’s railway spending, which is driving a 25% YoY rise in its railway business GP to CNY1.58b in 2014E (22% of GP) and helping offset the adverse impact of the weak property market.
We look for Maanshan to return to profit in 2H14E on lower iron ore costs and rising railway sales volumes where it has a market leading 45% share. Maanshan also recently acquired French company Valdunes, which has expertise in high speed railway wheels.
100 150 200 250 300 350 400 450 500 550
400 500 600 700 800 900
1,000 1,100 1,200 1,300
1Q'0
6
3Q'0
6
1Q'0
7
3Q'0
7
1Q'0
8
3Q'0
8
1Q'0
9
3Q'0
9
1Q'1
0
3Q'1
0
1Q'1
1
3Q'1
1
1Q'1
2
3Q'1
2
1Q'1
3
3Q'1
3
1Q'1
4
3Q'1
4E
1Q'1
5E
3Q'1
5E
Raw materials cost ex-freight (RHS)China HRC 2.75mm, VAT excl. (LHS)US HRC price (LHS)
USD/t USD/t
Iron ore and coking coal price forecasts*
Source: Bloomberg, Steelhome.*Iron ore price is 62% grade CIF China, and coking coal is the benchmark hard coking coal price FOB Australia.
Iron ore % Chg. Coking coal % Chg.
2010 141 81% 191 11%
2011 165 17% 289 51%
2012 128 -22% 214 -26%
2013 135 5% 157 -27%
2014E 102 -24% 125 -20%
2015E 93 -9% 134 7%
2016E 85 -9% 130 -3%
2017E 87 2% 125 -4%
Maanshan is benefitting from a surge in China’s railway spending, which is driving a 25% YoY rise in its railway business GP in 2014E and helping to offset the weak property market on its construction steel business. We have been traders of the steel companies in China during periods of brief windows of opportunities (6 months or less) and we see one opening up in the period ahead.
We recently lowered our 2014 iron ore price forecast by 12% (-24% YoY) to USD102/t. We forecast slightly lower iron ore prices by the end of 2014 from current levels. We forecast that steel prices will follow the long-term trend in raw material costs lower but with slightly less downside allowing moderate improvement in industry profit margins from very low levels.

June 19, 2014 4
Regional Materials Sector
The European steel producers' group Eurofer has filed unfair trade cases against imports of stainless steel from China and Taiwan. The EU Commission is to open an investigation into the imports by the end of June, according to the report. (Reuters).
This is more potential bad news for China's stainless producers, already reeling from higher nickel costs due to Indonesia’s nickel ore ban, but positive for producers in Europe to regain a competitive edge.
According to the report, sources indicated that China’s largest stainless producer, Shanxi Taigang Stainless Steel (TISCO), may see some adverse impact from trade measures in Europe. It is estimated that TISCO exports around 20,000 mt/mo of stainless products to Europe.
During 2013, Italy was the largest European importer of Chinese stainless steel at 90,506 metric tons of flat products (+71.5% YoY). Italy was also the fourth largest market overall for Chinese products after Taiwan, South Korea and Vietnam in 2013. The 2nd largest European destination and seventh largest overall for stainless flat product exports from China was Belgium, which totaled 58,555 mt during 2013 (+48.3% YoY).
What’s Our View?
Chinese stainless producers have been pressured from rising nickel costs due to higher nickel ore prices in Asia as a result of the ban on ore exports from Indonesia. Hitting the revenue side, stainless prices could come under downwards pressure in Asia if penalties are assessed and more stainless steel is directed to the domestic Chinese and other regional Asia markets.
Is China backing up its tough new pollution measures? China's Ministry of Environmental Protection has handed out its largest ever fines to 19 industrial companies totaling USD66m (SBB).
Southern China’s Kunming Iron & Steel (Kungang), a subsidiary of Wuhan Iron & Steel Group and the largest steelmaker in Yunnan province, was fined by China’s Ministry of Environment Protection (MEP) for having violated sintering desulfurization guidelines, according to a recent MEP notice. Some 18 other industrial firms were also penalized.
The penalties were the heaviest in the ministry's history, according to MEP minister Zhou Shengxian. Kungang is the only steel firm criticized by MEP and was cited for serious problems with its six sintering plants last calendar year. The other 18 companies were mainly coal-fired power plants, metal smelters and coal chemicals and petrochemical producers.
Similar examples of authorities’ tougher stance were seen in May when Lianyungang city government in eastern China’s Jiangsu ordered two privately-owned mills in Guannan County, each with 3 million mt/year capacity, to suspend all or part of their iron/steelmaking operations due to environmental violations. Also, five steel producers in Tangshan city in northern China’s Hebei now face higher power charges for not equipping their sinter plants with cleaning systems (Platts SBB).
What’s Our View?
The Chinese government has targeted for closure about 70mt (million metric tonnes) of crude steel capacity the next few years, which is about 2% of total capacity of 1 billion t/yr. Our experience is that plants in China
This is more potential bad news for China's stainless producers, already reeling from higher nickel costs due to Indonesia’s nickel ore ban, but positive for producers in Europe to regain a competitive edge.
The Chinese government has targeted for closure about 70mt (million metric tonnes) of crude steel capacity the next few years, which is about 2% of total capacity of 1 billion t/yr. Our experience is that plants in China close permanently because they are obsolete and uneconomic, not because of government action. The risk to steel prices is that a recovery in profit margins leads to even higher output given the capacity is available to produce more and cash flows are critical given the tightened credit to the sector.

June 19, 2014 5
Regional Materials Sector
close permanently because they are obsolete and uneconomic, not because of government action.
China’s production growth has slowed but remains at high levels. China produced 70.43 million tonnes of crude steel in May, equal to 2.272m tonnes/day, which was 2nd to the April record of 2.295m. The risk to steel prices is that a recovery in profit margins leads to even higher output given the capacity is available to produce more and cash flows are critical given the tightened credit to the sector.
Figure 4: Steel market prices in eastern China Figure 5: China crude steel production and YoY growth
Source: Steelhome. Source: Steelhome.
We forecast slowing steel production growth more in line with consumption in the range of 3-4%, while capacity growth slows even more to about 2%, resulting in marginally higher operating rates (Figure 6). High levels of exports are expected to be partially offset by imports of value-added steels. Spare capacity remains high, posing the risk of higher-than-forecast exports and/or lower steel prices.
Figure 6: China steel supply and demand model (million tonnes) 2009 2010 2011 2012 2013 2014E 2015E 2016E 2017E Capacity yr. end 719 800 872 946 1,008 1,033 1,059 1,085 1,101 Capacity yr. avg. 690 760 836 909 977 1,020 1,046 1,072 1,093 Utilization 82% 82% 82% 80% 81% 79% 80% 81% 82% Crude steel production 566 626 689 724 786 806 831 863 891 Finished steel production* 689 799 881 955 1,069 1,096 1,131 1,173 1,212 Flat 296 362 392 412 450 493 520 540 569 Share of total finished prod. 43% 45% 45% 43% 42% 45% 46% 46% 47% Long 321 350 402 448 501 513 529 550 567 Net export (incl. semis) 7 26 33 42 48 58 72 73 72 Import 18 16 16 14 14 16 18 20 22 Export 25 43 49 56 62 74 90 93 94 Apparent cons. (reported)* 682 773 848 913 1,022 1,039 1,058 1,101 1,140 Apparent cons. (adjusted)** 520 576 626 657 695 708 717 747 774 YoY Change Capacity yr. end 9% 11% 9% 8% 6% 2% 2% 2% 2% Crude steel production 14% 11% 10% 5% 9% 2% 3% 4% 3% Finished steel production* 19% 16% 10% 8% 12% 2% 3% 4% 3% Apparent consumption* 28% 13% 10% 8% 12% 2% 2% 4% 4% Apparent cons. adjusted** 21% 11% 9% 5% 6% 2% 2% 4% 4% Source: CEIC, CMIPRI, CBI, Maybank Kim Eng estimates. *Includes double counted tonnes from downstream processing in the reported government figures. **Adjusted consumption is our estimate excluding the double counting of finished steel from further downstream processing.
2,000
3,000
4,000
5,000
6,000
7,000
8,000
Jan
04M
ay 0
4Se
p 04
Jan
05M
ay 0
5Se
p 05
Jan
06M
ay 0
6Se
p 06
Jan
07M
ay 0
7Se
p 07
Jan
08M
ay 0
8Se
p 08
Jan
09M
ay 0
9Se
p 09
Jan
10M
ay 1
0Se
p 10
Jan
11M
ay 1
1Se
p 11
Jan
12M
ay 1
2Se
p 12
Jan
13M
ay 1
3Se
p 13
Jan
14M
ay 1
4
Rebar ψ12 Plate 20mmHRC 2.75mm CR sheet 1mmRmb/t
-20%-10%0%10%20%30%40%50%
1020304050607080
Jan
06M
ay 0
6Se
p 06
Jan
07M
ay 0
7Se
p 07
Jan
08M
ay 0
8Se
p 08
Jan
09M
ay 0
9Se
p 09
Jan
10M
ay 1
0Se
p 10
Jan
11M
ay 1
1Se
p 11
Jan
12M
ay 1
2Se
p 12
Jan
13M
ay 1
3Se
p 13
Jan
14
Monthly crude production (LHS)YoY growth (RHS)
YoY chg. mt

June 19, 2014 6
Regional Materials Sector
Share price performance: materials, coal and steel (YTD, 3 months)
Figure 7: Asia region materials stocks YTD Figure 8: Asia region materials stocks past three months
Source: Bloomberg. Source: Bloomberg.
Figure 9: Asia region coal stocks YTD Figure 10: Asia region coal stocks past three months
Source: Bloomberg. Source: Bloomberg.
-53% -35% -33% -31% -30%
-19% -16% -16% -14% -14% -13% -10%
-8% -8% -7% -7% -7% -7% -5% -3% -3% -2%
0% 1% 3% 3% 4% 4% 5% 6% 10% 15% 16% 17% 19% 19% 22% 23% 23% 24% 27% 29% 32% 33% 38% 43% 44%
57% 66% 66%
81% 97%
-85% -55% -25% 5% 35% 65% 95%
LynasHaranga
WCCPaladin Energy
FortescueHongqiao
CNBMRio TintoShanshui
Baotou Rare EarthYunnan Copper
SinomaJiangxi Copper
IRCHunan Nonferrous
BHP BillitonAtlas Minerals
CR CementAnhui Conch
Taiwan CementChinalco MiningZhaojin Mining
Sterlite IndsChina Vanadium
Asia CementIndophile
ERAZijin Mining
Aneka TambangChalco
China MolyKorea Zinc
Bumi Res. Min.Philex
VedantaPanAust
Ambuja CementMinmetal MMGHindustan Zinc
AluminaNewcrest
OZ MineralsHindalco
ACCVALE Indonesia
Sesa SterliteNALCO
Ultratech CementRUSAL
Shree CementNickel Asia
ICEM
-42% -38% -33%
-21% -18% -18% -15% -10%
-8% -7% -6% -5% -5% -5% -5% -4% -1% -1%
0% 1% 3% 3% 3% 3% 4% 5% 5% 6% 6% 10% 10% 10% 10% 12% 15% 17% 18% 23%
29% 35% 37% 40% 41% 41% 41% 44%
52% 55% 57%
66% 69%
117%
-60% -30% 0% 30% 60% 90% 120%
LynasPaladin Energy
HarangaZhaojin Mining
FortescueNewcrest
ERACR Cement
IndophileAtlas Minerals
Rio TintoIRC
Hunan NonferrousTaiwan Cement
Baotou Rare EarthBumi Res. Min.
WCCBHP BillitonSterlite Inds
ShanshuiZijin Mining
Aneka TambangAnhui Conch
CNBMHongqiao
Asia CementKorea Zinc
PhilexJiangxi Copper
ChalcoChina VanadiumYunnan Copper
SinomaChinalco Mining
AluminaOZ Minerals
ACCAmbuja Cement
China MolyPanAustVedanta
Hindustan ZincUltratech Cement
HindalcoShree Cement
VALE IndonesiaNickel Asia
Minmetal MMGNALCORUSAL
Sesa SterliteICEM
-46%
-43%
-35%
-34%
-34%
-26%
-22%
-22%
-13%
-11%
-9%
-9%
-3%
-3%
-1%
7%
17%
19%
34%
-50% -40% -30% -20% -10% 0% 10% 20% 30% 40%
Mongolia Mining
Berau
Bumi Resources
Borneo Lumbung
Shougang Fushan
Southgobi
Winsway
Hidili
Harum Energy
Yanzhou Coal
Bayan
Shenhua
China coal
Indo Tam. Megah
Banpu pcl
PT Bukit Asam
Adaro
Indika Energy
Coal India
-40%
-38%
-29%
-19%
-17%
-11%
-9%
1%
6%
7%
8%
12%
14%
15%
17%
18%
19%
32%
47%
-50%-40%-30%-20%-10% 0% 10% 20% 30% 40% 50% 60%
Berau
Bumi Resources
Mongolia Mining
Borneo Lumbung
Shougang Fushan
Southgobi
Bayan
Winsway
Harum Energy
Hidili
China coal
Shenhua
Indo Tam. Megah
Indika Energy
Banpu pcl
PT Bukit Asam
Yanzhou Coal
Adaro
Coal India

June 19, 2014 7
Regional Materials Sector
Figure 11: Asia region steel stocks YTD Figure 12: Asia region steel stocks past three months
Source: Bloomberg. Source: Bloomberg.
Metals prices and inventory Figure 13: Copper exchange prices and inventories Figure 14 Aluminium exchange prices and inventories
Source: Bloomberg Source: Bloomberg
Figure 15: Nickel exchange prices and inventories Figure 16: Zinc exchange prices and inventories
Source: Bloomberg Source: Bloomberg
-34%
-21%
-20%
-18%
-18%
-18%
-17%
-12%
-12%
-11%
-8%
-7%
-6%
-3%
24%
24%
24%
34%
76%
-40% -20% 0% 20% 40% 60% 80% 100%
Dongkuk steel
Maanshan
Shougang
JFE Holding
Angang
Kobe Steel
Hyundai Steel
Bhushan
Posco Steel
Nippon Steel
Wuhan Steel
China Steel
BlueScope Steel
Baosteel
Jindal Steel & Power
JSW Steel
Tata Steel
Steel Authority
Hyundai Hysco
-27%
-11%
-7%
-3%
-1%
1%
3%
4%
4%
7%
9%
10%
11%
13%
26%
34%
45%
54%
74%
-40% -20% 0% 20% 40% 60% 80%
Dongkuk steel
BlueScope Steel
Bhushan
Shougang
China Steel
Wuhan Steel
Angang
Maanshan
Posco Steel
JFE Holding
Kobe Steel
Baosteel
Hyundai Steel
Nippon Steel
Jindal Steel & Power
JSW Steel
Hyundai Hysco
Tata Steel
Steel Authority
June 19, 2014 8
Regional Materials Sector
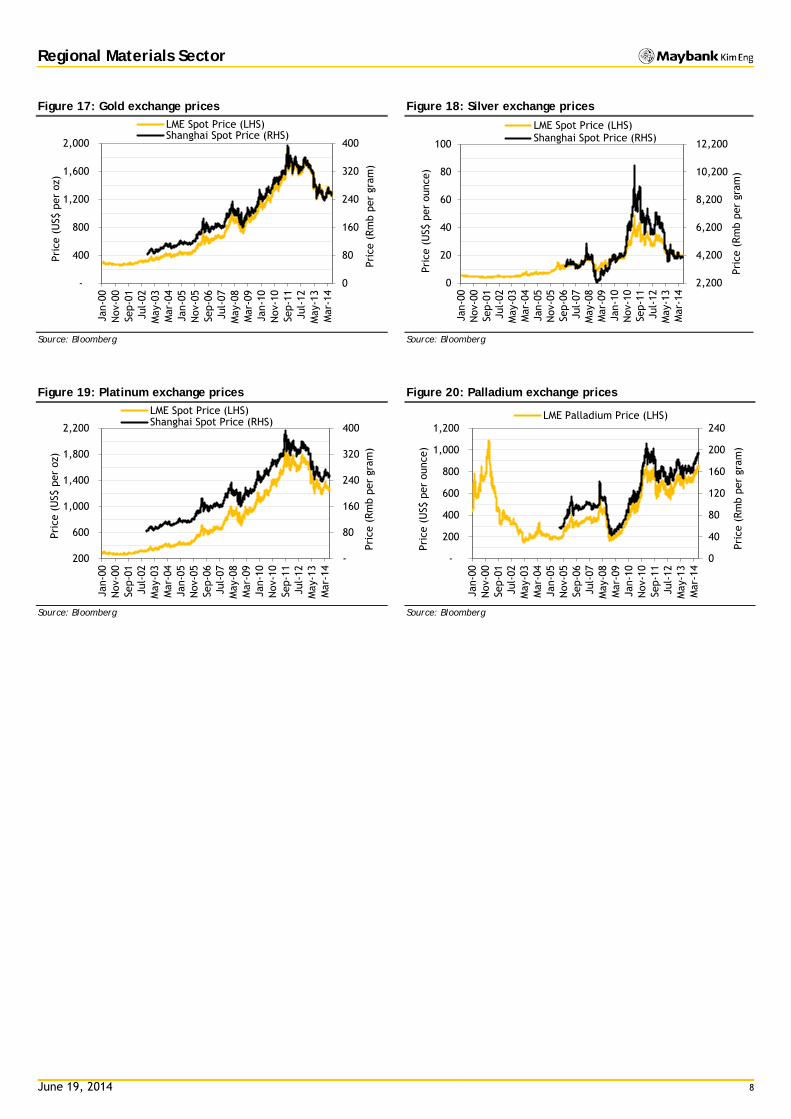
Figure 17: Gold exchange prices Figure 18: Silver exchange prices
Source: Bloomberg Source: Bloomberg
Figure 19: Platinum exchange prices Figure 20: Palladium exchange prices
Source: Bloomberg Source: Bloomberg
0
80
160
240
320
400
-
400
800
1,200
1,600
2,000
Jan-
00N
ov-0
0Se
p-01
Jul-
02M
ay-0
3M
ar-0
4Ja
n-05
Nov
-05
Sep-
06Ju
l-07
May
-08
Mar
-09
Jan-
10N
ov-1
0Se
p-11
Jul-
12M
ay-1
3M
ar-1
4
Pric
e (R
mb
per
gram
)
Pric
e (U
S$ p
er o
z)
LME Spot Price (LHS)Shanghai Spot Price (RHS)
2,200
4,200
6,200
8,200
10,200
12,200
0
20
40
60
80
100
Jan-
00N
ov-0
0Se
p-01
Jul-
02M
ay-0
3M
ar-0
4Ja
n-05
Nov
-05
Sep-
06Ju
l-07
May
-08
Mar
-09
Jan-
10N
ov-1
0Se
p-11
Jul-
12M
ay-1
3M
ar-1
4
Pric
e (R
mb
per
gram
)
Pric
e (U
S$ p
er o
unce
)
LME Spot Price (LHS)Shanghai Spot Price (RHS)
-
80
160
240
320
400
200
600
1,000
1,400
1,800
2,200
Jan-
00N
ov-0
0Se
p-01
Jul-
02M
ay-0
3M
ar-0
4Ja
n-05
Nov
-05
Sep-
06Ju
l-07
May
-08
Mar
-09
Jan-
10N
ov-1
0Se
p-11
Jul-
12M
ay-1
3M
ar-1
4
Pric
e (R
mb
per
gram
)
Pric
e (U
S$ p
er o
z)
LME Spot Price (LHS)Shanghai Spot Price (RHS)
0
40
80
120
160
200
240
-
200
400
600
800
1,000
1,200
Jan-
00N
ov-0
0Se
p-01
Jul-
02M
ay-0
3M
ar-0
4Ja
n-05
Nov
-05
Sep-
06Ju
l-07
May
-08
Mar
-09
Jan-
10N
ov-1
0Se
p-11
Jul-
12M
ay-1
3M
ar-1
4
Pric
e (R
mb
per
gram
)
Pric
e (U
S$ p
er o
unce
) LME Palladium Price (LHS)

June 19, 2014 9
Regional Materials Sector
China coal inventory and prices, and power data
Figure 21 Thermal coal price Qinhuangdao vs. Newcastle* Figure 21: Thermal coal prices in China and Australia*
Source: Bloomberg, McCloskey, Maybank Kim Eng estimates.*Prices are adjusted for coal calorific content and estimated transportation cost for delivery to southern China for comparison purposes.
Source: Bloomberg, McCloskey, Maybank Kim Eng estimates. *China coal price includes 17% VAT basis 5,800 kcal. Australia price is FOC basis 6,000 kcal.
Figure 23: China Coal inventory power plants and total (days) Fig 24: China total raw coal production and YoY growth trend
Source: Bloomberg, McCloskey, Maybank Kim Eng estimates. Source: CCTD, McCloskey.
Figure 25: Monthly power generation and pct. change Figure 26: Power generation by source and pct. change
Source: China NBS. Source: China NBS.
-40%-30%-20%-10%0%10%20%30%40%
0255075
100125150175200
Jan-
01
Nov
-01
Sep-
02
Jul-
03
May
-04
Mar
-05
Jan-
06
Nov
-06
Sep-
07
Jul-
08
May
-09
Mar
-10
Jan-
11
Nov
-11
Sep-
12
Jul-
13
May
-14
Premium (discount)
(USD/t) Qinhuangdao coal price (LHS)Newcastle coal price (LHS)Qinhuangdao premium (discount)
0255075
100125150175200
Jan-
07
Oct
-07
Jul-
08
Apr-
09
Jan-
10
Oct
-10
Jul-
11
Apr-
12
Jan-
13
Oct
-13
Jul-
14
Apr-
15
Jan-
16
(USD/t) Qinhuangdao coal price Newcastle coal price
Est. 2014/15
Current prices: Qinhuangdao 5,800 kcal USD90/t (incl. 17% VAT); Newcastle 6,000 kcal USD72/t.
0
5
10
15
20
25
30
35
40
Jan
05Ju
n 05
Nov
05
Apr
06Se
p 06
Feb
07Ju
l 07
Dec
07
May
08
Oct
08
Mar
09
Aug
09Ja
n 10
Jun
10N
ov 1
0Ap
r 11
Sep
11Fe
b 12
Jul 1
2D
ec 1
2M
ay 1
3O
ct 1
3M
ar 1
4
Power plants TotalDays
(30%)(20%)(10%)0%10%20%30%40%50%
050
100150200250300350400
Jan-
03Ju
n-03
Nov
-03
Apr-
04Se
p-04
Feb-
05Ju
l-05
Dec
-05
May
-06
Oct
-06
Mar
-07
Aug-
07Ja
n-08
Jun-
08N
ov-0
8Ap
r-09
Sep-
09Fe
b-10
Jul-
10D
ec-1
0M
ay-1
1O
ct-1
1M
ar-1
2Au
g-12
Jan-
13Ju
n-13
Nov
-13
Apr-
14
mt Production (LHS)YoY Chg. (RHS) YoY Chg.
-14
-7
0
7
14
21
28
0
100
200
300
400
500
600
Jan&
Feb-
07M
ay-0
7Au
g-07
Nov
-07
Mar
-08
Jun-
08Se
p-08
Dec
-08
Apr-
09Ju
l-09
Oct
-09
Jan&
Feb-
10M
ay-1
0Au
g-10
Nov
-10
Mar
-11
Jun-
11Se
p-11
Dec
-11
Apr-
12Ju
l-12
Oct
-12
Jan&
Feb-
13M
ay-1
3Au
g-13
Nov
-13
Mar
-14
(YoY %) (bn kWh)
Monthly power generation (LHS)% YoY (RHS)% MoM (RHS)
(40)(30)(20)(10)
0102030405060
Jan&
Feb-
07M
ay-0
7Au
g-07
Nov
-07
Mar
-08
Jun-
08Se
p-08
Dec
-08
Apr-
09Ju
l-09
Oct
-09
Jan&
Feb-
10M
ay-1
0Au
g-10
Nov
-10
Mar
-11
Jun-
11Se
p-11
Dec
-11
Apr-
12Ju
l-12
Oct
-12
Jan&
Feb-
13M
ay-1
3Au
g-13
Nov
-13
Mar
-14
YoY % Chg. Thermal Hydro Nuclear
June 19, 2014 10
Regional Materials Sector
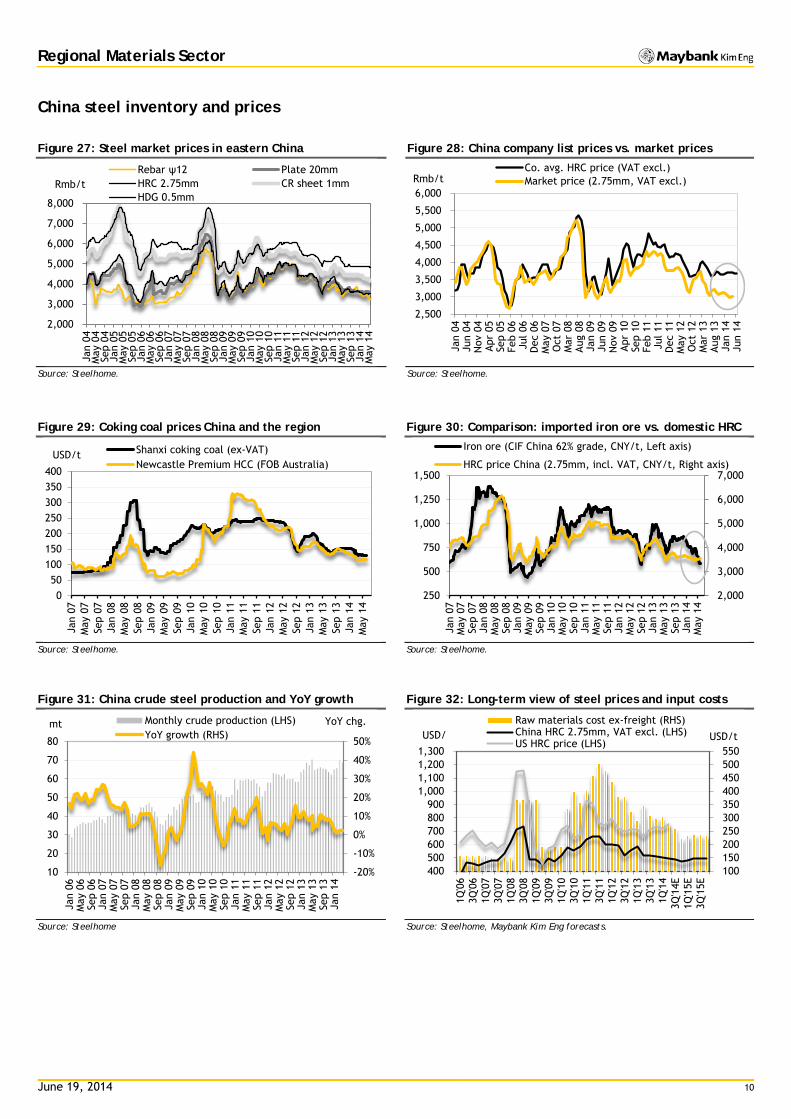
China steel inventory and prices
Figure 27: Steel market prices in eastern China Figure 28: China company list prices vs. market prices
Source: Steelhome. Source: Steelhome.
Figure 29: Coking coal prices China and the region Figure 30: Comparison: imported iron ore vs. domestic HRC
Source: Steelhome. Source: Steelhome.
Figure 31: China crude steel production and YoY growth Figure 32: Long-term view of steel prices and input costs
Source: Steelhome Source: Steelhome, Maybank Kim Eng forecasts.
2,000
3,000
4,000
5,000
6,000
7,000
8,000
Jan
04M
ay 0
4Se
p 04
Jan
05M
ay 0
5Se
p 05
Jan
06M
ay 0
6Se
p 06
Jan
07M
ay 0
7Se
p 07
Jan
08M
ay 0
8Se
p 08
Jan
09M
ay 0
9Se
p 09
Jan
10M
ay 1
0Se
p 10
Jan
11M
ay 1
1Se
p 11
Jan
12M
ay 1
2Se
p 12
Jan
13M
ay 1
3Se
p 13
Jan
14M
ay 1
4
Rebar ψ12 Plate 20mmHRC 2.75mm CR sheet 1mmHDG 0.5mm
Rmb/t
2,500
3,000
3,500
4,000
4,500
5,000
5,500
6,000
Jan
04Ju
n 04
Nov
04
Apr
05Se
p 05
Feb
06Ju
l 06
Dec
06
May
07
Oct
07
Mar
08
Aug
08Ja
n 09
Jun
09N
ov 0
9Ap
r 10
Sep
10Fe
b 11
Jul 1
1D
ec 1
1M
ay 1
2O
ct 1
2M
ar 1
3Au
g 13
Jan
14Ju
n 14
Co. avg. HRC price (VAT excl.)Market price (2.75mm, VAT excl.)Rmb/t
050
100150200250300350400
Jan
07M
ay 0
7Se
p 07
Jan
08M
ay 0
8Se
p 08
Jan
09M
ay 0
9Se
p 09
Jan
10M
ay 1
0Se
p 10
Jan
11M
ay 1
1Se
p 11
Jan
12M
ay 1
2Se
p 12
Jan
13M
ay 1
3Se
p 13
Jan
14M
ay 1
4
Shanxi coking coal (ex-VAT)Newcastle Premium HCC (FOB Australia)
USD/t
2,000
3,000
4,000
5,000
6,000
7,000
250
500
750
1,000
1,250
1,500
Jan
07M
ay 0
7Se
p 07
Jan
08M
ay 0
8Se
p 08
Jan
09M
ay 0
9Se
p 09
Jan
10M
ay 1
0Se
p 10
Jan
11M
ay 1
1Se
p 11
Jan
12M
ay 1
2Se
p 12
Jan
13M
ay 1
3Se
p 13
Jan
14M
ay 1
4
Iron ore (CIF China 62% grade, CNY/t, Left axis)
HRC price China (2.75mm, incl. VAT, CNY/t, Right axis)
-20%
-10%
0%
10%
20%
30%
40%
50%
10
20
30
40
50
60
70
80
Jan
06M
ay 0
6Se
p 06
Jan
07M
ay 0
7Se
p 07
Jan
08M
ay 0
8Se
p 08
Jan
09M
ay 0
9Se
p 09
Jan
10M
ay 1
0Se
p 10
Jan
11M
ay 1
1Se
p 11
Jan
12M
ay 1
2Se
p 12
Jan
13M
ay 1
3Se
p 13
Jan
14
Monthly crude production (LHS)YoY growth (RHS)
YoY chg. mt
100 150 200 250 300 350 400 450 500 550
400 500 600 700 800 900
1,000 1,100 1,200 1,300
1Q'0
63Q
'06
1Q'0
73Q
'07
1Q'0
83Q
'08
1Q'0
93Q
'09
1Q'1
03Q
'10
1Q'1
13Q
'11
1Q'1
23Q
'12
1Q'1
33Q
'13
1Q'1
43Q
'14E
1Q'1
5E3Q
'15E
Raw materials cost ex-freight (RHS)China HRC 2.75mm, VAT excl. (LHS)US HRC price (LHS)
USD/ USD/t

June 19, 2014 11
Regional Materials Sector
China metals trade data (imports/exports in ‘000 t)
Figure 33: Refined copper trade (net imports remain high) Figure 34: Copper concentrate trade (no pullback here)
Source: China Customs Data. Source: China Customs Data.
Figure 35: Alumina trade (rising once again) Figure 36: Bauxite trade (large falloff post Indonesia ban)
Source: China Customs Data. Source: China Customs Data.
Figure 37: Refined nickel trade (not much change) Figure38: Nickel ore trade (a large fall, but still flowing)
Source: China Customs Data. Source: China Customs Data.
(400)(350)(300)(250)(200)(150)(100)(50)050
(400) (350) (300) (250) (200) (150) (100) (50) - 50
Jan-
10M
ar-1
0M
ay-1
0Ju
l-10
Sep-
10N
ov-1
0Ja
n-11
Mar
-11
May
-11
Jul-
11Se
p-11
Nov
-11
Jan-
12M
ar-1
2M
ay-1
2Ju
l-12
Sep-
12N
ov-1
2Ja
n-13
Mar
-13
May
-13
Jul-
13Se
p-13
Nov
-13
Jan-
14M
ar-1
4
import export net export
(450)(400)(350)(300)(250)(200)(150)(100)(50)050
(450) (400) (350) (300) (250) (200) (150) (100) (50) - 50
Jan-
10M
ar-1
0M
ay-1
0Ju
l-10
Sep-
10N
ov-1
0Ja
n-11
Mar
-11
May
-11
Jul-
11Se
p-11
Nov
-11
Jan-
12M
ar-1
2M
ay-1
2Ju
l-12
Sep-
12N
ov-1
2Ja
n-13
Mar
-13
May
-13
Jul-
13Se
p-13
Nov
-13
Jan-
14M
ar-1
4
import export net export
(800)
(600)
(400)
(200)
0
200
(800)
(600)
(400)
(200)
-
200
Jan-
10M
ar-1
0M
ay-1
0Ju
l-10
Sep-
10N
ov-1
0Ja
n-11
Mar
-11
May
-11
Jul-
11Se
p-11
Nov
-11
Jan-
12M
ar-1
2M
ay-1
2Ju
l-12
Sep-
12N
ov-1
2Ja
n-13
Mar
-13
May
-13
Jul-
13Se
p-13
Nov
-13
Jan-
14M
ar-1
4
import export net export
(8,400)
(7,000)
(5,600)
(4,200)
(2,800)
(1,400)
0
(8,400)
(7,000)
(5,600)
(4,200)
(2,800)
(1,400)
-Ja
n-10
Mar
-10
May
-10
Jul-
10Se
p-10
Nov
-10
Jan-
11M
ar-1
1M
ay-1
1Ju
l-11
Sep-
11N
ov-1
1Ja
n-12
Mar
-12
May
-12
Jul-
12Se
p-12
Nov
-12
Jan-
13M
ar-1
3M
ay-1
3Ju
l-13
Sep-
13N
ov-1
3Ja
n-14
Mar
-14
import export net export
(30)
(20)
(10)
0
10
(30)
(20)
(10)
-
10
Jan-
10M
ar-1
0M
ay-1
0Ju
l-10
Sep-
10N
ov-1
0Ja
n-11
Mar
-11
May
-11
Jul-
11Se
p-11
Nov
-11
Jan-
12M
ar-1
2M
ay-1
2Ju
l-12
Sep-
12N
ov-1
2Ja
n-13
Mar
-13
May
-13
Jul-
13Se
p-13
Nov
-13
Jan-
14M
ar-1
4
import export net export
(8,000)
(6,400)
(4,800)
(3,200)
(1,600)
0
(8,000)
(6,400)
(4,800)
(3,200)
(1,600)
-
Jan-
10M
ar-1
0M
ay-1
0Ju
l-10
Sep-
10N
ov-1
0Ja
n-11
Mar
-11
May
-11
Jul-
11Se
p-11
Nov
-11
Jan-
12M
ar-1
2M
ay-1
2Ju
l-12
Sep-
12N
ov-1
2Ja
n-13
Mar
-13
May
-13
Jul-
13Se
p-13
Nov
-13
Jan-
14M
ar-1
4
import export net export

June 19, 2014 12
Regional Materials Sector
Research Offices
REGIONAL
WONG Chew Hann, CA Regional Head of Institutional Research (603) 2297 8686 [email protected]
ONG Seng Yeow Regional Head of Retail Research (65) 6432 1453 [email protected]
Alexander GARTHOFF Institutional Product Manager (852) 2268 0638 [email protected]
ECONOMICS
Suhaimi ILIAS Chief Economist Singapore | Malaysia (603) 2297 8682 [email protected]
Luz LORENZO Philippines (63) 2 849 8836 [email protected]
Tim LEELAHAPHAN Thailand (662) 658 1420 [email protected]
JUNIMAN Chief Economist, BII Indonesia (62) 21 29228888 ext 29682 [email protected]
Josua PARDEDE Economist / Industry Analyst, BII Indonesia (62) 21 29228888 ext 29695 [email protected]
MALAYSIA
WONG Chew Hann, CA Head of Research (603) 2297 8686 [email protected] • Strategy • Construction & Infrastructure
Desmond CH’NG, ACA (603) 2297 8680 [email protected] • Banking & Finance
LIAW Thong Jung (603) 2297 8688 [email protected] • Oil & Gas - Regional • Shipping
ONG Chee Ting, CA (603) 2297 8678 [email protected] • Plantations - Regional
Mohshin AZIZ (603) 2297 8692 [email protected] • Aviation - Regional • Petrochem
YIN Shao Yang, CPA (603) 2297 8916 [email protected] • Gaming – Regional • Media
TAN Chi Wei, CFA (603) 2297 8690 [email protected] • Power • Telcos
WONG Wei Sum, CFA (603) 2297 8679 [email protected] • Property & REITs
LEE Yen Ling (603) 2297 8691 [email protected] • Building Materials • Glove Producers
CHAI Li Shin (603) 2297 8684 [email protected] • Plantation • Construction & Infrastructure
Ivan YAP (603) 2297 8612 [email protected] • Automotive
LEE Cheng Hooi Regional Chartist (603) 2297 8694 [email protected]
Tee Sze Chiah Head of Retail Research (603) 2297 6858 [email protected]
HONG KONG / CHINA
Howard WONG Head of Research (852) 2268 0648 [email protected] • Oil & Gas - Regional
Alexander LATZER (852) 2268 0647 [email protected] • Metals & Mining - Regional
Jacqueline KO, CFA (852) 2268 0633 [email protected] • Consumer
Karen KWAN (852) 2268 0640 [email protected] • Property & REITs
Osbert TK TANG, CFA (86) 21 5096 8370 [email protected] • Transport & Industrials
Ricky WK NG, CFA (852) 2268 0689 [email protected] • Utilities & Renewable Energy
Simon QIAN, CFA (852) 2268 0634 [email protected] • Telecom & Internet
Steven ST CHAN (852) 2268 0645 [email protected] • Banking & Financials - Regional
Warren LAU (852) 2268 0644 [email protected] • Technology – Regional
William YANG (852) 2268 0675 [email protected] • Technology – Regional
INDIA
Jigar SHAH Head of Research (91) 22 6623 2601 [email protected] • Oil & Gas • Automobile • Cement
Anubhav GUPTA (91) 22 6623 2605 [email protected] • Metal & Mining • Capital Goods • Property
Urmil SHAH (91) 22 6623 2606 [email protected] • Technology • Media
SINGAPORE
NG Wee Siang Head of Research (65) 6432 1467 [email protected] • Banking & Finance
Gregory YAP (65) 6432 1450 [email protected] • SMID Caps – Regional • Technology & Manufacturing • Telcos • Consumer
Wilson LIEW (65) 6432 1454 [email protected] • Property Developers
ONG Kian Lin (65) 6432 1470 [email protected] • S-REITs
YEAK Chee Keong, CFA (65) 6432 1460 [email protected] • Offshore & Marine
Derrick HENG (65) 6432 1446 [email protected] • Transport (Land, Shipping & Aviation)
WEI Bin (65) 6432 1455 [email protected] • Commodity • Logistics • S-chips
John CHEONG (65) 6432 1461 [email protected] • Small & Mid Caps • Healthcare
TRUONG Thanh Hang (65) 6432 1451 [email protected] • Small & Mid Caps
INDONESIA
Wilianto IE Head of Research (62) 21 2557 1125 [email protected] • Strategy
Rahmi MARINA (62) 21 2557 1128 [email protected] • Banking & Finance
Aurellia SETIABUDI (62) 21 2953 0785 [email protected] • Property
Anthony YUNUS (62) 21 2557 1136 [email protected] • Consumer • Poultry
Isnaputra ISKANDAR (62) 21 2557 1129 [email protected] • Metals & Mining • Cement
Pandu ANUGRAH (62) 21 2557 1137 [email protected] • Infrastructure • Construction • Transport
Janni ASMAN (62) 21 2953 0784 [email protected] • Cigarette • Healthcare • Retail
PHILIPPINES
Luz LORENZO Head of Research (63) 2 849 8836 [email protected] • Strategy
Laura DY-LIACCO (63) 2 849 8840 [email protected] • Utilities • Conglomerates • Telcos
Lovell SARREAL (63) 2 849 8841 [email protected] • Consumer • Media • Cement
Rommel RODRIGO (63) 2 849 8839 [email protected] • Conglomerates • Property • Gaming • Ports/ Logistics
Katherine TAN (63) 2 849 8843 [email protected] • Banks • Construction
Ramon ADVIENTO (63) 2 849 8845 [email protected] • Mining
THAILAND
Maria LAPIZ Head of Institutional Research Dir (66) 2257 0250 | (66) 2658 6300 ext 1399 [email protected] • Consumer / Materials
Jesada TECHAHUSDIN, CFA (66) 2658 6300 ext 1394 [email protected] • Financial Services
Kittisorn PRUITIPAT, CFA, FRM (66) 2658 6300 ext 1395 [email protected] • Real Estate
Sittichai DUANGRATTANACHAYA (66) 2658 6300 ext 1393 [email protected] • Services Sector
Sukit UDOMSIRIKUL Head of Retail Research (66) 2658 6300 ext 5090 [email protected]
Mayuree CHOWVIKRAN (66) 2658 6300 ext 1440 [email protected] • Strategy
Padon VANNARAT (66) 2658 6300 ext 1450 [email protected] • Strategy
Surachai PRAMUALCHAROENKIT (66) 2658 6300 ext 1470 [email protected] • Auto • Conmat • Contractor • Steel
Suttatip PEERASUB (66) 2658 6300 ext 1430 [email protected] • Media • Commerce
Sutthichai KUMWORACHAI (66) 2658 6300 ext 1400 [email protected] • Energy • Petrochem
Termporn TANTIVIVAT (66) 2658 6300 ext 1520 [email protected] • Property
Woraphon WIROONSRI (66) 2658 6300 ext 1560 [email protected] • Banking & Finance
Jaroonpan WATTANAWONG (66) 2658 6300 ext 1404 [email protected] • Transportation • Small cap
Chatchai JINDARAT (66) 2658 6300 ext 1401 [email protected] • Electronics VIETNAM LE Hong Lien, ACCA Head of Institutional Research (84) 844 55 58 88 x 8181 [email protected] • Strategy • Consumer • Diversified • Utilities
THAI Quang Trung, CFA, Deputy Manager, Institutional Research (84) 844 55 58 88 x 8180 [email protected] • Real Estate • Construction • Materials
Le Nguyen Nhat Chuyen (84) 844 55 58 88 x 8082 [email protected] • Oil & Gas NGUYEN Thi Ngan Tuyen, Head of Retail Research (84) 8 44 555 888 x 8081 [email protected] • Food & Beverage • Oil&Gas • Banking
NGUYEN Trung Hoa, Dy Head of Retail Research (84) 8 44 555 888 x 8088 [email protected] • Macro • Steel • Real estate
TRINH Thi Ngoc Diep (84) 4 44 555 888 x 8208 [email protected] • Technology • Utilities • Construction
TRUONG Quang Binh (84) 4 44 555 888 x 8087 [email protected] • Rubber plantation • Tyres and Tubes • Oil&Gas
PHAM Nhat Bich (84) 8 44 555 888 x 8083 [email protected] • Consumer • Manufacturing • Fishery
NGUYEN Thi Sony Tra Mi (84) 8 44 555 888 x 8084 [email protected] • Port operation • Pharmaceutical • Food & Beverage

June 19, 2014 13
Regional Materials Sector
APPENDIX I: TERMS FOR PROVISION OF REPORT, DISCLAIMERS AND DISCLOSURES
DISCLAIMERS
This research report is prepared for general circulation and for information purposes only and under no circumstances should it be considered or intended as an offer to sell or a solicitation of an offer to buy the securities referred to herein. Investors should note that values of such securities, if any, may fluctuate and that each security’s price or value may rise or fall. Opinions or recommendations contained herein are in form of technical ratings and fundamental ratings. Technical ratings may differ from fundamental ratings as technical valuations apply different methodologies and are purely based on price and volume-related information extracted from the relevant jurisdiction’s stock exchange in the equity analysis. Accordingly, investors’ returns may be less than the original sum invested. Past performance is not necessarily a guide to future performance. This report is not intended to provide personal investment advice and does not take into account the specific investment objectives, the financial situation and the particular needs of persons who may receive or read this report. Investors should therefore seek financial, legal and other advice regarding the appropriateness of investing in any securities or the investment strategies discussed or recommended in this report.
The information contained herein has been obtained from sources believed to be reliable but such sources have not been independently verified by Maybank Investment Bank Berhad, its subsidiary and affiliates (collectively, “MKE”) and consequently no representation is made as to the accuracy or completeness of this report by MKE and it should not be relied upon as such. Accordingly, MKE and its officers, directors, associates, connected parties and/or employees (collectively, “Representatives”) shall not be liable for any direct, indirect or consequential losses or damages that may arise from the use or reliance of this report. Any information, opinions or recommendations contained herein are subject to change at any time, without prior notice.
This report may contain forward looking statements which are often but not always identified by the use of words such as “anticipate”, “believe”, “estimate”, “intend”, “plan”, “expect”, “forecast”, “predict” and “project” and statements that an event or result “may”, “will”, “can”, “should”, “could” or “might” occur or be achieved and other similar expressions. Such forward looking statements are based on assumptions made and information currently available to us and are subject to certain risks and uncertainties that could cause the actual results to differ materially from those expressed in any forward looking statements. Readers are cautioned not to place undue relevance on these forward-looking statements. MKE expressly disclaims any obligation to update or revise any such forward looking statements to reflect new information, events or circumstances after the date of this publication or to reflect the occurrence of unanticipated events.
MKE and its officers, directors and employees, including persons involved in the preparation or issuance of this report, may, to the extent permitted by law, from time to time participate or invest in financing transactions with the issuer(s) of the securities mentioned in this report, perform services for or solicit business from such issuers, and/or have a position or holding, or other material interest, or effect transactions, in such securities or options thereon, or other investments related thereto. In addition, it may make markets in the securities mentioned in the material presented in this report. MKE may, to the extent permitted by law, act upon or use the information presented herein, or the research or analysis on which they are based, before the material is published. One or more directors, officers and/or employees of MKE may be a director of the issuers of the securities mentioned in this report.
This report is prepared for the use of MKE’s clients and may not be reproduced, altered in any way, transmitted to, copied or distributed to any other party in whole or in part in any form or manner without the prior express written consent of MKE and MKE and its Representatives accepts no liability whatsoever for the actions of third parties in this respect.
This report is not directed to or intended for distribution to or use by any person or entity who is a citizen or resident of or located in any locality, state, country or other jurisdiction where such distribution, publication, availability or use would be contrary to law or regulation. This report is for distribution only under such circumstances as may be permitted by applicable law. The securities described herein may not be eligible for sale in all jurisdictions or to certain categories of investors. Without prejudice to the foregoing, the reader is to note that additional disclaimers, warnings or qualifications may apply based on geographical location of the person or entity receiving this report.
Malaysia
Opinions or recommendations contained herein are in the form of technical ratings and fundamental ratings. Technical ratings may differ from fundamental ratings as technical valuations apply different methodologies and are purely based on price and volume-related information extracted from Bursa Malaysia Securities Berhad in the equity analysis.
Singapore
This report has been produced as of the date hereof and the information herein may be subject to change. Maybank Kim Eng Research Pte. Ltd. (“Maybank KERPL”) in Singapore has no obligation to update such information for any recipient. For distribution in Singapore, recipients of this report are to contact Maybank KERPL in Singapore in respect of any matters arising from, or in connection with, this report. If the recipient of this report is not an accredited investor, expert investor or institutional investor (as defined under Section 4A of the Singapore Securities and Futures Act), Maybank KERPL shall be legally liable for the contents of this report, with such liability being limited to the extent (if any) as permitted by law.
Thailand
The disclosure of the survey result of the Thai Institute of Directors Association (“IOD”) regarding corporate governance is made pursuant to the policy of the Office of the Securities and Exchange Commission. The survey of the IOD is based on the information of a company listed on the Stock Exchange of Thailand and the market for Alternative Investment disclosed to the public and able to be accessed by a general public investor. The result, therefore, is from the perspective of a third party. It is not an evaluation of operation and is not based on inside information. The survey result is as of the date appearing in the Corporate Governance Report of Thai Listed Companies. As a result, the survey may be changed after that date. Maybank Kim Eng Securities (Thailand) Public Company Limited (“MBKET”) does not confirm nor certify the accuracy of such survey result.
Except as specifically permitted, no part of this presentation may be reproduced or distributed in any manner without the prior written permission of MBKET. MBKET accepts no liability whatsoever for the actions of third parties in this respect.
US
This research report prepared by MKE is distributed in the United States (“US”) to Major US Institutional Investors (as defined in Rule 15a-6 under the Securities Exchange Act of 1934, as amended) only by Maybank Kim Eng Securities USA Inc (“Maybank KESUSA”), a broker-dealer registered in the US (registered under Section 15 of the Securities Exchange Act of 1934, as amended). All responsibility for the distribution of this report by Maybank KESUSA in the US shall be borne by Maybank KESUSA. All resulting transactions by a US person or entity should be effected through a registered broker-dealer in the US. This report is not directed at you if MKE is prohibited or restricted by any legislation or regulation in any jurisdiction from making it available to you. You should satisfy yourself before reading it that Maybank KESUSA is permitted to provide research material concerning investments to you under relevant legislation and regulations.
UK
This document is being distributed by Maybank Kim Eng Securities (London) Ltd (“Maybank KESL”) which is authorized and regulated, by the Financial Services Authority and is for Informational Purposes only. This document is not intended for distribution to anyone defined as a Retail Client under the Financial Services and Markets Act 2000 within the UK. Any inclusion of a third party link is for the recipients convenience only, and that the firm does not take any responsibility for its comments or accuracy, and that access to such links is at the individuals own risk. Nothing in this report should be considered as constituting legal, accounting or tax advice, and that for accurate guidance recipients should consult with their own independent tax advisers.
June 19, 2014 14
Regional Materials Sector
Disclosure of Interest Malaysia: MKE and its Representatives may from time to time have positions or be materially interested in the securities referred to herein and may further act as market maker or may have assumed an underwriting commitment or deal with such securities and may also perform or seek to perform investment banking services, advisory and other services for or relating to those companies.
Singapore: As of 19 June 2014, Maybank KERPL and the covering analyst do not have any interest in any companies recommended in this research report.
Thailand: MBKET may have a business relationship with or may possibly be an issuer of derivative warrants on the securities /companies mentioned in the research report. Therefore, Investors should exercise their own judgment before making any investment decisions. MBKET, its associates, directors, connected parties and/or employees may from time to time have interests and/or underwriting commitments in the securities mentioned in this report.
Hong Kong: KESHK may have financial interests in relation to an issuer or a new listing applicant referred to as defined by the requirements under Paragraph 16.5(a) of the Hong Kong Code of Conduct for Persons Licensed by or Registered with the Securities and Futures Commission.
As of 19 June 2014, KESHK and the authoring analyst do not have any interest in any companies recommended in this research report.
MKE may have, within the last three years, served as manager or co-manager of a public offering of securities for, or currently may make a primary market in issues of, any or all of the entities mentioned in this report or may be providing, or have provided within the previous 12 months, significant advice or investment services in relation to the investment concerned or a related investment and may receive compensation for the services provided from the companies covered in this report.
OTHERS Analyst Certification of Independence The views expressed in this research report accurately reflect the analyst’s personal views about any and all of the subject securities or issuers; and no part of the research analyst’s compensation was, is or will be, directly or indirectly, related to the specific recommendations or views expressed in the report.
Reminder Structured securities are complex instruments, typically involve a high degree of risk and are intended for sale only to sophisticated investors who are capable of understanding and assuming the risks involved. The market value of any structured security may be affected by changes in economic, financial and political factors (including, but not limited to, spot and forward interest and exchange rates), time to maturity, market conditions and volatility and the credit quality of any issuer or reference issuer. Any investor interested in purchasing a structured product should conduct its own analysis of the product and consult with its own professional advisers as to the risks involved in making such a purchase.
No part of this material may be copied, photocopied or duplicated in any form by any means or redistributed without the prior consent of MKE.
Definition of Ratings
Maybank Kim Eng Research uses the following rating system BUY Return is expected to be above 10% in the next 12 months (excluding dividends) HOLD Return is expected to be between - 10% to +10% in the next 12 months (excluding dividends) SELL Return is expected to be below -10% in the next 12 months (excluding dividends)
Applicability of Ratings
The respective analyst maintains a coverage universe of stocks, the list of which may be adjusted according to needs. Investment ratings are only applicable to the stocks which form part of the coverage universe. Reports on companies which are not part of the coverage do not carry investment ratings as we do not actively follow developments in these companies.
DISCLOSURES Legal Entities Disclosures Malaysia: This report is issued and distributed in Malaysia by Maybank Investment Bank Berhad (15938-H) which is a Participating Organization of Bursa Malaysia Berhad and a holder of Capital Markets and Services License issued by the Securities Commission in Malaysia. Singapore: This material is issued and distributed in Singapore by Maybank KERPL (Co. Reg No 197201256N) which is regulated by the Monetary Authority of Singapore. Indonesia: PT Kim Eng Securities (“PTKES”) (Reg. No. KEP-251/PM/1992) is a member of the Indonesia Stock Exchange and is regulated by the BAPEPAM LK. Thailand: MBKET (Reg. No.0107545000314) is a member of the Stock Exchange of Thailand and is regulated by the Ministry of Finance and the Securities and Exchange Commission. Philippines: Maybank ATRKES (Reg. No.01-2004-00019) is a member of the Philippines Stock Exchange and is regulated by the Securities and Exchange Commission. Vietnam: Maybank Kim Eng Securities JSC (License Number: 71/UBCK-GP) is licensed under the State Securities Commission of Vietnam.Hong Kong: KESHK (Central Entity No AAD284) is regulated by the Securities and Futures Commission. India: Kim Eng Securities India Private Limited (“KESI”) is a participant of the National Stock Exchange of India Limited (Reg No: INF/INB 231452435) and the Bombay Stock Exchange (Reg. No. INF/INB 011452431) and is regulated by Securities and Exchange Board of India. KESI is also registered with SEBI as Category 1 Merchant Banker (Reg. No. INM 000011708) US: Maybank KESUSA is a member of/ and is authorized and regulated by the FINRA – Broker ID 27861. UK: Maybank KESL (Reg No 2377538) is authorized and regulated by the Financial Services Authority.

June 19, 2014 15
Regional Materials Sector
Malaysia Maybank Investment Bank Berhad (A Participating Organisation of Bursa Malaysia Securities Berhad) 33rd Floor, Menara Maybank, 100 Jalan Tun Perak, 50050 Kuala Lumpur Tel: (603) 2059 1888; Fax: (603) 2078 4194
Singapore Maybank Kim Eng Securities Pte Ltd Maybank Kim Eng Research Pte Ltd 9 Temasek Boulevard #39-00 Suntec Tower 2 Singapore 038989 Tel: (65) 6336 9090 Fax: (65) 6339 6003
London Maybank Kim Eng Securities (London) Ltd 6/F, 20 St. Dunstan’s Hill London EC3R 8HY, UK Tel: (44) 20 7621 9298 Dealers’ Tel: (44) 20 7626 2828 Fax: (44) 20 7283 6674
New York Maybank Kim Eng Securities USA Inc 777 Third Avenue, 21st Floor New York, NY 10017, U.S.A. Tel: (212) 688 8886 Fax: (212) 688 3500
Stockbroking Business: Level 8, Tower C, Dataran Maybank, No.1, Jalan Maarof 59000 Kuala Lumpur Tel: (603) 2297 8888 Fax: (603) 2282 5136
Hong Kong Kim Eng Securities (HK) Ltd Level 30, Three Pacific Place, 1 Queen’s Road East, Hong Kong Tel: (852) 2268 0800 Fax: (852) 2877 0104
Indonesia PT Maybank Kim Eng Securities Plaza Bapindo Citibank Tower 17th Floor Jl Jend. Sudirman Kav. 54-55 Jakarta 12190, Indonesia Tel: (62) 21 2557 1188 Fax: (62) 21 2557 1189
India Kim Eng Securities India Pvt Ltd 2nd Floor, The International 16, Maharishi Karve Road, Churchgate Station, Mumbai City - 400 020, India Tel: (91).22.6623.2600 Fax: (91).22.6623.2604
Philippines Maybank ATR Kim Eng Securities Inc. 17/F, Tower One & Exchange Plaza Ayala Triangle, Ayala Avenue Makati City, Philippines 1200 Tel: (63) 2 849 8888 Fax: (63) 2 848 5738
Thailand Maybank Kim Eng Securities (Thailand) Public Company Limited 999/9 The Offices at Central World, 20th - 21st Floor, Rama 1 Road Pathumwan, Bangkok 10330, Thailand Tel: (66) 2 658 6817 (sales) Tel: (66) 2 658 6801 (research)
Vietnam Maybank Kim Eng Securities Limited 4A-15+16 Floor Vincom Center Dong Khoi, 72 Le Thanh Ton St. District 1 Ho Chi Minh City, Vietnam Tel : (84) 844 555 888 Fax : (84) 8 38 271 030
Saudi Arabia In association with Anfaal Capital Villa 47, Tujjar Jeddah Prince Mohammed bin Abdulaziz Street P.O. Box 126575 Jeddah 21352 Tel: (966) 2 6068686 Fax: (966) 26068787
South Asia Sales Trading Kevin FOY [email protected] Tel: (65) 6336-5157 US Toll Free: 1-866-406-7447
North Asia Sales Trading Alex TSUN [email protected] Tel: (852) 2268 0228 US Toll Free: 1 877 837 7635
www.maybank-ke.com | www.maybank-keresearch.com