regional market outlook - congrex switzerland · regional market outlook south east asia (asean-5)...
TRANSCRIPT

REGIONAL MARKET
OUTLOOK SOUTH EAST ASIA (ASEAN-5)
IRAWAN B. KOESOEMO INKINDO – (Indonesia)
FIDIC ASPAC - Executive Committee/Chair Of Memberships Committee
BITA Consulting Companies – Executive Chairman

SINGAPORE
MYANMAR LAO PDR
VIETNAM CAMBODIA
THAILAND
MALAYSIA
PHILIPPINES
INDONESIA
BRUNEI
ASEAN-10 Real GDP growth: 5.4% (e) Nominal GDP: USD 2.3 tr GDP per capita USD 3,745 Population: 616 m
India Real GDP growth: 4.0% Nominal GDP: USD 1.8 tr GDP per capita USD 1,492 Population:1,223 m
China Real GDP growth: 7.8% Nominal GDP: USD 8.3 tr GDP per capita USD 6,076 Population: 1,345 m
MALAYSIA Real GDP growth: 5.6% Nominal GDP: USD 304 bn GDP / capita USD 10,304 PopulationL 29.5 m
VIETNAM Real GDP growth: 5.0% Nominal GDP: USD 138 bn GDP per capita USD 1,528 Population: 90.4m
INDONESIA Real GDP growth: 6.2% Nominal GDP: USD 878 bn GDP per capita USD 3,592 PopulationL 244 m
THAILAND Real GDP growth: 6.4% Nominal GDP: USD 366 bn GDP per capita USD 5,678 Population: 64.6 m
PHILIPPINES Real GDP growth: 6.6% Nominal GDP: USD 250 bn GDP per capita USD 2,614 Population: 95.8 m
Myanmar Real GDP growth: 6.3% Nominal GDP: USD 53.1 bn GDP per capita USD 835 PopulationL 63.7 m
Singapore Real GDP growth: 1.3% Nominal GDP: USD 277 bn GDP /capita USD 51,162 Population 5.4 m
Lao PDR Real GDP growth: 8.3% Nominal GDP: USD 9.2 bn GDP per capita USD 1,466 Population: 6.4 m
Brunei Real GDP growth: 1.3% Nominal GDP: USD 16.6 bn GDP /capita USD 41,703 Population: 0.4 m
Source: Deutsche Bank
Cambodia Real GDP growth: 6.5% Nominal GDP: USD 14.2 bn GDP per capita USD 934 Population: 15.3 m
ASEAN at a Glance

3
ASEAN General Economic Outlook
• Against the downward sentiment across the ASPAC region, major ASEAN Economies – Indonesia, Malaysia, the Philippines, Thailand and Vietnam – continue to outperform, thanks to their domestic focus (Note: Additionally, 2013 WEF stated that ASEAN is set to remain the most exciting global investment destiny for the next decade)
• The more domestically-led ASEAN economies, headed by the Philippines & Indonesia, continue to outperform the more trade-dependent newly industrialized economies (2013 GDP Growth: the Philippines: 6.9%; Indonesia: 6.1%; Vietnam & Malaysia: 5.3%; Thailand lags in this group as it is relatively more trade-dependent. For the entire ASEAN, S&P expects growth of 5.5% through 2015)
Source: Standard & Poor’s Ratings Services Report “Credit Conditions: Increased China Downsize Risk Dampens Asia’s Growth”– July/August 2013
Note: Assumption/base of S&P’s forecast •Rebound of US economy late 2013 and in 2014 •ASEAN forecast remains below trend due to flat growth in Europe (Asia’s biggest trading partner)
Note on ASEAN community by 2015 •ASEAN economies showed resilience and will post growth in mid 5% with strong performance is expected to continue in anticipation of the ASEAN community by 2015 •ASEAN’s strength lies in its formation as a regional trading block & not as a single member countries (WEK, Myanmar June 2013)
4
ASEAN General Construction
Outlook
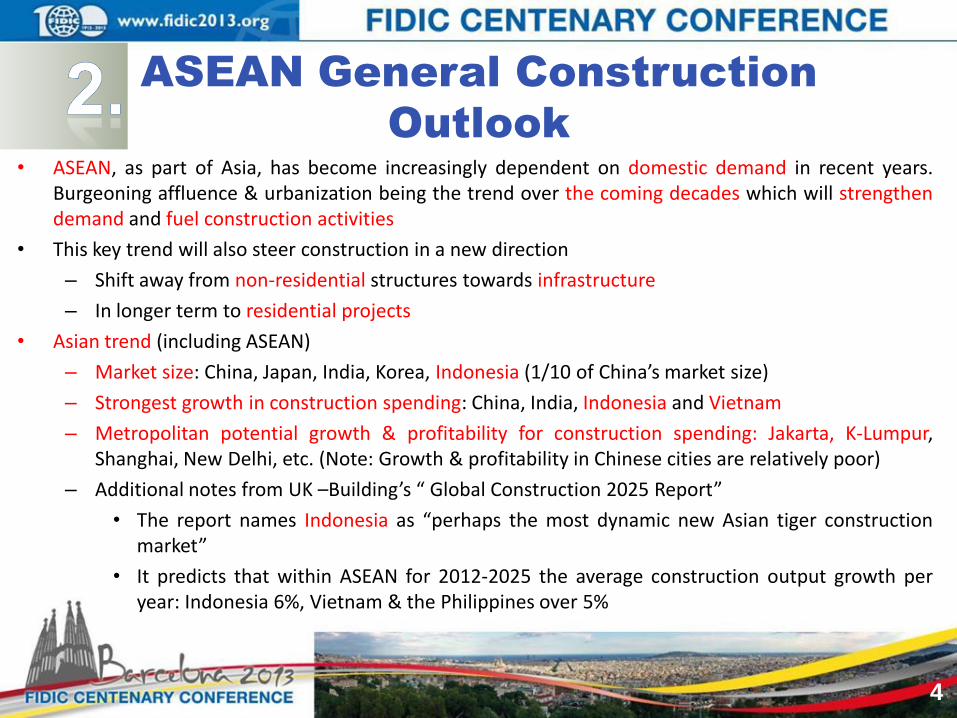
• ASEAN, as part of Asia, has become increasingly dependent on domestic demand in recent years. Burgeoning affluence & urbanization being the trend over the coming decades which will strengthen demand and fuel construction activities
• This key trend will also steer construction in a new direction
– Shift away from non-residential structures towards infrastructure
– In longer term to residential projects
• Asian trend (including ASEAN)
– Market size: China, Japan, India, Korea, Indonesia (1/10 of China’s market size)
– Strongest growth in construction spending: China, India, Indonesia and Vietnam
– Metropolitan potential growth & profitability for construction spending: Jakarta, K-Lumpur, Shanghai, New Delhi, etc. (Note: Growth & profitability in Chinese cities are relatively poor)
– Additional notes from UK –Building’s “ Global Construction 2025 Report”
• The report names Indonesia as “perhaps the most dynamic new Asian tiger construction market”
• It predicts that within ASEAN for 2012-2025 the average construction output growth per year: Indonesia 6%, Vietnam & the Philippines over 5%
5
ASEAN-5
Market
Thailand Indonesia Vietnam Philippines Malaysia
2012 Growth
p/a 2012 Growth
p/a 2012 Growth
p/a 2012 Growth
p/a 2012 Growth
p/a
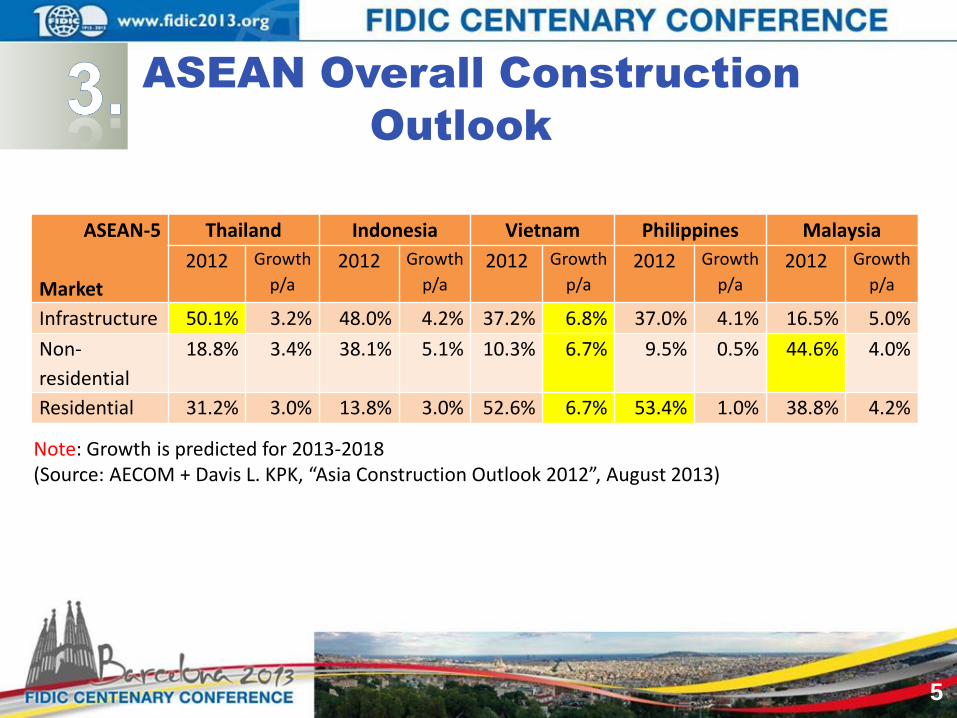
Infrastructure 50.1% 3.2% 48.0% 4.2% 37.2% 6.8% 37.0% 4.1% 16.5% 5.0%
Non-
residential
18.8% 3.4% 38.1% 5.1% 10.3% 6.7% 9.5% 0.5% 44.6% 4.0%
Residential 31.2% 3.0% 13.8% 3.0% 52.6% 6.7% 53.4% 1.0% 38.8% 4.2%
Note: Growth is predicted for 2013-2018 (Source: AECOM + Davis L. KPK, “Asia Construction Outlook 2012”, August 2013)
ASEAN Overall Construction
Outlook

6
ASEAN- Infrastructure Market
The importance of the infrastructure sector for ASEAN can be based on the followings:
• Level of average infrastructure investment in middle-income countries for ASEAN-5 is quite low compared to the past 10 years median at 27.6% of GDP
(Source: The World Bank, 2011)
• Sector construction spending trend (2012)
The general trend is supposed to be shift from non-residential towards infrastructure with longer term shift to residential
• Launching of country’s long-term strategic infrastructure development plan
Still room to expand -Philippines : 20.4% -Malaysia : 23.0%
-Thailand : 26.0% -Indonesia : 26.3%
– Indonesia : MP3EI (Master Plan for the Acceleration and Expansion of Indonesian Economic Development) http://kp3ei.go.id/in/main_ind/home
– Malaysia : Economic Transformation Programme http://etp.pemandu.gov.my/
– Philippines : PPP Programme http://ppp.gov.ph/
– Vietnam :Economical Master Plan (State Companies/Banking Restructurization + Financial System Overhaul)
7
ASEAN Residential/Non-Residential
Project Market
Real estate/property market (both residential/non-residential) in ASEAN-5 is being seen as an outperformer
•Increased transparency boosting ASEAN real estate transparency index revealed that across ASEAN-5 emerging markets the enhanced pace of transparency improvement in: Indonesia, the Philippines, Vietnam and Thailand had increased corporate real estate activities. These countries have experienced the most progress in transparency among ASPAC countries, and rank among the Top 10 Improvers Globally in overall transparency scores due to greater availability of market data + incremental changes in the regulatory and transaction process.
•Top destination for real estate property investments
– List of Asia’s Top 22 destinations for property investments by Urban Land Institute USA and PricewaterhouseCoopers listed Jakarta as No. 1, K-Lumpur as No. 5 and Bangkok as No. 6
– Residential market increase in capital value, as prepared by Colliers International indicated the followings:
– Highest potential for ROI was indicated by IP Global Dubai for Jakarta, K-Lumpur and Bangkok
•Jakarta/Indonesia 10.6% •Manila 6.2%
•Bangkok 5.0% •K-Lumpur FLAT

8
ASEAN Energy Outlook
Source ASEAN General/Specific Country (IES) Outlook Energy
Mix Growth
p/a Coal 29.3% 7.7% Due to projected rapid growth in electricity to be met largely by coal fired
generation/power-plants
Oil 35.1% 4.4% Dramatic shift from IOC dominated (70/30) to new NOC dominated market (45/55) ASEAN’s NOC: Petronas, PTT, Pertamina
Gas 16.0% 3.2% ETC will play major development roles IOC/NOC Partnerships become essential
Re
new
able
s
Hydro 7.1% Greater Mekong countries (Cambodia, Laos, Myanmar, Thailand + Vietnam) to develop hydropower for electricity trade among neighbors
Geothermal Indonesia (40% of global geothermal resources) to increase geothermal capacity from 1.2 gW to 9.5 gW in 2015
Wind Philippine (early 2013) approved 3 wind farms (208 MW) v/s 500 MW target by 2020 (part of 2030 target to ensure 50% mixable renewables
Solar Thailand (Jul’13) announced plan to build 3,000MW of solar power by 2021 (part of 13,927 MW clean energy target)
Biomass 1.7% Will continue to grow in ASEAN at a slow pace Source: ASEAN Centre for Energy (ACE), Jakarta

9
Foreign direct investment (FDI)
Market
FDI in ASEAN economies in 2012 are now at 7.6% almost equal to China’s 8.1%
HSBC predicted that with relatively better demographic growth, ASEAN economies share of global FDI will likely rise in the coming decade.
• Indonesia and Vietnam: Both countries look likely to benefit the most FDI from cost perspective, although more on the lower-end FDI market
– Vietnam: Relative to GDP, it attracts the 2nd most FDI among ASEAN countries after Singapore being with the cheapest wages in ASEAN-5. Moreover, given its proximity to China, Vietnam is able to benefit from existing supply chains.
– Indonesia: It has one of the world’s youngest demographic profiles (60% of population is below 30) – plentiful supply of relatively low-cost labor and dynamic domestic market with a rising urban middle class. Its manufacturing sector is experiencing most growth in FDI.
• Thailand: FDI’s diversifying from perceived risks of flooding and politics. But Thailand strongly makes up for it in skill levels as well as established ease of doing business. Thailand is likely to concentrate on medium to high-end FDI.
• Malaysia: with its relatively small population, it will not compete in labor-intensive manufacturing, but it has a niche FDI approach.
• The Philippines: While FDI is increasing from a low base, current constraints of restrictive policies + business environment will make FDI wait for the next election in 2016
Source: HSBC
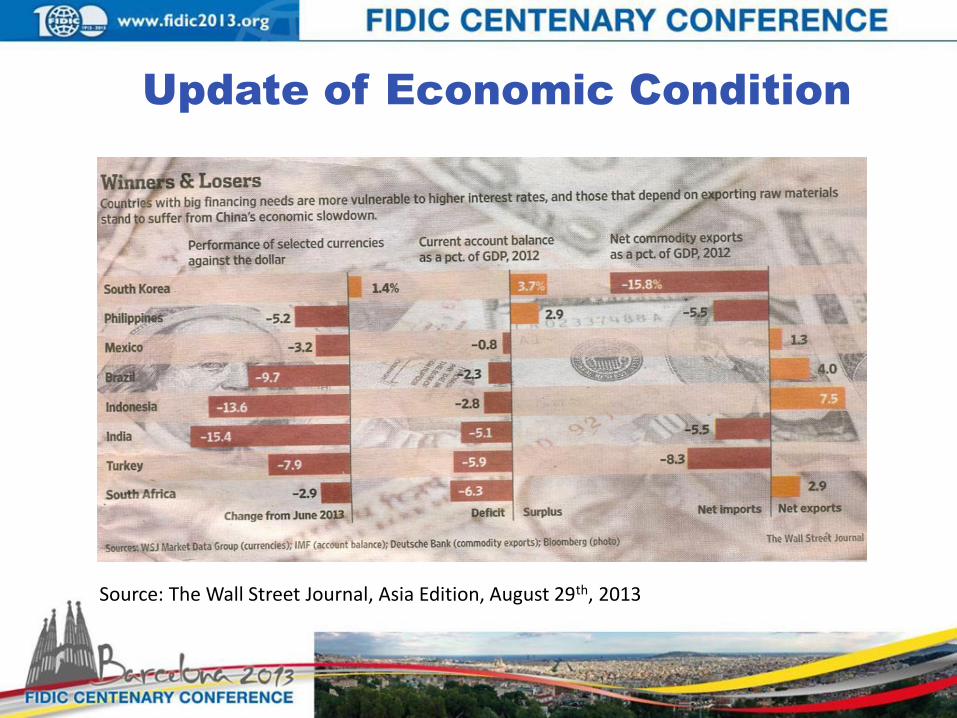
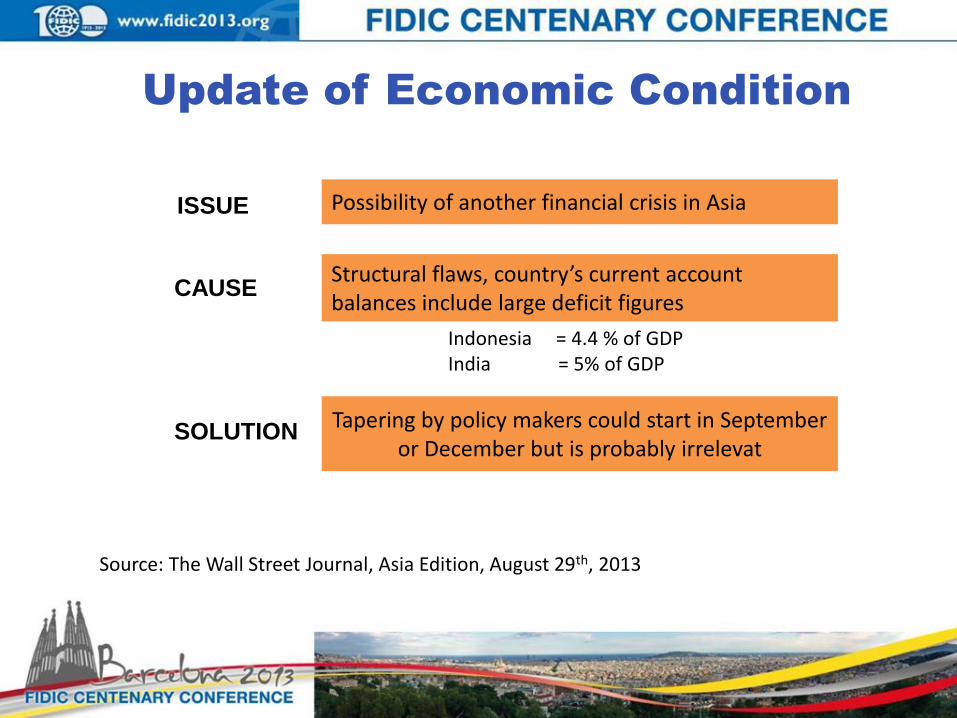
Update of Economic Condition
Source: The Wall Street Journal, Asia Edition, August 29th, 2013

Update of Economic Condition
2000-2011 Development Indonesia China
Wage 5.5% 7.2%
Productivity 3.4% 10.1%
Employees rallying for higher wages
But productivity does not follow
Uncertainty in business discourage potential foreign investor
Potential affect Indonesia ability to compete with other ASEAN countries
Source: Jakarta Post, September 6th, 2013
Update of Economic Condition
Indonesia = 4.4 % of GDP India = 5% of GDP
Source: The Wall Street Journal, Asia Edition, August 29th, 2013
Possibility of another financial crisis in Asia ISSUE
Structural flaws, country’s current account balances include large deficit figures
CAUSE
Tapering by policy makers could start in September or December but is probably irrelevat
SOLUTION

Thank you