regional demand recovery outlook what the data is telling
TRANSCRIPT

1 cirium.com
Regional Demand Recovery Outlook What the data is telling us
ICAO Webinar on Air Transport Data and Analytics
Henk Ombelet– Head of Advisory Operations
D R A F T
29 September 2021

2 cirium.com
Disclaimer of Liability
The material and information contained on this presentation is for general information purposes only.
You should not rely upon the material or information on the presentation as a basis for making any
business, legal or any other decisions.
Whilst we have made every attempt to ensure that the information contained in this presentation has
been obtained from reliable sources, Cirium is not responsible for any errors or omissions, or for the
results obtained from the use of this information.
Whilst we endeavour to keep the information up-to-date or correct, Cirium makes no representation or
warranties of any kind, express or implied about the completeness, accuracy, reliability, suitability or
availability with respect to the information, products or services or related graphics contained within the
presentation for any purpose. Any reliance you place on such material is therefore strictly at your own
risk. Cirium disclaims all warranties, express or implied, including but not limited to warranties of
performance, merchantability or fitness for a particular purpose. In no event will Cirium, its affiliates or
the partners, agents or employees thereof be liable to you, you clients or anyone else for any decision
made or action taken in reliance on the information on the presentation or for any consequential,
special or similar damages, even if advised of the possibility of such damages.

3 cirium.com
Agenda
Cirium Introduction
The state of the market
Recovery and challenges

4cirium.com
Powerful data, advanced analytics and open-system – it’s in our DNA
$10bn revenues
$40bn+ market capitalization.
180+ countries served
75%+ Fortune 500 as clients
30,000+ employees in 40 countries
High growth analytics supported by Big Data
$2.8bn revenues, 8,700 employees
5 petabyte HPCC open-source big data platform
Leading world positions: agriculture, aviation, banking, finance, insurance, law enforcement, national security & petrochemicals
Group Divisions Brands
Legal
Scientific, technical & medical
Exhibitions
Aviation & Travel Sector
Private & Confidential
Risk & data services
A global provider of information-based analytics and decision tools for customers.
5
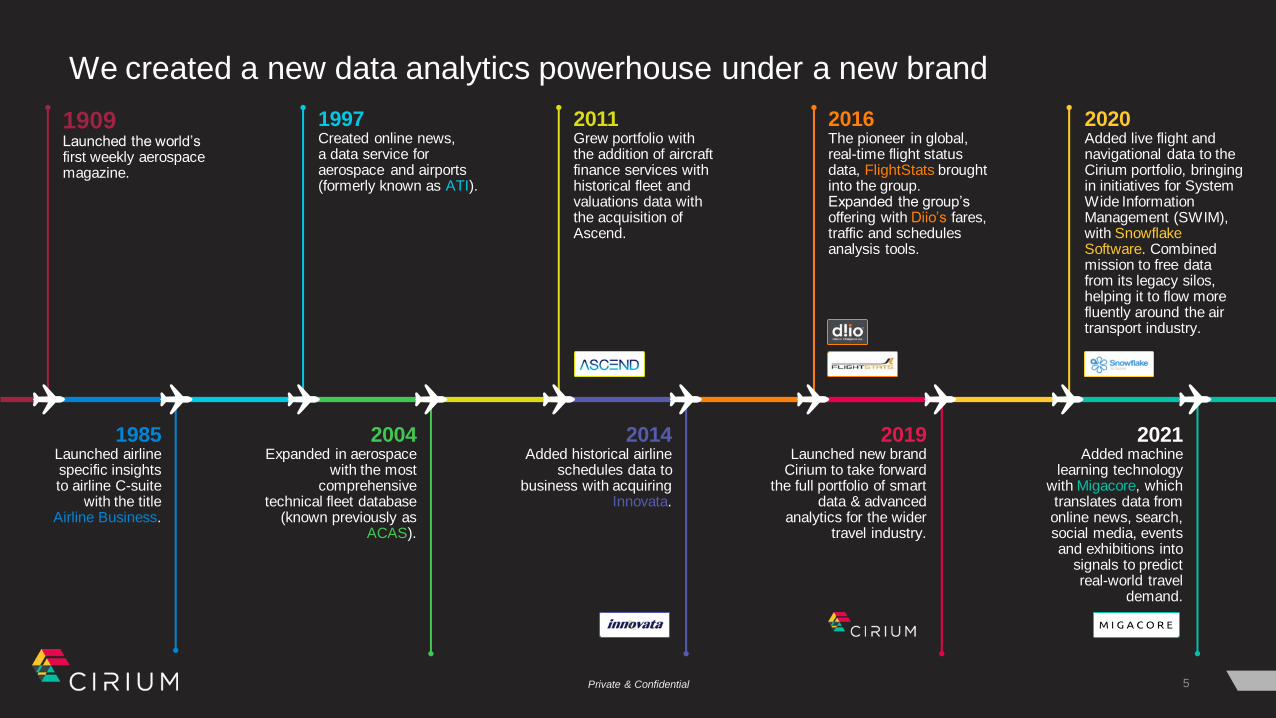
1909Launched the world’s first weekly aerospace magazine.
1997Created online news,a data service for aerospace and airports (formerly known as ATI).
2016The pioneer in global, real-time flight status data, FlightStats brought into the group. Expanded the group’s offering with Diio’s fares, traffic and schedules analysis tools.
2020Added live flight and navigational data to the Cirium portfolio, bringing in initiatives for System Wide Information Management (SWIM), with Snowflake Software. Combined mission to free data from its legacy silos, helping it to flow more fluently around the air transport industry.
1985Launched airline specific insights to airline C-suite
with the title Airline Business.
2004Expanded in aerospace
with the most comprehensive
technical fleet database (known previously as
ACAS).
2014Added historical airline
schedules data to business with acquiring
Innovata.
2019Launched new brand
Cirium to take forward the full portfolio of smart
data & advanced analytics for the wider
travel industry.
2021Added machine
learning technology with Migacore, which translates data from online news, search, social media, events and exhibitions into
signals to predict real-world travel
demand.
Private & Confidential
We created a new data analytics powerhouse under a new brand
2011Grew portfolio with the addition of aircraft finance services with historical fleet and valuations data with the acquisition of Ascend.

6cirium.com
Our mission…
We allow data to flow
fluidly, making it
available how, where
and when it is most
needed, regardless of
the systems and services
where it was created
or will be consumed
“”
Accelerating
Digital Transformation
Private & Confidential

7 cirium.com
The state of the market
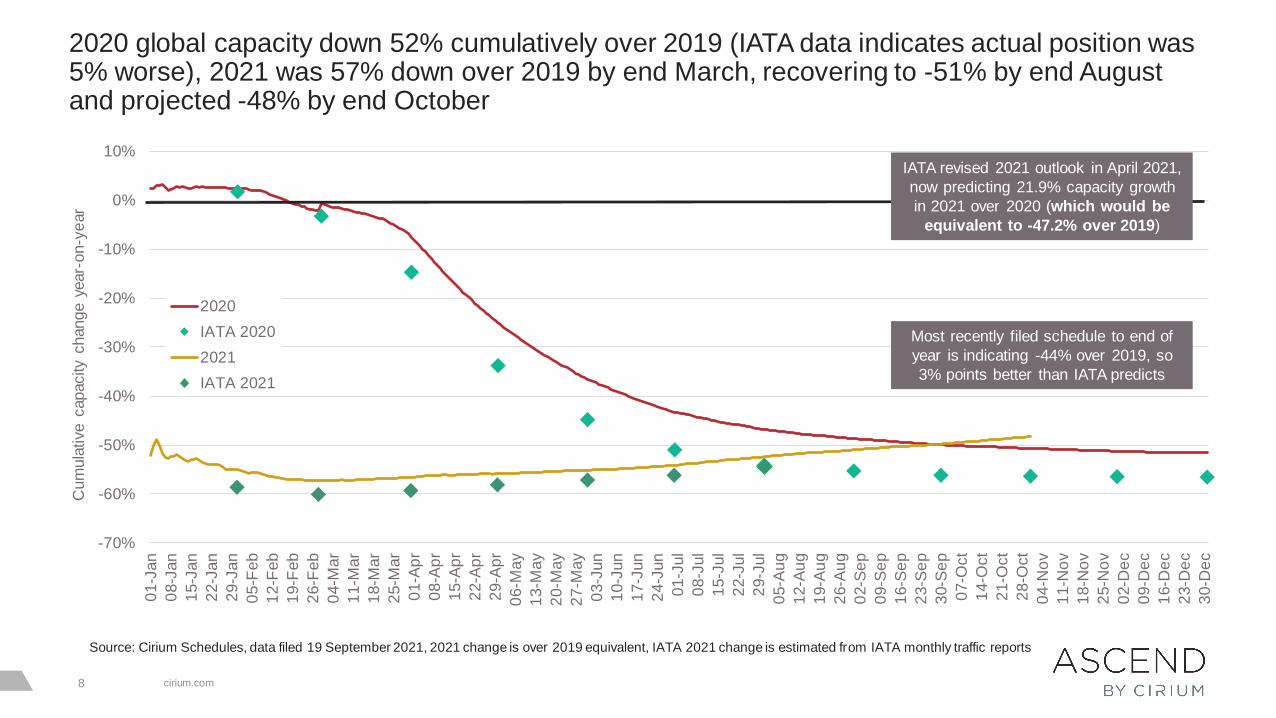
2020 global capacity down 52% cumulatively over 2019 (IATA data indicates actual position was 5% worse), 2021 was 57% down over 2019 by end March, recovering to -51% by end August and projected -48% by end October
cirium.com8
-70%
-60%
-50%
-40%
-30%
-20%
-10%
0%
10%0
1-J
an
08-J
an
15-J
an
22-J
an
29-J
an
05-F
eb
12-F
eb
19-F
eb
26-F
eb
04-M
ar
11-M
ar
18-M
ar
25-M
ar
01-A
pr
08-A
pr
15-A
pr
22-A
pr
29-A
pr
06-M
ay
13-M
ay
20-M
ay
27-M
ay
03-J
un
10-J
un
17-J
un
24-J
un
01-J
ul
08-J
ul
15-J
ul
22-J
ul
29-J
ul
05-A
ug
12-A
ug
19-A
ug
26-A
ug
02-S
ep
09-S
ep
16-S
ep
23-S
ep
30-S
ep
07-O
ct
14-O
ct
21-O
ct
28-O
ct
04-N
ov
11-N
ov
18-N
ov
25-N
ov
02-D
ec
09-D
ec
16-D
ec
23-D
ec
30-D
ec
Cum
ula
tive c
apacity
change y
ear-
on-y
ear
2020
IATA 2020
2021
IATA 2021
Most recently filed schedule to end of
year is indicating -44% over 2019, so
3% points better than IATA predicts
IATA revised 2021 outlook in April 2021,
now predicting 21.9% capacity growth
in 2021 over 2020 (which would be
equivalent to -47.2% over 2019)
Source: Cirium Schedules, data filed 19 September 2021, 2021 change is over 2019 equivalent, IATA 2021 change is estimated from IATA monthly traffic reports

China domestic showing recovery following significant decline in August, US domestic market also projecting improvement to only 3% down over 2019 by end October, Europe continues strong summer recovery into October, Intra-Asia remains >65% down through September
cirium.com9
-100%
-80%
-60%
-40%
-20%
0%
20%
40%
Daily
capacity
change y
ear-
on-y
ear
(rolli
ng 7
-day
ave
rag
e)
US Domestic Intra-S America Intra-Europe Intra-Asia China Domestic
Source: Cirium Schedules, data filed 19 September 2021, 2021 change is over 2019 equivalent

Long-haul all remained 60%-70% down over 2019 through end August 2021, Trans-Atlantic showing improvement through September and October, also slow improvement on Europe-Asia but all still down 50-70% by end September
cirium.com10
-100%
-80%
-60%
-40%
-20%
0%
20%
Daily
capacity
change y
ear-
on-y
ear
(rolli
ng 7
-day
ave
rag
e)
Trans-Atlantic Trans-Pacific Europe-Asia
Source: Cirium Schedules, data filed 19 September 2021, 2021 change is over 2019 equivalent

Global completed flights is back where we were a month ago, with no real change at the moment, nor any indication of improvement or otherwise.
cirium.com11
Source: Cirium FlightStats Includes all global scheduled passenger flights
0%
10%
20%
30%
40%
50%
60%
70%
0
20,000
40,000
60,000
80,000
100,000
120,000
Perc
enta
ge c
ancelle
d f
lights
Num
ber
of
flig
hts
Completed Cancelled 7 day mov avg - completed 7 day mov avg - percentage cancelled
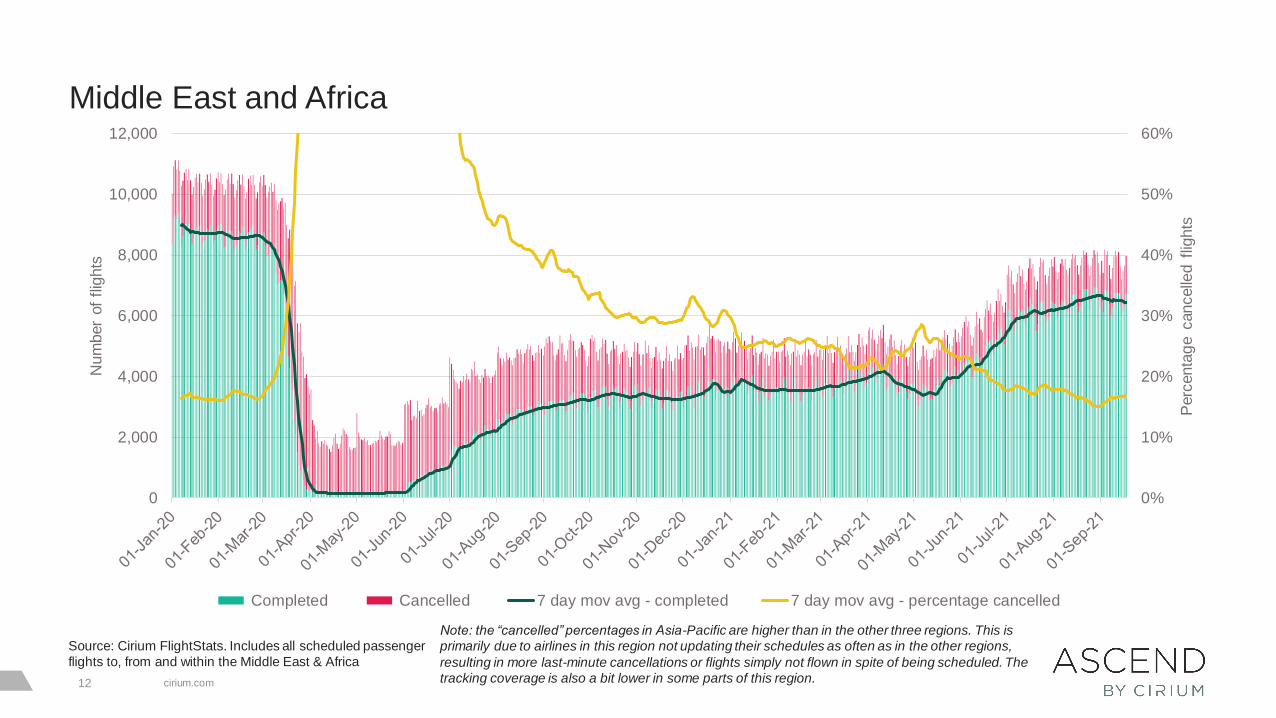
Middle East and Africa
cirium.com12
Source: Cirium FlightStats. Includes all scheduled passenger
flights to, from and within the Middle East & Africa
0%
10%
20%
30%
40%
50%
60%
0
2,000
4,000
6,000
8,000
10,000
12,000
Perc
enta
ge c
ancelle
d f
lights
Num
ber
of
flig
hts
Completed Cancelled 7 day mov avg - completed 7 day mov avg - percentage cancelled
Note: the “cancelled” percentages in Asia-Pacific are higher than in the other three regions. This is
primarily due to airlines in this region not updating their schedules as often as in the other regions,
resulting in more last-minute cancellations or flights simply not flown in spite of being scheduled. The
tracking coverage is also a bit lower in some parts of this region.

Fleet tracking starting to recover back to growth trend as China fleet increases again, marginal growth continues in Asia-Pacific (excluding China) this week, all other regions stable or showing marginal declines over last week
cirium.com13
Source: Cirium utilisation data, commercial passenger jets, utilisation data for aircraft tracked on a daily basis only
0
2,000
4,000
6,000
8,000
10,000
12,000
14,000
16,000
Glo
bal
aircra
ft t
racked d
aily
Single-Aisle
Twin-Aisle
11,908 single-aisle aircraft
tracked on 17 September 2021
vs 14,083 on 3 January 2020
2,518 twin-aisle aircraft tracked
on 17 September 2021 vs
4,089 on 3 January 2020

Average daily utilisation largely stable since early July
cirium.com14
4
5
6
7
8
9
10
11
12
13
14
Fle
et
ave
rag
e d
aily
flig
ht
hours
Single-Aisle
Twin-Aisle
Twin-aisle down on average
16% since start of 2020
Single-aisle down on average
15% since start of 2020
Source: Cirium utilisation data, commercial passenger jets, utilisation data for aircraft tracked on a daily basis only

68 Airline restructurings and bankruptcies
cirium.com15
Source: Cirium Fleets Analyzer
A319, 85
A320, 288
A321, 81
A330, 81
A340, 11A350, 26
A380, 6737 (All),
281
787, 67
767, 41747, 11
777, 49
Turbo props,
86
Embraer E-
Jets, 115
Other, 237
A320neo,
154
A321neo, 39
A350, 4
737 Max,
109
787, 5
777F, 1
ATR72/42, 5
A220, 4
ARJ21, 5
Aircraft in service/storage Aircraft on order
Note: this data only includes airlines
quoted on the previous slide

16 cirium.com
Recovery and challenges
17 cirium.com
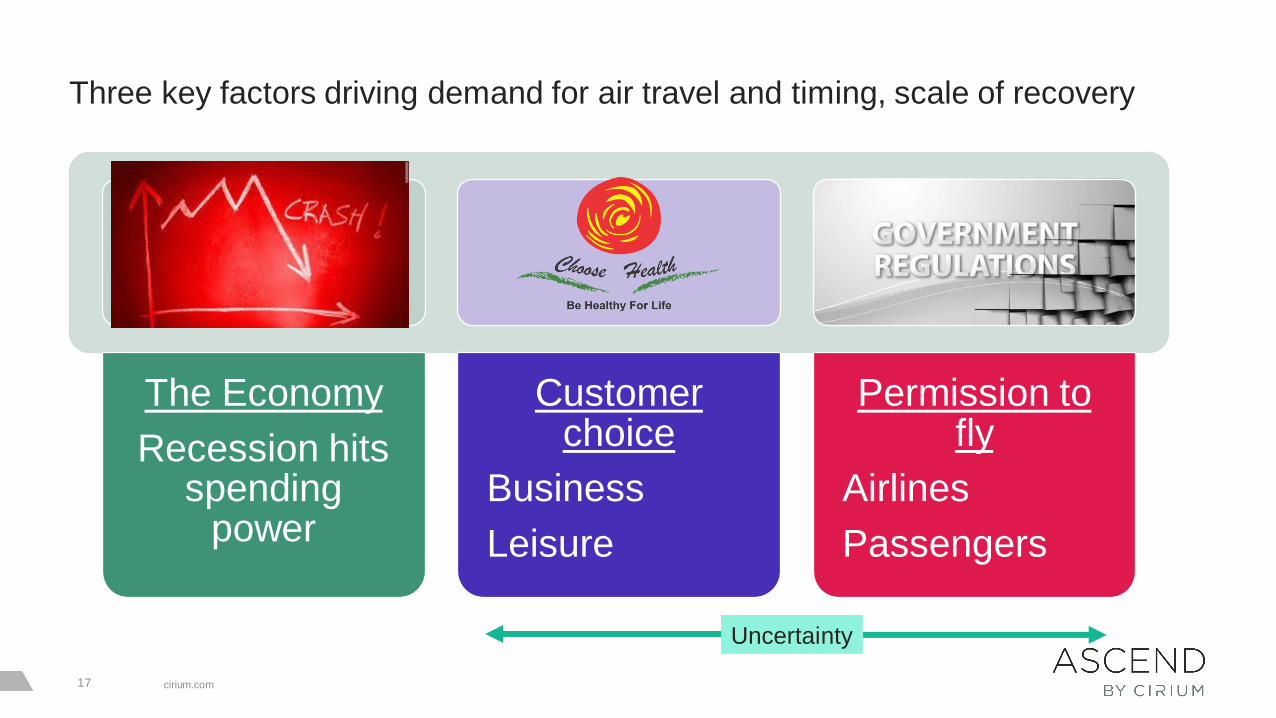
Three key factors driving demand for air travel and timing, scale of recovery
The Economy
Recession hits spending
power
Customer choice
Business
Leisure
Permission to fly
Airlines
Passengers
Uncertainty

18 cirium.com
For GDP, a return to ‘Normal’ growth levels suggested, with Asia leading the way
-8
-6
-4
-2
0
2
4
6
8
% G
DP
gro
wth
Regional GDP Growth Expectations to 2025
Asia and Australasia - [19] Eastern Europe - [13]
Latin America - [20] Middle-East and North Africa - [19]
North America - [2] Sub-Saharan Africa - [17]
Western Europe - [21]
Source: EIU Sep 21

19 cirium.com
Signposts to scenarios
cirium.com19
Issue Signposts – timing/nature varies by scenario
Covid-19 scenario Rate of new cases, Pace of vaccine roll-outs.
Economic forecast GDP forecast levels, direction of change of forecasts, PMIs
Demand recovery IATA traffic releases, Forward schedule, airline ASK announcements, flights flown, level of
cancellations, Travel Agent survey
Travel restrictions Timing of domestic, intra-regional, intercontinental easing. Timing of international travel within EU of
particular note.
Airline environment Airline bankruptcies, lease returns, market values and lease rates
Fleet surplus Fleet in-service, utilisation levels, load factor
OEM production OEMs maintain production at minimum viable rates, before slow recovery in deliveries from 2022

20 cirium.com
‘Opening up’ scenarios based on >70% of adult population vaccinated
Date by when 70% expected to be
fully vaccinatedCountries – ranked by population/ASKs
NowMost of EU, UK, China, Brazil, Canada,
Singapore, Israel, UAE, Chile
Q4 2021
USA, Japan, Mexico, Turkey, South
Korea, Argentina, Morocco, Saudi Arabia,
Malaysia, Australia, Ecuador, Cambodia
Q1 2022Thailand, Colombia, Peru, Taiwan, Kazakhstan,
Tunisia
Q2 2022 India, Indonesia, Russia
H2 2022 Pakistan, Philippines, Vietnam, South Africa,
2023 or later Bangladesh, Ukraine, most of Africa, others

21 cirium.com
Recovery to 2019 demand levels is not synchronous, but in both scenarios long-haul lags domestic and regional, driving at least two more years of sub-2019 demand
cirium.com21
Scenario 4 Scenario 5
Asia Pacific May 2024 March 2023
Europe March 2025 May 2023
North America December 2024 September 2023
China April 2023 September 2022
Latin America October 2024 July 2023
Middle East January 2025 April 2024
Africa June 2025 March 2024
Russia/CIS July 2024 June 2023
World total August 2024 May 2023
Source: Ascend by Cirium Scenario Analysis, total market

July 2021 RPKs down 53.1% vs 2019, a 7% point improvement on June, August expected to be down 52-56%
-100%
-90%
-80%
-70%
-60%
-50%
-40%
-30%
-20%
-10%
0%
0
100
200
300
400
500
600
700
800
900
1000
Change v
s 2
019
RP
K (
bn)
RPK S3 RPK S4 RPK S5 RPK actual RPK change actual RPK change S4
cirium.com22
Source: Cirium schedules, Ascend by Cirium analysis, IATA (Load Factor)

23 cirium.com
Passenger fleet in service is increasing ahead of more optimistic recovery scenario (S5)
0
2000
4000
6000
8000
10000
12000
14000
16000
18000
20000
22000
Aircra
ft in a
irlin
e p
asseng
er
serv
ice
Actual NB fleet Actual WB fleet Total fleet S1 Total fleet S4 Total fleet S3 Total fleet S5
cirium.com23
Source: Cirium Fleets Analyzer, Ascend by Cirium analysis

24 cirium.com
Aviation Outlook
Conclusions
GDP has been the key driver of long term airline traffic growth
and remains so, but environmental concerns moving up
agenda
Covid-19 dramatically impacted GDP and traffic forecasts. In
addition, consumer health concerns and government
restrictions have reinforced the impact on aviation
The reduction in passenger traffic seen in 2020, around 12
times the level of reduction in GDP, is completely
unprecedented
While GDP growth has turned positive in 2021, traffic
recovery remains stilted
Domestic and regional routes have recovered fastest
Recovery of global traffic could be expected by 2023/4 but
likely many different impacts will be seen on route networks
The continued viability of many elements of the aviation and
travel and tourism supply chain is still uncertain.

