regional and international trade of armenia: perspectives and
TRANSCRIPT

ISSN 1561-2422
REGIONAL AND INTERNATIONAL
TRADE OF ARMENIA:
PERSPECTIVES AND POTENTIALS
Grigor Hayrapetyan
Viktoriya Hayrapetyan
Working paper No11/14E
This project (No R10-0421) was supported
by the Economics Education and Research Consortium and funded by GDN
All opinions expressed here are those of the authors
and not those of the Economics Education and Research Consortium
Research dissemination by the EERC may include views on policy, but the EERC itself takes no institutional policy positions

2
Hayrapetyan Grigor, Hayrapetyan Viktoriya. Regional and international trade of Armenia: perspectives and potentials. – Kiev: EERC, 2011. – 48 p.
Research area: International trade.
JEL classification code: F10, F13, F14, F17.
Abstract: Unfavorable geopolitical situation and small scale of economy, trade balance deficit and raw-materials export enforce Armenia to look for new geographical and product perspectives in its foreign trade. Our paper aims to estimate trade potential for Armenia by product groups in regional and international directions using gravity approach. Applied gravity model estimates trade flows, which are disaggregated into 7 groups according to BEC’s 1-digit classification, between 139 countries during 2003-2007. Our key findings imply that trade relations of Armenia with most of main trade partners have no potential to develop. Armenia has exceeded its export potential almost with all the CIS countries. Trade relations with the EU countries should be re-considered on both product and geographical directions. Re-opening of Armenian-Turkish border could provide significant economic benefit for Armenian exporters. The most perspective product groups of Armenian export seem to be “Industrial supplies”, “Food and beverages”, and “Consumer goods”.
Key words: export, trade balance deficit, gravity equation, trade potential.
Acknowledgements: We would like to express our gratefulness to Oleksandr Shepotylo (Kyiv School of Economics, Kyiv, Ukraine) and Joao M.C. Santos Silva (University of Essex, Colchester, UK) for their constructive comments, discussions and recommendations that substantially improved this paper. We thank Natalia Bystrytska (EERC Program Manager) for support during whole working process.
Grigor Hayrapetyan PhD, Associate Professor, Department of International Economics Faculty of Economics Yerevan State University Abovyan Street 52, Yerevan, Armenia, 0025 E-mail: [email protected] Viktoriya Hayrapetyan PhD, Senior Lecturer, Department of Economics and Finance Faculty of Economics Russian-Armenian (Slavonic) University O. Emin Street 123, Yerevan, Armenia, 0051 E-mail: [email protected]

3
CONTENTS Non-technical summary 4
Introduction 6
Foreign trade of Armenia in a brief 8
Literature review 13
Our approach 16
Data sample 16
Model 19
Estimation strategy 20
Estimation results 24
Interpretations of the results 25
Conclusions 31
Appendices 33
References 46
4
NON-TECHNICAL SUMMARY
The problem of the trade flows expansion is an urgent topic in the modern economic
literature. There are many studies dedicated to reveal the determinants and the perspective
directions of the trade flows. In the most part of them the gravity model is used as an empirical tool
to model bilateral trade flows and then to estimate trade potentials between countries. Usually the
standard set of the gravity equation’s determinants is applied, among them there are volume of
GDP and number of population (or GDP per capita) in the exporting and importing countries,
geographical distance, historical and cultural similarities between them.
Our contribution to the existing literature is to apply the gravity equation to estimate world
trade flows and then to use the obtained coefficients to estimate trade potential for Armenia.
Considering the policy-making aspects of the topic the results of this research can be interpreted
as a base to re-direct Armenian foreign trade policy by encouraging at the official level the trade
relations with countries where Armenia has export potential. Armenia’s geographical location,
the relatively small scale of the economy, as well political and historical peculiarities of the
South Caucasian region’s development imply that significant economic benefit can be derived
from developing stronger links between Armenia and other countries all over the world. It’ll
allow to expand Armenian foreign economic relations and to implement structural changes both
for the entire economic system and foreign trade sphere.
We apply the gravity model to estimate trade flows between 139 countries all over the
world for the years 2003-2007. The trade flows data is disaggregated into seven groups
according to Broad Economic Categories’ 1-digit classification that allows predicting changes in
geographical and product compositions of foreign trade flows. Having estimated the gravity
model for world bilateral trade flows we proceed to estimate trade potential for Armenia. We
calculate export potential as a difference between predicted by the model and actual export
volumes. Depending on the value of the export potential we divide Armenia’s trade partners into
two groups: (i) countries where Armenia has exceeded its trade potential in export (there are 18

5
countries); and (ii) countries where Armenia has export potential (there are 120 countries, among
them 39 countries present the possibility to increase Armenian export more than 3 US$ millions
to each country).
Our key findings imply that the present geographical and product compositions of
Armenian export are insufficient: trade relations with the most of the main trade partners,
including two neighboring countries – Georgia and Iran, have no potential to develop. As well
Armenia has exceeded its export potential almost to all the CIS countries. Current trade relations
of Armenia with the EU countries should be re-considered along the lines of advancing of
Armenian products to the markets of France, the UK, Spain, Italy, Sweden, Poland, and Greece.
Re-opening of the Armenian-Turkish border will present the possibility to increase total
Armenian export to Turkey by 40.72 US$ millions. With regard to product composition of
Armenian export the most perspective groups seem to be “Industrial supplies”, “Food and
beverages”, and “Consumer goods”.

6
INTRODUCTION
This paper studies the problems and the prospects of Armenian exports’ expansion at the
international markets in both geographical and product directions. The unfavorable geopolitical
situation in the South Caucasian region and the remnants of the post-soviet heritage has
negatively influenced on the development of Armenian economy in a whole and of its foreign
trade flows particularly.
The main foreign trade problems that Armenia faces today are the trade balance deficit and
the raw-materials export. Under these conditions being a small, landlocked and economically
blockaded country and having not sufficient national market in order to provide dynamic
economic growth Armenia has to look for new geographical and product perspectives in its
foreign trade.
Leading trading partners of Armenia are the EU and the CIS countries. So the most
interesting issue in our study is to estimate the export potentials for Armenia with these groups
of countries. As well the perspectives of trade relations’ enhancement with neighboring countries
are of a big interest taking into account the present geopolitical situation of Armenia – economic
blockade with two neighbors. Thus there are four main directions of interpretations of the
obtained results that are on the agenda in the policy context of our study: trade potentials for
Armenia with the EU countries, with the CIS countries, with neighboring countries, and with
other countries.
There are many papers that describe the current tendencies of Armenian trade relations’
development but it is lack of the studies that would consider the reasons of this phenomenon and
try to find the ways to improve Armenian foreign trade compositions in geographical and
product directions. There are just a few papers that partly study these issues since they are
dedicated to the matters of re-opening of closed border between Armenia and Turkey and to the
problems of export diversification of countries’ group including Armenia.1
1Freinkman et al., 2004; Beilock and Torosyan, 2007; Shepotylo, 2009b.
7
Our paper aims to estimate the trade potential for Armenia by product groups in regional
and international directions using gravity approach. In our research we are going to find the
answers the following questions: what countries are the perspective trade partners for Armenia;
on which product groups Armenian export flows can be expanded; how trade liberalization
between Armenia and Turkey would impact bilateral trade flows in overall and by sectors;
whether Armenia has exhausted or unexplored its trade potential with the EU and the CIS
countries; is there any possibility to enhance the regional trade flows in the South Caucasian
region. Thus the contribution of this paper into existing literature is the estimation of the current
Armenian foreign trade flows’ product and geographical compositions and the identification of
the potential directions of Armenian export’s expansion.
Our trade flows data is disaggregated into seven groups according to Broad Economic
Categories’ 1-digit classification. Using of the disaggregated trade data provides two main
results: (i) the list of countries that have potential to expand Armenian export to, (ii) and the list
of product groups on which Armenian export should be enhanced. Today Armenia has free trade
agreements only with seven countries (the CIS countries). The result of this research can be
considered as an empirical platform to develop foreign trade policy of Armenia by enhancing the
trade relations with more countries all over the world.
The rest of the paper is organized in the following way. The next section presents the brief
description of Armenian foreign trade: policy aspects and current dynamics. Then we review the
existing literature on the topic. In the following section we give the econometric specification of
applied gravity equation, our data sample, and strategy of estimation. The last sections present
the interpretations of the results and the conclusions.

8
FOREIGN TRADE OF ARMENIA IN A BRIEF
Foreign economic policy of Armenia is based on the liberal principles and directed to the
widening of its integration into the world economy2. Since 1991 Armenian government has
signed bilateral trade and economic agreements with 40 countries all over the world3. As well
Armenia has signed the Free Trade Agreements with seven countries, however all of them are
the CIS countries; there are Kazakhstan, Georgia4, Turkmenistan, Ukraine, Moldova,
Kyrgyzstan, and Russian Federation (Appendices Table 1). Since 2003 Armenia is a member of
WTO5. According to the governments’ declarations foreign trade policy of Armenia is directed
to the formation of a favorable field for businesses involved in foreign trade and to the
stimulation of export of domestic goods. But present situation of Armenian foreign trade
witnesses that their efforts are not as successful as it was expected.
The role of Armenia in the world and especially in the regional trade flows is rather modest
that is caused by some peculiarities of its historical and economical development. The first is the
geopolitical situation that is not favorable for developing regional trade relations. Armenian
border is blockaded with two neighboring countries: Azerbaijan and Turkey. The border between
Armenia and Azerbaijan was closed in November 1992, when Azerbaijan blocked land
communication to Armenia with the start of the conflict over Nagorno-Karabakh (Iskandaryan
and Minasyan, 2010).
In 1991 Turkey was one of the first countries to recognize Armenian independence, but the
war between Armenia and Azerbaijan over Nagorno-Karabakh prompted Turkey to seal its
border with Armenia and withhold normal diplomatic relations (Giragosian, 2009). As well
Armenia and Turkey have different opinions concerning the events of 1915: Armenian
authorities pursue international recognition of these events as genocide, Turkish officials tend to
view the same period as anything but genocide (Giragosian, 2009). Later on the political
2Investment policy and foreign economic cooperation // http://www.mineconomy.am/ru/14/ 3 List of bilateral agreements signed in sphere of trade-economy // http://www.mineconomy.am/en/14/ 4 Georgia withdrew from CIS in 2009. 5World Trade Organization // www.wto.org

9
relations between Armenia and Turkey became slowly improving that was connected with the
start of the process that is known as “football diplomacy”: in July 2008, Armenian President
extended a public invitation to his Turkish counterpart to attend a 2010 World Cup qualifying
match between the Armenian and Turkish football teams hosted in the Armenian capital in
September 2008 (Giragosian, 2009). After the historic visit, two meetings between Armenian
and Turkish officials were held aiming to offer both countries a new opportunity to move
forward in seeking to normalize relations (Giragosian, 2009). As a result on October 10, 2009
the governments of the two countries signed two Protocols on the establishment of diplomatic
ties and the opening of mutual borders (Iskandaryan and Minasyan, 2010). However these
Protocols didn’t come into legal force because they weren’t ratified by countries’ parliaments by
political reasons. So in general situation has not been changed and Armenian-Turkish border is
closed till the present.
Thus the only land access to and from Armenia is via Georgia and Iran. Iran is under
embargo by most of the rest of the world. Transport through Georgia a few years ago was
associated with bribery, restricted travel time, insecurity, and the poor quality of roads and
railways. Because of this situation trucking companies based in Armenia couldn’t transport
goods competitively to the Black Sea or to Russia (Polyakov, 2002). Now-a-days transport
infrastructure, the legal environment and level of development are changing rapidly. Roads are
already dramatically better than they were a few years ago.6 At the same time Iranian and
Georgian routes are very expansive. Mediterranean seaports are of greater interest for Armenia
than those of the Black Sea. The Black Sea ports do not allow the use of ocean container carriers.
This is the reason that, for instance, the cost of freight forwarding from Poti to Marseille is 700-
800 USD per container, and from Beirut to Marseille is 100 USD, since in the latter case ocean
ships are used, that have a large capacity and therefore a low cargo transportation cost price.7
6 Study of Economic Relations between Georgia and Armenia: The Development of Regional Trade Related Growth in Samtskhe-Javakheti. CRRC-Georgia. August - September 2007. 7 Doing Business in Armenia and Turkey, CSERA, June 2009.

10
The second peculiarity causing the present economic situation in Armenia is a post-soviet
heritage. As other soviet republics Armenia was deeply integrated into the common economic
mechanism of USSR. Under the command economy trade patterns were to a large extent
determined not by the market forces but by planning authorities (Shepotylo, 2009b). After
collapse of USSR all economic ties between Armenia and other republics were broken that was
caused by the role played by big industrial plants that produced mostly intermediary goods, with
both suppliers and customers located in the rest of the former Soviet Union republics.
Taking into account all mentioned above we can characterize Armenia as a small,
landlocked and economically blockaded country, which faces high transportation costs that
impede to export of manufacturing goods, food, light industrial machinery, rubber, chemicals
and electronics (these products were the main titles of export from Armenia to other Soviet
republics). Now-a-days Armenia is developing niche markets in lightweight products with low
transportation costs and highly skilled labor inputs (such as processed diamonds, precious stones,
and computer software) which can be easily airlifted.
Since achieving macroeconomic stabilization in 1995 Armenia has demonstrated good
economic results: economic growth averaged about 12% over the years 2001–2008 and recorded
almost 6.8% in 2008 that was stipulated by financial crisis8.
The volumes of Armenian foreign trade have been growing as well. For period 1997-2007
export increased about 5 times and import – about 3.5 times, the share of Armenia in the world
trade grew about 2 times in export and 1.5 times in import9. Trade turnover for the years 1997-
2007 grew almost 4 times (Figure 1).
At the same time the trade balance deficit has been stably increasing: in 2007 it was 3.2
times higher than it had been in1997. Trade to GDP ratio amounted about 49% in 2007 (mostly
due to huge volumes of import) but the average value for “Low & middle income countries”
8Statistical Yearbook of the Republic of Armenia, 2008 // www.armstat.am 9 But in the global terms it is still very small – in 2007 the share of Armenia amounted about 0.01% of world export and 0.022% of world import (source for calculations: database “World Development Indicators 2008”).

11
(Armenia belongs to this group according to World Bank classification) was about 57%. Thus
Armenia has some “reserves” for increasing its trade flows especially export.
Figure 1: Dynamics of Armenian Foreign Trade Flows (millions US dollars)10
In 2007 the leading directions of Armenian export were Russian Federation, Germany,
Netherlands, Belgium and Georgia (Table 1).
Table 1: Geographical Composition of Armenian Foreign Trade (2007)11
EXPORT IMPORT Country Share (%) Country Share (%)
1 Russia 17.5 1 Russia 22.0 2 Germany 14.7 2 Ukraine 7.7 3 Netherlands 13.5 3 Kazakhstan 7.4 4 Belgium 8.7 4 Germany 6.8 5 Georgia 7.6 5 China 6.0 6 USA 4.5 6 France 4.6 7 Switzerland 4.3 7 USA 4.4 8 Bulgaria 4.1 8 Iran 4.3 9 Ukraine 4.0 9 Turkey 4.0 10 Iran 3.3 10 Austria 3.8
Above 10 82.2 Above 10 71.0
The product composition of Armenian trade flows shows that mainly Armenia provides to
these countries raw materials or products with low added value (Table 2). The only exception is
Armenian export to Russian markets; final products here amount about 60 per cent.
Armenian foreign trade geographical direction has changed several times. It can be divided
into three phases: (i) 1991-1998 - the main trading partners were the CIS countries; (ii) 1998- 10 Statistical Yearbook of the Republic of Armenia, 2008 // www.armstat.am 11 Statistical Yearbook of the Republic of Armenia, 2008 // www.armstat.am
-3000-2000-1000
010002000300040005000
1993 1994 1995 1996 1997 1998 1999 2000 2001 2002 2003 2004 2005 2006 2007
Export Import Trade Balance Trade Turnover

12
2002 - the share of the CIS countries was declining in the favor of the EU countries; (iii) 2002-
2007 - increasing of trade flows with the CIS and the EU countries. In 2007 the share of both the
EU and the CIS countries came up 70% of total Armenian trade turnover (Appendices Figure 1).
Table 2: Product Composition of Armenian Export (top-5 directions) (2007)12
Product group Share, % Product group Share,
% Russian Federation 100 Germany 100 Alcoholic and non-alcoholic beverages and vinegar 58.3 Iron and steel 43.6
Pearls, precious stones, metals, coins 15.5 Copper and articlesthereof 34.4
Electrical machinery, equipment 4.0 Non-precious metals and articles thereof 10.7
Netherlands 100 Georgia 100
Iron and steel 96.7 Building materials 46.7
Belgium 100 Coffee, tea and other spices 14.7
Pearls, precious stones, metals, coins 93.3 Glass and glassware 9.7
Since 1998 till present one of the main trade partners of Armenia is the EU countries. After
enlargement of the European Union on 1 May 2004 significant shifts were broken in the
relationships between the EU and Armenia in political, geographic and economic terms. Most
important event became the implementation of the European Neighborhood Policy of the
European Union that sets ambitious objectives based on commitments to shared values and
effective implementation of political, economic and institutional reforms13. The European
Neighborhood Policy partners are expected to benefit from closer cooperation with the EU, the
chance to participate in EU programmes and a stake in the EU’s internal market, which will
strongly support their own political and economic reforms. Further for enhancing the EU
relationship with Armenia, Azerbaijan, Belarus, Georgia, Moldova and Ukraine on 7 May 2009
the Eastern Partnership was inaugurated. This would imply new association agreements
12Statistical Yearbook of the Republic of Armenia, 2008 // www.armstat.am 13European Neighborhood and Partnership Instrument. Armenia. Country Strategy Paper 2007-2013; EU / Armenia Action Plan

13
including deep and comprehensive free trade agreements with those countries willing and able to
enter into a deeper engagement and gradual integration in the EU economy14.
As we mentioned above Armenia has a good legal platform for enhancing trade relations
with the CIS countries: all free trade agreements of Armenia are signed only with the CIS
countries. As well Russian Federation, being an economical and political leader of the CIS, is a
main trade partner of Armenia on both export and import.
Current trade relations of Armenia only with two neighboring countries – Georgia and Iran
– can be called positively developing. These countries are in the top-10 Armenian trade partners.
As we pointed out there are no official political and economical relations of Armenia with
Turkey and Azerbaijan. As international practice witnesses the easiest market access for most
finished goods is in countries that geography puts nearby; but history, political unfriendship,
colonial rules and a host of other reasons might have prevented to seize this natural advantage
(Piana, 2006). This situation took place between Armenia with Turkey and Azerbaijan.
All mentioned above brings up the urgency of our research. The issue of re-orientation of
Armenian trade flows at the regional and international frameworks is on the agenda. Armenia
needs to enhance its volumes of trade with more number of countries all over the world.
LITERATURE REVIEW
The problem of the trade flows expansion is an urgent topic in the modern economic
literature. There are many studies dedicated to reveal the determinants and the perspective
directions of the trade flows between countries. In the most part of them the gravity model is used
as an empirical tool to model bilateral trade flows and then to estimate trade potentials between
countries or traded blocks.15
The gravity equation, based on the Newton’s physics function that describes the force of
gravity, firstly was applied in economics for analyzing bilateral trade flows between
14 Eastern Partnership // http://ec.europa.eu/external_relations/eastern/index_en.htm 15Baldwin, 1993; Paas, 2000, 2003; Rahman, 2003; Baxter and Kouparitsas, 2005; Sohn, 2005; Maryanchyk, 2005; Bhattacharyya and Banerjee, 2006; DeRosa et al., 2008.

14
geographical entities in the studies of Tinbergen (1962) and Poyhonen (1963). Since that many
papers were dedicated to ground the applying of gravity equation for trade flows’ estimation by
deriving it from different economic models (e.g. Anderson, 1979; Bergstrand, 1985; Deardorff,
1998; Evenett and Keller, 1998; Harrigan, 2001; Hanson and Xiang, 2002; Shepotylo, 2009b).
Discussing gravity model popularity in the empirical studies Deardorff (1998) noted that the
gravity equation’s empirical success is not evidence of anything, but just a fact of life.
Eichengreen and Irwin (1997) characterized the gravity model in international trade as “the
workhorse for empirical studies”.
In the standard gravity equation, trade flows are expected to be dependent negatively on
distance and positively on the sizes of the economies measured by GDP. Linnemann (1966)
added population as an additional measure of country’s size. In some recent studies GDP per
capita is included instead of GDP and population number. It’s caused by two reasons: (i) usually
in the process of estimation the gravity model is log-linearized thus including the log of GDP
and log of population separately is equivalent to including the log of GDP per capita with a
restriction on the estimated coefficients of GDP and population separately; (ii) population’s
effect is positive sometimes and negative other times, so the population term is included in the
model to control for country size but often ignored in the analysis (Armstrong, 2007).
Mainly studies include the standard set of the gravity equation’s determinants such as
volume of GDP and number of population (or GDP per capita) in the exporting and importing
countries, geographical distance, historical and cultural similarities between them (e.g. DeRosa et
al., 2008; Jošić M., 2008). Some authors augmented the gravity model with variables describing
exchange rate regimes, scale of factor endowments, level of development (e.g. Frankel, 1997;
Frankel and Wei, 1993; Baxter and Kouparitsas, 2005; Klein and Shambaugh, 2004), as well
technological innovation and transport infrastructure variables (e.g. Martínez-Zarzoso and
Márquez-Ramos, 2005). A lot of studies include the variables characterizing the presence of
preferential and free trade agreements between countries that allows estimating their impact on

15
the bilateral trade flows (e.g. Batra, 2004; Frankel, 1997; Frankel and Wei, 1993; Maryanchyk,
2005; Paas, 2000). Some papers consider the trade flows between trading blocs (e.g. Wang and
Winters, 1991; Baldwin, 1993; Martínez-Zarzoz and Nowak-Lehmann, 2003). Many recent
studies explore gravity model for further estimating trade potentials, a lot of them consider the
speedily growing developing economies (e.g. Batra, 2004; Bhattacharyya, 2006; Rahman, 2003;
Sohn, 2005). For countries with transition economies the problem of the trade potentials’
prediction is on the agenda as well (Paas, 2000; Maryanchyk, 2005; Shepotylo, 2009b).
The problems of Armenian foreign trade development are discussed among Armenian and
foreign researchers. In general all papers present the descriptive analysis of the foreign trade of
Armenia or different aspects of Armenian foreign economic relations (Polyakov et al., 2002;
Mitra et al., 2006). There are just a few papers in which authors apply the gravity model for
analyzing foreign trade of Armenia.
Freinkman et al. (2004) use in their work the gravity model coefficients obtained by
Frankel (1997)16 and then estimate the 2001 realization ratios for all the CIS countries based on
the value for the CIS dummy coefficient equal to 1.766 (identical to the one for the ASEAN
block, obtained in the work of Frankel (1997)). Their main finding is that Armenia had been
lagging in its export development relative to most CIS countries.
Beilock and Torosyan (2007) in their paper discuss possible strategies for and the potential
economic effect from opening the borders between Armenia and Turkey. The authors use the
gravity model to estimate changes in trade volumes between Armenia and Turkey from border
opening; they estimate the sample including transition countries, developed European countries,
Turkey, and Israel for the year 1999 and then the results are used to predict trade volumes
between Armenia and Turkey in 2004. Number of observations was 493 for imports into
transition economies and 491 for exports from transition economies. With an open border the
border dummy was equal to 1. The authors find that there is significant unused trade potential 16Their model includes such variables as nominal Gross National Product, nominal per-capita GNP, distance, adjacency dummy, language dummy, and bloc dummy; is based on 63 countries (excluding CIS countries) and use the 1992 data.

16
between Armenia and Turkey due to the closed border: with an open border the volume of
Turkish imports will be $51.0 million; Armenian exports to Turkey is expected to go up $5.0
million.
Shepotylo (2009b) develops the gravity model of trade at industry level and employs it in
order to compare the degree of export diversification of the CIS countries relative to other
countries. Author estimates the developed gravity equation with "out-of-sample" approach for 10
industries on the sample of 126 source countries and 157 destination countries in 2000-2006.
Then using the sample of the CIS countries author predicts the probability of positive trade of
each CIS country. The results for Armenia show that Armenian trade below its potential, while
other CIS countries have more complex patterns.
OUR APPROACH
DATA SAMPLE
Our analysis is based on the maximum possible geographical coverage of the world trade
flows for the years 2003-200717 and includes 139 countries (Appendices Table 2).
The dependent variable is foreign trade flows between two trading countries; the
independent variables are the following determinants: GDP per capita in exporting country and
GDP per capita in importing country; distance between trading countries; presence of common
border / common language / colonial ties between trading countries; whether one/both of trading
countries is/are landlocked; membership in WTO; membership in traded blocks. The list of
variables and their descriptive statistics are given in the Appendices Table 3 and Table 4.
The main data source for bilateral trade flows is the database of the UN Commodity Trade
Statistics Database (Comtrade)18. The product classification of our trade data is based on the
Broad Economic Categories’ (BEC) 1-digit classification with the products being disaggregated
into seven groups: 1)Food and beverages; 2)Industrial supplies; 3)Fuels and lubricants; 4)Capital
17 We don't take the years 2008-2009 in order to avoid the possible fluctuations that are caused by the recent financial crisis. 18 UN Commodity Trade Statistics Database // http://comtrade.un.org/

17
goods (except transport equipment), including accessories and parts; 5)Transport equipment,
including accessories and parts; 6)Consumer goods; and 7)Goods (not elsewhere classified).
Applying the disaggregated trade data allows to predict changes in the composition of trade at
the level of sectors of the economy that is essential for evaluating the effect of policy changes on
trade and development (Shepotylo, 2009b).
In recent years, it has become widely recognized that trade data even in the aggregate level
between any two countries is frequently zero. Some of the reports of zero trade reflect errors and
omissions and, rarely, rounding error because the value of trade reported is too low to record.
However, it appears that most of the zero trade flows between country pairs reflect a true
absence of trade, rather than rounding error. Since Tobin’s (1958) famous paper, it has been
known that the presence of zero values of the dependent variable in a sample has potentially very
important implications for the parameter values estimated using these data (Martin and Pham,
2007).
So in the bilateral international trade matrix zero trade flows are common. Haveman and
Hummels (2004) found that nearly 1/3 of the bilateral trade matrix is empty. Helpman, Melitz
and Rubinstein (2008) found that about half of the country pairs in their 158 country sample do
not trade with each other at all. Shepotylo (2009a) revealed that almost 1/2 of the possible
934,700 bilateral trade matrix is empty. With product disaggregation, we can expect the problem
to become more and more serious. Dropping zeros means that we may lose potentially useful
information and we may get biased estimates of the coefficients we are primarily interested in.
In our database number of zeros for total export accounts 21.8%, for export of Food and
beverages goods – 41.8%, for export of Industrial supplies goods – 30.8%, for export of Fuels
and lubricants goods – 67.5%, for export of Capital goods – 39.0%, for export of Transport
equipment – 49.5%, for export of Consumer goods – 36.2% and for export of Goods (not
elsewhere classified) – 60.8%.

18
For the variable GDP per capita as a data source we use database “World Development
Indicators 2008”. We consider this variable as a size of economy. Countries with higher GDP
per capita may have possibility to trade more than countries with lower GDP per capita.
As a source for the data of the geographical distance between trading countries and the
dummy variable Landlocked we take the CEPII database19. Distance negatively influences on
bilateral trade flows. Greater distance between two countries may provide greater transportation
costs for trade flows and it’s also possible that the greater geographical distance is correlated
with the larger cultural differences. The dummy variable Landlocked captures the presence of
outlet to the seacoast in the exporting and importing countries. If one/both of the countries is/are
landlocked it negatively influences on bilateral trade flows. It increases the cost of trade as trade
flows are limited in the choice of transportation. Taking into account that mostly international
trade flows are carried by sea transport we assume that landlocked countries have some
constraints in trade flows (especially higher transportation costs).
For the data of the dummy variables describing the cultural and historical similarities
between two countries (Common border, Common language, and Colonial ties) as a source we
use the CEPII database as well. We assume that countries with larger cultural similarities tend to
trade more than countries with smaller or without cultural similarities. Presences of common
border / common language / colonial ties positively influence on bilateral trade flows. It
witnesses the long historical, cultural, economical and political relations between trading
countries both at the interstate and inter-firm levels that may lead to the decreasing of the
transaction costs. For example, common language is expected to reduce transaction costs in
international trade as speaking the same language will simplify and promote trade negotiations.
Similarly colonial ties provide shared history for countries and this is expected to reduce
transaction costs caused by cultural differences.
19 CEPII // www.cepii.fr

19
As a source for data of the dummy variables describing the membership in WTO of
exporting and\or importing countries we use the WTO database20. There are two dummy
variables: WTOboth and WTOnone. The variable WTOboth equal 1 if two countries are the
members of WTO; and the variable WTOnone is equal 1 if none of trading countries is a
member of WTO. WTO membership positively influences on bilateral trade flows. Taking into
account the fact that trade policy is more liberal in the countries that are WTO members than in
non-members we assume that bilateral trade flows between WTO members will be greater than
between non-members.
For data of the dummy variable characterizing the presence of the free trade agreements
between trading countries as a source the database of UN Economic and Social Commission for
Asia and the Pacific serves21. Membership in traded blocks positively influences on bilateral
trade flows. Countries join traded blocks aiming to simplify and expand their trade relations.
MODEL
In our study we apply gravity equation to estimate the bilateral trade flows. The standard
gravity equation in the economic interpretation looks as:
(1)
where: – trade flows(export) between country i and country j; and – economic “masses” of the considered countries (GDP per capita); – distance between country i and country j;
α - constant of proportionality; β1, β2, β3 - coefficients.
Usually the augmented gravity model that includes additional variables which allow
presenting more precise picture of the considered phenomena is applied. We consider as a
vector of additional variables. According to the list of the determinants of the bilateral trade
flows mentioned in the previous section vector of additional variables include such determinants
as presence of common border / common language / colonial ties between trading countries;
whether one/both of trading countries is/are landlocked; membership in WTO; membership in
20 World Trade Organization // www.wto.org 21 UN Economic and Social Commission for Asia and the Pacific //www.unescap.org/tid/rta.asp

20
traded blocks. Thus, the augmented gravity equation to model bilateral trade flows looks as:
(2)
where: is a vector of additional variables that influence on bilateral trade flows.
The specification of the augmented gravity equation to model bilateral trade flows in the
log-form that to be estimated looks as:
uijγAVijLnDistβjLnGDPβiLnGDPβαijLnY +++++= 321 (3)
where: Yij- trade flows (export) between country i and country j, GDPi and GDPj - GDP per capita in country i and country j, respectively; Distij – distance between country i and country j; AVij – vector of additional variables; u – disturbance term.
ESTIMATION STRATEGY
We estimate the gravity model (3) for panel data for the years 2003-2007. Descriptive
statistics of the variables is presented in Table 4 of Appendices.
The estimator choice is an important issue for the interpretation of the coefficients, which
depends on the underling interests. Different estimators not only give different parameter
estimates but also different residuals, i.e. actual-to-potential trade ratios (Egger, 2001).
Early empirical studies used cross-section data to estimate a gravity model; in most recent
years, researchers use panel data. The use of panel data instead of cross-sectional analysis allows
us to remove some biases stemming from unobserved industry and country-pair heterogeneity
and to estimate the parameters of the model with greater precision (Shepotylo, 2009b).
Gravity model (3) suffers from an omitted variable bias. According to Anderson and van
Wincoop (2004) commonly used remoteness variable distance does not capture the entire range
of factors which impact bilateral trade flows. To overcome this problem they offer to take into
account “multilateral resistance” terms. These multilateral resistance terms consist of country
specific price indices. Since the multilateral resistance terms as proposed by Anderson and van
Wincoop (2004) are not observables, the authors propose among others the simultaneous use of
both importer and exporter fixed effects to replace the resistance terms (Helmers and Pasteels,

21
2005). In order to capture “multilateral resistance” terms we will use importer and exporter fixed
effects in gravity model (3).
Along the years two main strategies have been selected in order to calculate trade
potentials. The first one derives out-of-sample trade potential estimates i.e. the parameters for
EU (or OECD) countries are estimated by a gravity model and then the same coefficients are
applied to project “natural” trade relations between EU countries and CEECs. The difference
between the observed and predicted trade flows should represent the unexhausted trade potential.
The second strategy derives in-sample trade potential estimates i.e. CEECs are included in the
regression analysis and the residuals of the estimated equation should represent the difference
between potential and actual trade relations (Benedictis and Vicarelli, 2004). Egger (2002)
argues forcefully that in-sample estimations of the trade potential based on the deviation of
residuals from the linear prediction are incorrect because large deviations of residuals in the
gravity equation based on the method are not evidence of large deviations of trade from its
potential, but rather an indicator of model misspecification (Shepotylo, 2009b).
The problem that we face is if we use out-of-sample approach we can’t use Anderson and
van Wincoop (2004) “multilateral resistance” terms (importer and exporter fixed effects) while
estimating total trade potential. In case of out-of-sample approach we could include only
importer fixed effects if we try to estimate export potential and we could include only exporter
fixed effects if we try to estimate import potential.
We estimated our model with in-sample and out-of-sample approaches and found that the
results of in-sample and out-of-sample approaches are very close (almost the same coefficients).
We chose in-sample approach which allows us to take both importer and exporter fixed effects.
So our final results are based on in-sample approach.22
Recently Helpman, Melitz and Rubinstein (2008) presented a theoretical framework to
analyze bilateral trade flows. This model has a number of implications for trade flows. The
22 Results of the out-of-sample approach are not reported here, but are available upon request from the authors.

22
model is able to predict zero exports from j to i for some country pairs. As a result, the model is
consistent with zero trade flows in both directions between some countries, as well as zero
exports from j to i but positive exports from i to j for some country pairs. Second, the model
predicts positive - though asymmetric - trade flows in both directions for some country pairs,
which are also needed to explain the data. And finally, the model generates a gravity equation
(Helpman, Melitz and Rubinstein,2008). The authors propose a two stage estimation procedure.
The first stage consists of estimating a Probit equation that specifies the probability that country j
exports to country i as a function of observable variables (extensive margin). Predicted
components of this equation are then used in the second stage to estimate the gravity equation in
log-linear form (intensive margin).
In Appendices Table 5 we present the results of Helpman, Melitz and Rubinstein (2008)
model by total export and by BEC's 1-digit classification product groups which are based on
NLS estimation (Helpman, Melitz and Rubinstein, 2008; p.462). Then in this Table we also
present polynomial approximation for total export and for each product group. Taking into
account that in case of polynomial approximation nonlinearity eliminates, we estimate the
second stage using OLS estimation (Helpman, Melitz and Rubinstein, 2008; p.464). Both NLS
and OLS estimates are based on two stage estimation where the first stage Probit remains
unchanged. Unlike Helpman, Melitz and Rubinstein (2008; p.465) we found that in HMR model
OLS estimation results are not very similar to NLS estimates23. Taking into account that we
found a big difference between NLS and OLS estimation results in HMR model we can state that
HMR model is not appropriate for our panel export data. We have experimented to estimate
HMR model with 2007 cross sectional export data and there also found big differences between
NLS and OLS estimation results for total export and export by product groups.24
23 We also estimated HMR model by adding two additional dummy variables: both countries are WTO members and none of countries is WTO member. Here also we got a big difference in NLS and OLS results. These results are not reported here, but are available upon request from the authors. 24 Results of cross sectional export data are not reported here, but are available upon request from the authors.

23
According to recent work of Santos Silva and Tenreyro (2009b) though HMR’s model
makes a significant step towards a better understanding of the determinants of bilateral trade
flows, the proposed two-stage non-linear least squares estimation procedure has some
limitations. First, the approach used by HMR to deal with the selectivity bias is only
approximately correct and, consequently, the proposed estimator is not generally consistent for
the parameters of interest. Second, HMR obtain their model under very strong distributional
assumptions. All the results presented in their paper depend critically on the untested assumption
that all random components of the model are homoskedastic (Santos Silva and Tenreyro, 2009b).
Santos Silva and Tenreyro (2006) found that the standard empirical methods used to
estimate gravity equations are inappropriate. The basic problem is that log-linearization (or,
indeed, any non-linear transformation) of the empirical model in the presence of
heteroskedasticity leads to inconsistent estimates. Authors propose a simple Poisson pseudo
maximum likelihood method which is robust to different patterns of heteroskedasticity and, in
addition, provides a natural way to deal with zeroes in data.
The existence of the maximum likelihood estimates for Poisson regression depends on the
data configuration. Because standard software does not check for this problem in some
applications estimation of the Poisson regression is unusually difficult or even impossible.
Especially the non existence of the (pseudo) maximum likelihood estimates of the Poisson
regression models is more likely when the data has a large number of zeros (Santos Silva and
Tenreyro, 2009a). To overcome this problem we can use the strategy that Santos Silva and
Tenreyro (2009a) described in their recent work. Rather than using the poisson command we
used the PPML command for Stata which is written by them and by-passes most of these
problems.25
25http://privatewww.essex.ac.uk/~jmcss/LGW.html

24
Taking into account the above mentioned our final results for trade potentials' calculation
is based on Poisson model estimation26. Also we use in-sample approach and importer, exporter,
and time fixed effects.
ESTIMATION RESULTS
In Table 3 we present the estimation results for total export and for export on product
groups. According to the results the determinants “Distance”, “Importer’s GDP per capita” and
“Exporter’s GDP per capita” mostly have expected signs and are highly statistically significant
providing evidence for the predictions of the gravity equation. The other variables (dummy
variables) as well mostly have expected signs and are highly statistically significant.
Table 3: Results of Gravity Model Estimation by Poisson Model27
Total Food & Beverages
IndustrialSupplies
Fuels & Lubricants
Capital Goods
Transport Equipment
ConsumerGoods
Goods (not classified)
LnGDPexp 1.18*** (0.16)
0.90*** (3.78)
1.05*** (0.22)
1.05*** (0.37)
1.64*** (0.19)
2.15*** (0.24)
0.82*** (0.21)
-1.06** (0.44)
LnGDPimp 0.84*** (0.22)
0.80*** (4.25)
0.53* (0.29)
0.14 (0.44)
0.82*** (0.24)
2.41*** (0.25)
0.97*** (0.31)
1.45*** (0.31)
LnDistance -0.74***(0.03)
-0.87*** (-26.03)
-0.80*** (0.03)
-1.24*** (0.06)
-0.65*** (0.03)
-0.66*** (0.04)
-0.73*** (0.04)
-0.89*** (0.05)
Common Language
0.22*** (0.08)
0.27*** (2.67)
0.11 (0.10)
0.36** (0.18)
0.26*** (0.09)
0.17 (0.11)
0.36*** (0.11)
0.22 (0.14)
Common Border
0.52*** (0.08)
0.66*** (6.35)
0.53*** (0.08)
0.63*** (0.14)
0.51*** (0.12)
0.56*** (0.11)
0.44*** (0.09)
0.26** (0.12)
Colony 0.14 (0.11)
0.40*** (3.31)
0.34*** (0.11)
0.30 (0.19)
0.09 (0.11)
-0.26 (0.16)
0.18 (0.13)
0.55*** (0.14)
Landlocked -1.68***(0.86)
-2.47*** (-3.14)
-0.85 (1.07)
1.42 (1.82)
-1.21 (0.98)
-6.37*** (1.04)
-2.55** (1.19)
-2.59** (1.13)
FTA 0.39*** (0.08)
0.17 (1.54)
0.35*** (0.08)
0.03 (0.19)
0.38*** (0.10)
0.75*** (0.13)
0.28*** (0.10)
0.76*** (0.17)
Logpseudo likelihood -97672022 -9139455.9 -29977121 -32672812 -23610037 -15929582 -15065213 -6416445.3
Obs Number 82750 82750 82750 82750 82750 82198 82750 82612
Constant term, exporter country, importer country, and time fixed effects are included but not reported. Standard errors, clustered by country pair, are presented in parentheses, ***, **, and * denote 1%, 5%, and 10% significance levels, respectively.
26 For our dataset we used PPML command for Stata which is written by Santos Silva and Tenreyro and estimates Poisson regression by pseudo maximum likelihood. 27 Results are calculated with PPML command for Stata which is written by Santos Silva and Tenreyro and estimates Poisson regression by pseudo maximum likelihood.
25
Having estimated the gravity model for world bilateral trade flows (panel data for the years
2003- 2007) we proceed to estimate trade (export) potential for Armenia. We calculate export
potential as a difference between predicted by the model and actual export volumes. Depending
on the value of the export potentials we divide Armenia’s trade partners into two groups: (1)
countries where Armenia has exceeded its trade potential in export; and (2) countries where
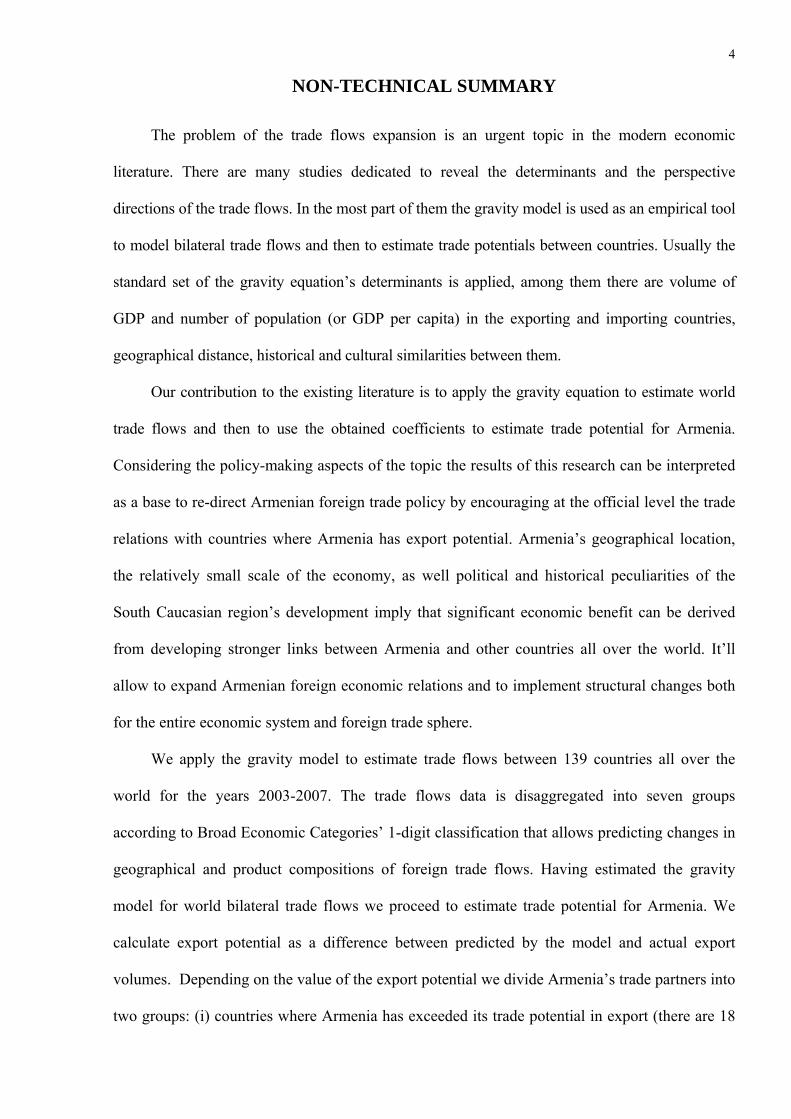
Armenia has export potential (Appendices Tables 6-7, Figures 2-4).
Results show that Armenia has potential to expand its export to 120 countries all over the
world, among them 39 countries present the possibility to increase Armenian export more than 3
US$ millions to each country; and Armenia has exceeded its export potential with 18 countries.
Countries where Armenia has the maximal potential for export expansion are USA,
Turkey, Japan, China, France, UK, Spain, Italy, Hong Kong, Saudi Arabia, India, Sweden,
Korea, Singapore, Mexico, UAE, Poland, Australia, Greece, and Azerbaijan. Totally these
countries present the possibility to increase the export volumes of Armenia by 359 US$ millions.
Countries where Armenia has maximally exhausted its export potential are Belgium, Israel,
Russia, Netherlands, Germany, Switzerland, Georgia, Ukraine, Bulgaria, and Iran.
INTERPRETATIONS OF THE RESULTS
We interpret the obtained results accordingly to the policy context of our study and present
them on four directions:
− trade potential for Armenia with the EU countries,
− trade potential for Armenia with the CIS countries,
− trade potential for Armenia with neighboring countries,
− trade potential for Armenia with other countries.
All further analysis is based on the data given in Table 4 if other is not pointed out.
Speaking about export potential we mean averaged values for the years 2003-2007, if other is not

26
pointed out (Table 4; Appendices Figure 2-4). All given product compositions of Armenian
export to different countries are based on Harmonized System 2-digit classification trade data28.
Trade potential for Armenia with the EU countries:
Belgium, Netherlands, Germany, and Bulgaria are the EU countries that are in the 10-top
directions of Armenian export. Thus we accent the trade relations of Armenia with these EU
countries. The Table 4 shows that the export potentials for Armenia with these countries are
extremely exhausted (Belgium – (-102.12 US$ millions), Netherlands - (-74.22 US$ millions),
Germany - (-70.86 US$ millions), and Bulgaria - (-8.42 US$ millions)).
Analyzing the trends of Armenian export potentials to these countries for the years 2003-
2007 we observe that exceeding of Armenian export potentials is decreasing with Belgium, with
the rest of the mentioned countries it is increasing (Appendices Tables 6-7).
In this context the important issue is the analysis of the product compositions of Armenian
export to these countries. Armenian producers supply to their markets, as well to Switzerland’s
and Israel’s markets (Armenian export potentials to them are also exceeded) mainly a few
product groups that include the raw materials or the products with low added value: (i) “Iron and
steel”, “Copper and articles thereof”, and “Other base metals, cermets, articles thereof” – to
Netherlands and Germany; (ii) “Pearls, precious stones, metals, coins” - to Belgium and Israel;
(iii) “Ores, slag and ash” - to Bulgaria and Switzerland.
Studying Armenia’s export potentials on other product groups we observe that exports of
“Food and beverages” and “Consumer goods” have potentials to increase, at that the goods from
these product groups provide a significant added value into national economy. The total
Armenian export potential of “Food and beverages” to Belgium, Netherlands, Germany,
Switzerland, and Israel amounts 8.33 US$ millions, export potential of “Consumer goods” to
Belgium, Netherlands, Germany, Bulgaria and Israel is about 6.35 US$ millions.
28 International Trade Center // www.intracen.org

27
Table 4: Trade Potentials for Armenia, US$ millions (averages for the years 2003-2007)
Country Total Food &
Beverages Industrial Supplies
Fuels & Lubricants
Capital Goods
Transport Equipment
Consumer Goods
Goods (not classified)
Countries where Armenia has the Maximal Potential to Expand Export 1 USA 54.84 2.79 28.19 1.92 3.03 0.46 -14.38 0.00
2 Turkey 40.72 3.09 50.36 1.08 0.91 0.12 1.97 0.01
3 Japan 36.17 6.09 21.95 1.82 0.98 0.09 2.41 0.00
4 China 32.10 3.61 35.75 0.53 0.11 0.03 0.58 0.00
5 France 24.13 1.98 16.04 0.47 -0.70 0.13 2.43 0.00
6 UK 22.48 3.82 8.85 0.57 0.77 0.10 3.08 -0.01
7 Spain 16.10 2.42 7.56 0.35 0.68 0.13 2.35 0.00
8 Italy 15.94 6.02 31.04 0.99 0.62 0.15 -20.01 0.01
9 HongKong 14.25 0.94 10.83 0.11 0.92 0.02 0.31 0.00
10 SaudiArabia 12.17 3.30 8.97 0.01 0.30 0.07 1.08 0.00
11 India 11.67 1.04 15.95 0.40 0.35 0.02 0.19 0.00
12 Sweden 11.24 1.32 7.48 0.10 0.36 0.05 1.08 0.00
13 Korea 10.65 1.16 10.20 0.50 0.44 0.02 0.25 0.00
14 Singapore 9.20 0.45 4.57 0.18 0.50 0.02 0.34 0.00
15 Mexico 8.80 0.77 6.52 0.07 0.37 0.03 0.58 0.00
16 UAE 8.35 2.30 7.09 0.04 -0.42 -0.15 1.01 0.00
17 Poland 7.96 0.97 6.05 0.14 0.28 0.04 0.91 0.00
18 Australia 7.89 0.53 4.47 0.14 0.25 0.04 0.78 0.00
19 Greece 7.33 1.71 4.84 0.14 -0.75 0.03 1.11 0.00
20 Azerbaijan 6.84 1.87 5.46 0.03 0.21 0.04 0.67 0.00
Countries where Armenia has Maximally Exceeded its Export Potential 1 Belgium -102.1 0.99 -101.68 0.13 0.17 -0.05 0.62 0.00
2 Israel -86.8 0.95 -83.53 0.10 0.24 0.03 0.29 0.00
3 Russia -80.5 -65.89 1.54 0.09 -9.16 -0.64 -2.44 -0.03
4 Netherlands -74.2 2.53 -80.88 0.67 0.60 -0.02 1.59 0.00
5 Germany -70.8 3.35 -85.63 0.45 1.25 -0.19 3.73 -0.05
6 Switzerland -37.9 0.51 -36.75 0.21 0.16 0.02 -0.59 0.00
7 Georgia -29.5 -5.24 -13.11 -6.17 -1.36 -0.51 -0.59 0.00
8 Ukraine -10.7 -7.36 -2.31 0.11 -2.29 -0.33 0.63 0.00
9 Bulgaria -8.4 -0.07 -8.27 0.07 0.02 0.01 0.12 0.00
10 Iran -5.8 3.76 6.63 -7.67 -1.50 -0.20 0.68 0.00

28
Looking through the countries with maximal potential to expand Armenian export we see
among them France (export potential is 24.13 US$ million), the UK (22.48 US$ million), Spain
(16.10 US$ million), Italy (15.94 US$ million), Sweden (11.24 US$ million), Poland (7.96 US$
million), and Greece (7.33 US$ million). In a general according to our results the product group
with maximal export potential to these countries is “Industrial supplies”.
Totally the EU countries those having the potentials present the possibility to increase
Armenian export by 161.36 US$ million (Appendices Figures 2-3). But accounting that Armenia
has exceeded its trade potential with Belgium, Netherlands, Germany, and Bulgaria by 255.62
US$ millions we see that in a whole Armenian export to the EU countries is exceeded.
Summarizing we have to note that Armenia over-exports to the EU countries, especially
the raw materials, and thus Armenian government should make efforts in the line of reorienting
of its export flows to the EU on the product direction: from raw materials to manufactured
goods; and expanding them on the geographical direction; that will positively affect the domestic
production’s development.
Trade potential for Armenia with the CIS countries:
Russia and Ukraine are the members of the CIS29 countries, as well the main trade partners
of Armenia. In 2007 they covered 21.5% of total Armenian export and 29.7% of total Armenian
import flows (Table 1). Accounting that Armenian trade turnover with all the CIS countries
amounts 32% of its total turnover - 31% of total export and 33% of total import flows
(Appendices Figure 1) - we concentrate our study on these countries.
Armenian export potentials to Russia and Ukraine are extremely exceeded: by 80.57 US$
millions to Russia and 10.54 US$ million to Ukraine (Table 4). Moreover Armenian export
potentials to these countries are exhausted on product groups “Food and beverages” and “Capital
goods”.
29 At the time of analysis – the years 2003-2007 - Georgia was a member of the CIS; however we analyze Armenian trade potential with Georgia as a neighboring country in the next section.

29
The product groups with potential to expand export seem to be “Consumer goods” to
Ukraine by 0.63 US$ million; and “Industrial supplies” to Russia by 1.54 US$ million.
Studying Armenian export flows to these countries we see that they are relatively more
diversified than the EU ones. More than half of Armenian export to Russia presents one product
group “Beverages, spirits and vinegar”; and about 16% is “Pearls, precious stones, metals,
coins”. To Ukraine Armenian export flows consist of two main groups: “Beverages, spirits and
vinegar” on 19.0% and “Iron and steel” on 36.4%. One of the reasons that Armenian export
flows to Russia and Ukraine (as well as to Iran and Georgia) are relatively more diversified than
to other main trade partners (which are mainly the EU countries) is relatively weak competition,
as well the presence of the cultural and historical similarities.
Analysis shows that “Beverages, spirits and vinegar” is the main product group supplied to
these countries and the potential of its export is extremely exceeded. Armenia needs to diversify
its export flows to Russia and Ukraine in order to improve its trade possibilities especially on
such product groups as “Consumer goods” to Ukraine and “Industrial supplies” to Russia.
Looking at the Table 4 we observe that one more CIS country presents possibility to
expand Armenian export: it’s Azerbaijan. As this country is Armenian neighbor we consider it in
a detail in the next section.
Totally the CIS countries (those having the export potential for Armenia) present the
possibilities to increase Armenian export by 9.15 US$ million (noting that export potential to
Azerbaijan is about 6.84 US$ millions).
Concluding we have to point out that the markets of the CIS countries can’t be considered
as perspective ones for Armenia.
Trade potential for Armenia with neighboring countries:
Armenian neighboring countries are Georgia, Iran, Turkey, and Azerbaijan. Armenia has
not official political and economic relations with Turkey and Azerbaijan. At nonofficial level
there are trade relations between Armenia and Turkey.

30
Armenian export to Turkey in absolute value is rather small, it’s about 790 US$ thousand,
that amounts about 0.07% of total Armenian export flows. However according to our results
Turkey presents the possibilities to increase Armenian export by 40.72 US$ million. Product
group with maximum potential is “Industrial supplies” - 50.36 US million. Accounting the
current political problems between Armenia and Turkey, closed border and etc. our results
allows to suggest that re-opening of Armenian-Turkish border would positively impact
Armenian export positions, that stimulates domestic production development.
Armenian export potential for Azerbaijan is about 6.84 US$ million. However taking into
account the current situation in the South Caucasian region we assume that without political
solution of the problems there is no sense to discuss any economic possibilities.
Georgia and Iran are the main trade partners of Armenia. 10.9% of total Armenian export
goes to these countries. Armenia directs about 7.6% of its export to Georgia. And the product
composition of the export is relatively diversified: product group “Salt, sulphur, earth, stone,
plaster, lime and cement” covers about 44.2% of export flows, “Coffee, tea, mate and spices” is
about 18.4%, “Glass and glassware” is about 8%, and “Plastics and articles thereof” is about
7.5%. But looking at the Table 4 we observe that Armenia has exceeded its export potential with
Georgia by 29.51 US$ million. Moreover there is no product group with potential to expand
Armenian export flows to Georgia.
Iran presents more pleasant picture. To Iranian market Armenia supplies “Aluminium and
articles thereof” (30.2% of total export), “Mineral fuels, oils, distillation products, etc” (26.2%),
“Iron and steel” (9%). Though Armenian export potential to Iran has been exceeded by 5.83 US$
million, Armenia has possibility to expand its export to Iran on product groups “Food and
beverages” by 3.76 US$ million, “Industrial supplies” by 6.63 US$ million, “Consumer goods”
by 0.68 US$ million.
Resuming we have to note that in the regional aspect Armenian producers have
possibilities to expand their positions only to Iran’s market on the several product groups.

31
Trade potential for Armenia with other countries:
Looking through the list of the countries with maximal potential to expand Armenian
export we observe that two groups of countries are not considered, there are North American
countries and Asian countries.
North American countries:
In the North America there are two countries having export potentials for Armenia: the
USA and Mexico. Besides the USA is a main trade partner of Armenia. 4.5% of total Armenian
export goes to the USA; it mainly consists of one product group “Pearls, precious stones, metals,
coins”. Based on our results we can state that the USA is on the first place on export potential
for Armenia and present the possibility to increase the volumes of Armenian export by 54.8 US$
million, especially on product groups “Industrial supplies”, “Capital goods”, and “Food and
beverages”. Export potential on “Consumer goods” is exceeded. Total Armenian export potential
to the Mexican markets is about 8.8 US$ million, mainly on product group “Industrial supplies”.
Asian countries:
Asian countries present a wide group of countries from different parts of Asian region.
Among them there are Japan, China, Hong Kong, India, Korea, Singapore, Saudi Arabia and
UAE. Totally these Asian countries present the possibilities to increase Armenian export by
134.56 US$ million, especially on the product groups “Industrial supplies” (115.31 US$ million)
and “Food and beverages” (18.89 US$ million). As well we have to note that for all mentioned
countries there are no product groups where Armenian export potentials would be exceeded.
CONCLUSIONS
In general analyzing Armenian export potentials on total and on product groups we can
point out a few moments. The main evidence is that the present geographical and product
compositions of Armenian export are insufficient: trade relations with most of the leading trade
partners, including two neighboring countries – Georgia and Iran, have no potential for
developing.

32
Among positive results we should note that the most perspective directions of Armenia’s
exports expansion are “Industrial supplies”, “Food and beverages” and “Consumer goods”
product groups.
Another interesting finding is the fact that Turkey is on the second place on potential to
expand Armenia’s export and thus presents the possibility to increase total Armenian export by
40.72 US$ millions. Taking into account the political and geopolitical aspects of process of
Armenian-Turkish border’s re-opening this fact can be interpreted as evidence in favor of
stimulating this process.
In a general our main findings and policy recommendations are the following:
(i) Armenia has no potential to expand its export to the CIS countries, mainly it’s
exceeded.
(ii) Armenia has to reorient its export flows to the EU countries on product direction: to
enhance export of product groups “Food and beverages”, “Consumer goods” and “Industrial
supplies”; and on geographical direction: markets of France, the UK, Spain, Italy, Sweden,
Poland, and Greece present possibility to increase Armenian export totally by 105.18 US$
million.
(iii) In regional aspect Armenian producers have possibilities to expand their positions
only to Iran’s market on the product groups “Food and beverages”, “Industrial supplies” and
“Consumer goods”.
(iv) Asian countries seemed to be the most perspective directions of Armenian export
expanding. Totally they present the possibilities to increase Armenian export by 134.56 US$
million, especially on the product groups “Industrial supplies” and “Food and beverages”.
Resuming we can assume that reorientation and diversification of product and
geographical Armenian export compositions will stimulate the domestic production especially on
“Industrial supplies”, “Food and beverages”, and “Consumer goods” product groups.

33
APPENDICES
Table 1: Agreements on Free Trade of the Republic of Armenia with Other Countries30
Short Name Signed Year In Force Since
Armenia - Kazakhstan FTA 1999 2001
Armenia - Georgia FTA 1995 1998
Armenia - Turkmenistan FTA 1995 1996
Armenia - Ukraine FTA 1994 1996
Armenia - Kyrgyzstan FTA 1994 1995
Armenia - Moldova FTA 1993 1995
Armenia – Russian Federation FTA 1992 1993
30 UNESCAP Database // www.unescap.org/tid/rta.asp //17.10.2010

31 Stat
Figure 1
tistical Yearbo
2
4
6
8
10
0
20
40
60
80
100
0
20
40
60
80
100
: Main Tra
ook of the Rep
24
46
30
0
20
40
60
80
00
1999
23
31
46
0
0
0
0
0
0
1999
23
34
42
0
0
0
0
0
0
1999
ade Partner
public of Arm
24 26
36 27
40 47
2000 200
a
CIS count
20 25
34 29
46 46
2000 2001
b
CIS count
21 25
35 28
45 47
2000 2001
c) Tra
CIS count
rs of Armen
menia, 2008, 2
19
40
41
1 2002 2
a) Armenia
tries EU c
31
26
44
1 2002 2
b) Armenia
tries EU c
27
31
43
1 2002 2
ade Turnov
tries EU c
nia (as a sh
004 // www.a
19 17
39 36
43 47
2003 2004
an Export
countries R
28 29
33 32
40 39
2003 2004
an Import
countries R
25 25
35 33
41 42
2003 2004
ver of Arme
countries R
hare to tota
armstat.am
19 2
47 4
34 3
2005 20
Rest world
29
34
37
2005 2
Rest world
26
38
36
2005 2
enia
Rest world
al trade flow
22 31
4849
30 20
006 2007
32 33
34 35
34 32
2006 2007
29 32
38 38
33 29
2006 2007
w, %)31
34

35
Table2: List of Countries
1 Albania 36 Cyprus 71 Kuwait 106 San Marino
2 Algeria 37 Czech Rep. 72 Kyrgyzstan 107 Saudi Arabia
3 Andorra 38 Benin 73 Lebanon 108 Senegal
4 Angola 39 Denmark 74 Latvia 109 India
5 Azerbaijan 40 Dominica 75 Liberia 110 Singapore
6 Argentina 41 Dominican Rep. 76 Libya 111 Slovakia
7 Australia 42 Ecuador 77 Lithuania 112 Viet Nam
8 Austria 43 El Salvador 78 Luxembourg 113 Slovenia
9 Bahrain 44 Ethiopia 79 Malaysia 114 South Africa
10 Bangladesh 45 Estonia 80 Mali 115 Zimbabwe
11 Armenia 46 Finland 81 Malta 116 Spain
12 Barbados 47 France 82 Mexico 117 Sudan
13 Belgium 48 Gabon 83 Mongolia 118 Suriname
14 Bhutan 49 Georgia 84 Moldova 119 Swaziland
15 Bolivia 50 Germany 85 Morocco 120 Sweden
16 Bosnia&Herzegovina 51 Ghana 86 Mozambique 121 Switzerland
17 Botswana 52 Greece 87 Oman 122 Syria
18 Brazil 53 Guatemala 88 Nepal 123 Tajikistan
19 Belize 54 Guinea 89 Netherlands 124 Thailand
20 Bulgaria 55 Haiti 90 New Zealand 125 UAE
21 Belarus 56 Honduras 91 Nicaragua 126 Tunisia
22 Cambodia 57 Hong Kong 92 Niger 127 Turkey
23 Cameroon 58 Hungary 93 Nigeria 128 Turkmenistan
24 Canada 59 Iceland 94 Norway 129 Uganda
25 Cape Verde 60 Indonesia 95 Pakistan 130 Ukraine
26 Central African Rep. 61 Iran 96 Panama 131 TFYR of Macedonia
27 Sri Lanka 62 Iraq 97 Paraguay 132 Egypt
28 Chad 63 Ireland 98 Peru 133 UK
29 Chile 64 Israel 99 Philippines 134 USA
30 China 65 Italy 100 Poland 135 Uruguay
31 Colombia 66 Japan 101 Portugal 136 Uzbekistan
32 Comoros 67 Kazakhstan 102 Qatar 137 Venezuela
33 Congo 68 Jordan 103 Romania 138 Yemen
34 Costa Rica 69 Kenya 104 Russia 139 Zambia
35 Croatia 70 Rep. of Korea 105 Rwanda

36
Table 3: List of Variables
Variable Description
Dependent variable
Export Export flows from country i to country j
Gravity variables
Importer GDP GDP per capita in importing country (in constant prices 2000)
Exporter GDP GDP per capita in exporting country (in constant prices 2000)
Distance Distance between exporting country and importing country
Common Language Common language in exporting country and importing country
Common Border Common Border between exporting country and importing country
Colony Colonial ties between exporting country and importing country (in the past)
Landlocked Exporting country and/or importing country is/are landlocked
FTA Free trade agreement between exporting country and importing country
WTOboth Both exporting and importing countries are the members of WTO
WTOnone None of the exporting and importing countries is a member of WTO
Table 4: Descriptive Statistics of the Variables
Variables Obs. Mean Std. dev. Min Max
Dependant variables
Export total 82750 5.80e+08 5.20e+09 0 3.32e+11
Export of Food & Beverages 82750 3.44e+07 2.97e+08 0 1.66e+10
Export of Industrial Supplies 82750 1.55e+08 1.33e+09 0 8.79e+10
Export of Fuels & Lubricants 82750 5.83e+07 8.63e+08 0 8.29e+10
Export of Capital Goods 82750 1.48e+08 1.61e+09 0 1.11e+11
Export of Transport Equipment 82750 8.35e+07 1.16e+09 0 7.74e+10
Export of Consumer Goods 82750 7.82e+07 8.44e+08 0 8.48e+10
Export of Goods (not classified) 82750 2.20e+07 3.02e+08 0 2.08e+10
Independent variables
GDPexp 95910 8163.19 11205.93 123.18 54482.12
GDPimp 95910 8163.19 11205.93 123.18 54482.12
Distance 95910 7105.54 4268.42 59.62 19812.04
Common Language 95910 0.11 0.31 0 1
Common Border 95910 0.02 0.15 0 1
Colony 95910 0.01 0.12 0 1
Landlocked 95910 0.48 0.60 0 2
WTOboth 95910 0.67 0.47 0 1
WTOnone 95910 0.03 0.17 0 1
FTA 95910 0.08 0.27 0 1

37 Table 5: Results of the Gravity Model Estimation by Helpman-Melitz-Rubinstein Model
Total Food & Beverages
Industrial Supplies
Fuels & Lubricants
Capital Goods
Transport Equipment
Consumer Goods
Goods (not classified)
NLS OLS NLS OLS NLS OLS NLS OLS NLS OLS NLS OLS NLS OLS NLS OLS (1) (2) (3) (4) (5) (6) (7) (8) (9) (10) (11) (12) (13) (14) (15) (16)
LnGDPexp 1.37*** (0.11)
0.89*** (0.18)
1.14*** (0.14)
0.64*** (0.21)
1.11*** (0.14)
0.32 (0.21)
0.94*** (0.26)
0.60* (0.36)
0.79*** (0.14)
0.66*** (0.21)
1.17*** (0.16)
0.93*** (0.27)
0.98*** (0.13)
0.67*** (0.20)
1.30*** (0.28)
1.06** (0.47)
LnGDPimp -0.13 (0.14)
0.69*** (0.12)
0.69*** (0.17)
0.58*** (0.16)
0.45*** (0.15)
0.52*** (0.15)
0.82*** (0.32)
1.27*** (0.33)
0.47*** (0.14)
0.71*** (0.16)
0.17 (0.17)
0.99*** (0.19)
0.33** (0.14)
0.95*** (0.15)
0.32 (0.26)
0.27 (0.30)
LnDistance -0.10 (0.10)
-1.27*** (0.03)
-0.68*** (0.19)
-1.26*** (0.04)
-0.48*** (0.09)
-1.38*** (0.04)
-0.44 (0.37)
-2.39*** (0.08)
-0.34*** (0.08)
-1.32*** (0.04)
-0.38*** (0.08)
-1.57*** (0.04)
-0.23*** (0.09)
-1.36*** (0.04)
-1.2*** (0.09)
-1.40*** (0.05)
Common Language
-0.33*** (0.11)
0.73*** (0.06)
0.29* (0.15)
0.69*** (0.07)
-0.10 (0.09)
0.62*** (0.06)
-0.93*** (0.21)
0.08 (0.12)
0.20** (0.09)
1.06*** (0.06)
-0.04 (0.09)
1.07*** (0.07)
-0.17 (0.10)
0.95*** (0.07)
0.58*** (0.11)
0.78*** (0.08)
Common Border
1.85*** (0.14)
1.14*** (0.12)
1.11*** (0.12)
1.25*** (0.12)
1.42*** (0.13)
1.05*** (0.13)
-0.05 (0.25)
1.12*** (0.18)
1.20*** (0.13)
1.01*** (0.13)
0.73*** (0.12)
0.93*** (0.12)
1.35*** (0.13)
1.18*** (0.13)
0.55*** (0.16)
0.68*** (0.16)
Colony 1.02*** (0.10)
0.71*** (0.10)
1.00*** (0.11)
1.00*** (0.11)
1.00*** (0.11)
0.84*** (0.11)
0.55** (0.23)
1.30*** (0.16)
0.76*** (0.11)
0.72*** (0.11)
0.23* (0.12)
0.65*** (0.11)
0.75*** (0.12)
0.75*** (0.12)
0.58*** (0.15)
0.74*** (0.14)
Landlocked 8.27*** (0.54)
-2.97*** (0.57)
-2.46 (1.56)
-2.55*** (1.44)
-0.72 (0.61)
0.99 (0.79)
2.56*** (0.98)
-0.52 (1.08)
2.65*** (0.78)
-2.42*** (0.95)
1.52 (2.01)
-1.14* (0.61)
4.11*** (0.78)
1.03 (1.72)
5.12*** (2.01)
-1.35
FTA 0.04 (0.08)
0.58*** (0.06)
0.31** (0.13)
0.64*** (0.08)
0.28*** (0.07)
0.67*** (0.07)
-0.06 (0.19)
0.61*** (0.14)
0.41*** (0.07)
0.73*** (0.07)
0.35*** (0.09)
0.88*** (0.08)
0.02 (0.08)
0.50*** (0.08)
0.05 (0.10)
0.11 (0.10)
eta_hat -1.97*** (0.18)
6.45*** (0.68)
-0.04 (0.30)
5.22*** (0.72)
-0.79*** (0.13)
6.99*** (0.69)
-0.74* (0.40)
0.01 (0.93)
-0.05 (0.11)
7.14*** (0.74)
0.15 (0.11)
4.11*** (0.81)
-0.71*** (0.13)
11.3*** (0.67)
1.07*** (0.18)
2.95*** (0.86)
delta (from w_hat)
2.30*** (0.16)
1.17*** (0.31)
1.72*** (0.12)
2.57*** (0.44)
1.69*** (0.10)
1.95*** (0.11)
2.23*** (0.12)
0.52*** (0.17)
z -78.3*** (5.25) -57.2***
(6.32) -77.4*** (7.02) -10.5
(6.53) -61.2*** (6.67) -33.4***
(6.70) -118*** (6.78)
-36.7*** (6.68)
z2 31.7*** (2.16) 22.5***
(2.53) 30.6*** (3.39) 5.7***
(2.14) 22.1*** (2.68) 12.4***
(2.46) 48.1*** (3.21)
15.4*** (2.38)
z3 -4.4*** (0.35) -2.9***
(0.38) -4.1*** (0.61) -0.7***
(0.26) -2.7*** (0.40) -1.5***
(0.33) -6.9*** (0.57)
-2.1*** (0.32)
Log pseudo-likelihood -72307.1 -58925.6 -69064.6 -42094.3 -55216.8 -50793.9 -62084.8 -47509.0
Number of observations 63337 63337 48117 48117 57270 57270 26846 26846 49085 49085 41752 41752 52802 52802 32427 32427
Constant term, exporter country, importer country, and time fixed effects are included but not reported. Standard errors, clustered by country pair, are presented in parentheses, ***, **, and * denote 1%, 5%, and 10% significance levels, respectively.

38 Table 6: Countries where Armenia Has Maximally Exceeded its Export Potential, US$ millions
Country Year Total Food & Beverages
Industrial Supplies
Fuels & Lubricants
Capital Goods
Transport Equipment
Consumer Goods
Goods(not classified)
Belgium
2007 -83.60 1.51 -83.39 0.21 0.27 0.00 1.48 0.00 2006 -95.69 1.08 -95.60 0.18 0.22 -0.15 1.15 0.00 2005 -114.23 0.97 -113.31 0.13 0.16 -0.08 -0.09 0.00 2004 -99.64 0.82 -98.90 0.08 0.11 -0.01 0.09 0.00 2003 -117.46 0.56 -117.20 0.06 0.07 -0.02 0.49 0.00
Israel
2007 -10.45 1.47 -4.18 0.15 0.38 0.05 -0.47 0.00 2006 -94.04 1.11 -90.52 0.13 0.30 0.04 0.65 0.00 2005 -102.46 0.90 -99.82 0.10 0.23 0.03 0.55 0.00 2004 -90.77 0.69 -88.31 0.06 0.17 0.02 0.39 0.00 2003 -136.53 0.60 -134.82 0.04 0.13 0.01 0.35 0.00
Russia
2007 -135.32 -100.73 -11.67 0.15 -11.55 -1.43 -4.48 0.01 2006 -68.83 -59.19 7.78 0.12 -9.54 -0.17 -4.11 -0.07 2005 -79.94 -69.57 5.08 0.09 -7.67 -0.55 -3.73 -0.01 2004 -47.92 -47.15 11.43 0.06 -8.64 -0.56 0.87 0.01 2003 -70.84 -52.82 -4.89 0.04 -8.39 -0.49 -0.75 -0.08
Netherlands
2007 -128.53 3.77 -138.47 1.05 0.96 0.06 2.24 0.00 2006 -105.34 2.87 -113.54 0.90 0.74 0.04 1.87 0.00 2005 -113.15 2.37 -119.42 0.68 0.56 -0.24 1.57 0.00 2004 -12.76 1.97 -17.71 0.42 0.44 0.01 1.26 0.00 2003 -11.34 1.64 -15.24 0.30 0.32 0.02 0.99 0.00
Germany
2007 -97.30 5.17 -120.25 0.71 2.35 0.40 5.30 0.01 2006 -90.85 3.64 -109.26 0.61 1.78 -0.19 4.46 0.00 2005 -102.69 3.25 -115.91 0.46 0.44 -0.36 3.18 0.01 2004 -47.19 2.41 -57.87 0.29 1.06 -0.40 2.99 0.01 2003 -16.28 2.31 -24.87 0.20 0.64 -0.41 2.70 -0.27
Switzerland
2007 -35.81 0.77 -32.55 0.33 0.29 0.02 -2.23 0.00 2006 -61.47 0.59 -61.04 0.28 0.23 0.02 0.14 0.00 2005 -26.30 0.47 -25.23 0.22 0.13 0.01 -0.56 0.00 2004 -38.70 0.38 -37.78 0.13 0.05 0.01 -0.27 0.00 2003 -27.53 0.34 -27.13 0.09 0.11 0.01 -0.04 0.00
Georgia
2007 -55.37 -11.63 -35.64 0.45 -3.20 -0.35 -1.11 0.00 2006 -37.54 -7.66 -16.78 -6.85 -2.40 -0.27 -0.82 0.00 2005 -26.70 -3.41 -9.61 -10.33 -0.32 -0.37 -0.31 0.00 2004 -19.75 -3.39 -3.81 -8.85 -0.72 -0.44 -0.52 0.00 2003 -8.21 -0.12 0.31 -5.25 -0.17 -1.13 -0.18 0.00
Ukraine
2007 -31.39 -10.72 -15.64 0.17 -7.32 -0.55 1.23 0.00 2006 -11.21 -9.29 -3.48 0.15 -0.32 -0.21 0.77 0.00 2005 -5.24 -9.25 3.23 0.11 -0.15 -0.31 0.36 0.00 2004 -3.83 -3.07 1.64 0.07 -3.05 -0.40 0.54 0.00 2003 -2.05 -4.46 2.73 0.05 -0.64 -0.18 0.25 0.00

39 Table 6: Countries where Armenia Has Maximally Exceeded its Export Potential, US$ millions
(continued)
Country Year Total Food & Beverages
Industrial Supplies
Fuels & Lubricants
Capital Goods
Transport Equipment
Consumer Goods
Goods (not classified)
Bulgaria
2007 -42.74 0.33 -42.93 0.11 0.10 0.01 0.11 0.00 2006 1.89 0.21 1.72 0.09 0.05 0.01 0.14 0.00 2005 1.58 -0.30 1.90 0.07 0.00 0.01 0.19 0.00 2004 -2.77 -0.70 -1.92 0.04 -0.02 0.00 0.09 0.00 2003 -0.10 0.14 -0.12 0.03 -0.03 0.00 0.10 0.00
Iran
2007 -1.55 6.25 12.80 -9.30 -0.20 -0.06 0.88 0.00 2006 -1.59 2.95 13.19 -9.76 -0.20 -0.21 0.99 0.00 2005 -3.62 3.97 7.10 -6.95 -1.41 0.01 0.41 0.00 2004 -13.49 2.94 -0.48 -8.22 -2.42 -0.02 0.59 0.00 2003 -8.87 2.67 0.55 -4.14 -3.25 -0.73 0.51 0.00

40 Table 7: Countries where Armenia has the Maximal Potential for its Export Expansion, US$ millions
Country Year Total Food & Beverages
Industrial Supplies
Fuels & Lubricants
Capital Goods
Transport Equipment
Consumer Goods
Goods (not classified)
USA
2007 124.64 5.75 61.98 2.99 5.28 0.90 -1.43 0.00 2006 74.11 2.51 37.27 2.57 4.20 0.60 -13.98 0.00 2005 47.73 3.10 23.90 1.95 2.49 0.41 -16.15 0.01 2004 16.26 1.87 9.33 1.21 2.03 0.24 -22.32 0.01 2003 11.45 0.71 8.48 0.85 1.14 0.16 -18.01 0.00
Turkey
2007 64.13 4.73 80.05 1.69 1.37 0.22 2.94 0.01 2006 50.76 3.61 61.54 1.45 1.27 0.15 2.28 0.01 2005 38.42 2.92 46.62 1.10 0.85 0.10 1.95 0.01 2004 28.57 2.34 36.35 0.68 0.55 0.07 1.45 0.01 2003 21.72 1.85 27.22 0.47 0.51 0.04 1.23 0.01
Japan
2007 52.14 9.08 31.31 2.84 1.54 0.15 3.30 0.00 2006 44.80 6.96 27.48 2.45 1.19 0.11 2.73 0.00 2005 34.39 5.74 20.46 1.86 0.93 0.08 2.37 0.00 2004 27.94 4.70 17.36 1.15 0.72 0.06 1.98 0.00 2003 21.59 3.95 13.14 0.81 0.54 0.04 1.66 0.00
China
2007 60.76 5.90 62.32 0.84 3.57 0.10 1.08 0.01 2006 50.13 4.23 51.24 0.71 2.56 -0.07 0.88 0.00 2005 27.97 3.29 38.29 0.53 -6.90 0.05 0.35 0.00 2004 5.99 2.58 9.45 0.33 0.35 0.03 0.29 0.00 2003 15.64 2.03 17.43 0.23 0.95 0.02 0.30 0.00
France
2007 32.70 3.10 24.35 0.73 -4.66 0.21 3.52 0.00 2006 29.34 2.36 19.23 0.63 -0.41 0.15 2.44 0.00 2005 24.68 1.98 15.22 0.48 0.73 0.11 2.30 0.00 2004 19.42 1.35 12.34 0.29 0.56 0.09 2.10 0.00 2003 14.51 1.09 9.05 0.21 0.26 0.06 1.80 0.00
UK
2007 47.91 5.47 27.59 0.89 1.29 0.27 4.50 0.00 2006 32.70 4.38 15.77 0.77 0.84 0.20 3.85 0.00 2005 31.24 3.66 17.38 0.58 0.73 0.15 3.45 0.00 2004 24.02 3.06 13.71 0.33 0.52 -0.19 2.86 0.00 2003 -23.46 2.53 -30.22 0.25 0.47 0.07 0.73 -0.05
Spain
2007 22.45 3.83 9.81 0.55 1.05 0.22 3.27 0.00 2006 3.27 2.84 -7.24 0.47 0.82 0.16 2.70 0.00 2005 23.33 2.46 14.76 0.36 0.64 0.12 2.29 0.00 2004 18.06 1.94 11.63 0.22 0.49 0.09 1.94 0.00 2003 13.40 1.04 8.84 0.16 0.38 0.06 1.57 0.00
Italy
2007 32.98 8.67 46.41 1.54 0.73 0.24 -19.40 0.01 2006 21.75 6.73 34.88 1.33 0.87 0.18 -19.44 0.01 2005 14.56 5.74 30.68 1.01 0.43 0.13 -21.21 0.01 2004 4.08 4.83 25.15 0.63 0.63 0.10 -24.91 0.01 2003 6.32 4.11 18.07 0.44 0.45 0.08 -15.09 0.01

41 Table 7: Countries where Armenia has the Maximal Potential for its Export Expansion, US$ millions
(continued)
Country Year Total Food & Beverages
Industrial Supplies
Fuels & Lubricants
Capital Goods
Transport Equipment
Consumer Goods
Goods (not classified)
Hong Kong
2007 24.62 1.46 19.25 0.18 1.50 0.04 0.41 0.00 2006 17.86 1.09 13.23 0.15 1.15 0.03 0.53 0.00 2005 15.02 0.88 11.26 0.12 0.83 0.02 0.73 0.00 2004 7.21 0.70 5.43 0.07 0.65 0.01 -0.22 0.00 2003 6.52 0.56 4.97 0.05 0.47 0.01 0.10 0.00
Saudi Arabia
2007 18.46 4.87 13.85 0.01 0.59 0.12 1.50 0.00 2006 14.74 3.77 10.71 0.01 0.46 0.08 1.23 0.00 2005 11.67 3.07 8.41 0.01 0.36 0.06 1.06 0.00 2004 8.86 2.61 6.78 0.00 -0.11 0.05 0.89 0.00 2003 7.10 2.16 5.11 0.00 0.21 0.03 0.73 0.00
India
2007 17.19 1.65 24.07 0.63 0.58 0.05 0.29 0.00 2006 14.89 1.21 19.85 0.54 0.43 0.03 0.22 0.00 2005 11.25 0.96 15.06 0.41 0.32 0.02 0.18 0.00 2004 8.50 0.77 11.85 0.25 0.24 0.01 0.14 0.00 2003 6.51 0.62 8.95 0.18 0.17 0.01 0.11 0.00
Sweden
2007 17.13 2.00 11.64 0.15 0.58 0.08 1.42 0.00 2006 13.60 1.49 8.98 0.13 0.41 0.06 1.25 0.00 2005 10.62 1.19 6.94 0.10 0.33 0.04 1.09 0.00 2004 8.46 1.05 5.61 0.06 0.25 0.03 0.94 0.00 2003 6.42 0.85 4.22 0.04 0.20 0.02 0.73 0.00
Korea
2007 16.85 1.87 16.10 0.78 0.71 0.04 0.47 0.00 2006 12.68 1.18 12.06 0.67 0.54 0.02 0.38 0.00 2005 10.13 1.04 9.60 0.50 0.41 0.02 0.26 0.00 2004 7.53 0.95 7.51 0.31 0.31 0.01 -0.08 0.00 2003 6.04 0.78 5.70 0.22 0.23 0.01 0.21 0.00
Singapore
2007 14.42 0.69 7.24 0.28 0.81 0.04 0.51 0.00 2006 11.32 0.53 5.54 0.24 0.62 0.03 0.41 0.00 2005 8.57 0.42 4.21 0.18 0.47 0.02 0.28 0.00 2004 6.73 0.35 3.38 0.11 0.36 0.01 0.28 0.00 2003 4.99 0.28 2.50 0.08 0.26 0.01 0.22 0.00
Mexico
2007 13.45 1.13 10.17 0.12 0.59 0.05 0.82 0.00 2006 10.64 0.88 7.82 0.10 0.45 0.03 0.67 0.00 2005 8.29 0.72 6.05 0.08 0.35 0.02 0.56 0.00 2004 6.57 0.60 4.88 0.05 0.27 0.02 0.47 0.00 2003 5.05 0.50 3.70 0.03 0.21 0.01 0.39 0.00
UAE
2007 20.61 3.38 17.28 0.07 0.40 -0.49 2.44 0.00 2006 16.00 2.62 12.83 0.06 -0.19 0.11 2.04 0.00 2005 7.05 2.25 5.51 0.04 -1.33 0.08 1.66 0.00 2004 4.55 1.84 5.69 0.03 -0.58 -0.07 -0.99 0.00 2003 -6.48 1.40 -5.84 0.02 -0.42 -0.39 -0.10 0.00

42 Table 7: Countries where Armenia has the Maximal Potential for its Export Expansion, US$ millions
(continued)
Country Year Total Food & Beverages
Industrial Supplies
Fuels & Lubricants
Capital Goods
Transport Equipment
Consumer Goods
Goods(not classified)
Poland
2007 10.45 1.48 7.70 0.22 0.25 0.08 1.35 0.00
2006 5.52 1.04 3.07 0.19 0.42 0.05 1.06 0.00
2005 10.13 0.93 8.18 0.14 0.31 0.03 0.86 0.00
2004 7.89 0.76 6.56 0.09 0.24 0.02 0.70 0.00
2003 5.83 0.62 4.76 0.06 0.18 0.02 0.58 0.00
Australia
2007 11.31 0.73 6.37 0.22 0.39 0.08 1.04 0.00 2006 9.63 0.55 5.55 0.19 0.30 0.05 0.89 0.00 2005 7.78 0.54 4.41 0.14 0.24 0.04 0.76 0.00 2004 6.01 0.44 3.38 0.09 0.18 0.03 0.68 0.00 2003 4.71 0.38 2.63 0.06 0.14 0.02 0.56 0.00
Greece
2007 11.74 2.57 8.57 0.21 -1.72 0.06 1.63 0.00 2006 10.69 1.97 6.87 0.18 -0.17 0.05 1.26 0.00 2005 8.13 1.58 5.23 0.14 -0.21 0.01 1.09 0.00 2004 6.07 1.35 4.25 0.09 -0.57 0.02 0.90 0.00 2003 0.03 1.09 -0.72 0.06 -1.05 0.02 0.68 0.00
Azerbaijan
2007 12.87 3.44 9.74 0.05 0.40 0.10 1.22 0.00 2006 9.03 2.35 6.94 0.04 0.28 0.05 0.86 0.00 2005 5.70 1.58 4.70 0.03 0.17 0.02 0.57 0.00 2004 3.80 1.12 3.42 0.02 0.11 0.01 0.39 0.00 2003 2.78 0.88 2.50 0.01 0.08 0.01 0.31 0.00

0
5
10
15
20
25
30
35
40
45
50
55U
SA
Figure 2
USA
Turk
eyJa
pan
Chi
naFr
ance
: Countries wit
UK
Spai
nIta
lyH
ong
Kon
g
th Maximal Pot
Saud
i Ara
bia
Indi
aSw
eden
Kor
ea
tential to Expan
Sing
apor
eM
exic
oU
AE
Pola
ndA
li
nd Armenian Ex
Aus
tralia
Gre
ece
Aze
rbai
jan
Hun
gary
Rom
ania
xport, US$ mill
Rom
ania
Aus
tria
Bra
zil
Den
mar
kM
alay
sia
lions (averages
Mal
aysi
aEg
ypt
Cze
ch R
ep.
Sout
h A
fric
aPo
rtuga
l
for the years 20
gIr
elan
dTh
aila
ndN
orw
ayIn
done
sia
003-2007)
Finl
and
Iraq
Kuw
ait
Cyp
rus
43
Slov
akia

0
0,5
1
1,5
2
2,5
3Ph
ilipp
ines
Figure 3: CounPh
ilipp
ines
Syria
Qat
arA
lger
iaV
iet N
am
ntries with Pote
Lith
uani
aC
roat
iaM
oroc
coN
ew Z
eala
ndV
l
ntial to Expand
Vene
zuel
aO
man
Liby
aEs
toni
aA
n gol
a
d Armenian Exp
gK
azak
hsta
nSr
i Lan
kaPe
ruB
osni
a H
erze
govi
na
port less than 3
Libe
riaEc
uado
rG
hana
Hon
dura
sEl
Salv
ador
3 US$ million, U
El S
alva
dor
Sene
gal
Moz
ambi
que
Cam
bodi
aC
amer
oon
US$ million (ave
Para
guay
Zim
babw
eU
gand
aG
abon
d
erages for the y
And
orra
Bol
ivia
TFY
R o
f Mac
edon
iaM
ongo
liaLa
tvia
years 2003-2007
Latv
iaSu
rinam
eC
had
Rw
anda
Swaz
iland
44 7)
Bhu
tan
45 Figure 4: Countries where Armenia has Exceeded its Export Potential, US$ million (averages for the years 2003-2007)
-120
-100
-80
-60
-40
-20
0D
omin
ica
San
Mar
ino
Icel
and
Rep
. of M
oldo
va
Luxe
mbo
urg
Turk
men
ista
n
Can
ada
Iran
Bel
ize
Bul
garia
Ukr
aine
Geo
rgia
Switz
erla
nd
Ger
man
y
Net
herla
nds
Rus
sian
Fed
erat
ion
Isra
el
Bel
gium

46
REFERENCES
Afonso, O. (2001) “The Impact of International Trade on Economic Growth”, CEMPRE.
Anderson, J.E. and E. van Wincoop (2004) “Trade Costs”, NBER Working Paper Series, No. 10480.
Armstrong, Sh. (2007) “Measuring Trade and Trade Potential: a Survey”, Asia Pacific Economic Paper Series, No. 368.
Baldwin, R.E. (1993) “The Potential for Trade between Countries of EFTA and Central and Eastern Europe”, Occasional Papers No 44, European Free Trade Association, Geneva.
Baldwin, R.E. (1994) “Towards an Integrated Europe”, Centre for Economic Policy Research.
Batra, A. (2004) “India’s Global Trade Potential: The Gravity Model Approach”, Indian Council for Research on International Economic Relations, Working Paper No.151.
Baxter, M. and Kouparitsas, M.A. (2005) “What Determines Bilateral Trade Flows?” Federal Reserve Bank of Chicago, Working Paper 2005-11.
Beilock, R. and Torosyan, K. (2007) “A Phased Strategy for Opening Armenia’s Western Border”, AIPRG and International School of Economics at Tbilisi State University.
Bergstrand, J. H. (1985) “The Gravity Equation in International Trade - Some Microeconomic Foundations and Empirical Evidence”, Review of Economics and Statistics, Vol.67, 1985, pp.474-481.
Bhattacharyya, R. and Banerjee, T. (2006) “Does the Gravity Model Explain India’s Direction of Trade? A Panel Data Approach”, Working Paper No.2006-09-01, Indian Institute of Management.
Buckley, P.J. and Casson, M. (1976) “The Future of the Multinational Enterprise”, Holmes and Meier, New York. Cambridge Mass.: NBER, 1995.
Deadorff A.V. (1998) “Determinants of Bilateral Trade: Does Gravity Work in a Neoclassical World?”, NBER Working Paper No 5377.
De Benedictis, L. and Vicarelli, C. (2004) “Trade Potentials in Gravity Panel Data Models”, ISAE Working Papers No.44
DeRosa, A. et al. (2008) “Prospects for Greater Global and Regional Integration in the Maghreb. Gravity Model Analysis”, Peterson Institute for International Economics, Washington, DC
Doing Business in Armenia and Turkey, CSERA, June 2009.
Egger, P. (2001) “An Econometric View on the Estimation of Gravity Models and the Calculation of Trade Potentials” WIFO Working Papers No.141.
Eichengreen B. and Irwin D. (1997) “The role of history in bilateral trade flows”, NBER Working Paper No.5565.
Evenett, Simon. J. and Keller, Wolfgang (1998) “On Theories Explaining the Success of the Gravity Equation”, Cambridge Mass.: NBER Working Paper No W6529
Frankel, J. (1997) “Regional Trading Blocs”, Institute for International Economics.
Frankel, J. and Wei, S.J. (1993) “Trade Blocs and Currency Blocs”, NBER Working Paper No. 4335, Cambridge, MA.
Freinkman L., Polyakov E., Revenco C. (2004) “Armenia’s Trade Performance in 1995-2002 and the Effect of Closed Borders: A Cross-Country Perspective”, The World Bank, Armenian International Research Policy Group, Working Paper No. 04/04.
Giragosian, R. Changing Armenia-Turkish Relations. Friedrich-Ebert-Stiftung. February 2009.
Hausman, J.A., Taylor W.E. (1981) “Panel Data and Unobservable Individual Effect”, Econometrica 49

47 Helmers, Ch. and Pasteels, J.-M. (2005) ”TradeSim (third version), a Gravity Model for the Calculation of
Trade Potentials for Developing Countries and Economies in Transition”, ITC Working Paper
Helpman, E. and Krugman, P.R. (1985) “Market Structure and Foreign Trade”, MIT Press
Helpman, E., Melitz, M. and Rubinstein, Y. (2008) “Estimating Trade Flows: Trading Partners and Trading Volumes,” Quarterly Journal of Economics, 123
Iskandaryan, A., Minasyan, S. Pragmatic Policies vs. Historical Constraints: Analyzing Armenia-Turkey Relations. Caucasus Institute Research Papers, #1, January 2010. – Yerevan: Caucasus Institute, 2010. – 49 p.
Jošić M. (2008) “Gravity Model and International Trade: the Case of OECD Countries”. Challenges of Economic Sciences in the 21st Century, Model of Market Economy for Countries in Transition. P. 47-54.
Julien, P.E., Joyal, A., Deshaies, L. and Ramanghalahy, C. (1997) “A typology of strategic behavior among small and medium-sized exporting businesses- a case study”, International Small Business Journal, vol. 15, no.2, pp.33-49.
Klein, M.W. and Shambaugh, J.C. (2004) “Fixed Exchange Rates and Trade”, NBER Working Paper No. 10696.
Kruger, A. (1997) “Trade Policy and Economic Development: How We Learn”, NBER Working Paper No.5896.
Krugman, P. (1998) “Space: The Final Frontier”, Journal of Economic Perspectives, Vol.12, 1998, pp. 161-175
Krugman, P. (1991) “Geography and Trade”, Cambridge: MIT Press, 136 p.
Krugman, P. (1991) “Increasing Returns and Economic Geography”, Journal of Political Economy, Vol.3, , pp. 483-499
Linnemann, H. (1966) “An Econometric Study of International Trade Flows”, Amsterdam: North-Holland Publishing Company
Martin, Will and Pham, Cong (2007) “Estimating the Gravity Model when Zero Trade Flows are Important”, WB
Martínez-Zarzoso, I. and Márquez-Ramos, L. (2005) “International Trade, Technological Innovation and Income: a Gravity Model Approach”, IVIE working papers, WP-EC 2005-15
Martínez-Zarzoz, I. and Nowak-Lehmann, F. (2003) “Augmented Gravity Model: an Empirical Application to Mercosur-European Union Trade Flows”, Journal of Applied Economics, Vol. VI, No. 2 (Nov 2003), 291-316
Maryanchyk, I. (2005) “Ukrainian international trade. How far from the potential?”, EERC Working Paper Series, WP No 05/14
Mitra, S. et al. (2006) “Armenia. The Caucasian Tiger”, Poverty Reduction and Economic Management Unit, Europe and Central Asia Region, The World Bank
Paas, T. (2000) “Gravity Approach for Modeling Trade Flows between Estonia and the Main Trading Partners”, Tartu University Press
Paas, T. (2003) “Regional Integration and International Trade in the Context of EU Eastward Enlargement”, HWWA Discussion Paper 218, http://www.hwwa.de
Polyakov, E. (2002) “Armenia Trade Diagnostic Study”, Poverty Reduction and Economic Management, Europe and Central Asia Region, The World Bank
Poyhonen, P. (1963) “A Tentative Model for Volume in Trade Between Countries”, WeltwirtschaftlichesArhiv, Vol. 90, pp.91-113

48 Rahman, M.M. (2003) “A Panel Data Analysis of Bangladesh’s Trade: The Gravity Model Approach”,
University of Sydney
Santos Silva, J. M. C. and Tenreyro, S. (2006) “The Log of Gravity”, The Review of Economics and Statistics, November 2006, 88(4): 641–658
Santos Silva, J. M. C. and Tenreyro, S. (2009a) “On the Existence of the Maximum Likelihood Estimates for Poisson Regression”, CEP Discussion Paper No 932
Santos Silva, J. M. C. and Tenreyro, S. (2009b) “Trading Partners and Trading Volumes: Implementing the Helpman-Melitz-Rubinstein Model Empirically”
Shepotylo, O. (2009a) "Export Diversification across Industries and Space: Do CIS Countries Diversify Enough?" Discussion Papers 20, Kyiv School of Economics
Shepotylo, O., (2009b) "Gravity with Zeros: Estimating Trade Potential of CIS Countries," Discussion Papers 16, Kyiv School of Economics
Shepotylo, O. (2009c) “EU Integration and Trade: a Look from the Outside of the EU Eastern Border” KSE& KEI
Sohn, C.-H. (2001) “A Gravity Model Analysis of Korea's Trade Patterns and the Effects of a Regional Trading Arrangement”, Korea Institute for International Economic Policy Working Paper Series Vol. 2001-09,
Sohn, C.-H. (2005) “Does the Gravity Model Fit Korea’s Trade Patterns? Implications or Korea’s FTA Policy and North Korean Trade”, Centre for International Trade Studies Working Paper 2005-02,
Study of Economic Relations between Georgia and Armenia: The Development of Regional Trade Related Growth in Samtskhe-Javakheti. CRRC-Georgia. August - September 2007.
Spanu, V. (2003) “Liberalization of the International Trade and Economic Growth: Implications for both Developed and Developing Countries”, Harvard University
Tinbergen, J. (1962) “Shaping the World Economy”, New York: Twentieth Century Fund
Tobin, J. (1958) “Estimation of Relationships for Limited Dependent Variables”, Econometrica, Vol. 26, No. 1.
Vernon, R. (1966) “International Investment and International Trade in the Product Cycle”, Quarterly Journal of Economics, vol. 80, pp.190-207.
Wang, Z.K. and Winters, L.A. (1991) “The Trading Potential of Eastern Europe”, CEPR Discussion Paper No 610, London
Williamson, O.E. (1975) “Markets and Hierarchies: Analysis and Antitrust Implications”, The Free Press, New York