reform of state-owned enterprises - imf · reform of state-owned enterprises thornton matheson...
TRANSCRIPT
Reform of State-Owned Enterprises
Thornton Matheson
Vietnam: Retaining Stability, Regaining Competitive Edge, Reaping Growth Potential
Hanoi, April 18, 2013
1
Vietnam should resume the path to becoming an emerging market • Vietnam has experienced strong growth as a result
of past reforms, including economic liberalization
• Recently, however, growth has slowed as distortions accumulated
• To reap its full growth potential, a second wave of reforms is now needed
• This includes: – Creating a level playing field for private and state-owned
enterprises (SOEs)
– Restructuring remaining SOEs
2
The authorities are already taking initial steps in this direction
• SOE restructuring is one of three strategic goals in the 2011-2015 Five-Year Plan
• SOE Restructuring Plan introduced in July 2012 – Roughly 1,200 remaining 100 percent SOEs, mostly owned
by central government
• Purpose of this presentation: – Analyze SOE performance and the authorities’ proposed
SOE reforms
– Offer supplementary recommendations on how to improve outcomes
3
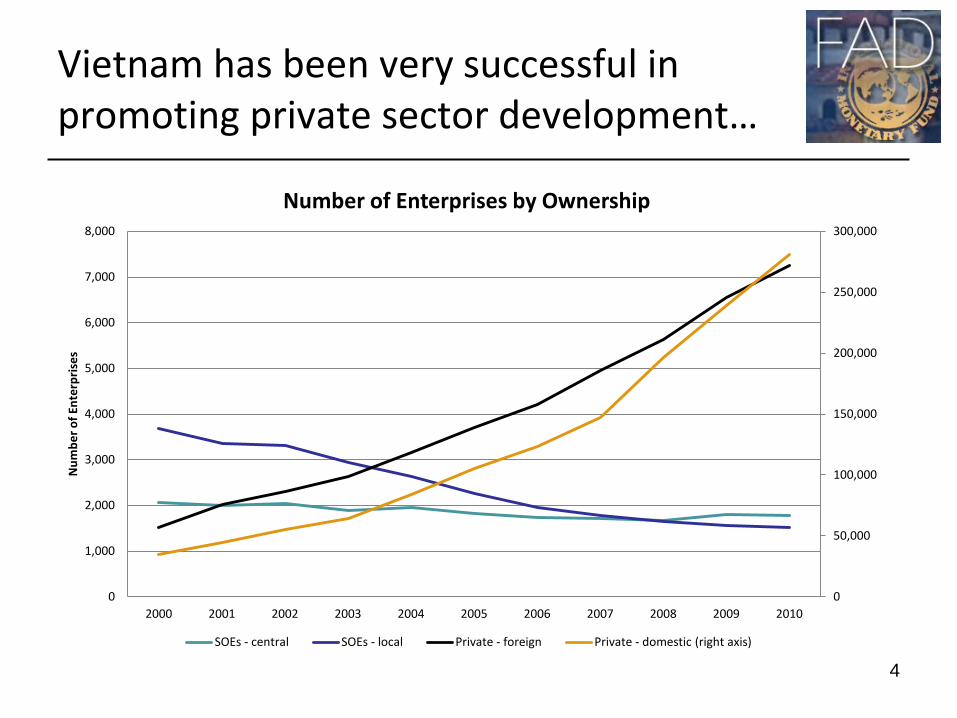
Vietnam has been very successful in promoting private sector development…
4
0
50,000
100,000
150,000
200,000
250,000
300,000
0
1,000
2,000
3,000
4,000
5,000
6,000
7,000
8,000
2000 2001 2002 2003 2004 2005 2006 2007 2008 2009 2010
Num
ber o
f Ent
erpr
ises
Number of Enterprises by Ownership
SOEs - central SOEs - local Private - foreign Private - domestic (right axis)
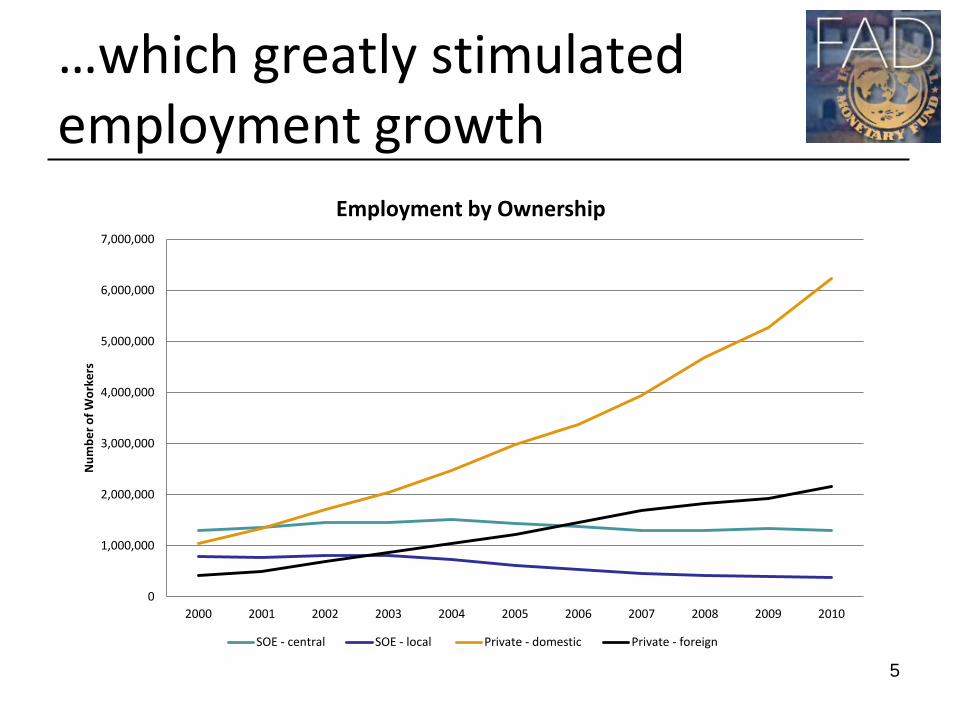
…which greatly stimulated employment growth
5
0
1,000,000
2,000,000
3,000,000
4,000,000
5,000,000
6,000,000
7,000,000
2000 2001 2002 2003 2004 2005 2006 2007 2008 2009 2010
Num
ber o
f Wor
kers
Employment by Ownership
SOE - central SOE - local Private - domestic Private - foreign
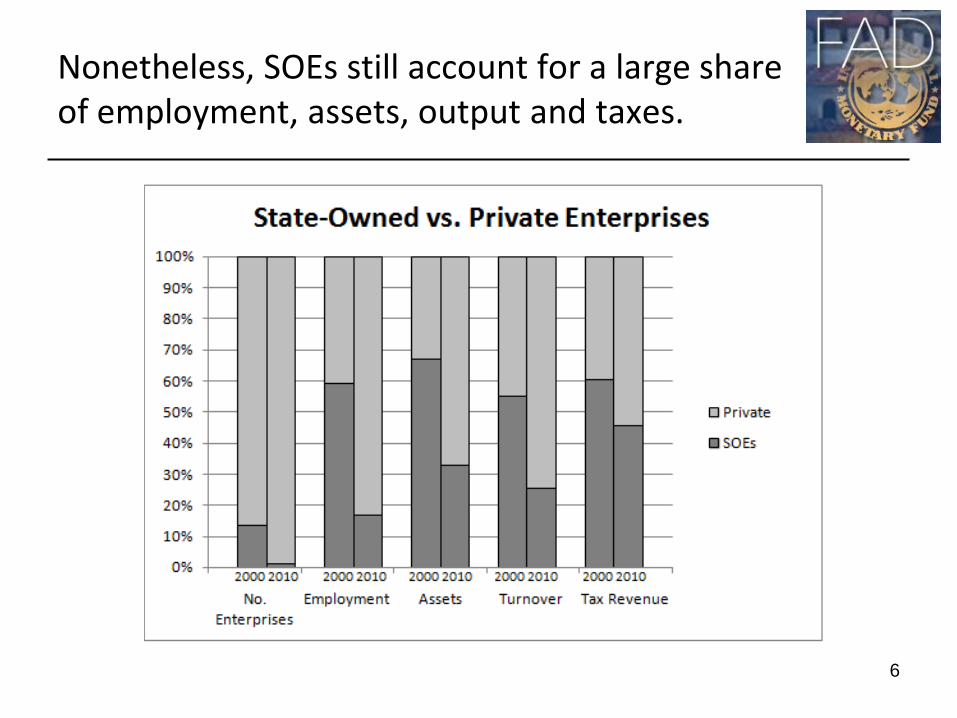
Nonetheless, SOEs still account for a large share of employment, assets, output and taxes.
6
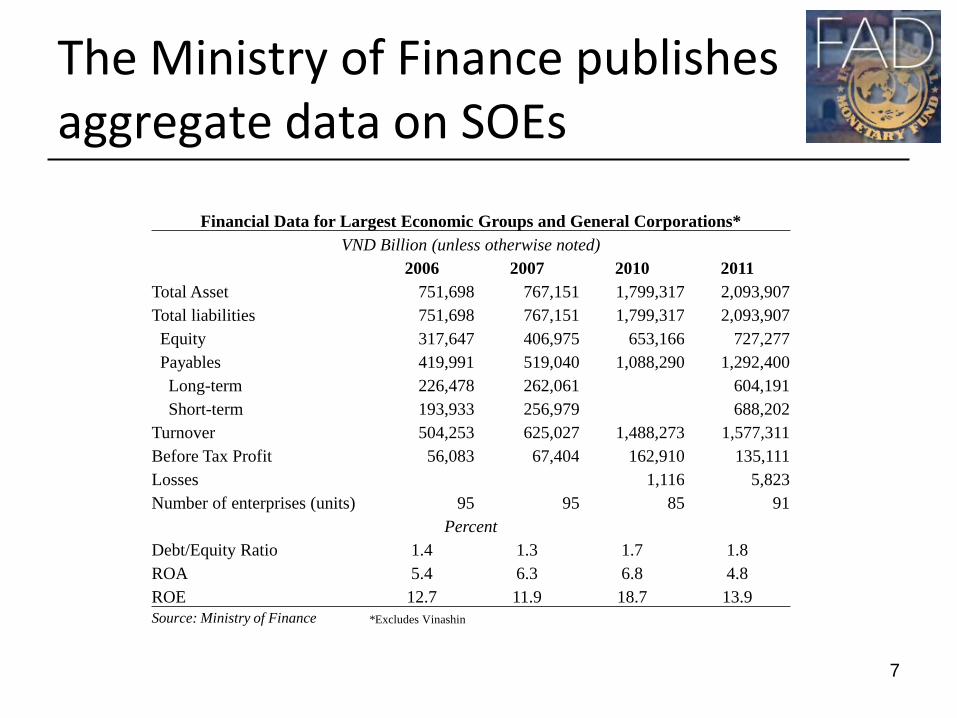
The Ministry of Finance publishes aggregate data on SOEs
7
Financial Data for Largest Economic Groups and General Corporations* VND Billion (unless otherwise noted)
2006 2007 2010 2011 Total Asset 751,698 767,151 1,799,317 2,093,907 Total liabilities 751,698 767,151 1,799,317 2,093,907 Equity 317,647 406,975 653,166 727,277 Payables 419,991 519,040 1,088,290 1,292,400 Long-term 226,478 262,061 604,191 Short-term 193,933 256,979 688,202
Turnover 504,253 625,027 1,488,273 1,577,311 Before Tax Profit 56,083 67,404 162,910 135,111 Losses 1,116 5,823 Number of enterprises (units) 95 95 85 91
Percent Debt/Equity Ratio 1.4 1.3 1.7 1.8 ROA 5.4 6.3 6.8 4.8 ROE 12.7 11.9 18.7 13.9 Source: Ministry of Finance *Excludes Vinashin
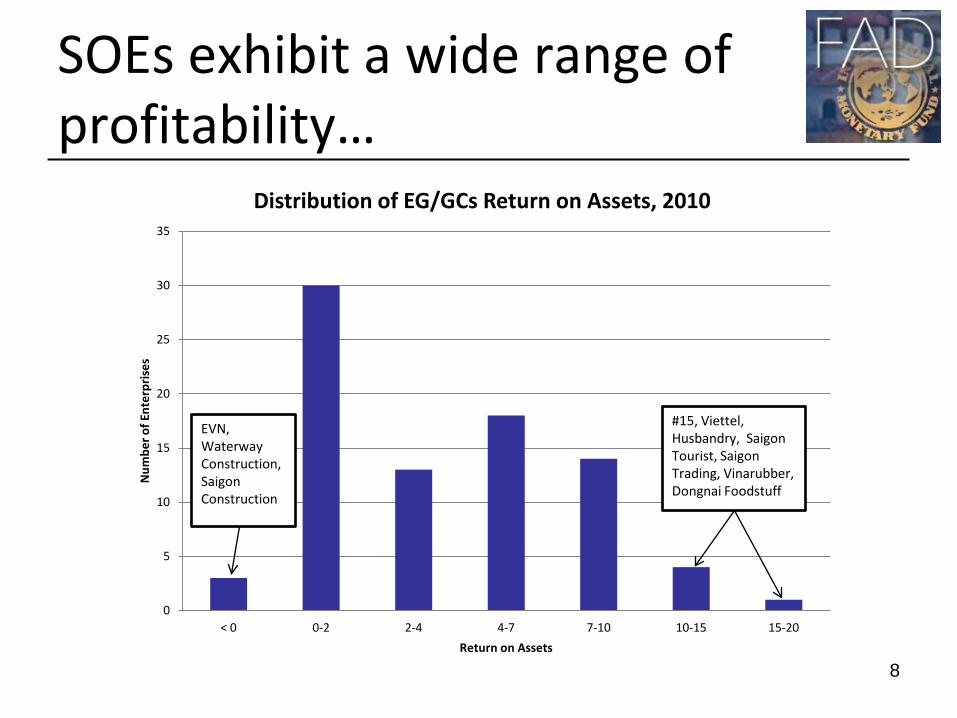
SOEs exhibit a wide range of profitability…
8
0
5
10
15
20
25
30
35
< 0 0-2 2-4 4-7 7-10 10-15 15-20
Num
ber o
f Ent
erpr
ises
Return on Assets
Distribution of EG/GCs Return on Assets, 2010
#15, Viettel, Husbandry, Saigon Tourist, Saigon Trading, Vinarubber, Dongnai Foodstuff
EVN, Waterway Construction, Saigon Construction
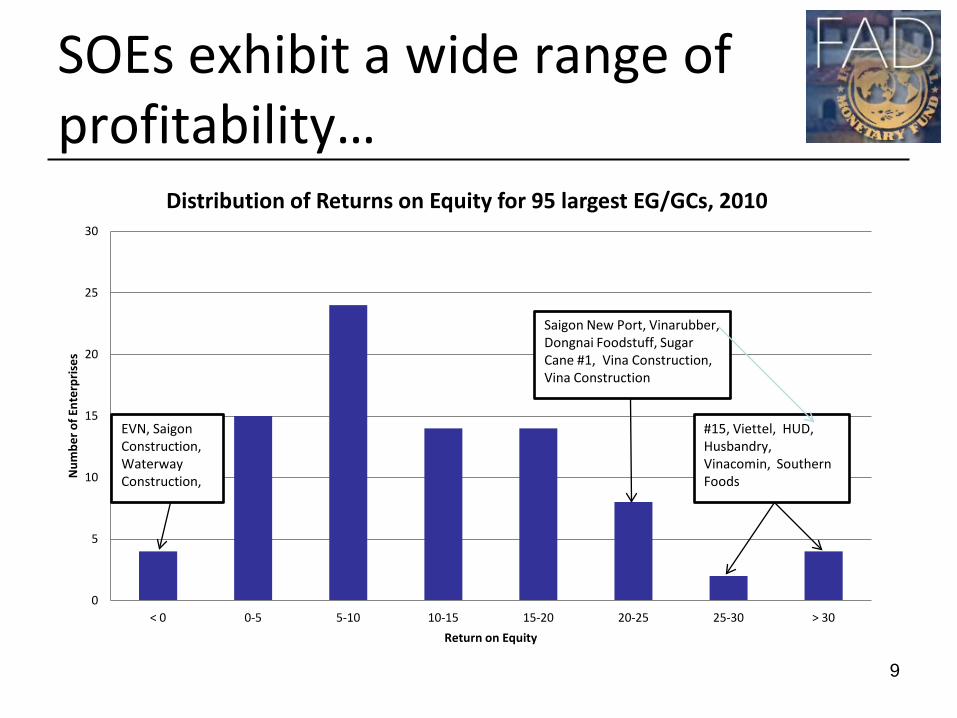
SOEs exhibit a wide range of profitability…
9
0
5
10
15
20
25
30
< 0 0-5 5-10 10-15 15-20 20-25 25-30 > 30
Num
ber o
f Ent
erpr
ises
Return on Equity
Distribution of Returns on Equity for 95 largest EG/GCs, 2010
#15, Viettel, HUD, Husbandry, Vinacomin, Southern Foods
Saigon New Port, Vinarubber, Dongnai Foodstuff, Sugar Cane #1, Vina Construction, Vina Construction
EVN, Saigon Construction, Waterway Construction,
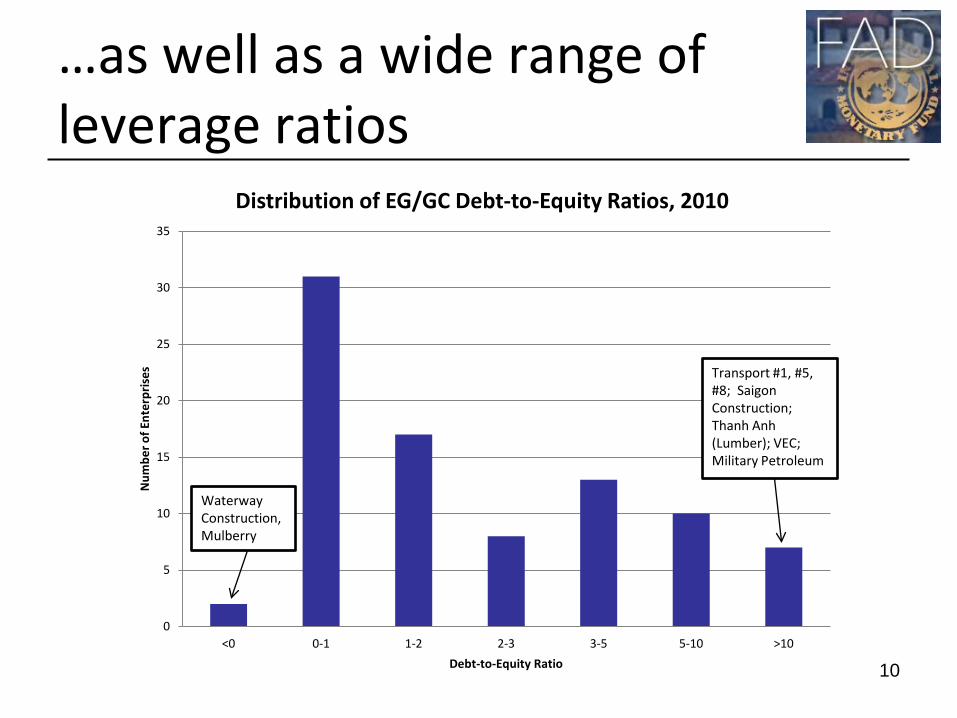
…as well as a wide range of leverage ratios
10
0
5
10
15
20
25
30
35
<0 0-1 1-2 2-3 3-5 5-10 >10
Num
ber o
f Ent
erpr
ises
Debt-to-Equity Ratio
Distribution of EG/GC Debt-to-Equity Ratios, 2010
Transport #1, #5, #8; Saigon Construction; Thanh Anh (Lumber); VEC; Military Petroleum
Waterway Construction, Mulberry
Different SOEs thus have different restructuring needs • Many SOEs are overleveraged and/or invested in
industries hit by downturn (e.g., HUD, Songda, Vinashin, Vinalines) – These need downsizing/consolidation
• Other SOEs (e.g., Viettel, Vinarubber, Vinacomin) are highly profitable with low debt – High profits may be sign of restricted competition
• Others do not earn a market return due to social mission (e.g., EVN, VEC, Petrolimex) – These require fiscal rationalization for sustainability
11
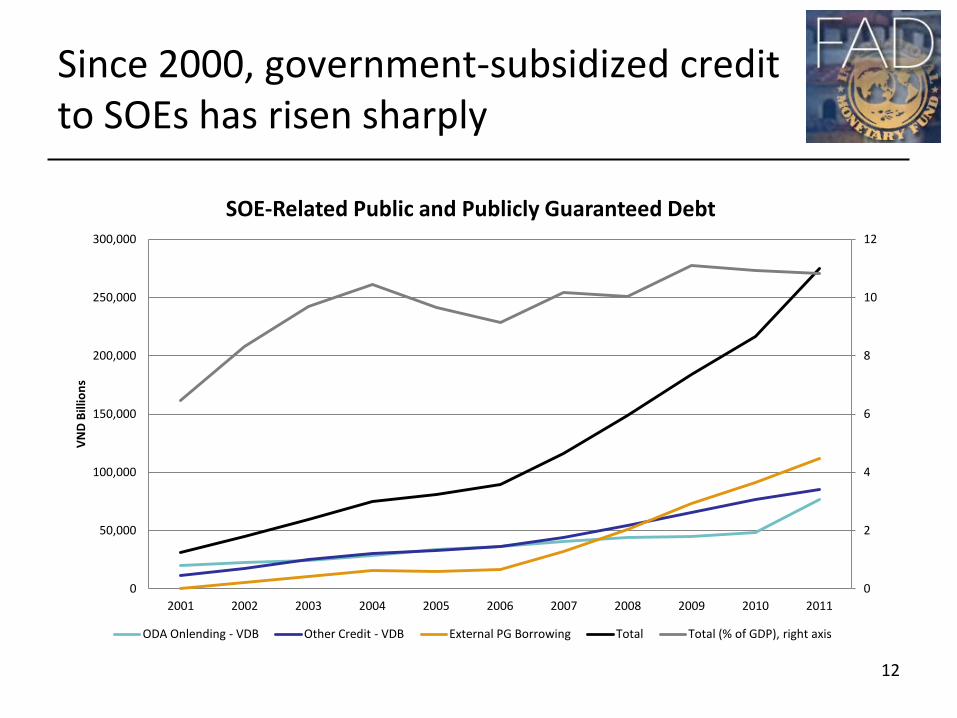
Since 2000, government-subsidized credit to SOEs has risen sharply
12
0
2
4
6
8
10
12
0
50,000
100,000
150,000
200,000
250,000
300,000
2001 2002 2003 2004 2005 2006 2007 2008 2009 2010 2011
VN
D B
illio
ns
SOE-Related Public and Publicly Guaranteed Debt
ODA Onlending - VDB Other Credit - VDB External PG Borrowing Total Total (% of GDP), right axis
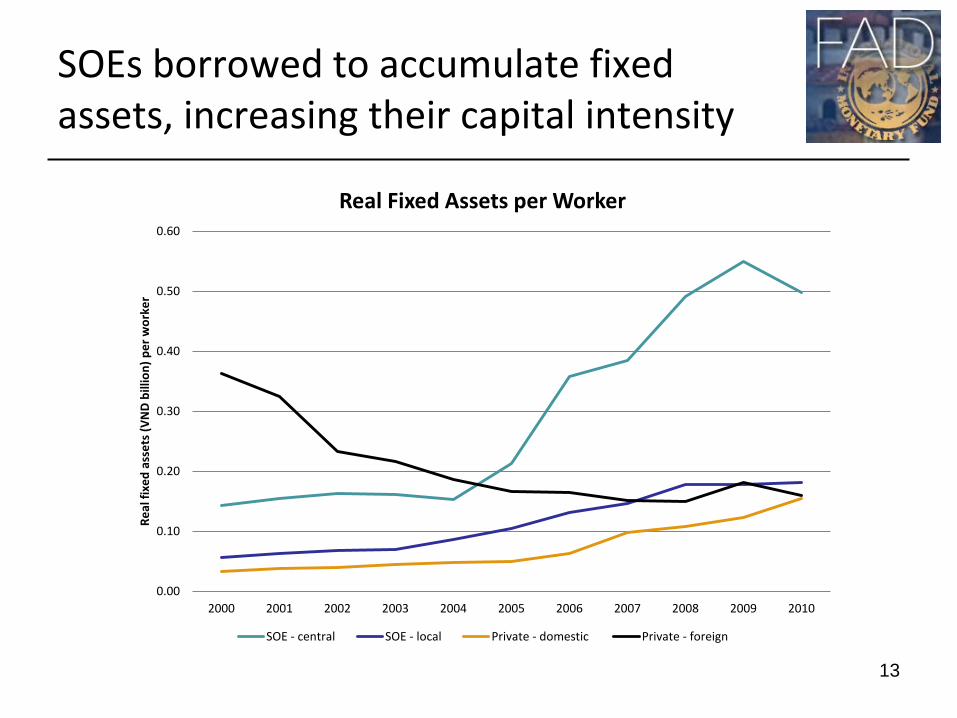
SOEs borrowed to accumulate fixed assets, increasing their capital intensity
13
0.00
0.10
0.20
0.30
0.40
0.50
0.60
2000 2001 2002 2003 2004 2005 2006 2007 2008 2009 2010
Real
fixe
d as
sets
(VN
D b
illio
n) p
er w
orke
r
Real Fixed Assets per Worker
SOE - central SOE - local Private - domestic Private - foreign
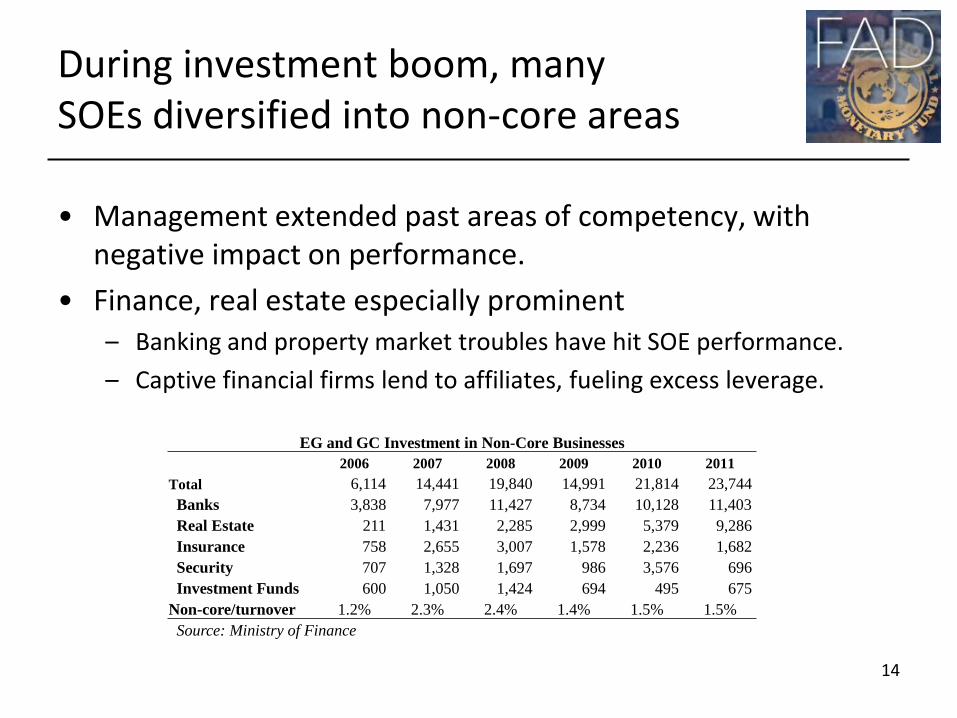
During investment boom, many SOEs diversified into non-core areas
• Management extended past areas of competency, with negative impact on performance.
• Finance, real estate especially prominent – Banking and property market troubles have hit SOE performance.
– Captive financial firms lend to affiliates, fueling excess leverage.
14
EG and GC Investment in Non-Core Businesses 2006 2007 2008 2009 2010 2011
Total 6,114 14,441 19,840 14,991 21,814 23,744 Banks 3,838 7,977 11,427 8,734 10,128 11,403 Real Estate 211 1,431 2,285 2,999 5,379 9,286 Insurance 758 2,655 3,007 1,578 2,236 1,682 Security 707 1,328 1,697 986 3,576 696 Investment Funds 600 1,050 1,424 694 495 675
Non-core/turnover 1.2% 2.3% 2.4% 1.4% 1.5% 1.5% Source: Ministry of Finance
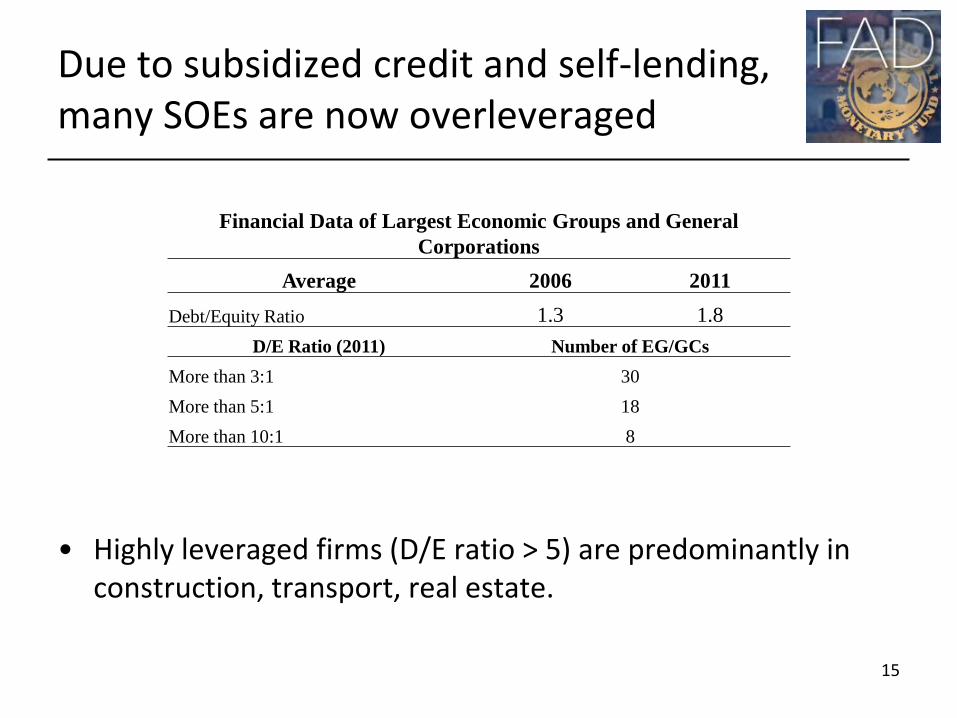
Due to subsidized credit and self-lending, many SOEs are now overleveraged
• Highly leveraged firms (D/E ratio > 5) are predominantly in construction, transport, real estate.
15
Financial Data of Largest Economic Groups and General Corporations
Average 2006 2011 Debt/Equity Ratio 1.3 1.8
D/E Ratio (2011) Number of EG/GCs More than 3:1 30 More than 5:1 18 More than 10:1 8

Overinvestment has resulted in low capital productivity at larger SOEs.
16
0.00
0.50
1.00
1.50
2.00
2.50
3.00
3.50
2000 2001 2002 2003 2004 2005 2006 2007 2008 2009 2010
Mar
gina
l Pro
duct
ivit
y of
Cap
ital
Marginal Productivity of Capital by Ownership
SOEs Private domestic Private foreign
Capital should be reallocated to the private sector • Production functions were estimated for each sector
based on total labor, fixed assets and turnover
• Capital is now approximately 30% more productive in the private sector than the public sector
• Almost 18 percent of fixed assets should therefore be reallocated to the private sector – This would produce increase total output by about 1.2
percent.
• This is clearly a rough calculation, but it gives an idea of the extent of the restructuring needed.
17

SOEs have privileged access to markets as well as inputs • Competition is often limited
– To offset trade liberalization, Government also created sectoral conglomerates (e.g., textiles, rubber, chemicals)
– Some SOEs are in areas with “natural monopolies” (e.g., utilities) or are protected due to “national interest” (e.g., extractive industries)
• Restricted competition produces high profits, but…
• Monopolization can raise prices and does not promote efficient production and innovation
18
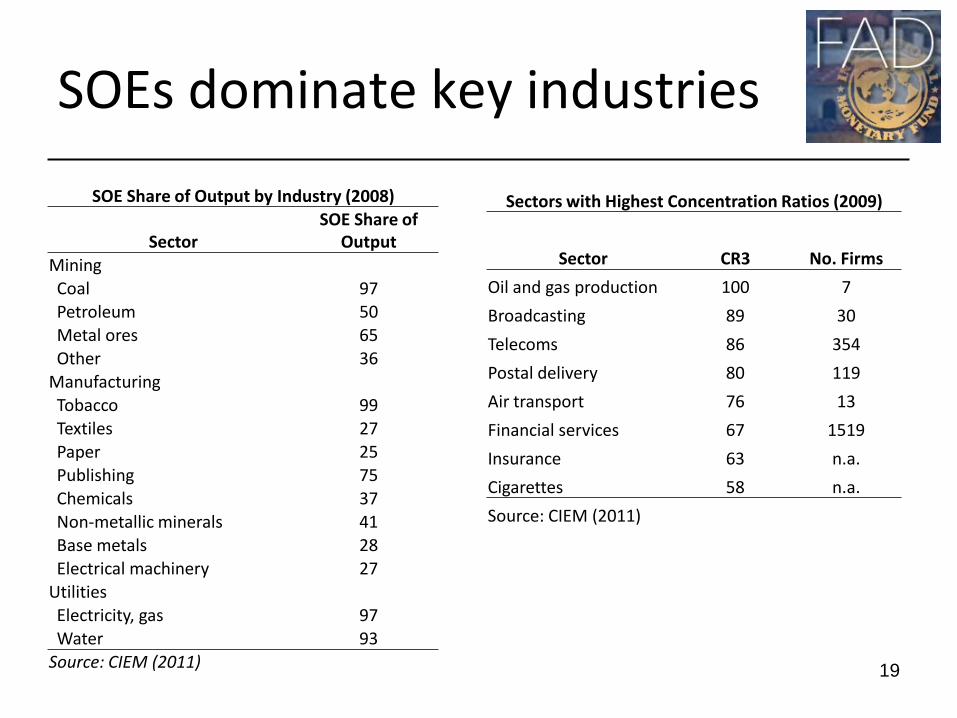
SOEs dominate key industries
19
SOE Share of Output by Industry (2008)
Sector SOE Share of
Output Mining Coal 97 Petroleum 50 Metal ores 65 Other 36
Manufacturing Tobacco 99 Textiles 27 Paper 25 Publishing 75 Chemicals 37 Non-metallic minerals 41 Base metals 28 Electrical machinery 27
Utilities Electricity, gas 97 Water 93
Source: CIEM (2011)
Sectors with Highest Concentration Ratios (2009)
Sector CR3 No. Firms
Oil and gas production 100 7
Broadcasting 89 30
Telecoms 86 354
Postal delivery 80 119
Air transport 76 13
Financial services 67 1519
Insurance 63 n.a.
Cigarettes 58 n.a.
Source: CIEM (2011)
SOEs have closer relationships with government • Access to public contracts
– SOEs dominate utilities, transport, construction, infrastructure markets
– Private firms are “crowded out” by SOEs in some regions (Thang and Freeman, 2009)
• Corruption – Corruption limits private industry growth in some regions,
but not SOE growth (Nguyen and Van Dijk, 2012)
• Variation in business climate across regions suggests that design of fiscal federalism should be improved.
20
For some SOEs, social objectives undermine solvency • For example: EVN
– Government’s goal of providing affordable energy throughout country produced losses.
– Addressed in recent restructuring plan
• SOEs making chronic losses due to social objectives should be incorporated into general government accounts. – They are really taxpayer-funded, not commercial enterprises
• Or, government may want to seek technical assistance to rationalize these industries.
21
In general, SOE corporate governance is weak
2012 SOE Reform Plan
• Unclear, overlapping lines of state authority
• No clear division between ownership and regulation responsibilities of state
• Lack of adequate oversight of SOE managers, investment plans
• Inadequate internal and external financial reporting
22
Weak corporate governance (cont’.d) Further issues not mentioned in SOE Reform Plan: • Unusually, SOE are not required to remit profits to the
Treasury. – Capital user fees abolished 2002
• This weakens financial discipline and encourages inefficient (re)investment.
• It also gives SOEs an advantage over private sector firms, which must produce a market return on equity for owners.
23
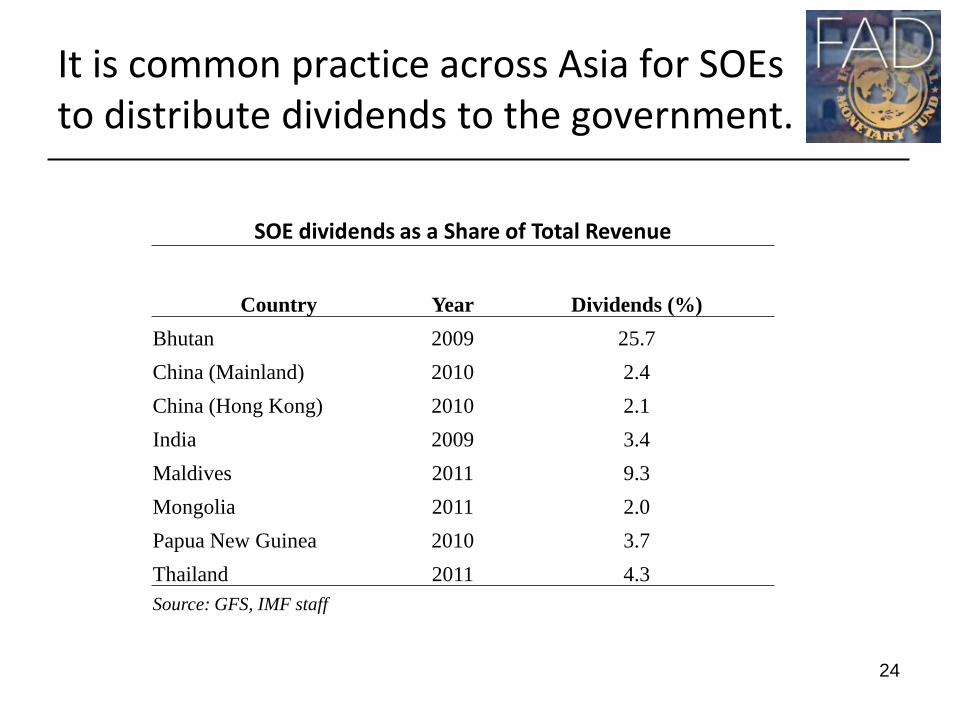
It is common practice across Asia for SOEs to distribute dividends to the government.
24
SOE dividends as a Share of Total Revenue
Country Year Dividends (%) Bhutan 2009 25.7 China (Mainland) 2010 2.4 China (Hong Kong) 2010 2.1 India 2009 3.4 Maldives 2011 9.3 Mongolia 2011 2.0 Papua New Guinea 2010 3.7 Thailand 2011 4.3 Source: GFS, IMF staff
SOE financial problems have created significant fiscal risks
• Publicly guaranteed debt related to SOEs is about 15% of GDP (2011) – This debt is already reflected in PPG debt level, but cost of
financing could rise if SOEs default
• Can non-guaranteed SOE debt also become a public liability? – E.g., Government’s guarantee of $2.2 billion of Vinashin’s
restructured debt
– Total SOE debt (2011): 51% of GDP
25
Other sources of fiscal risk from SOEs include: • Labor redundancies
– In previous restructurings, average redundancy rate of inefficient firms was 13% of workforce (CIEM, 2005)
• Capital losses – In restructuring SOEs, government will have to realize
losses and/or impose “haircuts” on creditors
• Tax collections – As government becomes more dependent on private firms
for revenue, compliance rates may fall
26
Recommendation: Improve transparency and accountability • Quantify fiscal risks from SOEs and SOE
restructuring
• Rationalize public service fees
• Publish annual financial statements – Ultimately, SOEs belong to taxpayers, who have
a right to see their finances
– Aggregate data can conceal significant losses as well as excessive profits
27
Recommendation: Create a level playing field for private enterprise 1. End subsidized credit for SOEs
2. Require profitable SOEs to pay dividends to the state
3. Deconcentrate state-dominated industries
4. Reform public investment procurement process
5. Reform system of fiscal federalism
28
Recommendations: Promote efficient SOE restructuring • Government plan has many sound measures
– Clarify and strengthen government oversight
– Spin off non-core assets
– Improve accounting and controls
– Improve and enforce the bankruptcy code
• Additional measures: – Establish resident expert committee on equitization
– Clarify legal treatment of SOE losses
– Consider broader equitization than provided for in SOE restructuring plan
29
Recommendations: Promote efficient SOE restructuring • Government plan classifies SOEs into 3 groups:
– 100% state owned (defense, infrastructure, power, publishing) (40%)
– Majority state owned equitized firms (mining, communication, finance, transport, health) (50%)
– Chronic loss-making firms for consolidation or liquidation (10%)
• Relative to other countries’ privatization efforts, Vietnam’s has been relatively cautious. – Large share in SOEs retained by government
– Participation of outsiders, takeover threat thought to be critical to promoting efficiency.
30
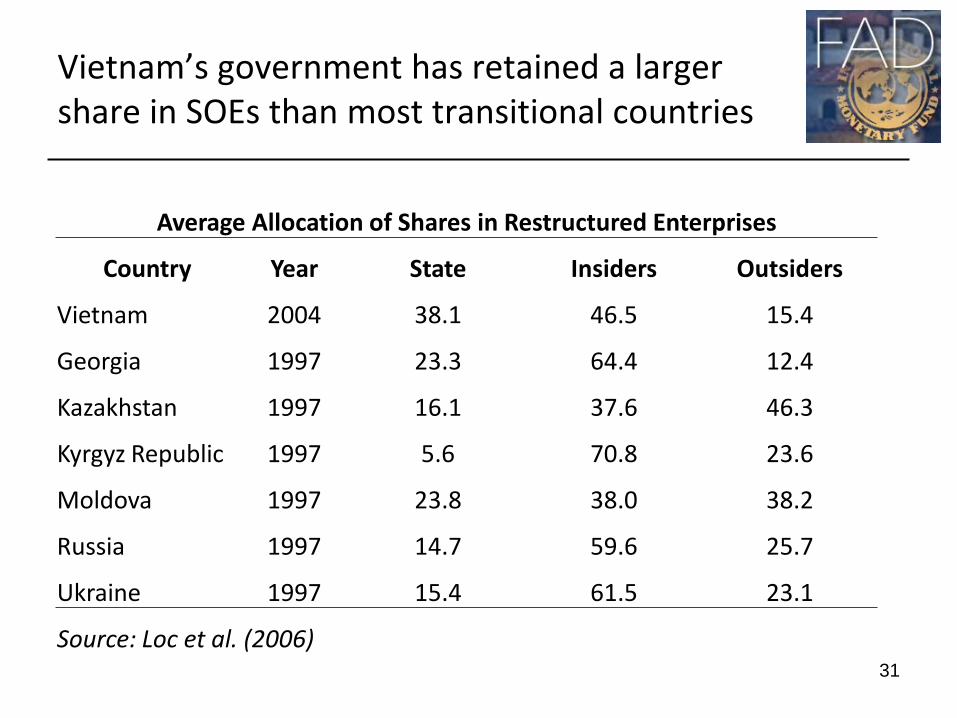
Vietnam’s government has retained a larger share in SOEs than most transitional countries
31
Average Allocation of Shares in Restructured Enterprises
Country Year State Insiders Outsiders
Vietnam 2004 38.1 46.5 15.4
Georgia 1997 23.3 64.4 12.4
Kazakhstan 1997 16.1 37.6 46.3
Kyrgyz Republic 1997 5.6 70.8 23.6
Moldova 1997 23.8 38.0 38.2
Russia 1997 14.7 59.6 25.7
Ukraine 1997 15.4 61.5 23.1
Source: Loc et al. (2006)
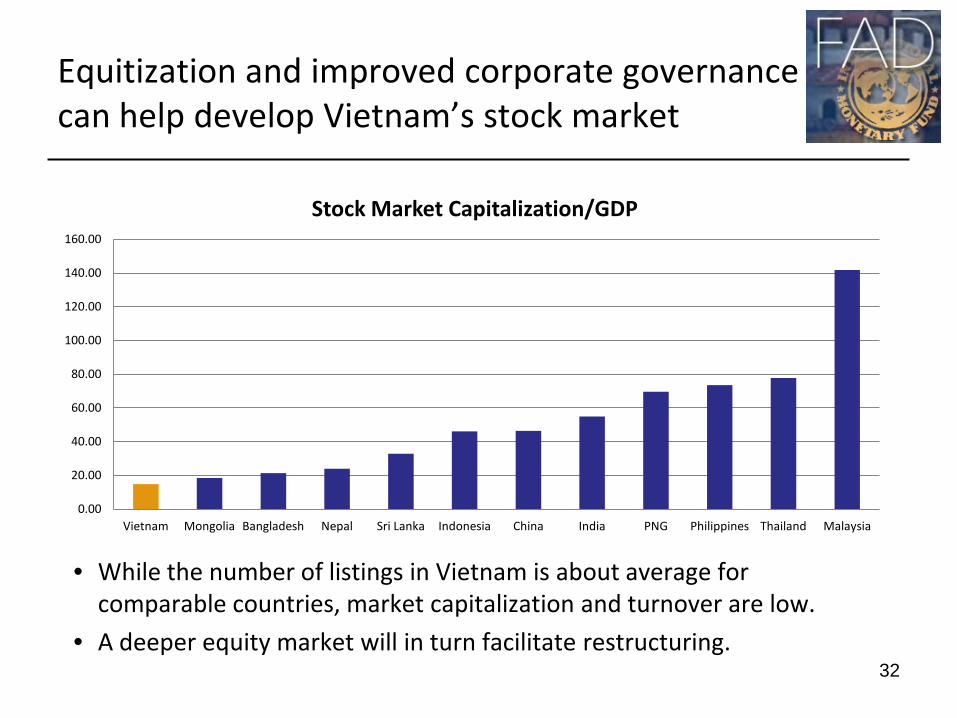
Equitization and improved corporate governance can help develop Vietnam’s stock market
• While the number of listings in Vietnam is about average for comparable countries, market capitalization and turnover are low.
• A deeper equity market will in turn facilitate restructuring. 32
0.00
20.00
40.00
60.00
80.00
100.00
120.00
140.00
160.00
Vietnam Mongolia Bangladesh Nepal Sri Lanka Indonesia China India PNG Philippines Thailand Malaysia
Stock Market Capitalization/GDP