reform, and gender differences in poverty and well-being ... · neha kumar and agnes r. quisumbing...
TRANSCRIPT

The Chronic Poverty Research Centre
(CPRC) is an international partnership of universities,
research institutes and NGOs, with the central aim of creating knowledge that contributes to both the speed and quality of
poverty reduction, and a focus on assisting those who are
trapped in poverty, particularly in sub-Saharan Africa and
South Asia.
Partners:
Bangladesh Institute of Development Studies (BIDS),
Bangladesh
Development Initiatives, UK
Development Research and Training, Uganda
Economic Policy Research Center, Uganda
HelpAge International, UK
Indian Institute of Public Administration, India
IED Afrique, Senegal
Institute of Development Studies, UK
Overseas Development Institute, UK
Programme for Land and Agrarian Studies, South Africa
University of Legon, Ghana
University of Manchester, UK
University of Sussex, UK
Inheritance, Legal
Reform, and Gender
Differences in Poverty
and Well-Being in Rural
Ethiopia
Neha Kumar
Agnes R. Quisumbing
Paper presented at the CRPC/ ODI Roundtable
‘Inheritance and the Intergenerational Transmission
of Poverty’, ODI, London, 11 October 2010.
First draft, for comment (please do not site without permission)
Chronic Poverty Research Centre
October 2010
This document is an output from Chronic Poverty Research Centre (CPRC) which is funded by UKaid from the UK Department for International Development (DFID) for the benefit of developing countries. The views expressed are not necessarily those of DFID. The CPRC gratefully acknowledges DFID’s support.

1
Inheritance, Legal Reform, and Gender Differences in Poverty and Well-Being in
Rural Ethiopia
Neha Kumar and Agnes R. Quisumbing
First draft for review
Not for citation
September 10, 2010
1. Introduction Ethiopia is one of the poorest countries in the world and is striving to provide for its chronically food insecure people. The country is characterized by substantial ethnic and religious diversity; there are over 85 ethnic groups and most major world religions are represented, as well as animist belief systems (Webb, von Braun, and Yohannes 1992). This diversity extends beyond the people and culture of Ethiopia to their environment, since the agroecological zones and farming systems vary dramatically around the country. There is also considerable diversity in gender norms related to property ownership, inheritance, and the division of assets after divorce, with men favored in the majority of cases (Fafchamps and Quisumbing 2002). Such gender disparities have important welfare consequences. Fafchamps et al. (2009) find that, in Ethiopia, the relative nutrition of spouses is associated with correlates of bargaining power, such as cognitive ability, independent sources of income, and devolution of assets upon divorce, and that several dimensions of female empowerment benefit the nutrition and education level of children. Studies have shown that gender sensitive interventions are effective at improving women’s status (Hoddinott and Adam (1998). The Ethiopian government has recently passed legislation and reformed its constitution in an attempt to reduce gender discrimination. Some important examples are the land registration process and the new Family Law, passed in 2000. The Land Registration process led to joint certification of husbands and wives, giving stronger land rights to women, while the Family Law gave equal rights to women and men in terms of marriage, inheritance and property. These recent reforms, combined with a recently available round of the Ethiopian Rural Household Survey, enables us to examine the long-term impact of asset inheritance (of men and women) on the well-being of women, as well as to analyze whether changes in legislation that strengthen women’s property rights are associated with changes in attitudes reflecting greater bargaining power within the household and better household well-being outcomes. Why focus on inheritance as a determinant of well-being? Inheritance systems and practices embody ways in which wealth is transferred from one generation to the next. Unlike common perceptions that inheritance occurs only upon the death of a parent, taking the form of a bequest, the transfer of wealth from the older to the younger generation can occur at critical points over the life-cycle, including the formation of new households, usually at the time of marriage, and the devolution of property at the time of a person’s death. A marriage’s dissolution may also be regarded as a critical point in the lifetime as divorced or separated status can significantly affect inheritance rights and responsibilities (Cooper 2010). Similarly, the birth of children may affect decisions to be made concerning the distribution of parents’ accumulated assets, as does parents’ aging and retirement from productive working capacities. These critical points in lifetimes are the catalysts for transferring (or not) assets from one person or household to others. Whether or not women receive inheritance, the forms and the amounts of inheritance received in practice, may have profound impacts on their well-being. Agarwal (2001, 1997, cited in Cooper

2
2010) has argued that women’s ownership of land leads to improvements in women’s welfare, productivity, equality, and empowerment. Property ownership by women has been found to protect them against domestic violence. In India, for example, a house is an important asset not only because it often represents a store of value and a valuable investment, but also because it may protect a woman (and her family) from violence (Panda and Agarwal 2005). Cooper’s (2010) review of inheritance and the intergenerational transmission of poverty in Sub-Saharan Africa argues that owning assets may give women additional bargaining power not just in the household, but also in their communities and other public arenas, contributing to women’s social, economic and political empowerment. Other research has demonstrated that equal access, control and ownership of land has instrumental value in terms of its positive impact on consumption (increasing spending on food, children’s welfare and education) and productivity (particularly in areas, such as Sub- Saharan Africa, where women are responsible for the majority of land cultivation) (Bird et al,. 2004). The gender issue in asset inheritance is important not only because of equity considerations, but also because it has important implications for the transfer of wealth to the next generation. In the face of the HIV/AIDS epidemic in Sub-Saharan Africa, a widow may be forced to leave her husband’s village upon his death and therefore will have no control over land and other assets used jointly. In some cultures, ‘widow inheritance,’ in which a woman is expected to marry the brother of the deceased, is the only way she can retain rights to her husband’s land. However, such practices place women at even greater risk of acquiring the disease (Drimie 2003; Strickland 2004; Gillespie and Kadiyala 2005). Increasing evidence has also shown that assets controlled by women often result in increased investments in the next generation’s health, nutrition, and schooling (Quisumbing and Maluccio 2003; Smith et al. 2003). Preventing the intergenerational transmission of poverty may therefore involve a two-pronged solution of making opportunities to acquire and transfer assets more equitable across households, as well as reducing inequality in the control of resources within the household (Quisumbing 2009).
This paper attempts to make a contribution to this literature using new panel data from Ethiopia. It examines the role of men’s and women’s asset inheritance on the poverty and well-being of women and explores the potential impact of recent legislation strengthening women’s property rights on household and individual well-being. It investigates the following issues: (1) What is the long term impact of gender differentials in inheritance on household consumption, poverty and food security? (2) Are there significant differences in poverty and well-being between male- and female-headed households, as well as female spouses in male-headed households, controlling for individual and household characteristics, including individually inherited assets? (3) Do changes in the perceptions of allocation of assets upon divorce, resulting from changes in legislation, affect the above mentioned outcomes? And (4) What is the role of legal reform and awareness of legal reform in promoting intrahousehold equity in outcomes and mitigating the intergenerational transmission of poverty? The objective of this study is to examine the long term impact of gender differentials in inheritance on household consumption, poverty, and food security. We hypothesize that households with lower levels of inherited assets have worse consumption, food security, and poverty outcomes. Because women tend to inherit much less than men in rural Ethiopia, we can examine the differential impact of men’s and women’s inherited assets on these outcomes. We would also like to investigate whether gender differentials in inheritance have implications for long term happiness and wellbeing among men and women, women’s participation in village life, and participation in household decision making. We propose to examine the effect of any

3
inheritance or the amount of inheritance, testing a model in which inheritance is modeled as a discrete variable versus one in which we allow the amount of inheritance to be a continuous variable. Such an analysis will help distinguish between the effect of the quantity of assets inherited and the mere effect of any amount inherited. We would also like to perform a parallel analysis of how changes in the perceptions of allocation of assets upon divorce affect the above mentioned outcomes, taking advantage of data collected before (1997) and after the passing of the Family Law (2009). If a woman perceives a favorable allocation of assets upon a divorce it potentially increases her bargaining power within the marriage and therefore leads to better outcomes in the long term. 2. Data We use data from the 1997, 2004, and 2009 rounds of the Ethiopian Rural Household Survey (ERHS) for this study. The data collection was coordinated by the Economics Department at Addis Ababa University in collaboration with the Centre for the Study of African Economies at Oxford University and the International Food Policy Research Institute. The ERHS is a longitudinal dataset which covers approximately 1300 households in 15 villages all across Ethiopia. Although the 15 villages included in the sample are not statistically representative of rural Ethiopia, they are quite diverse and include all major agroecological, ethnic, and religious groups. The location of the sample villages is shown in figure 1. About a third (32 %) of sample households are female headed, although there is wide variation across the survey villages (Figure 2). The highest rates of female headship are found in the two Tigray sites (Haresaw and Geblen) and the lowest in Yetmen.
These data are well suited to address the research questions outlined above. Apart from standard socioeconomic characteristics of the household, the 1997 round has information on assets inherited, pre-marriage assets, gifts at marriage disaggregated by gender and allocation of assets upon divorce and death. These data were used to construct the main variables of interest such as: whether or not the wife inherited any assets, total value of assets inherited, reported separately for husband and wife. The data from the more recent rounds were used to construct and compare the outcomes of interest- i.e. consumption, perceptions of happiness, etc. The ERHS 2009 also contains information on changes in perceptions regarding the distribution of assets after divorce, owing to the new Family Law. We explore whether changes in perceptions owing to legal reform are associated with improvements in bargaining power and household and individual well-being. Both of us were involved in the design of key modules fielded in the 2009 survey, the first author was extensively involved in pretesting and fieldwork for the 2009 survey round and the second author, for the 1997 round.
The surveys collected information on household demographic characteristics, occupation, cropping patterns, perceptions of poverty and wellbeing, experience with shocks, access to credit, etc. We present, in Table 1, some of the summary statistics for our sample disaggregated by the gender of the household head. Female-headed households differ significantly from their male counterparts across a number of dimensions. Female heads are, on average, older and less educated than male heads; female heads on average have no education whereas their male counterparts have at least 2 years of schooling. The gender disparity in schooling is not only limited to the education of the head but is also true for the household at large: the highest education level within a female headed household is 4.76 years, which is about a year and half less than that in male headed households. Female-headed households also tend to be smaller, with a larger fraction of female members. Because household size is proportional to the amount of labor resources the household controls in a rural area and because many farm operations (especially plowing) are intensive in male labor, female headed households are at a disadvantage with respect to labor endowments.

4
Female headed households are also worse off compared to their male counterparts in terms of land and asset ownership. Male-headed households own 2.2 hectares of land, on average, compared to 1.7 hectares for female-headed households. Male-headed households also have 9.4 tropical livestock units (TLUs), which is significantly different from female-headed households’ holdings, of 8.8 TLUs. Sixty percent of male headed households are much more likely to have at least some oxen compared to 37 percent of female headed households.
In terms of real per capita consumption, however, there is no significant difference between male- and female-headed households (Table 1). Real per capita consumption of male-headed households in 2004 was 91 birr, and that of female-headed households, 94 birr, but these are not statistically significant.1 We construct a measure that indicates the proportion of years the consumption of the household fell below average. Table 1 shows that female and male headed households alike experience shortfalls in consumption about 40 per cent of the time. Upon closer analysis, the slight advantage of female headed households in consumption may have come at the cost of slower asset accumulation. Figure 3 presents data on asset holdings, real per capita consumption, and whether or not a household was poor from the previous six rounds of the ERHS, disaggregated by the gender of the household head. Figure 3 shows that, although the female headed households’ real per capita consumption was about the same and even surpassed that of the male headed households in the last two rounds, their asset levels were always below their male counterparts. Maintaining consumption levels may have come at the cost of asset accumulation; if female-headed households disposed of assets in order to guarantee consumption, they may be at risk of falling into an asset poverty trap, which may make it more difficult to move out of poverty in the long run.
Next we move on to measures of social capital, namely network size and membership in an iddir (burial societies or funeral associations). In the survey, we ask the respondents to count the number of people that they can rely on in times of need. This is what we call network size. Table 1 shows that male headed households on average have larger networks, and that male headed households are more likely to be members of iddir. In terms of access to financial institutions and credit, the proportion of households holding a bank account is quite small (about 5%) and is not substantially different for the two groups. However, male headed households have access to a greater number of sources from which they can borrow.
Table 2 presents and describes the outcome variables of interest. As mentioned earlier, we are interested in examining the impact of inheritance on food security, poverty and perceptions of happiness and wellbeing among women. We measure food security by the food gap which is defined as the number of months in which the household faced difficulty in satisfying its food needs. As seen from table 3, female headed households are more likely to be food insecure compared to their male counterparts. Self reported poverty is also higher among female headed households as is the inadequacy of food consumption in the last month prior to the survey. In the survey, we asked women (female heads and spouse of male heads) about their life, whether they had rights and how much they felt they were in control of their life. Possible responses ranged from 1 to 9, where 1 was the worst possible situation and 9 the best. The summary statistics for these variables (Table 3) show that on average female heads and spouses of male heads are not too far apart but female heads’ perceptions are worse than those of wives in male headed households.
1 Consumption aggregates for the 2009 round are still being computed, so we report the most recent
available consumption data (2004).

5
In the 2009 survey, we asked questions regarding participation in village life, elections and membership in various groups. Average responses for these questions are very similar across female and male headed households (Table 3). Participation in village life is low with 20-25 percent of the women attending village meetings, having membership in women’s associations or the village council. However, a significant fraction (more than 70 percent) of them votes in elections. The only variable that is significantly different across household types is the attendance at information meetings during the land registration process. Female heads are 10 percentage points more likely to attend these meetings than spouses of male heads. This seems quite reasonable because in the male headed households, the husbands would attend these meetings.
An interesting module was introduced in 2004 which asked questions relating to life aspirations and power to change one’s life. From table 3, it is clear that although female heads feel that they have more power to change their life compared to spouses of male heads, they are less satisfied with their life compared to spouses of male heads. These summary statistics indicate that female heads experience lives that are substantially different from spouses of male heads. Although female heads have more power to take decisions, they do not have sufficient means and assets; consequently, they end up with worse outcomes than wives in male-headed households. Inheritance is one of the major forms of acquiring assets and therefore can lead to differences in lifetime outcomes. An objective of this paper is to examine the long term impact of inheritance on poverty, wellbeing and happiness.
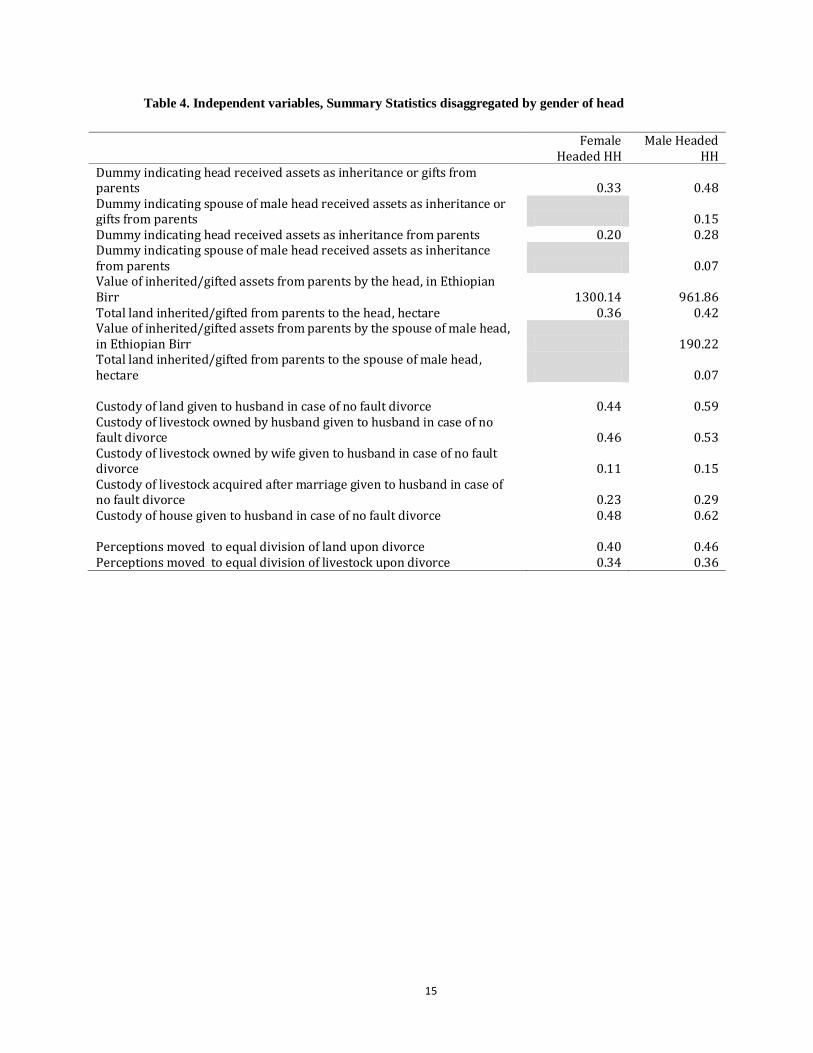
In the 1997 round of the ERHS, we collected information on whether the head and the spouse received any assets or land as inheritance or gift from their parents. We also have the total value of assets received and the total land inherited, in hectares. Table 4 gives the summary statistics for the fraction of heads that received inheritance or gifts, the total value of these assets and the total amount of land (in hectares) inherited, disaggregated by the gender of the household head and correspondingly for the spouse of male heads. Male heads are more likely to receive inheritance or gifts from their parents and larger plots of land on average than their female counterparts. Forty-eight percent of male household heads received gifts or inherited assets from their parents, compared to only 33 percent of female heads. However, the total value of assets inherited or received as gifts was larger for female heads (1300 birr) as compared to male heads (962 birr), which may be due to outliers (and which may be indicative of the endogeneity of female headship, if wealthier women are more likely to leave marriages). In contrast, only 15 percent of the spouses of male heads received assets as inheritance or gifts, and the total value of inherited assets among spouse of male heads was also quite small, at 190 birr.
Division of assets upon divorce can affect bargaining power within the household. In 1997, we asked female heads and spouse of male heads about how they perceive assets would be divided in case of a divorce when neither the husband nor the wives were at fault. We use these responses to construct a variable that indicates whether the assets would be given to the husband. These perceptions are also summarized in Table 4. Spouses of male heads are much more likely to perceive that assets would be given to the husband upon a no fault divorce. This perception reflects the prevailing practice that, upon divorce, assets tend to devolve to whoever controlled the assets over the duration of the marriage, typically the head of the household (the husband in a male-headed household) (Fafchamps and Quisumbing 2002).
In 2000, the passage of the New Family Law in Ethiopia gave equal rights to men and women. According to this new law, all assets were to be divided equally between the husband and wife upon a divorce. Although this law was not enforced in all regions equally, we can measure changes in

6
perception about the division of assets upon divorce between 1997 and 2009. On average, 34 to 40 (36 to 46) percent of female heads’ (spouses of male heads’) perception about division of land and livestock upon divorce moved towards equal division between husband and wife, albeit with substantial regional variation. The greatest changes in perceptions occurred in those regions with the least equitable distribution between husband and wife. For example, in Tigray, the fraction of households that moved towards a more equal distribution of assets is relatively small, about 14%, primarily because, to begin with, the local norms regarding the distribution of assets after divorce were already more equal in Tigray. In 1997, about forty percent of households (40%) in Tigray reported that land is allocated equally between the couple upon a no fault divorce. On the other end of the spectrum lies SNNPR, where almost two-thirds of the households changed their response towards a more equal allocation. This is also due to initial conditions: a very small proportion of households reported equal division in 1997. These statistics show that not only did the greatest changes towards more equal allocations occur in the regions where the distribution was most unequal, but there was improvement even in the regions with relatively gender-fair post-divorce allocations (Kumar and Quisumbing 2010).
In the next section we examine the impact of inheritance and perception of division of assets upon divorce on food security, poverty, happiness and wellbeing among women.
3. Results
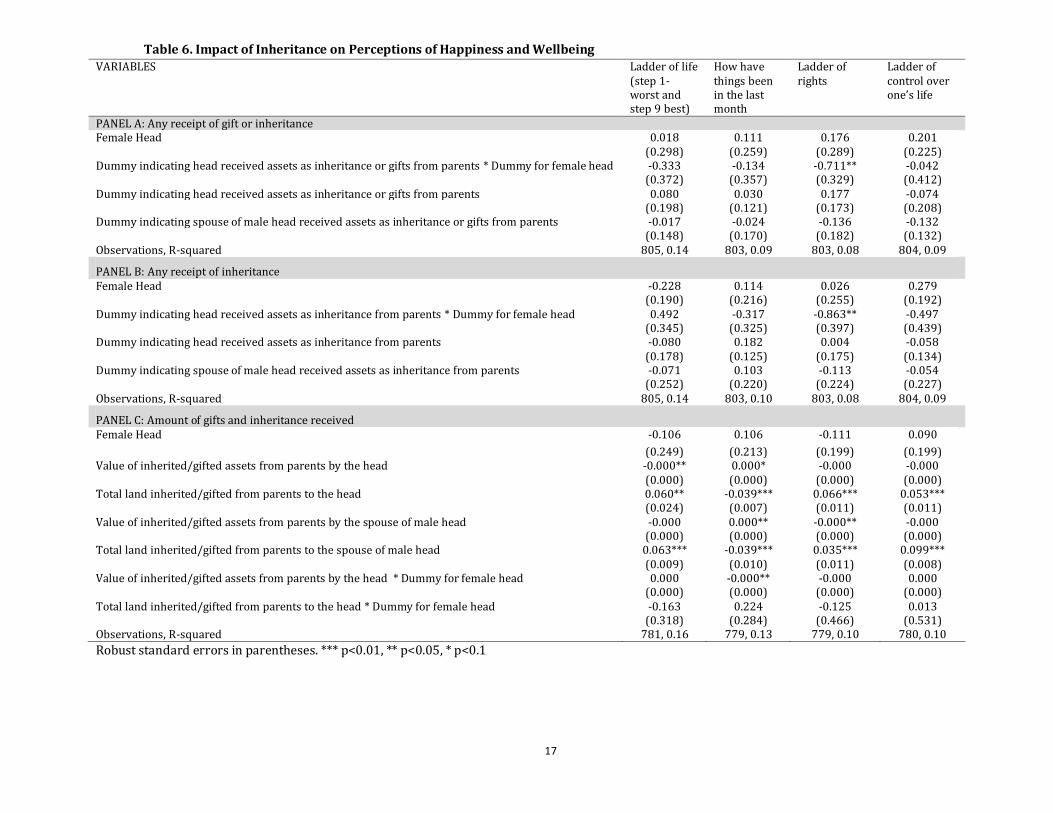
3.1 Inheritance Table 5 gives the regression results for the impact of inheritance on food security and poverty. The top two panels of the table report the impact of whether the woman receives any gift or inheritance (Panel A), or any inheritance (Panel B). As can be seen from the top two panels of the table, whether or not a woman receives inheritance has no significant impact on food security or poverty. It is the total value of assets and land that is received as inheritance that matters (Panel C). Total land inherited by the head and by the spouse of the head decreases the likelihood that the women report that the household is poor or has less than adequate expenditure on food, housing and health care. Controlling for the value of inheritance received, female headed households in general have worse outcomes, although the dummy for female-headed household is not always significant. Inheritance is especially important for female headed households: those female headed households that received more assets and land are less likely to report less than adequate food consumption as seen by the negative and significant coefficient on the interaction terms between female headship and the value of inheritance in panel C. Table 6 presents the impact of inheritance on outcomes such as the step on the ladder of life, rights and control over one’s life and how things have been going in general. Note that the direction of improvement for this last outcome is the reverse of the others. This means that negative coefficients in the second column of Table 6 imply positive effects. We find a surprising result which shows that female headed households in which the head received assets as inheritance or gifts are less likely to be on a higher step on the ladder of rights. This negative effect loses significance when we use the total value of assets as the independent variable. The total area of land always has a positive effect on all these outcomes, regardless of whether land is inherited by the head or by the spouse. This highlights the importance of land as a productive asset in Ethiopia’s agrarian economy.

7
Table 7 shows regression results for participation in village life. We find that female heads are 14 to 17 percentage points more likely to attend village assemblies, 11 percentage points more likely to vote in elections but, despite higher political participation, 3 percentage points less likely to hold a leadership position as compared with spouses of male heads. The greater the area of land inherited by the head in a female headed household, the less likely they are to attend village assemblies or to be members of women’s associations or village councils. One reason underlying this finding could be that women who own larger areas of land have higher opportunity costs of participating in village activities, owing to the need to work on their own farms. This time pressure would be a greater constraint in labor-constrained female headed households compared with male headed households. Tables 8 and 9 show the impacts of inheritance practices on perceptions of trustworthiness, power and happiness among women. Perceptions of trustworthiness are strikingly different between female heads and spouses of male heads. Spouses of male heads who inherit a greater amount of land are more likely to be trusting of others but the opposite is true for female heads. Perhaps a single woman who possesses significant amount of assets is justifiably wary of others. Total land inherited by the head or the spouse of male head has positive and significant coefficients in the power regressions. Panel A in table 9 shows that receipt of assets as inheritance or gifts by the head has negative implications for the quality of life of the spouse. In contrast, the coefficient on interaction of the female head dummy and the dummy variable indicating that the head received inheritance or gifts is positive and significant in the last column. This implies that receipt of inheritance by female heads has a long term positive effect on the quality of their life. The total amount of land inherited by the spouse of the male head also positively affects her quality of life.
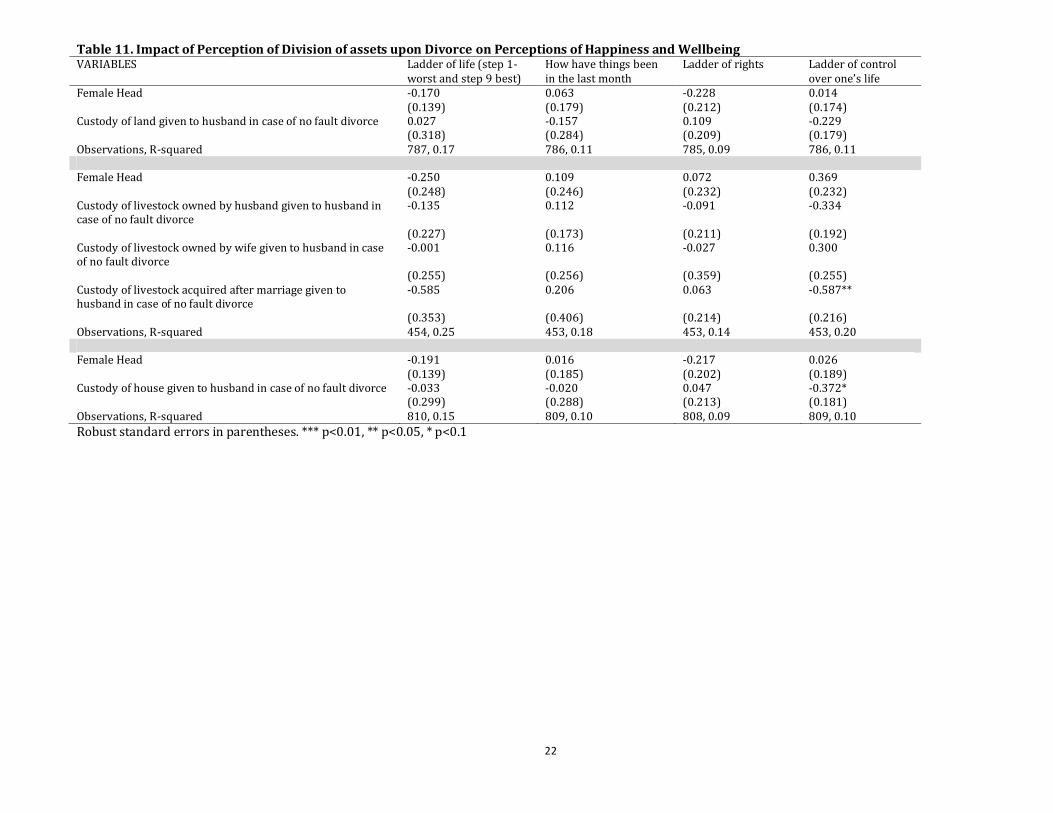
3.2 Perception of Division of Assets upon Divorce In this section we examine the impact of perceptions of division of assets upon divorce in 1997 on outcomes in 2009. Table 10 gives the regression results for food security and poverty which give some evidence for the negative impact of gender differentials in asset division upon divorce. We find that when women perceive that all land must be given to the husband in case of a divorce they are more likely to report that their households have less than adequate expenditure on housing and health care. Similar results are observed when women perceive all livestock and the house to be given to the husband when a divorce occurs. Table 11 has regression results for perceptions of happiness and wellbeing and we do not find much impact on these outcomes. We only find one significant coefficient, which shows that the woman is half a step lower on the ladder of control over one’s life when the husband is perceived to be receiving livestock upon a divorce. Table 12 shows the regression results for participation in village life. We find that women who perceive that husbands would get all the land and the house upon a divorce are also more likely to speak up or raise issues at village assemblies, possibly because they feel they have legitimate grievances that they need to air. In regressions for perceptions of trustworthiness, power and happiness (Tables 13 and 14) we find that, where significant, gender differentials in asset division upon divorce have negative impacts on these outcomes. That is, where the husband stands to retain greater control over assets upon divorce, wives report lower perceptions of trust, power, and happiness.

8
3.3 Changes in Perception of Division of Assets upon Divorce and the New Family Law The last decade witnessed the advent of gender-sensitive reforms in Ethiopia. One of these was the passing of the new Family Law in 2000, which gave equal rights to men and women. It also required equal division of all assets between the husband and wife upon divorce. In previous work (Kumar and Quisumbing 2010) we found that there is a trend towards equal division of assets between the husband and the wife, with the exception of children, who tend to stay with the wife. This change is probably driven by the changes in the family law that occurred in 2001, and is observed throughout the sample, albeit with some regional variation.
The land registration process that has been going on in Ethiopia for several years has also improved the status of women. The land registration required that the land be registered in the name of both spouses. This process required the setting up of land administration committees at the village level. We find in our previous work that the presence of women members in these committees has a positive impact on shifting perceptions towards equal division of assets upon divorce. This effect is robust to inclusion of village fixed effects, which implies that even after controlling for local norms regarding the distribution of assets upon divorce, the presence of females in an important village-level committee may provide support to women and also may be a source of information regarding the new family code. This shows that these two reforms, both gender sensitive, complement each other.
Tables 15 and 16 present results from the regressions to measure the effect of change of perceptions towards equal division of assets upon divorce. As can be seen from the results, there is practically no effect on outcomes even if perceptions concerning division of assets upon divorce have changed. It is possible that there is a lag in the impact of changes in perceptions of the division of assets upon divorce on measures of well-being. This emphasizes the importance of baseline perceptions and asset holdings on long term food security, happiness and wellbeing.
Discussion
The preceding analysis stresses the point that it is not whether women receive inheritance but the amounts of inheritance received that have profound impacts on their well-being. Our regressions suggest that whether or not a woman received inheritance has an insignificant impact on a number of consumption and food security outcomes, but that the value of assets inherited and the area of land inherited were significant. In particular, land is an important factor in determining the long term wellbeing among women. Female headed households that have been shown to be worse off compared to their male counterparts are also benefited by inheritances in the long term. These findings are significant from a policy perspective. It is not enough to guarantee that women can inherit property, but that they have rights to inherit equally with men. Islamic law, for example, stipulates that a woman will inherit half the share of her brother. Thus, while there is a marginal improvement over societies in which women do not inherit land at all, the actual amounts inherited by women are still much smaller than those inherited by men. Perceptions of division of assets upon divorce have important long term implications which are not easily changed by changes in these perceptions over time. Gender differentials in perception of asset division upon divorce can have implications for bargaining power within the household which
9
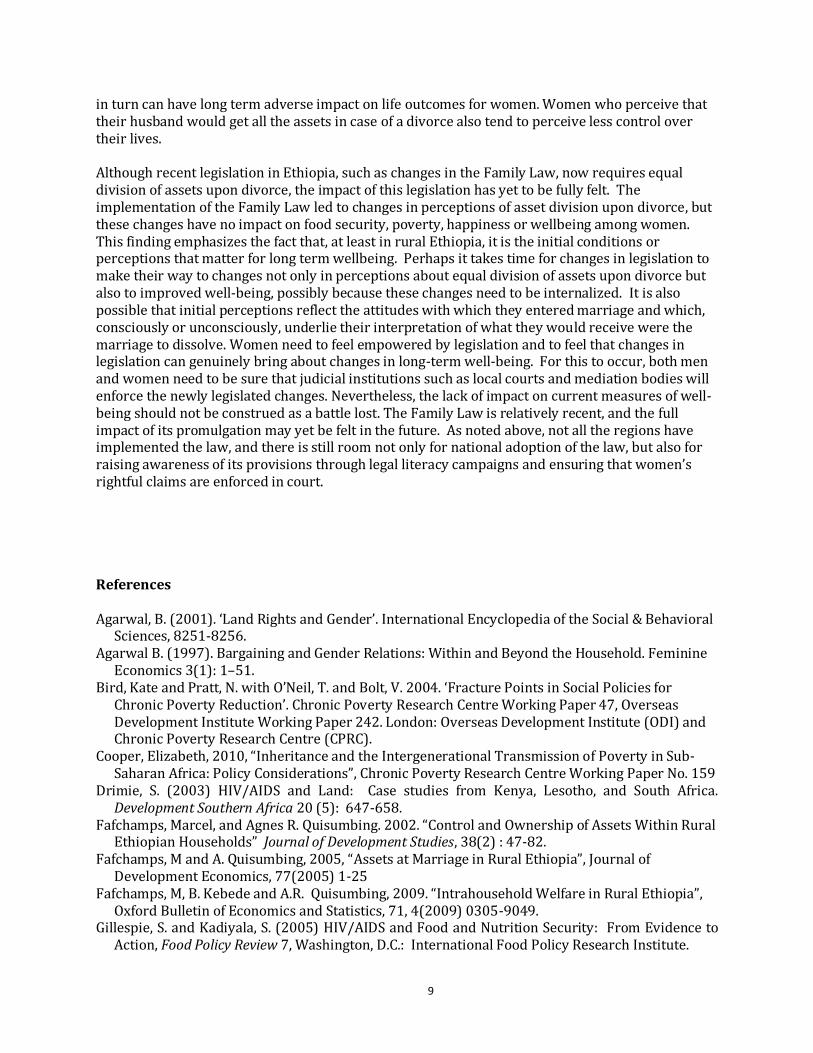
in turn can have long term adverse impact on life outcomes for women. Women who perceive that their husband would get all the assets in case of a divorce also tend to perceive less control over their lives. Although recent legislation in Ethiopia, such as changes in the Family Law, now requires equal division of assets upon divorce, the impact of this legislation has yet to be fully felt. The implementation of the Family Law led to changes in perceptions of asset division upon divorce, but these changes have no impact on food security, poverty, happiness or wellbeing among women. This finding emphasizes the fact that, at least in rural Ethiopia, it is the initial conditions or perceptions that matter for long term wellbeing. Perhaps it takes time for changes in legislation to make their way to changes not only in perceptions about equal division of assets upon divorce but also to improved well-being, possibly because these changes need to be internalized. It is also possible that initial perceptions reflect the attitudes with which they entered marriage and which, consciously or unconsciously, underlie their interpretation of what they would receive were the marriage to dissolve. Women need to feel empowered by legislation and to feel that changes in legislation can genuinely bring about changes in long-term well-being. For this to occur, both men and women need to be sure that judicial institutions such as local courts and mediation bodies will enforce the newly legislated changes. Nevertheless, the lack of impact on current measures of well-being should not be construed as a battle lost. The Family Law is relatively recent, and the full impact of its promulgation may yet be felt in the future. As noted above, not all the regions have implemented the law, and there is still room not only for national adoption of the law, but also for raising awareness of its provisions through legal literacy campaigns and ensuring that women’s rightful claims are enforced in court.
References Agarwal, B. (2001). ‘Land Rights and Gender’. International Encyclopedia of the Social & Behavioral
Sciences, 8251-8256. Agarwal B. (1997). Bargaining and Gender Relations: Within and Beyond the Household. Feminine
Economics 3(1): 1–51. Bird, Kate and Pratt, N. with O’Neil, T. and Bolt, V. 2004. ‘Fracture Points in Social Policies for
Chronic Poverty Reduction’. Chronic Poverty Research Centre Working Paper 47, Overseas Development Institute Working Paper 242. London: Overseas Development Institute (ODI) and Chronic Poverty Research Centre (CPRC).
Cooper, Elizabeth, 2010, “Inheritance and the Intergenerational Transmission of Poverty in Sub-Saharan Africa: Policy Considerations”, Chronic Poverty Research Centre Working Paper No. 159
Drimie, S. (2003) HIV/AIDS and Land: Case studies from Kenya, Lesotho, and South Africa. Development Southern Africa 20 (5): 647-658.
Fafchamps, Marcel, and Agnes R. Quisumbing. 2002. “Control and Ownership of Assets Within Rural Ethiopian Households” Journal of Development Studies, 38(2) : 47-82.
Fafchamps, M and A. Quisumbing, 2005, “Assets at Marriage in Rural Ethiopia”, Journal of Development Economics, 77(2005) 1-25
Fafchamps, M, B. Kebede and A.R. Quisumbing, 2009. “Intrahousehold Welfare in Rural Ethiopia”, Oxford Bulletin of Economics and Statistics, 71, 4(2009) 0305-9049.
Gillespie, S. and Kadiyala, S. (2005) HIV/AIDS and Food and Nutrition Security: From Evidence to Action, Food Policy Review 7, Washington, D.C.: International Food Policy Research Institute.

10
Hallman, K. (2000) Mother-father resource control, marriage payments, and girl-boy health in rural Bangladesh. Food Consumption and Nutrition Division Discussion Paper 93. International Food Policy Research Institute, Washington, D.C.
Hoddinott, J. and C. Adam, 1997. “Testing Nash Bargaining Household Models With Time Series Data: Divorce Law Reform and Female Suicide in Canada”, Economic Series Working Papers, 99191, University of Oxford.
Kumar, Neha and Agnes R. Quisumbing, 2010, “Policy Reform towards Gender Equality in Ethiopia: Little by Little the Egg Begins to Walk” (unpublished manuscript)
Panda, P. and B. Agarwal. 2005. Marital violence, human development and women’s property status in India. World Development 33(5): 823-850.
Quisumbing, Agnes R., ed. 2003. Household Decisions, Gender, and Development: A Synthesis of Recent Research. Washington, DC: International Food Policy Research Institute.
Quisumbing, A. R. 2009. Investments, bequests, and public policy: Intergenerational asset transfers and the escape from poverty. In Poverty dynamics interdisciplinary perspectives, ed. Tony Addison, David Hulme, and S. M. Ravi Kanbur. Chapter 12. Pp. 267-289. Oxford: Oxford University Press.
Quisumbing, A. R. and Maluccio, J. A. (2003) Resources at marriage and intrahousehold allocation: Evidence from Bangladesh, Ethiopia, Indonesia, and South Africa. Oxford Bulletin of Economics and Statistics 65 (3): 283–328.
Smith, L. C., Ramakrishnan, U., Haddad, L., Martorell, R., and Ndiaye, A. (2003) The Importance of Women’s Status for Child Nutrition in Developing Countries. Research Report No. 133. International Food Policy Research Institute, Washington, D.C.
Strickland, R. (2004) To have and to hold: Women’s property and inheritance rights in the context of the HIV/AIDS in Sub-Saharan Africa. International Center for Research on Women Working Paper.
Webb, P, J. von Braun, Y. Yohannes, 1992. “Famine in Ethiopia: policy implications of coping failure at national and household levels”, Research Reports 92, IFPRI

11
Tables Table 1. Descriptive Statistics by Gender of Household Head, ERHS 2009
Female headed HH
Male headed HH p-value
Age of head 54.28 52.53 **
Education of head 0.33 2.22 *** Highest grade obtained 4.76 6.28 ***
Fraction of female members in hh 0.62 0.47 ***
Fraction of dependent members in hh 0.51 0.52
Household size 4.39 6.38 ***
Total Land owned, Ha 1.73 2.20 ***
Total livestock owned, tropical units 8.82 9.39 ***
Fraction households own any oxen 0.37 0.61 ***
Per capita consumption in 2004 (birr) 94 91 Prop. of years in which consumption fell below average 0.39 0.41 Fraction of hhs that are member of an iddir 0.76 0.89 ***
Network size 8.61 11.41 ***
Fraction of hhs that have a bank account 0.05 0.06 Number of sources from which a household can borrow 1.32 1.57 ***

12
Table 2. Outcome variables of interest and their description
Outcome Description
Food gap in months Reports the number of months in the last 12 (13 Ethiopian) months they experienced problems satisfying the food needs of the household
Self reported as poor Just thinking about their household circumstances, they describe it as “Never have quite enough”, “poor” or “destitute”
Food consumption less than adequate in the last months
Family’s food consumption over the past one month, was reported as less than adequate
Housing less than adequate in the last months
Family’s housing over the past one month, was reported as less than adequate
Health care less than adequate in the last months
Family’s health care over the past one month, was reported as less than adequate
Ladder of life (step 1- worst and step 9 best)
The top of a ladder represents the best possible life for you and the bottom represents the worst possible life for you. Where on the ladder do you feel you personally stand at the present time?
How have things been in the last month
1- Going very well in every possible way 7- Going poorly in every possible way
Ladder of rights A nine-step ladder, where on the bottom, the first step, stand people who are completely without rights, and step 9, the highest step, stand those who have a lot of power. On which step are you?”
Ladder of control over one’s life A nine-step ladder, where on the bottom, the first step, are those who are totally unable to change their lives, while on step 9, the highest step, stand those who have full control over their own life. On which step are you?
Attend village assembly Whenever there is a village assembly of any kind, the respondent attends at least sometimes
Speak/raise issues at assembly Usually speak or raise issues at such meetings Vote In elections Usually vote in village, woreda or national election of any
kind Member of women’s association Dummy indicating membership in women’s association Member of village council Dummy indicating membership in village council Holds a leadership poistion in kebele/tabia
Dummy indicating whether they hold a leadership poistion in kebele/tabia administration
Attended information meetings during land registration process
Dummy indicating attendance at public information meetings (regarding the implementation of the new land proclamation) during the land registration
Most people are basically honest Agree or strongly agree that most people are basically honest
Most people can be trusted Agree or strongly agree that most people can be trusted
My life is determined by my own actions
Agree or strongly agree that my life is determined by my own actions
I have power to make decisions that change the course of my life
Agree or strongly agree that I have power to make decisions that change the course of my life
I am usually able to protect my personal interests
Agree or strongly agree that I am usually able to protect my personal interests

13
Outcome Description
In most ways my life is close to my ideal
Agree or strongly agree that in most ways my life is close to my ideal
The conditions of my life are excellent Agree or strongly agree that the conditions of my life are excellent
I am satisfied with my life Agree or strongly agree that I am satisfied with my life
So far I have gotten the important things I want in life
Agree or strongly agree that so far I have gotten the important things I want in life
If I could live my life over, I would change almost nothing
Agree or strongly agree that if I could live my life over, I would change almost nothing

14
Table 3. Outcome variables, Summary Statistics disaggregated by gender of head
Outcome Female Headed HH
Male Headed HH
Food gap in months 3.81 2.63
Self reported as poor 0.25 0.18
Food consumption less than adequate in the last months 0.42 0.34
Housing less than adequate in the last months 0.27 0.29
Health care less than adequate in the last months 0.34 0.31
Ladder of life (step 1- worst and step 9 best) 4.04 4.89
How have things been in the last month 3.99 3.51
Ladder of rights 5.55 5.81
Ladder of control over one’s life 5.09 5.59
Attend village assembly 0.61 0.58
Speak/raise issues at assembly 0.19 0.21
Vote In elections 0.75 0.72
Member of women’s association 0.24 0.25
Member of village council 0.24 0.25
Holds a leadership poistion in kebele/tabia 0.04 0.06
Attended information meetings during land registration process 0.29 0.19
Most people are basically honest 0.29 0.27
Most people can be trusted 0.26 0.25
My life is determined by my own actions 0.50 0.48
I have power to make decisions that change the course of my life 0.51 0.45
I am usually able to protect my personal interests 0.43 0.38
In most ways my life is close to my ideal 0.21 0.26
The conditions of my life are excellent 0.17 0.27
I am satisfied with my life 0.24 0.32
So far I have gotten the important things I want in life 0.19 0.24
If I could live my life over, I would change almost nothing 0.19 0.20
15
Table 4. Independent variables, Summary Statistics disaggregated by gender of head
Female Headed HH
Male Headed HH
Dummy indicating head received assets as inheritance or gifts from parents 0.33 0.48 Dummy indicating spouse of male head received assets as inheritance or gifts from parents 0.15 Dummy indicating head received assets as inheritance from parents 0.20 0.28 Dummy indicating spouse of male head received assets as inheritance from parents 0.07 Value of inherited/gifted assets from parents by the head, in Ethiopian Birr 1300.14 961.86 Total land inherited/gifted from parents to the head, hectare 0.36 0.42 Value of inherited/gifted assets from parents by the spouse of male head, in Ethiopian Birr 190.22 Total land inherited/gifted from parents to the spouse of male head, hectare 0.07 Custody of land given to husband in case of no fault divorce 0.44 0.59 Custody of livestock owned by husband given to husband in case of no fault divorce 0.46 0.53 Custody of livestock owned by wife given to husband in case of no fault divorce 0.11 0.15 Custody of livestock acquired after marriage given to husband in case of no fault divorce 0.23 0.29 Custody of house given to husband in case of no fault divorce 0.48 0.62 Perceptions moved to equal division of land upon divorce 0.40 0.46 Perceptions moved to equal division of livestock upon divorce 0.34 0.36

16
Table 5. Impact of Inheritance on Food Security and Poverty VARIABLES Food gap
in months Self reported as poor
Food consumption less than adequate in the last months
Housing less than adequate in the last months
Health care less than adequate in the last months
PANEL A: Any receipt of gift or inheritance Female Head 0.630* 0.068 0.070 0.045 0.044 (0.321) (0.045) (0.076) (0.069) (0.075) Dummy indicating head received assets as inheritance/gifts from parents * Dummy for female head 0.264 0.003 -0.065 -0.050 -0.136 (0.680) (0.056) (0.099) (0.101) (0.124) Dummy indicating head received assets as inheritance or gifts from parents 0.508 0.068 0.060 0.066 0.065 (0.366) (0.046) (0.062) (0.048) (0.062) Dummy indicating spouse of male head received assets as inheritance or gifts from parents -0.114 0.005 -0.039 -0.077** -0.019
(0.403) (0.033) (0.044) (0.035) (0.049) Observations, R-squared 1035, 0.11 805, 0.11 803, 0.11 805, 0.06 801, 0.06 PANEL B: Any receipt of inheritance Female Head 0.668 0.065 0.050 0.019 0.007 (0.418) (0.046) (0.047) (0.049) (0.043) Dummy indicating head received assets as inheritance from parents * Dummy for female head 0.097 -0.021 -0.049 -0.013 -0.093
(0.416) (0.086) (0.112) (0.094) (0.123) Dummy indicating head received assets as inheritance from parents 0.272 0.013 0.030 -0.008 0.052** (0.255) (0.032) (0.043) (0.038) (0.024) Dummy indicating spouse of male head received assets as inheritance from parents -0.193 0.033 -0.049 -0.060 -0.062 (0.448) (0.068) (0.070) (0.063) (0.073) Observations, R-squared 1035, 0.10 805, 0.10 803, 0.11 805, 0.05 801, 0.06
PANEL C: Amount of gifts and inheritance received
Female Head 0.488 0.082 0.095* -0.029 0.005 (0.403) (0.050) (0.048) (0.051) (0.039) Value of inherited/gifted assets from parents by the head 0.000* 0.000 0.000*** 0.000 0.000 (0.000) (0.000) (0.000) (0.000) (0.000) Total land inherited/gifted from parents to the head -0.041 -0.007*** -0.017** -0.011*** -0.012** (0.030) (0.002) (0.006) (0.003) (0.004) Value of inherited/gifted assets from parents by the spouse of male head 0.000 0.000 0.000* -0.000 -0.000 (0.000) (0.000) (0.000) (0.000) (0.000) Total land inherited/gifted from parents to the spouse of male head -0.020 -0.008** -0.011*** -0.009*** -0.008*** (0.031) (0.003) (0.003) (0.002) (0.002) Value of inherited/gifted assets from parents to the head * Dummy for female head 0.000 -0.000* -0.000*** -0.000 -0.000 (0.000) (0.000) (0.000) (0.000) (0.000) Total land inherited/gifted from parents to the head * Dummy for female head -0.043 0.002 -0.135* 0.115 0.013
(0.140) (0.040) (0.067) (0.128) (0.107) Observations, R-squared 1006, 0.13 781, 0.11 779, 0.15 781, 0.07 777, 0.06
Robust standard errors in parentheses. *** p<0.01, ** p<0.05, * p<0.1 Note: For Tables 5-16 all regressions include controls for age and sex
composition of the household, livestock units held in 1997, real per capita consumption in 1997, whether poor in 1997 and which land
quartile the household belonged to in 2004 and standard errors are clustered at the village level.
17
Table 6. Impact of Inheritance on Perceptions of Happiness and Wellbeing VARIABLES Ladder of life
(step 1- worst and step 9 best)
How have things been in the last month
Ladder of rights
Ladder of control over one’s life
PANEL A: Any receipt of gift or inheritance Female Head 0.018 0.111 0.176 0.201 (0.298) (0.259) (0.289) (0.225) Dummy indicating head received assets as inheritance or gifts from parents * Dummy for female head -0.333 -0.134 -0.711** -0.042 (0.372) (0.357) (0.329) (0.412) Dummy indicating head received assets as inheritance or gifts from parents 0.080 0.030 0.177 -0.074 (0.198) (0.121) (0.173) (0.208) Dummy indicating spouse of male head received assets as inheritance or gifts from parents -0.017 -0.024 -0.136 -0.132 (0.148) (0.170) (0.182) (0.132) Observations, R-squared 805, 0.14 803, 0.09 803, 0.08 804, 0.09
PANEL B: Any receipt of inheritance Female Head -0.228 0.114 0.026 0.279 (0.190) (0.216) (0.255) (0.192) Dummy indicating head received assets as inheritance from parents * Dummy for female head 0.492 -0.317 -0.863** -0.497 (0.345) (0.325) (0.397) (0.439) Dummy indicating head received assets as inheritance from parents -0.080 0.182 0.004 -0.058 (0.178) (0.125) (0.175) (0.134) Dummy indicating spouse of male head received assets as inheritance from parents -0.071 0.103 -0.113 -0.054 (0.252) (0.220) (0.224) (0.227) Observations, R-squared 805, 0.14 803, 0.10 803, 0.08 804, 0.09
PANEL C: Amount of gifts and inheritance received Female Head -0.106 0.106 -0.111 0.090
(0.249) (0.213) (0.199) (0.199) Value of inherited/gifted assets from parents by the head -0.000** 0.000* -0.000 -0.000 (0.000) (0.000) (0.000) (0.000) Total land inherited/gifted from parents to the head 0.060** -0.039*** 0.066*** 0.053*** (0.024) (0.007) (0.011) (0.011) Value of inherited/gifted assets from parents by the spouse of male head -0.000 0.000** -0.000** -0.000 (0.000) (0.000) (0.000) (0.000) Total land inherited/gifted from parents to the spouse of male head 0.063*** -0.039*** 0.035*** 0.099*** (0.009) (0.010) (0.011) (0.008) Value of inherited/gifted assets from parents by the head * Dummy for female head 0.000 -0.000** -0.000 0.000 (0.000) (0.000) (0.000) (0.000) Total land inherited/gifted from parents to the head * Dummy for female head -0.163 0.224 -0.125 0.013 (0.318) (0.284) (0.466) (0.531) Observations, R-squared 781, 0.16 779, 0.13 779, 0.10 780, 0.10
Robust standard errors in parentheses. *** p<0.01, ** p<0.05, * p<0.1

18
Table 7. Impact of Inheritance on Participation in Village Life VARIABLES Attend
village assembly
Speak/raise issues at assembly
Vote In elections
Member of women’s association
Member of village council
Holds a leadership poistion in kebele/tabia
Attended information meetings during land registration process
PANEL A: Any receipt of gift or inheritance Female Head 0.175** 0.003 0.108** 0.034 0.034 -0.035** 0.095
(0.064) (0.039) (0.049) (0.066) (0.066) (0.015) (0.055)
Dummy indicating head received assets as inheritance or gifts from parents * Dummy for female head
-0.170** -0.013 -0.025 -0.107 -0.107 0.040 -0.088
(0.077) (0.050) (0.058) (0.094) (0.094) (0.027) (0.060)
Dummy indicating head recd assets as inheritance or gifts from parents 0.039 -0.006 0.013 0.017 0.017 -0.011 0.004
(0.046) (0.039) (0.030) (0.065) (0.065) (0.021) (0.038)
Dummy indicating spouse of male head recd assets as inheritance/gifts 0.023 -0.068*** 0.037 -0.003 -0.003 -0.010 0.036
(0.053) (0.021) (0.053) (0.037) (0.037) (0.012) (0.037) Observations, R-squared 1096, 0.09 1131, 0.04 1096, 0.04 1131, 0.07 1131, 0.07 1131, 0.02 1131, .0.08
PANEL B: Any receipt of inheritance Female Head 0.138*** -0.007 0.110** 0.016 0.016 -0.028* 0.055
(0.047) (0.037) (0.041) (0.053) (0.053) (0.014) (0.050)
Dummy indicating head received assets as inheritance * Female head -0.146** 0.033 -0.046 -0.111 -0.111 0.038 0.016
(0.063) (0.074) (0.053) (0.085) (0.085) (0.025) (0.072)
Dummy indicating head received assets as inheritance from parents 0.053 -0.001 0.048 0.036 0.036 -0.028 -0.041
(0.036) (0.039) (0.040) (0.049) (0.049) (0.021) (0.036)
Dummy indicating spouse of male head received assets as inheritance 0.002 -0.061 -0.005 -0.008 -0.008 0.013 0.042
(0.072) (0.040) (0.055) (0.048) (0.048) (0.022) (0.043) Observations, R-squared 1096, 0.08 1131, 0.04 1096, 0.04 1131, 0.07 1131, 0.07 1131, 0.02 1131, 0.07
PANEL C: Amount of gifts and inheritance received Female Head 0.138** 0.002 0.109** -0.002 -0.002 -0.028* 0.069
(0.053) (0.037) (0.040) (0.055) (0.055) (0.015) (0.045) Value of inherited/gifted assets from parents by the head -0.000 -0.000 0.000 -0.000 -0.000 -0.000** -0.000
(0.000) (0.000) (0.000) (0.000) (0.000) (0.000) (0.000) Total land inherited/gifted from parents to the head 0.009** 0.002 0.000 -0.002 -0.002 -0.001 0.002
(0.004) (0.006) (0.006) (0.004) (0.004) (0.001) (0.006)
Value of inherited/gifted assets from parents by the spouse of male head -0.000 -0.000 0.000 0.000 0.000 0.000 -0.000
(0.000) (0.000) (0.000) (0.000) (0.000) (0.000) (0.000)
Total land inherited/gifted from parents to the spouse of male head 0.012*** -0.002 -0.004 -0.003 -0.003 0.012 0.013*
(0.003) (0.003) (0.007) (0.003) (0.003) (0.008) (0.007)
Value of inherited/gifted assets from parents by the head * Female head -0.000 0.000 -0.000 0.000 0.000 0.000 -0.000
(0.000) (0.000) (0.000) (0.000) (0.000) (0.000) (0.000)
Total land inherited/gifted from parents to the head * Female head -0.037*** -0.003 0.007 -0.013** -0.013** 0.006 -0.008
(0.009) (0.008) (0.008) (0.005) (0.005) (0.003) (0.008)
Observations, R-squared 1062, 0.09 1096, 0.03 1062, 0.04 1096, 0.07 1096, 0.07 1096, 0.03 1096, 0.08
Robust standard errors in parentheses. *** p<0.01, ** p<0.05, * p<0.1

19
Table 8. Impact of Inheritance on Perceptions of Trustworthiness and Power Agree or strongly agree… VARIABLES Most people
are basically honest
Most people can be trusted
My life is determined by my own actions
I have power to make decisions that change the course of my life
I am usually able to protect my personal interests
PANEL A: Any receipt of gift or inheritance Female Head -0.019 0.006 0.100 0.133 0.060 (0.080) (0.075) (0.111) (0.095) (0.083) Dummy indicating head received assets as inheritance or gifts from parents * Dummy for female head
-0.061 -0.033 -0.030 -0.067 -0.001
(0.098) (0.093) (0.147) (0.126) (0.123) Dummy indicating head received assets as inheritance or gifts from parents -0.022 -0.015 -0.019 -0.001 -0.015 (0.028) (0.031) (0.054) (0.048) (0.054) Dummy indicating spouse of male head received assets as inheritance or gifts from parents -0.004 -0.024 -0.074 -0.069 -0.003
(0.046) (0.056) (0.049) (0.054) (0.045) Observations, R-squared 805, 0.02 805, 0.02 805, 0.06 805, 0.06 804, 0.05
PANEL B: Any receipt of inheritance Female Head -0.048 -0.014 0.089 0.130* 0.053 (0.059) (0.063) (0.075) (0.073) (0.058) Dummy indicating head received assets as inheritance from parents * Dummy for female head
0.017 0.026 -0.003 -0.127 0.018
(0.103) (0.113) (0.126) (0.118) (0.144) Dummy indicating head received assets as inheritance from parents -0.007 -0.010 -0.016 0.013 -0.039 (0.038) (0.039) (0.056) (0.054) (0.041) Dummy indicating spouse of male head received assets as inheritance from parents -0.004 -0.015 -0.069 -0.061 0.016 (0.059) (0.060) (0.074) (0.090) (0.072) Observations, R-squared 805, 0.02 805, 0.02 805, 0.05 805, 0.06 804, 0.05
PANEL C: Amount of gifts and inheritance received
Female Head 0.025 0.005 0.058 0.075 0.025 (0.062) (0.064) (0.071) (0.072) (0.068) Value of inherited/gifted assets from parents by the head 0.000 -0.000 0.000 0.000 0.000 (0.000) (0.000) (0.000) (0.000) (0.000) Total land inherited/gifted from parents to the head -0.005 -0.003 0.012*** 0.009** 0.006 (0.004) (0.004) (0.003) (0.003) (0.006) Value of inherited/gifted assets from parents by the spouse of male head 0.000 0.000 -0.000 -0.000 -0.000 (0.000) (0.000) (0.000) (0.000) (0.000) Total land inherited/gifted from parents to the spouse of male head 0.019*** 0.020*** 0.016*** 0.016*** 0.016*** (0.002) (0.003) (0.003) (0.003) (0.004) Value of inherited/gifted assets from parents by the head * Dummy for female head -0.000 0.000 0.000** 0.000 0.000 (0.000) (0.000) (0.000) (0.000) (0.000) Total land inherited/gifted from parents to the head * Dummy for female head -0.171*** -0.133** -0.045 0.007 0.024 (0.046) (0.054) (0.098) (0.074) (0.078) Observations, R-squared 781, 0.04 781, 0.04 781, 0.06 781, 0.07 780, 0.06
Robust standard errors in parentheses. *** p<0.01, ** p<0.05, * p<0.1

20
Table 9. Impact of Inheritance on Perceptions of Happiness Agree or strongly agree VARIABLES In most
ways my life is close to my ideal
The conditions of my life are excellent
I am satisfied with my life
So far I have gotten the important things I want in life
If I could live my life over, I would change almost nothing
PANEL A: Any receipt of gift or inheritance Female Head -0.001 0.054 -0.008 -0.048 -0.022 (0.078) (0.073) (0.079) (0.068) (0.069) Dummy indicating head received assets as inheritance or gifts from parents * Dummy for female head
-0.025 0.084 0.082 0.006 0.146*
(0.097) (0.091) (0.089) (0.079) (0.083) Dummy indicating head received assets as inheritance or gifts from parents -0.049 -0.059* -0.055 -0.096*** -0.067*
(0.034) (0.031) (0.038) (0.026) (0.037) Dummy indicating spouse of male head received assets as inheritance or gifts from parents -0.001 0.034 -0.016 0.002 -0.009
(0.043) (0.053) (0.051) (0.044) (0.024) Observations, R-squared 804, 0.07 805, 0.08 805, 0.09 805, 0.09 804, 0.05
PANEL B: Any receipt of inheritance Female Head -0.024 0.084 0.004 -0.047 -0.009 (0.063) (0.068) (0.060) (0.044) (0.069) Dummy indicating head received assets as inheritance from parents * Dummy for female head 0.056 0.042 0.103 0.024 0.231
(0.106) (0.096) (0.085) (0.074) (0.147) Dummy indicating head received assets as inheritance from parents -0.092** -0.083** -0.085** -0.107*** -0.077* (0.034) (0.037) (0.035) (0.027) (0.041) Dummy indicating spouse of male head received assets as inheritance from parents -0.022 -0.001 -0.001 -0.028 0.028
(0.064) (0.057) (0.054) (0.039) (0.041) Observations, R-squared 804, 0.08 805, 0.08 805, 0.09 805, 0.09 804, 0.05
PANEL C: Amount of gifts and inheritance received Female Head -0.009 0.071 -0.027 -0.045 0.009 (0.072) (0.066) (0.058) (0.055) (0.064) Value of inherited/gifted assets from parents by the head 0.000 -0.000 -0.000 -0.000 -0.000 (0.000) (0.000) (0.000) (0.000) (0.000) Total land inherited/gifted from parents to the head 0.009 0.006 0.012 0.013* 0.006 (0.008) (0.008) (0.009) (0.008) (0.007) Value of inherited/gifted assets from parents by the spouse of male head -0.000 0.000 -0.000 -0.000 -0.000
(0.000) (0.000) (0.000) (0.000) (0.000) Total land inherited/gifted from parents to the spouse of male head 0.022*** -0.003 0.020*** 0.020*** -0.004 (0.003) (0.002) (0.003) (0.003) (0.004) Value of inherited/gifted assets from parents by the head * Dummy for female head -0.000 0.000 0.000* 0.000 0.000
(0.000) (0.000) (0.000) (0.000) (0.000) Total land inherited/gifted from parents to the head * Dummy for female head 0.090 0.066 0.090 0.038 0.081
(0.085) (0.081) (0.072) (0.100) (0.127) Observations, R-squared 780, 0.07 781, 0.09 781, 0.10 781, 0.09 780, 0.05
Robust standard errors in parentheses. *** p<0.01, ** p<0.05, * p<0.1

21
Table 10. Impact of Perception of Division of assets upon Divorce on Food Security and Poverty VARIABLES Food gap in
months Self reported as poor
Food consumption less than adequate in the last months
Housing less than adequate in the last months
Health care less than adequate in the last months
Female Head 0.714* 0.060 0.061 0.043 0.022 (0.339) (0.037) (0.040) (0.049) (0.048) Custody of land given to husband in case of no fault divorce -0.681 0.043 0.039 0.139** 0.104* (0.972) (0.057) (0.110) (0.055) (0.057) Observations, R-squared 1008, 0.12 787, 0.11 785, 0.13 787, 0.07 784, 0.07
Female Head 1.072** 0.038 0.045 0.136** 0.037 (0.422) (0.063) (0.070) (0.049) (0.077) Custody of livestock owned by husband given to husband in case of no fault divorce
-0.364 0.008 0.129* -0.017 0.107*
(0.367) (0.044) (0.069) (0.046) (0.059) Custody of livestock owned by wife given to husband in case of no fault divorce
0.196 -0.031 0.000 0.013 0.034
(0.649) (0.076) (0.134) (0.093) (0.121) Custody of livestock acquired after marriage given to husband in case of no fault divorce
0.661 0.240** 0.074 0.327*** 0.168
(0.851) (0.112) (0.162) (0.092) (0.120) Observations, R-squared 586, 0.18 454, 0.22 453, 0.23 454, 0.14 452, 0.14 Female Head 0.737** 0.054 0.042 0.029 0.004 (0.347) (0.038) (0.043) (0.047) (0.050) Custody of house given to husband in case of no fault divorce -0.666 0.046 0.052 0.127** 0.082 (0.967) (0.059) (0.100) (0.053) (0.052) Observations, R-squared 1036, 0.12 810, 0.11 808, 0.13 810, 0.07 807, 0.06
Robust standard errors in parentheses. *** p<0.01, ** p<0.05, * p<0.1
22
Table 11. Impact of Perception of Division of assets upon Divorce on Perceptions of Happiness and Wellbeing VARIABLES Ladder of life (step 1-
worst and step 9 best) How have things been in the last month
Ladder of rights Ladder of control over one’s life
Female Head -0.170 0.063 -0.228 0.014 (0.139) (0.179) (0.212) (0.174) Custody of land given to husband in case of no fault divorce 0.027 -0.157 0.109 -0.229 (0.318) (0.284) (0.209) (0.179) Observations, R-squared 787, 0.17 786, 0.11 785, 0.09 786, 0.11 Female Head -0.250 0.109 0.072 0.369 (0.248) (0.246) (0.232) (0.232) Custody of livestock owned by husband given to husband in case of no fault divorce
-0.135 0.112 -0.091 -0.334
(0.227) (0.173) (0.211) (0.192) Custody of livestock owned by wife given to husband in case of no fault divorce
-0.001 0.116 -0.027 0.300
(0.255) (0.256) (0.359) (0.255) Custody of livestock acquired after marriage given to husband in case of no fault divorce
-0.585 0.206 0.063 -0.587**
(0.353) (0.406) (0.214) (0.216) Observations, R-squared 454, 0.25 453, 0.18 453, 0.14 453, 0.20 Female Head -0.191 0.016 -0.217 0.026 (0.139) (0.185) (0.202) (0.189) Custody of house given to husband in case of no fault divorce -0.033 -0.020 0.047 -0.372* (0.299) (0.288) (0.213) (0.181) Observations, R-squared 810, 0.15 809, 0.10 808, 0.09 809, 0.10
Robust standard errors in parentheses. *** p<0.01, ** p<0.05, * p<0.1

23
Table 12. Impact of Perception of Division of assets upon Divorce on Participation in Village Life VARIABLES Attend
village assembly
Speak/raise issues at assembly
Vote In elections
Member of women’s association
Member of village council
Holds a leadership poistion in kebele/tabia
Attended information meetings during land registration process
Female Head 0.112** -0.015 0.103** -0.004 -0.004 -0.017 0.101* (0.046) (0.028) (0.043) (0.049) (0.049) (0.012) (0.052) Custody of land given to husband in case of no fault divorce
0.051 0.071** -0.082* 0.002 0.002 0.000 -0.004
(0.075) (0.030) (0.042) (0.067) (0.067) (0.014) (0.055) Observations, R-squared 1055 1092 1055 1092 1092 1092 1092 R-squared 0.076 0.047 0.046 0.064 0.064 0.021 0.078 Female Head 0.077 -0.025 0.041 -0.014 -0.014 -0.002 0.123* (0.049) (0.042) (0.039) (0.058) (0.058) (0.015) (0.070) Custody of livestock owned by husband given to husband in case of no fault divorce
0.015 0.055 -0.061* -0.035 -0.035 -0.004 -0.047
(0.056) (0.037) (0.034) (0.037) (0.037) (0.024) (0.072) Custody of livestock owned by wife given to husband in case of no fault divorce
-0.044 0.081 -0.104 -0.005 -0.005 -0.012 -0.086
(0.093) (0.092) (0.077) (0.050) (0.050) (0.010) (0.057) Custody of livestock acquired after marriage given to husband in case of no fault divorce
0.009 -0.080* -0.036 0.010 0.010 -0.027 0.057
(0.092) (0.044) (0.039) (0.054) (0.054) (0.017) (0.060) Observations, R-squared 617, 0.08 643, 0.07 617, 0.06 643, 0.11 643, 0.11 643, 0.04 643, 0.11 Female Head 0.105** -0.013 0.100** -0.011 -0.011 -0.017 0.094* (0.045) (0.027) (0.040) (0.049) (0.049) (0.012) (0.053) Custody of house given to husband in case of no fault divorce
0.056 0.079*** -0.068 0.003 0.003 0.001 -0.011
(0.074) (0.026) (0.046) (0.065) (0.065) (0.020) (0.050) Observations, R-squared 1090, 0.07 1127, 0.05 1090, 0.04 1127, 0.06 1127, 0.06 1127, 0.02 1127, 0.08
Robust standard errors in parentheses. *** p<0.01, ** p<0.05, * p<0.1

24
Table 13. Impact of Perception of Division of assets upon Divorce on Perceptions of Trustworthiness and Power Agree or strongly agree…
VARIABLES Most people are basically honest
Most people can be trusted
My life is determined by my own actions
I have power to make decisions that change the course of my life
I am usually able to protect my personal interests
Female Head -0.044 0.017 0.049 0.057 0.031 (0.057) (0.073) (0.062) (0.059) (0.055) Custody of land given to husband in case of no fault divorce -0.068 -0.071 -0.121** -0.047 -0.108*
(0.050) (0.054) (0.043) (0.045) (0.055) Observations, R-squared 787, 0.03 787, 0.02 787, 0.07 787, 0.07 785, 0.07
Female Head -0.121* -0.021 0.084 0.107 0.128 (0.069) (0.088) (0.089) (0.082) (0.075) Custody of livestock owned by husband given to husband in case of no fault divorce
-0.042 -0.072 0.007 0.039 -0.154*
(0.067) (0.074) (0.071) (0.049) (0.079)
Custody of livestock owned by wife given to husband in case of no fault divorce
0.084** 0.053 0.059 -0.069 0.050
(0.038) (0.058) (0.081) (0.054) (0.062) Custody of livestock acquired after marriage given to husband in case of no fault divorce
-0.053 0.011 -0.275*** -0.153** -0.121
(0.075) (0.076) (0.065) (0.060) (0.072)
Observations, R-squared 454, 0.07 454, 0.05 454, 0.12 454, 0.13 453, 0.17
Female Head -0.059 0.009 0.057 0.073 0.038 (0.049) (0.067) (0.063) (0.059) (0.052) Custody of house given to husband in case of no fault divorce -0.059 -0.056 -0.131*** -0.071* -0.114** (0.044) (0.052) (0.043) (0.038) (0.049)
Observations, R-squared 810, 0.03 810, 0.02 810, 0.07 810, 0.06 808, 0.07
Robust standard errors in parentheses. *** p<0.01, ** p<0.05, * p<0.1

25
Table 14. Impact of Perception of Division of assets upon Divorce on Perceptions of Happiness Agree or strongly agree
VARIABLES In most ways my life is close to my ideal
The conditions of my life are excellent
I am satisfied with my life
So far I have gotten the important things I want in life
If I could live my life over, I would change almost nothing
Female Head -0.044 0.047 0.031 -0.038 0.024
(0.045) (0.056) (0.048) (0.031) (0.048)
Custody of land given to husband in case of no fault divorce -0.069 0.013 0.015 -0.034 0.013
(0.054) (0.060) (0.070) (0.041) (0.053)
Observations, R-squared 786, 0.08 786, 0.09 787, 0.09 787, 0.09 786, 0.04
Female Head 0.068 0.058 0.041 -0.088* -0.025
(0.051) (0.077) (0.074) (0.042) (0.078)
Custody of livestock owned by husband given to husband in case of no fault divorce
-0.042 -0.117* 0.043 -0.018 0.090
(0.062) (0.061) (0.041) (0.063) (0.053)
Custody of livestock owned by wife given to husband in case of no fault divorce
0.054 0.028 0.039 0.057 0.079
(0.080) (0.068) (0.090) (0.090) (0.049)
Custody of livestock acquired after marriage given to husband in case of no fault divorce
-0.097 0.056 -0.091 -0.093 -0.050
(0.061) (0.081) (0.066) (0.065) (0.082)
Observations, R-squared 453, 0.17 453, 0.15 454, 0.13 454, 0.14 453, 0.07
Female Head -0.031 0.058 0.042 -0.045 0.024
(0.047) (0.055) (0.055) (0.028) (0.049)
Custody of house given to husband in case of no fault divorce
-0.100* 0.031 0.012 -0.067 0.019
(0.053) (0.062) (0.074) (0.039) (0.058)
Observations, R-squared 809, 0.08 809, 0.08 810, 0.09 810, 0.09 809, 0.05
Robust standard errors in parentheses. *** p<0.01, ** p<0.05, * p<0.1

26
Table 15. Impact of changes in perception of division of land upon divorce
VARIABLES Food gap in months
Self reported as poor
Food consumption less than adequate in the last months
Housing less than adequate in the last months
Health care less than adequate in the last months
PANEL A Female Head 0.780* 0.057 0.050 0.043 -0.001 (0.421) (0.037) (0.046) (0.046) (0.047) Moved to equal division of land upon divorce -0.752 -0.034 -0.025 0.063 0.016 (0.517) (0.044) (0.060) (0.043) (0.044) Observations, R-squared 1038, 0.12 828, 0.11 826, 0.13 828, 0.05 825, 0.05
PANEL B Ladder of life (step 1-
worst and step 9 best) How have things been in the last month
Ladder of rights Ladder of control over one’s life
Female Head -0.206 0.010 -0.209 0.005 (0.121) (0.180) (0.196) (0.172) Moved to equal division of land upon divorce 0.090 -0.285* 0.076 0.021 (0.243) (0.163) (0.163) (0.140) Observations, R-squared 828, 0.15 826, 0.11 826, 0.09 827, 0.09
PANEL C Attend village
assembly Speak/raise issues at assembly
Vote In elections
Member of women’s association
Member of village council
Holds a leadership poistion in kebele/tabia
Attended information meetings during land registration process
Female Head 0.092** -0.025 0.114*** -0.008 -0.008 -0.022 0.101* (0.041) (0.028) (0.038) (0.050) (0.050) (0.013) (0.054) Moved to equal division of land upon divorce 0.043 0.075** -0.026 0.020 0.020 0.003 0.033 (0.058) (0.033) (0.039) (0.045) (0.045) (0.015) (0.033) Observations, R-squared 1112, 0.07 1133, 0.05 1112, 0.04 1133, 0.07 1133, 0.07 1133, 0.02 1133,0.08

27
Table 15. Impact of changes in perception of division of land upon divorce, contd.
PANEL D Agree or Strongly Agree
Most people are basically honest
Most people can be trusted
My life is determined by my own actions
I have power to make decisions that change the course of my life
I am usually able to protect my personal interests
In most ways my life is close to my ideal
The conditions of my life are excellent
I am satisfied with my life
So far I have gotten the important things I want in life
If I could live my life over, I would change almost nothing
Female Head -0.065 -0.002 0.060 0.073 0.041 -0.042 0.056 0.026 -0.067** 0.012
(0.051) (0.063) (0.064) (0.057) (0.052) (0.047) (0.054) (0.055) (0.028) (0.045)
Perceptions moved to equal division of land upon divorce
-0.053 -0.044 -0.057 -0.014 -0.025 -0.023 0.025 0.002 -0.013 -0.000
(0.046) (0.044) (0.036) (0.032) (0.038) (0.044) (0.039) (0.035) (0.038) (0.039)
Observations 828, 0.03
828, 0.02
828, 0.05
828, 0.06
826, 0.06
827, 0.07
827, 0.08
828, 0.09
828, 0.08
827, 0.04
Robust standard errors in parentheses. *** p<0.01, ** p<0.05, * p<0.1

28
Table 16. Impact of changes in perception of division of livestock upon divorce
VARIABLES Food gap in months
Self reported as poor
Food consumption less than adequate in the last months
Housing less than adequate in the last months
Health care less than adequate in the last months
PANEL A Female Head 0.842* 0.053 0.028 0.034 -0.008
(0.475) (0.034) (0.046) (0.051) (0.052)
Moved to equal division of livestock upon divorce -0.060 0.044 -0.011 0.113 0.046
(0.583) (0.046) (0.074) (0.070) (0.064)
Observations, R-squared 1028, 0.11 822, 0.11 820, 0.13 822, 0.06 819, 0.05
PANEL B Ladder of life (step 1-
worst and step 9 best) How have things been in the last month
Ladder of rights Ladder of control over one’s life
Female Head -0.109 -0.031 -0.210 0.084
(0.096) (0.199) (0.194) (0.205)
Moved to equal division of livestock upon divorce -0.127 0.064 0.201 0.098
(0.222) (0.207) (0.160) (0.156)
Observations, R-squared 822, 0.14 819, 0.10 820, 0.09 821, 0.09

29
Table 16. Impact of changes in perception of division of livestock upon divorce, contd.
PANEL C Attend village
assembly Speak/raise issues at assembly
Vote In elections
Member of women’s association
Member of village council
Holds a leadership poistion in kebele/tabia
Attended information meetings during land registration process
Female Head 0.092* -0.030 0.111** -0.014 -0.014 -0.025* 0.101*
(0.047) (0.028) (0.039) (0.052) (0.052) (0.014) (0.056)
Moved to equal division of livestock upon divorce -0.055 0.003 -0.103*** -0.081* -0.081* -0.023* -0.029
(0.047) (0.027) (0.031) (0.045) (0.045) (0.011) (0.035)
Observations, R-squared 1103, 0.07 1124, 0.04 1103, 0.05 1124, 0.07 1124, 0.07 1124, 0.02 1124, 0.08
PANEL D
Agree or Strongly Agree
Most people are basically honest
Most people can be trusted
My life is determined by my own actions
I have power to make decisions that change the course of my life
I am usually able to protect my personal interests
In most ways my life is close to my ideal
The conditions of my life are excellent
I am satisfied with my life
So far I have gotten the important things I want in life
If I could live my life over, I would change almost nothing
Female Head -0.067 -0.004 0.093 0.101* 0.065 -0.028 0.065 0.043 -0.053* 0.025
(0.048) (0.064) (0.063) (0.050) (0.050) (0.045) (0.057) (0.057) (0.028) (0.048)
Perceptions moved to equal division of livestock upon divorce
0.012 0.014 -0.073 -0.016 -0.072* 0.001 0.054 0.022 0.006 0.008
(0.039) (0.039) (0.062) (0.057) (0.037) (0.049) (0.057) (0.044) (0.031) (0.032)
Observations 822, 0.02
822, 0.02
822, 0.06
822, 0.06
820, 0.06
821, 0.07
821, 0.08
822, 0.09
822, 0.08
821, 0.04
Robust standard errors in parentheses. *** p<0.01, ** p<0.05, * p<0.1

30
Figures
Figure 1. Map Showing Location of the ERHS Villages

31
0
0.1
0.2
0.3
0.4
0.5
0.6
0.7
Figure 2. Proportion of Female Headed Households

32
0
0.5
1
1.5
2
2.5
3
3.5
4
Female Headed
Male Headed
Female Headed
Male Headed
Female Headed
Male Headed
Female Headed
Male Headed
Female Headed
Male Headed
Female Headed
Male Headed
Land (Ha) Livestock Value (1000 birr)
Livestock Units Any Oxen Real pc cons (100 birr)
Poor
Figure 3: Assets and Consumption Over Time
Round 1
Round 2
Round 3
Round 4
Round 5
Round 6

33