referendum contingent valuation, anchoring, and ... · pdf fileresource and energy economics...
TRANSCRIPT

! .Resource and Energy Economics 20 1998 85–116
Referendum contingent valuation, anchoring,and willingness to pay for public goods
Donald Green a, Karen E. Jacowitz b, Daniel Kahneman c,Daniel McFadden d,)
a Department of Political Science, Yale UniÕersity, New HaÕen, Conn., USAb Department of Psychology, UniÕersity of California, Berkeley, CA, USAc Department of Psychology, Princeton UniÕersity, Princeton, NJ, USAd Department of Economics, UniÕersity of California, Berkeley, CA, USA
Received 28 December 1995; accepted 7 November 1996
Abstract
This study reports on experiments that examine anchoring in single referendum ques-tions in contingent valuation surveys on willingness to pay for public goods, and onobjective estimation. Strong anchoring effects are found that lead to systematically higherestimated mean responses from YesrNo referendum responses than from open-endedresponses. This response pattern is similar for contingent valuation questions and forobjective estimation questions. The paper concludes that psychometric anchoring effects,rather than incentive effects, are the likely cause of results commonly found in contingentvaluation studies, and that the currently popular single referendum elicitation format ishighly vulnerable to anchoring. q 1998 Elsevier Science B.V.
Keywords: Contingent valuation; Willingness to pay; Anchoring
1. Introduction
! .Single referendum contingent valuation CV is a protocol for elicitation of! .Willingness-to-Pay WTP for public goods. Subjects are each presented with a
) Corresponding author. 549 Evans Hall a3880, Department of Economics, University of California,Berkeley, CA 94720-3880. E-mail: [email protected]
0928-7655r98r$19.00 q 1998 Elsevier Science B.V. All rights reserved.! .PII S0928-7655 97 00031-6

( )D. Green et al.rResource and Energy Economics 20 1998 85–11686
hypothetical referendum that specifies a good to be supplied and a payment, andasked to vote on this referendum. The payment, or bid, is varied experimentally to
! .provide a profile of the cumulative distribution function CDF of WTP at theexperimental design points. This protocol has gained widespread use in applica-tions to valuation of natural resources, and has largely displaced older protocols inwhich subjects were asked to state an open-ended WTP for a good, or to reveal aWTP range by responses to a sequence of bids or choices from a set ofalternatives.A CV study will give a biased revelation of preferences if it contains incentives
for strategic misrepresentation, or if the context of the survey question alters thepsychometric perceptions of the subject. The classic ‘free-rider’ problem forpublic goods, in which a subject expecting to be dunned for payment has anincentive to understate WTP, is an example of the first source of bias. Anchoring,in which a numerical prompt alters psychometric response, is an example of thesecond source. Economists have concentrated on incentives as a source of bias,and this has been the focus of research on mechanisms for revelation of prefer-ences. We argue in this paper that psychometric bias may be a more seriousproblem, and that protocols designed to reduce possible incentive bias mayexacerbate psychometric bias. In particular, we argue that single referendum CV issusceptible to anchoring effects. Using experiments involving both CV andobjective estimation tasks, we show that anchoring effects have a commonstructure across tasks, and appear to have no features that clearly distinguish theiroperation between CV and estimation tasks. This suggests that objective estima-tion and preference elicitation entail similar cognitive processes.Section 2 reviews the historical development of CV methods. Section 3
summarizes results on anchoring. Section 4 describes the experiments and theirresults. Section 5 contains conclusions.
2. Historical development of contingent valuation methods
The concepts in economic theory underlying CV methods are preferences!characterized in monetary units consumer surplus, compensating Õariation, will-
.ingness to pay , the Kaldor–Hicks compensation principle as a criterion foraggregating individual preferences into a social choice rule, and Samuelson’stheory of optimal supply of public goods, developed in a stream of literature thathas emphasized incentiÕe-compatible mechanisms that blunt the ‘free-rider’ prob-lem. Surveys of these theoretical subjects can be found in Barten and Bohm! . ! . ! . ! .1982 , Diewert 1982 , Diamond and McFadden 1974 , Hurwicz 1986 , and
! . ! .McConnell 1990 . Cummings et al. 1986 , Chap. 2–3, describe how CV methodsdeveloped from these underpinnings.
! . ! .The initial versions of CV proposed by Davis 1963 and Randall et al. 1974concentrated on incentive and free-ridership issues, with psychometric issues

( )D. Green et al.rResource and Energy Economics 20 1998 85–116 87
treated as incidental problems that would disappear once subjects have positiveincentives to be truthful. This focus was consistent with the views of many
! .economists at that time and now that cognitive paradoxes observed in psycholog-ical experiments must disappear when a subject is adequately economicallymotivated. Davis employed an open-ended protocol, implementing a program
! .proposed by Ciriacy-Wanthrup 1947 , which asked subjects for a stated WTP for! .a good. Randall implemented a proposal by Bradford 1970 to use a sequential
bidding protocol in which subjects were asked for a series of votes on referen-dums whose payments define brackets converging to a WTP number.Several arguments were put forward by Randall and others for the use of a
sequential bidding rather than an open-ended protocol: The referendum task wasviewed as simpler and less subject to misinterpretation than the open-ended task,because it more closely represented familiar market decisions. 1 The referendumprotocol was also judged preferable because it could be unambiguous about therelationship between payments by the subject and others, and about the good thatwould be delivered if the referendum passed. Other arguments made for thesequential bidding protocol were that it gave time for the subject’s preferences to‘unfold’, and that the format reduced the opportunities for strategic misrepresenta-tion.Despite the arguments for the sequential bidding protocol, the most commonly
used protocols in the early 1980s were open-ended or employed payment cards,the latter requesting a choice from a series of ranges. One reason for this was
!evidence from experiments on public goods Bohm, 1972; Smith, 1979; Bishop et.al., 1983; Schultz et al., 1981 suggesting that strategic misrepresentation was not
quantitatively important in stated WTP for public goods. Another was thatsequential bidding outcomes were found by some studies to be quite sensitive to
! .starting point Rowe et al., 1980; Mitchell and Carson, 1989; Boyle et al., 1985 .Another motivation was the ease with which open-ended or payment card proto-cols could be incorporated in inexpensive mail surveys.The referendum protocol, stripped of the sequential bidding feature so that the
subject was offered a single bid that was varied across subjects according to an! .experimental design, was reintroduced by Bishop and Heberlein 1979 and
! .Hanemann 1984 . Further developments were made by Cameron and James! . ! . ! .1987 , Bowker and Stoll 1988 , and Mitchell and Carson 1989 . By 1993, thereferendum protocol, with a single bid, or in some applications with a follow-upgiving a double referendum, had eclipsed the open-ended protocol. A blue-ribbon
! .panel assembled by NOAA U.S. Department of Commerce, 1993 to assess thereliability of CV methods endorsed the single referendum protocol as the preferredprocedure for CV analysis.
1 However, consumers may be as experienced and adept at responding to the question ‘How muchdo you want for that car?’ as to the question ‘Will you take US$500 for that car?’.

( )D. Green et al.rResource and Energy Economics 20 1998 85–11688
! .Three distinct aspects of a CV protocol are 1 the elicitation format, or form! . ! .of the requested response e.g., open-ended, referendum , 2 the implementation
! .frame, or the link between survey response and the subjective probability that the! .policy will be implemented, and 3 the payment Õehicle, or form in which
payment was specified in the survey, the condition under which payment would berequired, and the link between response and potential payment. CV practitionershave found that responses are influenced by the payment vehicle. This may arisefrom incentive effects of the ‘free-rider’ variety, or from the concerns of subjectsabout distributional implications and ‘fairness’.A decisiÕe implementation frame prompts the belief that the probability that
the policy will be implemented depends on the subject’s response; i.e., the subjectis induced to believe that there is a positive probability of being decisiÕe. MostCV studies have not used a decisive implementation frame. An implementationframe in a referendum elicitation format is made decisive by prompting the beliefthat the probability of implementation is positively related to the survey pluralityfor the policy, or to the probability of a majority vote for the policy, at its actualcost to consumers. To accomplish this in an open-ended elicitation, the surveyormust persuade the respondent that her response will be counted as a ‘Yes’ if itexceeds actual cost, and that the probability of implementation is linked to surveyplurality.A decoupled payment vehicle states that if a good is provided, then its cost
!will be distributed across all consumers by a formula such as an income tax.surcharge that does not depend on the subject’s CV response. Then, the CV
response can affect only the probability that the good is provided, and not thepayment level required if the good is provided. The decoupled payment vehicle isusually paired with a referendum elicitation format, and the term ‘referendummethod’ has come to imply the use of a YesrNo question, presented as ahypothetical referendum with a decoupled payment vehicle.The binomial response in the single referendum format is statistically ineffi-
cient compared to open-ended response, requiring substantially larger samples toachieve the same level of precision. The estimation problem is compounded by
!uncertainty about the shape of the underlying distribution of WTP Bowker andStoll, 1988; Cameron and Huppert, 1991; Cooper and Loomis, 1991; Duffield and
.Patterson, 1991; McFadden, 1994 , so that WTP estimation requires added as-sumptions. Open-ended WTP surveys typically include a significant proportion ofresponses that are considered too high to be reliable—e.g., willingness to pay 20%of household income to prevent minor oil spills. These responses are an embar-rassment in open-ended CV analysis, because they are not compatible with aninterpretation of the technique as eliciting true economic values. The problem isavoided in the referendum method by not probing high values. In the CV study
! .done by Carson et al. 1992 to assess the damages caused by the Exxon Valdezoil spill, for example, the highest value that was probed as an initial referendumbid was US$125, and we are left to guess the percentage that would have declared
( )D. Green et al.rResource and Energy Economics 20 1998 85–116 89
themselves willing to pay several thousand dollars for that cause. Thus, thisapplication of the referendum method may conceal implausible valuations thatcould provide an indication of the reliability of response.What accounts for the widespread and relatively uncritical acceptance of a
method that is statistically inefficient and requires relatively complex analysis?One important reason appears to be that the single referendum protocol andopen-ended protocols do not yield the same results. In addition to avoidingextremely large responses, the referendum format reduces non-response and avoids
!zero responses which in open-ended surveys are often associated with ‘protests’.about the fairness of the payment vehicle . Further, for the valuation tasks, bid
levels, and analytic models used in most single referendum studies, it appears thatmeasures of average WTP will often be substantially higher than average WTP
! .obtained in an open-ended protocol Desvousges et al., 1992; McFadden, 1994 .Some CV practitioners argue for the referendum method because it mimicspolitical referendums that are an accepted mechanism for social choice. However,referendum voting is itself a flawed social choice mechanism that is subject tocontinuing analysis and refinement by social scientists. While there seems to begeneral agreement on the advantages of using a decoupled payment vehicle, oneneed not adopt a binomial response format in order to frame the CV question as areferendum; e.g., the phrasing ‘what is the largest cost to your household at whichyou would vote for the proposition?’ could be used to combine a decoupledpayment vehicle with an open-ended response. Further, if a starting bid focusedresponse without biasing it, then the subject’s YesrNo response could be followedup by an open-ended question. This would provide strictly more information than,say, a double-referendum format. 2 These possibilities do not appear to have been
! .seriously considered for one exception, see Milon, 1989 . A final justification forthe referendum format is the assertion that it is incentive-compatible, while the
! .open-ended format is not Hoehn and Randall, 1987; Hanemann, 1994 . However,closer examination shows that this claim is misleading.Viewing a CV elicitation on the value of a public good as a game, a rational
economic player will choose a response that maximizes expected pay-off. Thisbehavior will take into account the distribution of possible costs of supplying thegood. Conditioned on these costs, behavior will be determined by the mappingfrom costs and response into the payment required if the good is supplied, and theresulting net benefit, and the probability that the response is decisiÕe for provision
! .of the good Palfrey and Rosenthal, 1990 . First, if it is clear to the player that theelicitation is purely hypothetical, so that there is zero probability of being decisive
2 There is considerable evidence that referendum follow up questions are influenced by the initial! .question; see, for example, McFadden 1994 . It seems likely that this would also happen for
open-ended follow up questions. This is not a justification for ignoring the information available infollow-up questions, but does suggest that analysis should not take this information at face value.

( )D. Green et al.rResource and Energy Economics 20 1998 85–11690
and zero marginal linkage of response to payment level if the good is supplied,then the game has zero economic incentives for either truth or misrepresentation.Factors outside the economic model, such as the convenience of either truthful or
! . 3standardized responses such as focal points , or the motivations that influencestated attitudes in pure opinion polls, may affect response to the CV elicitation inthis case. However, the economic incentive model is silent on the net impact ofthese effects under different elicitation formats.Suppose instead the player believes there is a positive probability of being
decisive; e.g., she is aware that she is one of a finite number of survey respondentsand believes that the probability of implementation is proportional to the surveyplurality in favor of the good. The nature of the good and the framing of the CVquestion might either encourage or discourage this belief. The frame could bemore or less explicit about the cost of the good, and about the link from responsesto a decision to promote supply of the good; e.g., statements such as ‘The cost ofthis good has yet to be determined precisely, but may be as low as bX or as high asbY per household.’ and ‘We are doing this survey so that when we know the exactcost of the good, we can determine whether enough people would vote for theproposition to justify our putting it on the ballot.’ The subject’s behavior will alsodepend on whether she believes that, conditional on implementation, the marginaleffect of response on prospective payment is zero. Again, this belief could beencouraged or discouraged by the framing of the payment vehicle. The decoupledpayment vehicle, where the cost of the good is assessed without regard toindividual responses if the referendum passes, should display zero marginal cost ofresponse conditioned on implementation. Open-ended payment vehicles can beframed to imply either a positive or a zero marginal cost. For example, adecoupled payment vehicle could use the prompt ‘When you tell us the maximumcost in dollars to your household at which you would vote for providing the good,a small amount will make it less likely that this issue will go on the ballot, and alarge answer will make it more likely. If the measure does go on the ballot andpasses, then the cost to your household will be your share of the actual cost of thegood. Your response on this survey will not be used to determine the paymentrequired of your household if the measure passes.’ All of the open-ended CVquestionnaires we have examined either specify a payment vehicle that has zeromarginal cost, or leave the payment vehicle incompletely specified.A first question is whether subjects placed in a CV experiment with economic
incentives will respond rationally. We suggest that economic rationality is to someextent learned behavior, the result of experience in market transactions where the
3 A focal point is a ‘rounded-off’ response. For example, subjects asked for a dollar value willfrequently give responses such as 0, 5, 10, 20, 50, 100, 500, etc. rather than distributing their responsescontinuously over the line. Strong focal point effects are common for economic quantities, and forspatial or temporal estimation tasks. They may arise because subjects think in terms of standardizedcategories, or because subjects find it economical to categorize information when it is reported.
( )D. Green et al.rResource and Energy Economics 20 1998 85–116 91
sting of monetary punishment conditions out irrational excursions. In CV studiesof natural resources the linkage from response to implementation is often tenuous,and the pay-off is often remote in time and in the experience of the consumer.Then, the analogies to market experience may be too weak to induce rationalbehavior. Further, if the subject accepts some, but not all, of the prompt onimplementation and coupling, the incentives for misrepresentation may be in-creased rather than reduced. For example, a subject who believes the probability ofbeing decisive is negligible or zero, but that there is some coupling of response topayment if the policy is implemented has a powerful incentive for misrepresenta-tion. In addition, some experimental studies that are widely cited in the CVliterature suggest that misrepresentation is quantitatively unimportant even when
! .there are incentives to free-ride Bohm, 1972; Smith, 1979 , suggesting thatsubjects are influenced by ‘precommittments’ or ‘norms’ in a ‘supergame’ thatencompasses far more than the immediate public good issue.Suppose a subject believes that the probability of implementation, conditioned
on actual cost c, is proportional to the survey plurality for the good at this cost.Let r denote the subject’s response, which in an open-ended format is stated WTPand in a referendum format is the largest bid at which the subject will give a ‘Yes’response. 4 Suppose the subject believes the linkage between response and
! .prospective payment is given by a function h c,r . For a decoupled paymentvehicle, if implementation occurs, then the subject’s payment is determined solely
! .by the exogenous cost of the good, so that h c, r sc. The plurality forN 1yF c q1 rGc! . ! .
implementation at actual cost c is where N is theNq1
! .number of survey respondents other than the subject, F P is a CDF expressing the! .subject’s beliefs about the responses of others in the survey, and 1 P is an
indicator that is one when its argument is true, zero otherwise. If risk aversion isnot a factor and the subject believes that the probability of implementation is apositive fraction l times the survey plurality for the good, then the subject willchoose a response that maximizes the expected value of the difference between
! .true WTP v and prospective payment h c,r , multiplied by the probability ofimplementation, or:
N 1yF c q1 rGc! . ! .Pay-offsE vyh c,r Pl! .! .c Nq1
rlXsKq vyh c,r G c dc,! . ! .! .HNq1 0
where K is a constant independent of r, and G is the CDF of subject’s beliefs
4 Compare a game in which there is a single open-ended question with one in which an open-endedquestion is preceded by a referendum question. If the two games are equivalent on decisiveness and thepayment vehicle, then a rational subject’s response to the open-ended question will be the same in bothgames.

( )D. Green et al.rResource and Energy Economics 20 1998 85–11692
!about c, conditioned on the framing of the survey which in a referendum format. ! .includes the bid . First consider a decoupled payment vehicle, h c,r sc. Then,
this pay-off is maximized at rsv as long as GX is positive in a neighborhood ofv. Therefore, these beliefs lead to a truthful response. But these beliefs areconsistent with either a referendum or an open ended elicitation format, providedboth use a decoupled payment vehicle, and both prompt the beliefs that theprobability of implementation is proportional to survey plurality and that actualcost may be above or below their true WTP. This is a trivial Nash equilibrium inwhich the optimal action for the subject is independent of the actions of others.One can repeat this exercise and obtain the same result when the subject believesthat the probability of implementation is proportional to the probability that thesurvey yields a majority favoring the good. We conclude that both referendum andopen-ended formats can be incentive-compatible, proÕided they are framed to
! .successfully induce the beliefs above. The reason Hoehn and Randall 1987 reachan apparently contradictory conclusion is that they compare a referendum formatwith a decoupled payment vehicle and an open-ended format with a non-decou-pled payment vehicle.It is also possible that a subject will hold beliefs that lead to misrepresentation
of WTP. If all the conditions in the last paragraph hold except that v lies belowall plausible cost levels c, then the consumer will choose rs0 even if v)0.Alternately, v lying above the support of c leads to extreme overstatement of v,in either an open-ended or a referendum format. If a subject believes that theprobability of implementation for a given cost level c is increasing in her responselevel r for r)c, and that the payment vehicle is decoupled, then she has anincentive to overstate WTP. An open-ended elicitation that framed the link toimplementation by stating that the probability of implementation is proportional tothe benefitrcost ratio, with benefits estimated by the mean stated WTP ofrespondents, but that actual project cost would be spread evenly across consumers,would promote such beliefs. It is less natural, but not impossible, to induce asimilar incentive-incompatibility in a single referendum survey by indicating that‘Yes’ responses to high bid levels count more than proportionately in determiningthe probability of implementation.Finally, consider the situation where the subject believes that the payment
vehicle is coupled to response, so that EhrE r)0. This creates an incentive to‘free-ride’ by understating WTP. While an open-ended elicitation may be framedin a way that induces this belief, it need not be; e.g., the decoupled paymentvehicle in an open-ended elicitation has EhrE rs0.In summary, if a CV elicitation is purely hypothetical, so the subject considers
the probability of being decisive to be zero, then economic incentives are neutral,and provide no guidance to choice of elicitation format. If the CV experiment canbe set up so that an economically rational subject believes there is a positiveprobability of being decisive, then it is possible to frame both open-ended andreferendum elicitations so that if this subject accepts the frame, then responses will

( )D. Green et al.rResource and Energy Economics 20 1998 85–116 93
be truthful. However, subjects may also hold beliefs that induce misrepresentationin either elicitation format, due to the framing of the experiment, or in spite of it.Open questions are whether CV practitioners are less likely in a referendumelicitation to introduce framing that induces incentive-incompatible beliefs; andwhether elicitation format influences subjects’ suggestibility.
3. Anchoring
Anchoring describes a family of effects observed in many psychological studiesof beliefs about uncertain quantities, such as the length of the Amazon or the
! .height of the tallest redwood Tversky and Kahneman, 1974 . Subjects in these! .studies are asked to judge whether a particular value the anchor is higher or
lower than the uncertain quantity, before stating their own estimate. A robustresult is that the average estimate is pulled toward the anchor. Even a deliberatelyuninformative anchor can be quite effective. Subjects in one experiment wereasked to write the last four digits of their social security number as an ID number,and then to indicate whether they believed that the number of ‘physicians andsurgeons’ listed in the local yellow pages was higher or lower than that value. Thesubjects were then asked to indicate their best estimate of that number. A
! .pronounced anchoring effect was observed Wilson et al., 1994 . Large anchoringeffects have been reported in diverse contexts and populations of respondents,
! .including experts for example, see Northcraft and Neale, 1987 .A standard demonstration of anchoring effects in either objective estimation or
WTP responses is to show that a YesrNo question induces a bias in responses to asubsequent open-ended question. It is possible that anchoring could influence theopen-ended follow up question, by pulling the response toward the anchor, yethave no effect on the response proportions to the YesrNo question. However, a
! .recent study of objective estimates Jacowitz and Kahneman, 1995 has docu-mented an anchoring-like effect in responses to the YesrNo question itself. Thisstudy was conducted in two phases. In the first phase, respondents providedopen-ended estimates of fifteen uncertain quantities. The 15th and the 85thpercentiles of the responses to each question were selected as anchors for thesecond phase. Subjects in two new groups, recruited from the same population asbefore, answered two questions for each quantity: they first evaluated whether a
! .number one of the anchors was higher or lower than the quantity, then theyestimated the quantity. The novel finding of the study was that the percentage of
! .positive responses ‘the quantity is higher than X ’ for subjects shown a highanchor was close to 30%, instead of the value of 15% which is expected if theopen-ended and the referendum questions probe the same underlying belief. Thisrobust effect was limited to high anchors, probably because the uncertainty aboutthe quantity is asymmetric when zero provides a firm lower bound. It appears that

( )D. Green et al.rResource and Energy Economics 20 1998 85–11694
!the consideration of a proposition e.g., that the tallest redwood is more than 4000.ft tall tends to increase the plausibility of that proposition. This suggestion effect
is apparently quite automatic, although it can be justified if the subjects reason thata value mentioned in a question is unlikely to be absurd. Anchoring in YesrNoresponses to objective estimation tasks can be interpreted as a bias induced by thereferendum format: an open-ended question is the method of choice for measuringbeliefs about a quantity, and the mention of a possible value in the referendumquestion can only distort pre-existing beliefs.The usual explanation for the phenomenon of anchoring is that the anchor value
creates, at least temporarily, the possibility that the quantity to be estimated couldbe near this value. This may pull the subject to the nearest end of her a priori
! .range of possible values Quattrone et al., 1984 . Other psychological models! .related to anchoring are discussed by Wilson et al. 1994 and, for ‘anchoring’ to
! .the status quo, Thaler and Johnson 1990 . It is possible to construct a model ofrational anchoring in which the subject behaves as a statistical decision makerwho treats the anchor as a datum that with some probability is legitimate and canbe used to update a prior distribution of possible values. However, the fact thatanchoring occurs even when the anchor value is explicitly random indicates thatmuch of the effect comes from how humans handle uncertainty, rather than fromrational statistical processing of information. Anchoring in YesrNo referendumresponses is very difficult to reconcile with statistical decision theory; only incontrived examples can one get overshooting of the anchor as a rational response. 5The anchoring effect is well-known to students of contingent valuation, under
!the label of starting-point bias Boyle and Bishop, 1987; Boyle et al., 1985;.Mitchell and Carson, 1989; Silberman and Klock, 1989; McFadden, 1994 . When
respondents answer a referendum WTP question before providing follow upopen-ended or referendum responses, the bid mentioned in the initial question has
!a pronounced effect on the subsequent response Gregory and Furby, 1987; Folmer.and van Ierland, 1989; Gregory et al., 1991 . There is a striking similarity between
the results obtained by Jacowitz and Kahneman for objective estimates and thepattern of estimates of WTP in open-ended versus referendum questions. In bothcases the proportion of respondents who accept a high value in the referendumquestion is larger than the proportion of respondents who offer the same value ontheir own in response to an open-ended question.An account in terms of anchoring and suggestion provides a simple unified
treatment of the results in both objective estimation and WTP contexts. In contrast,
5 For example, if the subject’s prior is a mixture of distributions that have finite support, then ananchor that the subject interprets as a draw from this prior eliminates all distributions in the mixturethat do not contain the anchor in their support, and the mean of surviving distributions may ‘overshoot’the anchor. In contrast, a conjugate prior can never produce overshooting.

( )D. Green et al.rResource and Energy Economics 20 1998 85–116 95
the incentive compatibility argument that was used to favor the referendum formatin the CV context is not applicable to an estimation task. Further, in the likely casethat a subject treats a CV survey as purely hypothetical with zero probability thatresponse will influence either implementation or payment in case of implementa-tion, there are no economic incentives at work.The anchoring effects in CV experiments may interact with other factors that
may influence the distribution of responses. Verbal protocol studies by Schkade! .and Payne 1993 suggest that subjects often treat CV questions as puzzles to
which they must ‘construct’ a solution. While it is possible that the outcome ofsuch problem-solving behavior would be revelation of a primitive latent value, itseems more likely that variations in the problem-solving protocols the subjectsadopt will lead to a scatter of stated values. For example, Schkade and Payne findthat some CV respondents estimate the cost of providing the good rather thanengaging in a self-examination that tests their tastes for the good. It may beimpossible to infer from stated values a definitive linkage back to primitive values,or at a deeper level to determine whether primitive values that link to stated valuesexist. However, extrapolating the psychometric observation that anchoring effectsare weaker when a priori beliefs are stronger, one might expect the strongestanchoring effects when primitive beliefs are weak or absent, and the weakestanchoring effects when primitive beliefs are sharply defined. For example, ifindividuals have heterogeneous but sharply defined beliefs, then one shouldobserve very little effect from anchors at different quantiles of the distribution ofopen-ended responses.The experiment described in this paper demonstrates that the patterns of
response to open-ended and referendum questions that are often taken as evidenceof incentive-induced misrepresentation are in fact present in situations where thereare clearly no economic incentives. This suggests that the emphasis in the CVliterature on economic incentives may be misplaced, and that purely psychometricelements in survey response deserve more attention.
4. An experiment on anchoring in CV and objective estimation
We next report a study in which the experimental design of Jacowitz and! .Kahneman 1995 was used to compare referendum and open-ended formats in
objective estimation tasks and in WTP for public goods. We document thesimilarity of results, and provide suggestive evidence that patterns of anchoringbias can be predicted from the characteristics of the distribution of responses to anopen-ended question.The subjects in this experiment were 370 adult volunteers, recruited from
visitors to the San Francisco Exploratorium, a science museum. Volunteers werepaid US$2 and informed that a US$1 contribution would be made to the museum.

( )D. Green et al.rResource and Energy Economics 20 1998 85–11696
The volunteers completed immediately at tables provided for this purpose awritten questionnaire on five valuation and estimation tasks; typical completion
! .time for the five tasks was 5–8 min. Subjects in a calibration group Ns121were recruited first. They were asked in an open-ended format for WTP for twopublic goods and for estimates of three objective quantities:1. WTP per year to save 50,000 offshore Pacific Coast seabirds from smalloffshore oil spills, until ways are found to prevent spills or require owners oftankers to pay for the operation.
2. Estimate the height in feet of the tallest redwood in California.3. Estimate the number of gallons of gasoline, on average, used by an individualcar owner in the US in one month.
4. Estimate the average number of inches of rainfall that fall each year at MountWialeale in Hawaii, the wettest spot on earth.
5. WTP per year for California highway improvements and enforcement of trafficlaws that in five years will reduce the number of traffic accidents by 20%.The questions were asked in the order above, but subjects could look ahead or
review their responses. Next, five anchor values were selected for each task, atapproximately the 25, 50, 75, 90, and 95 percentiles of its calibration distribution.Five versions of the anchored questionnaire were prepared that cycled through theanchor values for each of the five questions. The remaining subjects were assignedrandomly to one of five anchor groups, corresponding to the five versions of theanchored questionnaire. Anchor group subjects answered pairs of questions abouteach of the five topics. For the two WTP questions, subjects were first asked ifthey would vote in favor of a referendum that would require them to pay theanchor amount of money per year if the proposal were implemented. Then, theywere asked to state the maximum amount at which they would vote for that cause.For the estimation questions, subjects were first asked whether the quantity wasmore than the anchor value, then asked to give their best estimate for thequantity. 6The results of the experiments are described in Tables 1–5, corresponding to
each of the tasks. The first panel in each table summarizes the empiricaldistributions of open-ended responses, obtained respectively from the calibrationgroup and from the follow up questions to each of the anchored groups after theyresponded to the starting point bid. The robust pattern of response is that thehigher the starting point bid, the greater the upward shift in the distribution ofresponses. The second panel gives the probabilities that the calibration andbinomial referendum responses exceed each starting point bid. As in Jacowitz and
! .Kahneman 1995 , anchoring leads the corresponding probabilities for the calibra-
6 Appendices with sample procedures, questionnaires, data, and extensive graphs are available at theweb site http:rremlab.berkeley.edurusersrmcfaddenrindex.html.

( )D. Green et al.rResource and Energy Economics 20 1998 85–116 97
Table 1Willingness-to-pay to save 50,000 off-shore seabirds per yearDistribution Open- Starting-point bid
ended US$5 US$25 US$60 US$150 US$400
US$0–4.99 19.8% 12.2% 8.5% 0.0% 8.3% 12.0%US$5–24.99 27.3% 67.4% 25.5% 41.7% 29.2% 22.0%US$25–59.99 31.4% 12.2% 53.2% 14.6% 27.1% 20.0%US$60–149.99 12.4% 8.2% 8.5% 41.7% 16.7% 18.0%US$150–399.99 5.0% 0.0% 2.1% 2.1% 18.8% 10.0%US$400q 4.1% 0.0% 2.1% 0.0% 0.0% 18.1%Sample size 121 49 47 48 48 50
!P open-ended response 80.2% 52.9% 21.5% 9.1% 4.1%.Gbid
! .Std. error 3.6% 4.5% 3.7% 2.6% 1.8%! .P Referendum YesrBid 87.8% 66.0% 43.8% 18.8% 18.0%
! .Std. error 4.7% 6.9% 7.2% 5.6% 5.4%Median openrfollow-up US$25.00 US$10.00 US$25.00 US$25.00 US$43.00 US$50.00response! .Std. error US$6.03 US$2.33 US$1.16 US$14.04 US$10.87 US$23.41
aMean openrfollow-up US$64.25 US$20.30 US$45.43 US$49.42 US$60.23 US$143.12response! .Std. error US$13.22 US$3.64 US$12.61 US$6.51 US$8.59 US$28.28
Coefficient Std. errorMarginal effect of starting point bid 0.284 0.032K–J interquartile anchoring 0.273 0.136
bindexcNonparametric referendum mean US$167.33 US$76.90
Referendum multiplier 2.60 1.31Parametric referendum mean US$265.59 US$138.96Referendum multiplier 4.13 2.32
aOne observation of US$2,000,000 is excluded from the calculation of the open-ended mean.b If the open-ended mean WTP of US$64.25 were representative of all California adults, then the totalstate WTP for protecting 50,000 seabirds would be US$1.49 B, or US$29,800 per bird.cThe upper bound to the distribution is assumed to equal the largest anchored response, US$1000. Thereported std. error is the RMSE at the maximum possible bias, given the upper bound to thedistribution.
tion and referendum responses to differ, with higher probabilities of ‘Yes’ fromthe referendum elicitation in most instances. These differences are statisticallysignificant: using a chi-square test, the automobile accident question yieldsdifferences significant at the 10%-level, and the remaining questions yield differ-ences significant at the 1%-level. Also given in the second panel are measures oflocation of the distributions of calibration and anchored follow up responses. Theconventional standard errors of the means are reported. The standard errors of themedians are estimated by bootstrapping, using 1000 resamplings of the observedsample. We tested the hypotheses of common medians among the groups withdifferent starting point bids, and among these groups plus the calibration group.

( )D. Green et al.rResource and Energy Economics 20 1998 85–11698
Table 2Height in feet of the tallest redwood in CaliforniaDistribution Open-ended Starting-point bid
180 280 370 550 1200
0–179 26.5% 8.7% 8.9% 4.4% 2.2% 12.8%180–279 23.1% 54.4% 8.9% 10.9% 11.1% 6.4%280–369 26.5% 23.9% 42.2% 6.5% 26.7% 17.0%370–549 14.9% 10.9% 26.7% 56.5% 4.4% 14.9%550–1199 4.1% 2.2% 11.1% 19.6% 53.3% 17.0%1200q 5.0% 0.0% 2.2% 2.2% 2.2% 31.9%Sample size 120 46 45 46 45 47! .P Open-ended responseGbid 73.6% 50.4% 24.0% 9.1% 5.0%
! .Std. error 4.0% 4.6% 3.9% 2.6% 2.0%! < .P Referendum Yes Bid 91.3% 82.2% 78.3% 55.6% 31.9%
! .Std. error 4.2% 5.7% 6.1% 7.4% 6.8%Median openrfollow-up response 225.0 250.0 350.0 435.0 600.0 500.0! .Std. error 29.1 10.7 20.7 27.3 107.9 227.0
aMean openrfollow-up response 490.8 282.0 407.0 465.7 570.4 844.2! .Std. error 107.9 21.4 38.4 31.0 43.9 100.8
Coefficient Std. errorMarginal effect of starting point bid 0.513 0.057K–J interquartile anchoring index 0.974 0.198Nonparametric referendum meana 975.1 359.8Referendum multiplier 1.99 0.85Parametric referendum mean 1196.1 283.5Referendum multiplier 2.44 0.79True value 366.2Open-ended bias 34.0%Single referendum biasNonparametric 166.3%Parametric 226.6%
aThe upper bound to the distribution is assumed to equal the largest anchored response, 2700. Thereported std. error is the RMSE at the maximum possible bias, given the upper bound to thedistribution.
Both of these hypotheses were rejected at the one percent significance level for allfive topics. Similar hypotheses were tested for common means: all were rejected atthe one percent level except for the gasoline question where rejection was at thetwo percent level. We conclude that anchoring effects are significant in both CVand objective estimation questions, for both the referendum response to a startingpoint bid, and the continuous response to the follow up question.The third panel in Tables 1–5 contains summary statistics for the anchoring
effect. The marginal effect of the starting point bid is obtained by regressing the

( )D. Green et al.rResource and Energy Economics 20 1998 85–116 99
Table 3Average monthly gasoline use by car ownersDistribution Open-ended Starting-point bid
40 52 70 95 180
0–39 22.5% 25.0% 16.7% 10.2% 16.7% 2.1%40–51 35.8% 31.3% 22.9% 24.5% 29.2% 25.5%52–69 14.2% 22.9% 27.1% 12.2% 16.7% 21.3%70–94 15.0% 8.3% 27.1% 30.6% 12.5% 14.9%95–179 10.0% 10.4% 6.2% 20.4% 25.0% 19.1%180q 2.5% 2.1% 0.0% 2.0% 0.0% 17.0%Sample size 120 48 48 49 48 47! .P Open-ended responseGbid 77.5% 41.7% 27.5% 12.5% 2.5%
! .Std. error 3.8% 4.5% 4.1% 3.0% 1.4%! < .P Referendum Yes Bid 75.0% 60.4% 53.0% 25.0% 17.0%
! .Std. error 6.3% 7.1% 7.1% 6.3% 5.5%Median openrfollow-up response 50.0 50.0 60.0 75.0 60.0 75.0! .Std. error 0.9 2.9 2.8 8.3 5.7 9.6
aMean openrfollow-up response 63.4 63.2 58.8 88.7 68.0 102.9! .Std. error 6.8 8.1 3.0 19.3 5.1 12.6
Coefficient Std. errorMarginal effect of starting point bid 0.275 0.112K–J interquartile anchoring index 0.833 0.698
aNonparametric referendum mean 150.6 86.9Referendum multiplier 2.38 1.39Parametric referendum mean 99.4 13.4Referendum multiplier 1.57 0.27True value 55.9Open-ended bias 13.4%Non-parametric referendum bias 169.5%Parametric referendum bias 77.8%
aThe upper bound to the distribution is assumed to equal the largest anchored response, 1000. Thereported std. error is the RMSE at the maximum possible bias, given the upper bound to thedistribution.
follow up responses of subjects in the anchored groups on the starting point bids.For example, 0.284 in Table 1 is the slope coefficient from this regression, andcan be interpreted as the increase in average open-ended follow up WTP when thestarting point bid is increased by one dollar. The marginal effects for all tasks aresignificantly different from zero at the one percent significance level. Jacowitz and
! .Kahneman 1995 introduce an anchoring index, defined as the difference in themedian responses of groups at high and low anchors, divided by the difference inthe anchors. Here we calculate this index using the first and third bids, whichcorrespond approximately to the interquartile range in the calibration group

( )D. Green et al.rResource and Energy Economics 20 1998 85–116100
Table 4Annual rainfall at wettest spot on earthDistribution Open-ended Starting-point bid
45 106 260 410 700
0–44 25.6% 10.0% 9.3% 2.2% 7.0% 0.0%45–105 26.4% 72.5% 25.6% 13.0% 4.7% 8.2%106–259 22.3% 15.0% 46.5% 34.8% 18.6% 20.4%260–409 13.2% 0.0% 16.3% 43.5% 32.6% 22.5%410–699 7.4% 2.5% 2.3% 6.5% 34.9% 20.4%700q 5.0% 0.0% 0.0% 0.0% 2.3% 28.6%Sample size 121 40 43 46 43 49! .P Open-ended responseGbid 74.4% 47.9% 25.6% 12.4% 5.0%
! .Std. error 4.0% 4.5% 4.0% 3.0% 2.0%! < .P Referendum Yes Bid 90.0% 65.1% 50.0% 37.2% 28.6%
! .Std. error 4.7% 7.3% 7.4% 7.4% 6.5%Median openrfollow-up response 100.0 65.0 120.0 255.0 365.0 400.0! .Std. error 10.2 5.6 18.2 30.2 28.9 56.6
aMean openrfollow-up response 187.6 87.8 162.3 246.9 346.2 489.5! .Std. error 20.9 14.3 17.2 18.2 26.8 41.5
Coefficient Std. errorMarginal effect of starting point bid 0.591 0.039K–J interquartile anchoring index 0.884 0.108Nonparametric referendum meana 382.5 91.1Referendum multiplier 2.04 0.54Parametric referendum mean 920.3 410.5Referendum multiplier 4.90 2.25True value 451.0Open-ended bias y58.4%Nonparametric referendum bias y15.2%Parametric referendum bias 104.1%
aThe upper bound to the distribution is assumed to equal the largest anchored response, 1000. Thereported std. error is the RMSE at the maximum possible bias, given the upper bound to thedistribution.
distribution. By these measures, there is a strong anchoring effect in open endedfollow up responses for all tasks, with the greatest impact for the redwood andrainfall estimation tasks that offer the least opportunity for deductive reasoning orproblem solving. One might expect that CV responses would be less sensitive toanchoring at specified quantiles than are objective questions, since some portion ofthe dispersion of CV responses should arise from heterogeneity of tastes that forthe individual are relatively sharply defined and hence relatively invulnerable toanchoring bias. The marginal effect of starting point bid is lowest for the CVtasks, supporting this expectation, but overall the anchoring patterns for the CV

( )D. Green et al.rResource and Energy Economics 20 1998 85–116 101
Table 5Willingness-to-pay to reduce CA auto accidents by 20%Distribution Open- Starting-point bid
ended US$5 US$25 US$60 US$150 400
US$0–4.99 13.3% 23.4% 15.9% 18.4% 12.8% 14.6%US$5–24.99 36.7% 51.1% 20.5% 28.6% 19.1% 20.8%US$25–59.99 17.5% 17.0% 40.9% 24.5% 25.5% 25.0%US$60–149.99 20.0% 8.5% 13.6% 28.6% 14.9% 18.8%US$150–399.99 7.5% 0.0% 4.5% 0.0% 23.4% 8.1%US$400q 5.0% 0.0% 4.5% 0.0% 4.3% 12.5%Sample size 121 47 44 49 47 48!P Open-ended response 86.7% 50.0% 32.5% 12.5% 5.0%
.Gbid! .Std. error 3.1% 4.5% 4.3% 3.0% 2.0%! < .P Referendum Yes Bid 76.6% 63.5% 28.6% 27.7% 12.5%
! .Std. error 6.2% 7.3% 6.5% 6.5% 4.8%Median openrfollow-up US$22.50 US$7.50 US$25.00 US$30.00 US$50.00 US$50.00response! .Std. error US$6.21 US$2.78 US$4.00 US$5.46 US$14.88 US$13.45
aMean openrfollow-up US$97.82 US$19.37 US$60.45 US$37.02 US$110.66 US$115.03response! .Std. error US$22.39 US$3.95 US$16.20 US$4.89 US$33.28 US$26.43
Coefficient Std. errorMarginal effect of starting-point bid 0.216 0.090K–J interquartile anchoring index 0.409 0.114
bNonparametric referendum mean US$178.88 US$102.12Referendum multiplier 1.83 1.12Parametric referendum mean US$404.19 US$282.30Referendum multiplier 4.13 3.04
a If the open-ended mean of US$97.82 were representative of the WTP of Californians, then theresidents of the state would be willing to pay US$2.27 B to reduce automobile accidents by 20%, or
!approximately US$8258 per accident avoided. For comparison, California spends US$5.63 B State.Plus Federal on highway construction and improvement each year.
bThe upper bound to the distribution is assumed to equal the largest anchored response, US$1500. Thereporter std. error is the RMSE at the maximum possible bias, given the upper bound to thedistribution.
and objective estimation tasks are remarkably similar. One possible explanation isthat many subjects have poorly defined tastes for the CV issues in this study, andare strongly influenced by the anchor cues; another is that the bid establishes a‘norm’ for socially responsible behavior that some subjects are reluctant to violate.The usual objective of CV studies is estimation of social value, given by
population mean WTP. For referendum data, this estimation requires eithernonparametric statistical analysis, or an assumption that the WTP distribution iscontained in a parametric family whose parameters can be estimated by maximumlikelihood. We report estimates using both approaches.

( )D. Green et al.rResource and Energy Economics 20 1998 85–116102
The nonparametric referendum mean is an estimate of a population mean WTP! .derived from the binomial single referendum responses, as follows: Let F v
denote the CDF of population WTP that is supposed to explain referendum! . ! .response; e.g., for each bid b, P WTPFb sF b . Assume responses are
non-negative. Then, the population mean satisfies:q` q`
XE WTP s vF v dvs 1yF v dv ,! . ! . ! .H H0 0
with the second equality obtained using integration by parts. Suppose b arei!referendum bids for is1, . . . ,K , augmented by b s0 and b sa postulated0 Kq1
.upper limit on the WTP distribution . Partitioning the domain of integration and! .evaluating F v at the end points gives the bounds:
K Kb yb 1yF b FE WTP F b yb 1yF b ,! . ! . ! . ! . ! ." "iq1 i iq1 iq1 i i
is0 is0
! .Letting F b denote sample estimates of the probabilities of ‘No’ at theN i! .referendum points, a nonparametric approximation to E WTP is:
KE WTP f b yb 1y F b qF b r2 .! . ! . ! . ! .! ." iq1 i N iq1 N i
is0
The nonparametric referendum means given in Tables 1–5 are obtained using thisapproximation. 7 The referendum multiplier is the ratio of the estimated referen-dum mean to the estimated mean from the calibration group. This is an index ofthe degree to which estimates of population mean are sensitive to the elicitationformat, with values greater than one corresponding to the case where the meanestimated from the binomial single referendum responses exceeds the open-endedresponse mean.For the rainfall task, Fig. 1 graphs the complementary CDF estimated from the
sample proportions of ‘Yes’ responses to each referendum bid. For comparison,the sample proportions of open-ended responses at these bids are plotted in thesame way. The nonparametric mean estimator above can be interpreted as anestimate of the area under this empirical referendum complementary CDF. Simi-larly, the mean of the open-ended responses can be interpreted as the area underthe empirical open-ended complementary CDF. The rightward shift of the referen-dum curve relative to the open-ended curve implies a referendum multipliergreater than one. The remaining tasks produce similar graphs.
! . ! .An alternative to estimating E WTP nonparametrically is to assume that F vis in a parametric family, estimate these parameters by maximum likelihood usingthe referendum response data, and then report the parametric referendum mean ofthis estimated distribution. This is the approach most commonly adopted by CV
7 K ! .2 ! .! ! ..The variance of this estimator is " b yb F b 1yF b rn ; and the maximum biasis1 iq1 iy1 i i iK ! . ! .is b r2q" b y2b qb F b r2.1 is1 iq1 i i -1 i

( )D. Green et al.rResource and Energy Economics 20 1998 85–116 103
Fig. 1. Rainfall at wettest spot.
! .practitioners. To apply this method, we assume that F P has a log normaldistribution. Then, the log likelihood of the referendum response data is:
5 log b ym log b ym! . ! .i iˆ ˆLs n F P 1yF q 1yF PF ,! ." i i i# 5$ / $ /s sis1
ˆwhere n is the number of observations in anchor group i, F is the samplei ifrequency of ‘No’ responses to starting point bid b , and m and s are parameters.i
w 2 xIf WTP has this distribution, then its mean is exp mqs r2 . The parametricreferendum means in Tables 1–5 are given by this expression, evaluated at themaximum likelihood estimates. A referendum multiplier is also given for thisreferendum mean estimator. Consistent with the previous results based on non-parametric methods, the parametric estimates indicate that in all five tasks, thereferendum multipliers are substantially larger than one, showing that the singlereferendum format leads to much higher estimates of mean response than doopen-ended questions. These results appear to be typical of tasks where beliefs are
! .skewed to the right because of a natural lower bound at zero , and where theanchors are either balanced or skewed to the right relative to the calibrationdistribution. 8 The standard errors on the statistics that compare the open-endedand referendum means are large, reflecting the intrinsic statistical difficulty in
8 Presumably, tasks with a natural upper bound that causes the calibration distribution to be skewedto the left, andror anchors that are skewed to the left relative to the calibration distribution, wouldreverse the effect and produce anchor responses with means lower than the open-ended responses.

( )D. Green et al.rResource and Energy Economics 20 1998 85–116104
Table 6Kolmogorov–Smirnov tests for log normalityTask Calibration Anchor 1 Anchor 2 Anchor 3 Anchor 4 Anchor 5
sample sample sample sample sample sample)) ))Seabirds 0.127 0.129 0.204 0.173 0.096 0.105)Redwoods 0.157 0.138 0.177 0.136 0.168 0.130
Gasoline 0.104 0.159 0.173 0.192 0.098 0.156)) )Rainfall 0.064 0.142 0.222 0.167 0.206 0.112
Accidents 0.089 0.184 0.138 0.174 0.093 0.115
Only positive observations are used. Statistics significant at the 10% level are denoted) , and statisticssignificant at the 5% level are denoted)). Significance levels are calculated from the asymptoticdistribution of the K–S statistics, without adjustment for the presence of estimated parameters.
estimating a moment that is sensitive to the thickness of the upper tail of thedistribution of WTP. 9Because a subject gave responses to all five tasks, and in the written question-
naire had the opportunity to preview or review all responses, we tested to see ifanswers to different tasks were correlated. We found a significant positivecorrelation of calibration and anchored follow up responses between the two CVtasks, and zero correlation between an objective estimation task and any of theremaining tasks. The correlation between CV tasks is consistent with the com-monly observed correlation of CV responses and income. The experiment did notcollect socioeconomic data, so we are unable to report the partial correlation of theCV responses with income controlled. 10Kolmogorov–Smirnov tests of the parametric assumption of a log normal
family are given in Table 6. In most cases, the log normal specification isaccepted. However, the power of this test is low, and close examination indicatesthat deviations arising from concentration of responses at focal points would belikely to lead to rejection in larger samples. For example, 65% of all open-endedresponses to the CV question on seabirds fell at the values US$5, US$10, US$20,
9 All standard errors are calculated by the delta method, except for the nonparametric mean wherewe report an RMSE for the worst bias case, giÕen the postulated upper bound on the distribution.Because of the conditioning in this RMSE, in some cases the nonparametric measure of imprecision is
! .smaller than the parametric measure. McFadden 1994 points out that median WTP can be estimatedmuch more robustly than the mean WTP in open-ended data, but not in binomial referendum data.However, while the median is a useful statistic for comparing distributions, it can be a badly biasedmeasure of mean WTP, the relevant economic definition of social value, in a population where thedistribution of individual WTP is skewed.10 ! .McFadden 1994 points out that for estimating mean WTP in a target population, there is often no
statistical advantage in observing covariates such as income and first estimating conditional WTP givenincome, and potentially some loss of robustness by doing so. In any case, in these experiments wheretreatments are randomized, there is no statistical necessity to control income or other demographicfactors.

( )D. Green et al.rResource and Energy Economics 20 1998 85–116 105
US$25, US$50, and US$100; this fraction is about the same in both the unan-chored and the anchored groups. The auto accident question yields 58% ofresponses at these focal points. Similar patterns emerge in responses to theestimation questions: 38% of redwood responses are at 100, 200, 300, 400, or 500ft; 49% of gasoline responses are at 40, 50, 60, 75, and 100 gallons; 36% ofrainfall responses are at 100, 200, 300, 400, or 500 inches. Across the five tasks,there are no consistent or statistically significant differences in the overall propor-tions of focal point responses between open-ended and anchored follow upresponses. Thus, anchoring appears to operate by moving some subjects from onefocal point to a second closer to the anchor, rather than by pulling them away fromfocal points. This implies that the pull of anchoring has a complex interaction withthe pull of focal points. The experimental results on the CV questions suggest thatin an open-ended follow up to a referendum bid that is located at a focal point,such as US$25, subjects tend to give a higher proportion of open-ended follow upresponses at the exact bid than is the case for unanchored response. Thus, thereappears to be some reinforcement of the anchoring effect when the anchor is at afocal point. This pattern does not emerge in the estimation tasks. Other than theseobservations, there are no obvious differences in the anchoring power of bidsplaced at focal points or at non-focal points, or differences between CV andestimation tasks in the interaction of anchors and focal points.The accuracy of open-ended versus referendum estimates of objective quantities
is incidental to this paper, but some readers may want to know how subjects do.The bottom panel in Tables 2–4 gives the true values, and the percent bias in themean estimates obtained from the open-ended responses of the calibration group,and from the nonparametric and parametric referendum means; Table 7 summa-rizes the comparisons across tasks. Open-ended estimates are moderately accuratefor the redwoods and gas consumption tasks, and too low for the rainfall task. Thereferendum responses are, by the parametric mean measure, biased upward by afactor of two or more on all tasks. By the nonparametric mean measure, thereferendum responses have a substantial upward bias for redwoods and gasconsumption tasks, and are reasonably accurate for the rainfall task. These results
Table 7Comparison of behavior across tasksCriterion Seabirds Redwoods Gasoline Rainfall Accidents
Marginal effect of starting point bid 0.284 0.153 0.275 0.591 0.216K–J interquartile anchoring index 0.273 0.974 0.833 0.884 0.409Nonparametic referendum multiplier 2.60 1.99 2.38 2.04 1.83Parametic referendum multiplier 4.13 2.44 1.57 4.90 4.13Bias in open-ended mean NA 34.0% 13.4% y58.4% NABias in nonparametic referendum multiplier NA 166.3% 169.5% y15.2% NABias in parametic referendum multiplier NA 226.6% 77.8% 104.1% NA

( )D. Green et al.rResource and Energy Economics 20 1998 85–116106
suggest that for tasks with a natural lower bound at zero, estimating the mean frombinomial referendum data may substantially and systematically inflate theseestimates relative to true values. The open-ended responses do not appear to besystematically biased, but do show that population beliefs about objective facts aresoberingly inaccurate.The contingent valuation questions described in Tables 1 and 5 have no
objective benchmark against which they can be judged, but it is possible to askwhether the implied mean values appear to be consistent with past political andsocial choices. The accidents question in Table 5 reflects a substantial usercomponent to value. If subjects interpret the benefits and costs as perpetuities,then given accident frequencies in California, the mean open-ended responsewould imply that the sampled sub-population of Californians are willing to payUS$8258 to avoid an accident. This number is in the ballpark of actual accidentcosts. The referendum parametric mean response is four times this amount. Theseabirds question in Table 1 elicits existence Õalue by making it clear that thebirds are off shore where they will not be observed by humans. If the open-endedmean WTP of US$64.25 were representative of California adults, it would imply atotal WTP by Californians of nearly US$30,000rbird saved; the referendumparametric mean response is four times larger. These results follow a patternobserved in CV studies that for goods with use value, mean WTP may bereasonably consistent with revealed market values, while for goods with onlyexistence value, estimated WTP seems high relative to the cost of interventionsthat survive the existing political process. Society may in fact seriously under-in-vest in the environmental resource ‘commons’, but upward bias in estimated WTPmay be another reason for the striking numbers that come out of some CV studies.The similarity of anchoring effects across a variety of topics raises the question
of whether anchoring behavior is sufficiently regular to be predictable. Both thedispersion of responses in the population and the degree of anchoring is less fortopics where there is more prior information or narrower natural bounds. Thissuggests using the distribution of calibration group responses as a benchmark forthe measurement of anchoring effects, in the spirit of the Kahneman–Jacowitz
! .anchoring index. Let psF v denote the CDF of open-ended responses, and! .rsG v;b denote the CDF of responses to the open-ended follow up to a starting
! . ! y1! . y1! .. ! .point bid b. Define qsF b and rsG F p ;F q 'c p;q . Then, c isa CDF that will be shifted by anchoring when q changes, but may be relativelystable across tasks for a fixed anchoring percentile q. If there are primitive beliefsthat are themselves heterogeneous in the population, as in valuation questionswhere subjects may have disperse but sharply defined tastes, the function cshould be defined by first forming the functions above conditional on primitivebeliefs, and then forming the expectation with respect to the distribution of thesebeliefs. The more dispersed the primitive beliefs, the weaker the effects ofanchoring for a given observed distribution of open-ended responses. While weuse c purely as a descriptive device, it could be given a Bayesian interpretation as

( )D. Green et al.rResource and Energy Economics 20 1998 85–116 107
Fig. 2. Rainfall.
an inverse posterior distribution formed by combining a prior F with a bid b thatis treated as an observation drawn from this distribution.Fig. 2 plots estimates of the c functions for the rainfall task, obtained using the
!calibration and anchored empirical CDFs, smoothed to be continuous. The! .smoothing method first obtains the empirical analogs of psF v and rs
! .G v;b , defined at all responses w that appear in either the unanchored or theanchored groups. The empirical analog of F is then inverted, with linear interpola-tion between unanchored responses used to construct a unique inverse. Finally, the
! y1! . . ! . ! .empirical analog of rsG F p ;b 'c p,q for qsF b is calculated and! ! X .. ! < X <smoothed using a kernel smoother in p-space, cos 10p p yp P1 p yp -
. !0.05 . This can also be interpreted as a weighted symmetric nearest neighbor.estimator. The anchoring point for an anchored CDF is denoted by a dot in Fig. 2;
this also indicates the relationship between the single referendum binomial re-sponse and the probability that the open-ended responses are no greater than thestarting point bid. An estimate of the CDF of WTP from the referendum binomialresponses can be interpreted as a curve fitted to these dots. If there were noanchoring, then c would coincide with the 458 diagonal. When dots are below thediagonal, there is inflation in reported values at this anchor relative to open-endedresponses. When the anchored curve is a steep ogive through the dot correspond-ing to its anchor value, the anchoring concentrates responses as well as attractingthem toward the anchor. Over a wide range of ‘plausible’ anchor values, onewould expect higher anchors to shift the c function to the right, so that thesefunctions for high anchoring percentiles q should stochastically dominate those for
! .low q; i.e., c p;q should be a non-increasing function of q. Anchors drawn fromthe extreme tails of the F distribution may be less powerful, because they are

( )D. Green et al.rResource and Energy Economics 20 1998 85–116108
discounted as implausible, so that c may decrease less rapidly, or even reversedirection, with increasing q near the extremes.The empirical curves do show some reversals that violate stochastic dominance,
as one would expect given the relatively small anchor group sample sizes.! .However, the overall patterns are consistent with 1 stochastic dominance of
distributions conditioned on higher anchors over those conditioned on lower! . ! .anchors, 2 some degree of concentration about the anchors, and 3 referendum
multipliers exceeding one for anchors at the 50th percentile and higher. It isbeyond the resolution of these experiments to determine if there are dominancereversals in the tails of the anchored follow up responses, or between anchorsdrawn from the extreme tails of the unanchored distribution. The c curves for theremaining tasks show roughly the same pattern as the rainfall task, but dominancereversals are more common.Fig. 3 compares the c curves across tasks for 50 percentile anchoring bids. The
‘smoothed stair-step’ shapes of the curves arise from smoothing observations thatcontain focal points. There are some variations across tasks in the effect ofanchoring on the binomial response, with Tasks 2 and 4 showing the mostsubstantial upward shift in location. The degree of concentration appears to becomparable across tasks. Similar patterns emerge for the 25, 75, 90, and 95percentiles.The match of the curves for different tasks, holding the percentile fixed, is
! .imperfect. A simple hypothesis which says that c p;q is the same for every!task, given q, can be rejected statistically; Table 8 gives the test statistics the
.extensive statistical foundation for these tests is relegated to Appendix A . Thissuggests that there are some features of anchoring that are idiosyncratic to
Fig. 3.
( )D. Green et al.rResource and Energy Economics 20 1998 85–116 109
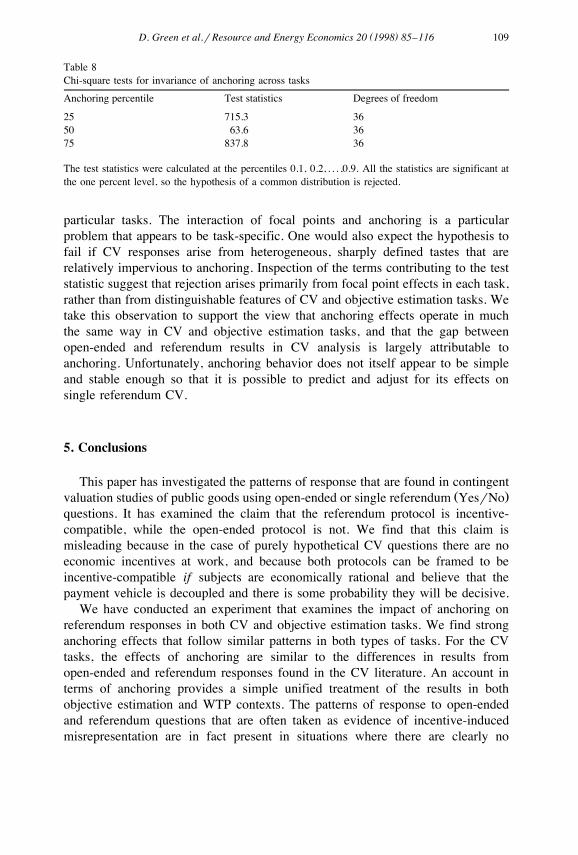
Table 8Chi-square tests for invariance of anchoring across tasksAnchoring percentile Test statistics Degrees of freedom
25 715.3 3650 63.6 3675 837.8 36
The test statistics were calculated at the percentiles 0.1, 0.2, . . . ,0.9. All the statistics are significant atthe one percent level, so the hypothesis of a common distribution is rejected.
particular tasks. The interaction of focal points and anchoring is a particularproblem that appears to be task-specific. One would also expect the hypothesis tofail if CV responses arise from heterogeneous, sharply defined tastes that arerelatively impervious to anchoring. Inspection of the terms contributing to the teststatistic suggest that rejection arises primarily from focal point effects in each task,rather than from distinguishable features of CV and objective estimation tasks. Wetake this observation to support the view that anchoring effects operate in muchthe same way in CV and objective estimation tasks, and that the gap betweenopen-ended and referendum results in CV analysis is largely attributable toanchoring. Unfortunately, anchoring behavior does not itself appear to be simpleand stable enough so that it is possible to predict and adjust for its effects onsingle referendum CV.
5. Conclusions
This paper has investigated the patterns of response that are found in contingent! .valuation studies of public goods using open-ended or single referendum YesrNo
questions. It has examined the claim that the referendum protocol is incentive-compatible, while the open-ended protocol is not. We find that this claim ismisleading because in the case of purely hypothetical CV questions there are noeconomic incentives at work, and because both protocols can be framed to beincentive-compatible if subjects are economically rational and believe that thepayment vehicle is decoupled and there is some probability they will be decisive.We have conducted an experiment that examines the impact of anchoring on
referendum responses in both CV and objective estimation tasks. We find stronganchoring effects that follow similar patterns in both types of tasks. For the CVtasks, the effects of anchoring are similar to the differences in results fromopen-ended and referendum responses found in the CV literature. An account interms of anchoring provides a simple unified treatment of the results in bothobjective estimation and WTP contexts. The patterns of response to open-endedand referendum questions that are often taken as evidence of incentive-inducedmisrepresentation are in fact present in situations where there are clearly no

( )D. Green et al.rResource and Energy Economics 20 1998 85–116110
economic incentives. We conclude that the emphasis in the CV literature oneconomic incentives is misplaced, and that psychometric elements in surveyresponse deserve more attention.Our analysis suggests a number of additional questions that could be addressed
with further experiments. Are the dispersion of answers to objective tasks and thesusceptibility of subjects to anchoring sensitive to incentive payments for accu-racy? Are measures such as the K–J Interquartile Anchoring Index attenuated forobjective tasks with heterogeneous true answers? 11 Are anchors at focal responselevels more or less effective than anchors at non-focal levels? Do calibration orfollow up open-ended focal responses represent heuristics to ration effort that canbe refined by probing, or do they reflect more fundamental ways in which humansorganize quantitative information? Are there factors beyond skewness of thecalibration distribution, such as experimenterrsubject interaction, that determinewhether the referendum multipliers for anchors at the calibration median aregreater than one? In an experimental setting where subjects are decisive, dosubjects show ‘free-rider’ incentive effects if and only if the payment vehicle iscoupled? Are ‘free-rider’ effects stronger in a non-decisive experiment with acoupled payment vehicle than they are in a decisive experiment? In a public goodslaboratory experiment where the pay-offs to subjects are heterogeneous anduncertain, does referendum CV provide accurate statements of WTP?An open-ended format is a natural standard for objective estimation tasks.
However, we do not endorse open-ended CV as a reliable ‘unbiased’ protocol. Weshare the skepticism of some authors about the reliability of contingent valuation
!of public goods, particularly for existence values see Hausman, 1993; Diamond.and Hausman, 1994 . We do conclude that the single referendum protocol is
statistically inefficient, and for tasks with a natural lower bound tends to givemean responses that are systematically higher than their open-ended counterparts.Then, one should be able to reduce variance in WTP estimates, and reduce therisk of obtaining results that are distorted by anchoring, by using an open-endedprotocol incorporating a decoupled payment vehicle, rather than a single referen-dum protocol.Because anchoring leads to estimates of referendum mean WTP that are
sensitive to the bid levels set by the experimenter, variation in experimental designacross researchers will in itself lead to inconsistencies in study outcomes. Moreseriously, single referendum CV invites manipulation of results by choice ofdesign. High mean WTP numbers can be obtained by selecting a design with highanchors. Conversely, using low anchors in combination with parameterizations orbounds that make the upper tail of the WTP distribution thin can be used to obtain
11 Examples are ‘What is your cholesterol count?’, ‘How many gallons of water did your householdconsume last month?’, and ‘How many dollars per month does your local library spend on newbooks?’.

( )D. Green et al.rResource and Energy Economics 20 1998 85–116 111
low mean WTP numbers. There do not appear to be any simple design rules that aresponsible CV practitioner could use to guarantee reliable, reproducible results.We believe that the referendum method for CV would benefit from very careful
examination of the effects of agenda setting, payment vehicles, framing, andexperimental design of bids. If CV practitioners adopt the referendum approach,we see no reason not to use an open-ended follow up to the starting bid, whichprovides far more information on WTP and information on plausibility of responsethan alternatives such as the double referendum method.
Acknowledgements
This study was supported by grants from AFOSR and the National ScienceFoundation to Danny Kahneman, and by a Cox Endowment grant to DanielMcFadden. We thank Quong Vong for useful comments.
( )Appendix A. Test statistic for the hypothesis that c p;q is invariant acrosstasks
! .For a specified task, let qsF v denote the CDF of unanchored responses,! .and let psG v;b denote the CDF of open-ended follow up responses to an
! . ! y1! . y1! .. y1! .anchor b. Define rsc p;q sG F p ;F q , where vsF p is the! . ! .smallest v satisfying F v Gp. Then, c p;q is the proportion of anchored
responses below unanchored percentile p when the anchor is at unanchored! .percentile q. The null hypothesis is that c P;q is invariant across tasks, given q.
We develop a large-sample test for this hypothesis under the assumptions that Fand G are continuously differentiable with positive densities f and g, respec-tively. These assumptions are inconsistent with the existence of point masses atfocal points, which appear in our data and cause jumps in c at arguments p
y1! .whose inverse images F p are focal point values. Since focal points appear tobe specific to the physical units and scaling of particular tasks, it seems unlikelythat the null hypothesis can be sustained in data where focal points are important.A statistical analysis of the full problem including jumps at focal points is beyondthe scope of this paper. The following analysis ignores the focal point problem. Innet, this should make the actual probability of rejection lower than the nominalprobability, since with jumps the limiting distribution involves mixtures of normaland point processes.
ˆ! .Let F v denote the empirical CDF of unanchored responses from a sample ofˆ! .size n , and G v;b denote the empirical CDF of open-ended responses, follow-c
ing up anchor bid b, from an anchored sample of size n . Suppose that b isaˆ! .selected so that F b is approximately equal to a specified percentile q . Then, the0ˆ ˆ ˆy1! . ! . ! ! . .empirical analog of c p;q is c p;q 'G F p ;b . Let lsn rn and0 o a c

( )D. Green et al.rResource and Energy Economics 20 1998 85–116112
y1 1r2 ˆ! . w ! . ! .x ! . ! . ! . ! .b sF q . Write n c p;q yc p;q sA p qB p qC p qD p0 0 a 0 0 1! . ! .qD p qD p , where:2 3
1r2 y1 y1ˆA p sn G F p ;b yG F p ;b ,! . ! . ! .! . ! .a 0 0
1r2 y1 y1ˆB p sn G F p ;b yG F p ;b ,! . ! . ! .! .! .a o 0
1r2 y1 y1 y1C p sn G F p ;b yG F p ;F q ,! . ! . ! . ! .! . ! .a 0
1r2 y1 y1 y1ˆ ˆ ˆ ˆD p sn G F p ;b yG F p ;b yG F p ;b! . ! . ! . ! .! .! . ! .1 a
y1qG F p ;b ,! .! .1r2 y1 y1 y1ˆ ˆD p sn G F p ;b yG F p ;b yG F p ;b! . ! . ! . ! .! . ! . ! .2 a 0
y1qG F p ;b ,! .! .01r2 y1 y1 y1ˆ ˆD p sn G F p ;b yG F p ;byG F p ;b! . ! . ! ! . ! .! . ! .3 a 0
y1qG F p ;b ,! .! .0! . ! .First, A p is an empirical process on 0,1 , with expectation zero and a
covariance function: 12
K p ;r sG Fy1 pnr ;b yG Fy1 p ;b PG Fy1 r ;b ,! . ! . ! . ! .! . ! . ! .A 0 0 0
which converges weakly to a normal process with the same covariance function;! .see p. 109 of Shorack and Wellner 1986 . Second, by the Bahadur representation
! .theorem Serfling, 1980, p. 91 , the empirical quantile process can be writtenˆ y1pyF F p! .! .y1 y1 y1r2F̂ p sF p q qo n .! . ! . ! .p cy1f F p! .! .
1r2 ˆ y1w ! ! ..xFurther, n pyF F p is an empirical process with covariance functioncpH rypPr that converges weakly to a Brownian bridge. Then, using the
! .continuous differentiability of G, B p converges weakly to a normal process withcovariance function:
y1 y1g F p ;b Pg F r ;b! . ! .! . ! .0 0 w xK p ;r sl P pnrypPr .! .B y1 y1f F p P f F r! . ! .! . ! .Third, using the Bahadur representation, b can be written:
ˆq yF b! .0 0 y1r2bsb q qo n q´ ,! .0 p cf b! .0where ´ is a disturbance introduced by rounding the anchor to a convenientnumber. We shall assume the rounding is done in such a way that its impact is
12 ! .pn qsmin p,q .

( )D. Green et al.rResource and Energy Economics 20 1998 85–116 113
1r2 ! . ! .asymptotically negligible; e.g., n ´so 1 . Then, C p is an empirical processc pwith covariance function:
G Fy1 p ;b PG Fy1 r ;b! . ! .! . ! .b 0 b 0K p ;r sl Pq 1yq ,! . ! .C 0 02f b! .0and converges weakly to a normal process. The processes B and C are correlated,with covariance function:
K p ;r 'EB p C r! . ! . ! .B,C
g Fy1 p ;b G Fy1 r ;b! . ! .! . ! .0 b 0slP P P pnq ypPq .! .0 0y1 f bf F p ! .! .! . 0
The process A is independent of the processes B and C. Then, the processAqBqC is asymptotically normal with expectation zero and covariance func-tion:
K p ;r sG Fy1 pnr ;b yG Fy1 p ;b PG Fy1 r ;b! . ! . ! . ! .! . ! . ! .AqBqC 0 0 0
y1 y1g F p ;b Pg F r ;b! . ! ! .! .0 0 w xql P pnrypPry1 y1f F p P f F r! . ! .! . ! .G Fy1 p ;b PG Fy1 r ;b! . ! .! . ! .b 0 b 0qlP Pq 1yq! .0 02f b! .0g Fy1 p ;b G Fy1 r ;b! . ! .! . ! .0 b 0q2lP P P pnq ypPq .! .0 0y1 f bf F p ! .! .! . 0
! .Finally, a lengthy argument, omitted here, establishes that the terms D p foriis1,2,3 are asymptotically negligible.Let ts1, . . . ,T index the tasks, and let it be g tsna1rnat the ratio of the
anchored sample sizes across tasks. Define a covariance function V with ele-ments:
g K t p ; pX qK 1 p ; pX if ts tX! . ! .t AqBqC AqBqCXXV p ; p s! .t , t X X1# K p ; p if t/ t! .AqBqC
for t,tXs2, . . . ,M. Let q denote a fixed anchoring percentile. We approximate a0generalized Cramer–von Mises test statistic by selecting a grid of comparison
! .percentiles p , p , . . . , p and considering the quadratic form:1 2 j
T JXt 1ˆ ˆ XQs c p ;q yc p ;q PG p , p! . ! . ! ." " j 0 j 0 t , t j j
X Xt , t s2 j , js1X X Xt 1ˆ ˆP c p ;q yc p ;q ,! . ! .j o j 0

( )D. Green et al.rResource and Energy Economics 20 1998 85–116114
where G is the inverse of V . Under the null hypothesis, this statistic is! .asymptotically chi-square with J Ty1 degrees of freedom. A limiting Cramer–
!von Mises statistic could be obtained by refining the grid see pp. 30–32 of.Durbin, 1973 . However, for this application we use directly the approximation
above.Calculation of V requires consistent estimates of the densities f and g and the
derivative G at q and p , . . . , p . We approximate these using the log normalb 0 1 japproximation to the distribution of responses:
f v s 1yp Pf log v ym rs rvs ,! . ! . ! .! .! .C C C C
g v ;b s 1yp b Pf log v ym b rs b rvs b ,! . ! . ! . ! . ! . ! .! . ! .! .where m and s are sample estimates of the mean and standard deviation of logc cresponse in the calibration sample, conditioned on observations being positive, pc
! . ! .is the proportion of zero observations in the calibration sample, and m b , s b ,! .and p b are corresponding estimates for the sample anchored at b. To approxi-
! . ! .mate G , we assume that locally s b is constant and m b sm qm b, andb 0 1! .estimate m by regressing log responses on log b across the anchor groups. Then,1
! . ! .G v;b sym g v;b rb. In large samples, these approximations should beb 1replaced by appropriate nonparametric density estimators.
References
! .Barten, A.P., Bohm, V., 1982. Consumer theory. In: Arrow, K., Intriligator, M. Eds. , Handbook ofMathematical Economics, Vol. 2, 381–429.
Bishop, R., Heberlein, T., 1979. Measuring values of extra-market goods: are indirect measuresbiased?. Am. J. Agric. Econ. 61, 926–930.
Bishop, R., Heberlein, T., Kealy, M., 1983. Contingent valuation of environmental assets: comparisonswith a simulated market. Natural Resour. J. 23, 619–633.
Bohm, P., 1972. Estimating willingness to pay: an experiment. Eur. Econ. Rev. 3, 111–130.Bowker, J., Stoll, J., 1988. Use of dichotomous choice nonmarket methods to value the whooping crane
resource. Am. J. Agric. Econ. 70, 372–381.Boyle, K., Bishop, R., 1987. Valuing wildlife in benefit-cost analysis: a case study involving
endangered species. Water Resour. Res. 23, 943–950.Boyle, K., Bishop, R., Welsh, M., 1985. Starting-point bias in contingent valuation bidding games.
Land Econ. 61, 188–194.Bradford, D., 1970. Benefit-cost analysis and demand curves for public goods. Kyklos 23, 775–791.Cameron, T., Huppert, D., 1991. Referendum contingent valuation estimates: sensitivity to the
assignment of offered values. J. Am. Stat. Assoc. 86, 910–918.Cameron, T., James, M., 1987. Efficient estimation methods for use with ‘closed-ended’ contingent
valuation survey data. Rev. Econ. Stat. 69, 269–276.Carson, R., Mitchell, R., Hanemann, M., Kopp, R., Presser, S., Ruud, P., 1992. A contingent valuation
study of lost passive use values resulting from the Exxon Valdez oil spill. Report to the AttorneyGeneral of the State of Alaska.
Ciriacy-Wanthrup, S., 1947. Capital returns from soil conservation programs. J. Farm Econ. 29,1188–1190.

( )D. Green et al.rResource and Energy Economics 20 1998 85–116 115
Cooper, J., Loomis, J., 1991. Economic value of wildlife resources in the San Joaquin Valley: hunting! .and viewing values, In: Dinar, A., Zilberman, D. Eds. , The Economics and Management of Water
and Drainage in Agriculture. Kluwer Academic, Boston.Cummings, R., Brookshire, D., Schulze, W., 1986. Valuing Environmental Goods. Rowman and
Littlefield: Savage, MD.Davis, R., 1963. Recreation-planning as an economic problem. Natural Resour. J. 3, 239–249.Desvousges, W., Johnson, R., Dunford, R., Boyle, K., Hudson, S., Wilson, N., 1992. Measuring
nonuse damages using contingent valuation: an experimental evaluation of accuracy. RTI Mono-graph 93-1: Research Triangle, NC.
Diamond, P., Hausman, J., 1994. Contingent valuation: is some number better than no number?, J.Econ. Perspectives.
Diamond, P., McFadden, D., 1974. Some uses of the expenditure function in public finance. J. PublicEcon. 3, 3–21.
! .Diewert, E., 1982. Duality approaches in microeconomic theory. In: Arrow, K., Intriligator, M. Eds. ,Handbook of Mathematical Economics, Vol. 2, 535–599.
Duffield, J., Patterson, D., 1991. Inference and optimal design for a welfare measure in dichotomouschoice contingent valuation. Land Econ. 67, 225–239.
Durbin, J., 1973. Distribution Theory for Tests Based on the Sample Distribution Function, SIAM:Philadelphia.
Folmer, H., van Ierland, E., 1989. Valuation methods and policy-making in environmental economics:! .relevance and scope. In: Folmer, H., van Ierland, E. Eds. , Valuation Methods and Policy-Making
in Environmental Economics. Studies in Environmental Science 36, Elsevier, Amsterdam.Gregory, R., Furby, L., 1987. Auctions, experiments, and contingent valuation. Public Choice 55,
273–289.Gregory, R., Lichtenstein, S., Slovic, P., 1991. Valuing environmental resources: a constructive
approach. Decision Research Discussion Paper, Eugene.Hanemann, M., 1984. Welfare evaluations in contingent valuation experiments with discrete responses.
Am. J. Agric. Econ. 66, 332–341.Hanemann, M., 1994. Contingent valuation and economics. J. Econ. Perspectives.
! .Hausman, J. Ed. , 1993. Contingent Valuation: A Critical Assessment. North Holland, Amsterdam.Hoehn, J., Randall, A., 1987. A satisfactory benefit-cost indicator for contingent valuation. J. Environ.
Econ. Manage. 14, 226–247.! .Hurwicz, L., 1986. Incentive aspects of decentralization. In: Arrow, K., Intriligator, M. Eds. ,
Handbook of Mathematical Economics, Vol. 3, 1441–1482.Jacowitz, K., Kahneman, D., 1995. Measures of anchoring in estimation tasks. Personality and Social
Psychology Bulletin, forthcoming.McConnell, K., 1990. Models for referendum data: the structure of discrete choice models for
contingent valuation. J. Environ. Econ. Manage. 18, 19–34.McFadden, D., 1994. Contingent valuation and social choice. Am. J. Agric. Econ. 76, 689–708.Milon, J., 1989. Contingent valuation experiments for strategic behavior. J. Environ. Econ. Manage.
17, 293–308.Mitchell, Carson, 1989. Using surveys to value public goods: the contingent valuation method. John
Hopkins Press, Baltimore.Northcraft, G., Neale, M., 1987. Experts, amateurs, and real estate: an anchoring-and-adjustment
perspective on property pricing decisions. Org. Behav. Human Decision Proc. 39, 84–97.Palfrey, T., Rosenthal, H., 1990. Testing game-theoretic models of free-riding: new evidence on
probability bias and learning. Working Paper, California Institute of Technology.Quattrone, G., Lawrence, C., Finkel, S., Andrus, D., 1984. Explorations in anchoring: the effects of
prior range, anchor extremity, and suggestive hints. Working Paper, Stanford University.Randall, A., Ives, B., Eastman, C., 1974. Bidding games for valuation of aesthetic environmental
improvements. J. Environ. Econ. Manage. 1, 132–149.

( )D. Green et al.rResource and Energy Economics 20 1998 85–116116
Rowe, R., D’Arge, R., Brookshire, D., 1980. An experiment on the economic value of visibility. J.Environ. Econ. Manage. 7, 1–19.
Schkade, D., Payne, J., 1993. Where do the numbers come from? How people respond to contingent! .valuation questions. In: Hausman, J. Ed. , Contingent Valuation: A Critical Assessment, North
Holland, Amsterdam.Schultz, W., d’Arge, R., Brookshire, D., 1981. Valuing environmental commodities: some recent
experiments. Land Econ. 57, 151–172.Serfling, R., 1980. Approximation theorems of mathematical statistics. Wiley, New York.Shorack, G., Wellner, J., 1986. Empirical processes with applications to statistics. Wiley, New York.Silberman, J., Klock, M., 1989. The behavior of respondents in contingent valuation: evidence on
starting bids. J. Behavioral Econ. 18, 51–60.Smith, V., 1979. An experimental comparison of three public good decision mechanisms. Scand. J.
Econ. 81, 198–215.Thaler, R., Johnson, E., 1990. Gambling with the house money and trying to break even: the effects of
prior outcomes on risky choice. Manage. Sci. 36, 643–660.Tversky, A., Kahneman, D., 1974. Judgment under uncertainty: heuristics and biases. Science 185,
1124–1131.Department of Commerce, National Oceanic and Atmospheric Administration. 1993. Report of the
NOAA panel on contingent valuation. Federal Register, 58, No. 10, Jan. 13, 4602–4614.Wilson, T., Houston, C., Etling, K., Brekke, N., 1994. Anchoring versus adjustment errors in judgment:
the generalizability of anchoring effects. Working Paper, Univ. of Virginia.