reference of following document - csirasphalt.csir.co.za/sim/sim web/1997-icap-complete... ·...
TRANSCRIPT

Reference of following document:
De Beer, M., Fisher C. and Jooste F. J., (1997). Determination of pneumatic tyre/pavement interface
contact stresses under moving loads and some effects on pavements with thin asphalt surfacing
layers. Eight (8th) International Conference on Asphalt Pavements (8th ICAP ‘97), August 10-14,
1997, Seattle, Washington, USA. Vol. 1, pp 179-227. ISBN 8790145356

DETERMINATION OF PNEUMATIC TYRE/PAVEMENTINTERFACE CONTACT STRESSES UNDER MOVING
LOADS AND SOME EFFECTS ON PAVEMENTSWITH THIN ASPHALT SURFACING LAYERS
M. de Beer, C. Fisher and Fritz J. JoosteDivision of Roads and Transport Technology, CSIR,
P O Box 395, Pretoria, 0001, South Africa - Tel No: +27 12 841 2953 - Fax No: +27 12 841 3232.
E-mail address: [email protected].
Abstract. This paper describes the quantificationof three-dimensional tyre/pavement contact stressesfor vehicle tyres. The Vehicle-Road SurfacePressure Transducer Array (VRSPTA) system wasdeveloped to measure contact stresses under movingloads, i.e. Stress-In-Motion (SIM). Predictionequations for quantification of these stresses, basedon tyre inflation pressure and loads for seven (7)different tyre types, are given. Tyre inflationpressure predominantly controls the vertical contactstresses on the pavement at the tyre centre, whereasthe tyre load controls those at the tyre edges.Analysis indicated that during instantaneousoverloading/under- inflated conditions themaximum strain energy of distortion (SED) in theasphalt surfacing occurs close to the tyre edges,while under instantaneous uniform vertical stressconditions the SED is within the asphalt surfacing atthe tyre centre. In addition to improvedload/contact stress idealization for modelling, thisfinding may have important implications for thedesign of relatively thin asphalt surfacing layers forpavements.
Keywords. Pavement, surfacing, distress, tyre,measurement, contact stress, Stress-In-Motion (SIM)design, analysis.
INTRODUCTION
It is well known that there is an increasing trendtowards higher traffic volume and traffic loaddemands on existing road and/or pavement networksystems worldwide. These network systems areundoubtedly recognized by most governments in thecivilized world as the necessary arteries for thesustainable and consistent economic growth of acountry. Therefore, it is of vital importance not onlyto plan ahead for future growth (i.e. the building ofnew roads), but also to invest in efficientrehabilitation and upgrading policies for thepreservation of existing road networks. In a recent
study by Maasdorp (1996), the implications for thetransport policy and infrastructure of South Africa ina new world of trade are discussed. It is clear fromthis study that South Africa has “come in from thecold” and that its foreign trade is expanding rapidly,especially with its Southern African Customs Union(SACU) partners. During the period 1991 to 1993the total road export/import trade tonnages with therest of Africa increased by approximately 34 percent In terms of volume of trade, Europe and Asiaseem to be the most important, which directlyinfluences the routes to and from South Africa’sharbour areas. This increased trade therefore directlyinfluences the total transport sector, and hence theinfrastructure. In order to develop adequatetransport policies, quality technical information isnecessary and should focus on real practical issuesrelating directly to the road user and the roadauthority tasked with the design, construction,maintenance and rehabilitation of the transporti n f r a s t r u c t u r e . T h i s n e c e s s i t a t e s astructural/functional life cycle approach to themanagement of the road system in general (TRH4,1996). For the efficient application of a life cycleapproach by road authorities, technical issues (i.e.demands), such as the actual traffic loading patternsof especially heavy vehicles, as well as the effects ofdifferent tyre types and inflation pressures should beknown and be as accurate as possible.
In a recent study it was estimated that theaverage ( median) tyre inflation pressure of heavyvehicles (axle mass > 7 000 kg) in the province ofGauteng (the economic centre of South Africa) hadincreased by approximately 18 per cent over the last20 years, from 620 kPa to 733 kPa (De Beer, 1995).See Figure 1a. The maximum inflation pressureshad also exceeded 1 000 kPa. Further analysis of theresults in Figure 1a indicated that the second peak atapproximately 800 kPa represents the averageinflation pressure for trucks with five (5) or moreaxles. During the last two decades there has also
been a change from bias/cross-ply truck tyres toradial tyres in South Africa. See Figure 1b.Approximately 86 per cent of current truck tyres areof the radial type, the remaining tyres being of thebias or cross-ply type. Figure 1b also indicates thedistribution of some of the more widely used radialtyre types in South Africa. The use of wide base(“Super Single”) tyres is limited to approximately 4per cent in South Africa, but is expected to increaseas a result of a recent increase in world trade, asmentioned above, and a recent increase in the legalaxle load limit during 1996 in South Africa (SouthAfrica, 1996).
Observations of road surface behaviour. Over theyears in South Africa, large-scale use has beenmade of relatively thin (< 50 mm) asphaltic concretesurfacing layers on flexible pavements supported byhigh quality crushed or natural gravel bases. Muchuse has also been made of lightly cementitiousmaterials as part of the main structural (i.e. base andsubbase) layers. This resulted in the so-called”inverted” or “upside down” pavement structureswhich have served the country well over the last twodecades. Most of these pavements, however, arenow nearing the end of their structural design life,most without bearing capacity problems, per se. Theproblems associated with most of the nationalhighways and paved provincial roads are related tosurfacing problems like surface cracking, potholes,surface crushing failures, permanent deformationwithin the asphaltic concrete surfacing layers,ravelling, bleeding, crocodile cracking of surfacingchip seals, etc. More than a decade of experienceon real roads using Accelerated Pavement Testing(APT) technology with the Heavy Vehicle Simulator(HVS) in South Africa (Freeme et al, 1981, 1982,1987, De Beer et al, 1988, De Beer 1991, Horak etal, 1992) has demonstrated that most of the traffic-associated failures result from the top down, and notfrom a lack of subgrade support (i.e. subgradebearing capacity). This finding caused, amongstother things, some research activity to be focussedon the effect of actual tyre/pavement contact stressesacting at the tyre/pavement interface. It is firmlybelieved that most of the observations and the resultsof APT research in South Africa indicate that thedamage is caused not only by the cumulative legalloading and overloading of heavy vehicles, but alsoby the load intensity (i.e. effective contact stresses)acting at the tyre/pavement interface. To study theseforces (i.e. contact stresses) at the tyre/pavementinterface, a rather unique system has been developedin South Africa. The system is officially referred toas the Vehicle-Road Surface Pressure TransducerArray (VRSPTA), end was developed to measurecontact stresses under moving pneumatic wheelloads effectively.
The scope of this paper is, firstly, to discuss thedevelopment, calibration and use of the VRSPTAsystem, and secondly, to discuss some analyses andbasic implications of the test results. Some effects ofnon-linear contact stresses on pavementsincorporating thin (< 50 mm) asphalt surfacinglayers are also discussed.
BACKGROUND
The use of relatively thin (< 50 mm) surfacinglayers in asphalt pavements is becoming morepopular for the construction of new pavements andthe rehabilitation of road networks in South Africa.However, appropriate mechanistic pavement designtechniques for thin asphalt surfacing layers arelacking, primarily because of the inappropriatedefinition of the contact stress condition at thetyre/pavement interface. Usually, a circular areawith a uniform distribution of only the verticalcontact stress is used for design purposes (Yoder etal, 1975). The question of the tyre/pavementload/stress idealization, however, is not new, sincemuch work has been done in the past for improveddefinition thereof. (Bonse et al, 1959; Freitag et al,1962; Wardle, 1977; Uzan et al, 1987; Van Vuuren,1974; Tielking, 1984; 1987; Woodside, 1992;Woodside et al, 1992; Jacobs et al, 1992; Mante et al,1995a, 1995b).
The research discussed in this paper includes adescription of the research undertaken in SouthAfrica into the determination (measurement) of thethree-dimensional tyre/pavement contact stressesunder slow moving wheel loads. A researchprogramme was started in 1992 through which asystem for the improved quantification of the three-dimensional (3-D) tyre/pavement contact stresseswas successfully developed. The concept “Stress-In-Motion” (SIM), however, is not new, since manyearlier attempts were made for such measurements.A wide range of systems was used, varying fromsingle instrumented pin systems in road surfaces tolaboratory equipment (Martin, 1936; Bonse et al,1952; Freitag et al 1962; Lister et al, 1968; Davisson1969; Lippmann et al, 1974; Clark, 1981; Roberts etel, 1985; Marshek et al, 1986; Cunagin et al, 1986;Pezo et al, 1989; Sebaaly et al, 1989; Huhtala, 1990).
GENERAL CHARACTERISTICS OF THEVEHICLE-ROAD PRESSURE TRANSDUCER
ARRAY (VRSPTA) SYSTEM
The Vehicle-Road Surface Pressure TransducerArray (VRSPTA) system discussed here consistsmainly of an array of triaxial strain gauged steelpins fixed to a steel base plate, together withadditional non-instrumented supporting pins, fixed
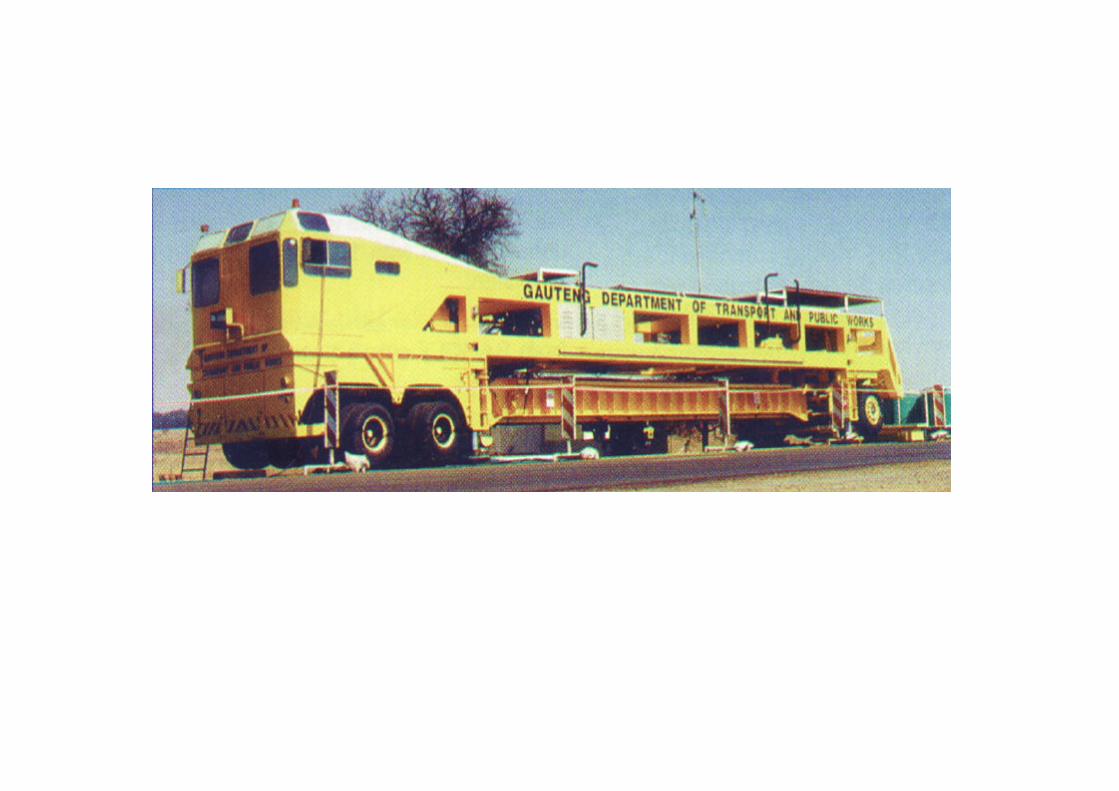
flush with the road surface. The data acquisitionsystem used in this study allows for the simultaneousrecording of 63 channels (strain gauges) up to asampling rate of 12 kHz per channel. The system isautomatically triggered by a moving wheel and isdesigned to measure at wheel speeds from 0,3 m/s(1 km/h) up to 7 m/s (25 km/h), and vertical loadsup to 200 kN (horizontal loads up to 20 kN). Aschematic layout of the VRSPTA systems applied inthis study is given in Figure 2 below, as well as inPlate 1.
Basically, the VRSPTA is installed flush withthe surface of the pavement to a relatively high levelof precision within a few millimetres. This isneeded to minimize measured load variation as aresult of dynamic impact on the system at relativelyhigh wheel speeds. See also Plate 1 where severalimages of the VRSPTA in operation under the HVSare illustrated.
The VRSPTA system discussed here is thesecond prototype system (i.e SIM MK II), whichincorporates some improvements relative to the firstsystem developed during 1992/3 (i.e SIM MK I) (DeBeer, 1994). SIM MK I was developed to prove theconcept of the measurements of the 3-D stresscomponents at the moving tyre/pavement interface.Subsequent systems were develop primarily for thepurpose of the development of tyre/pavement contactstress data basis for pavement design and evaluation.
The stresses measured simultaneously with theVRSPTA, and the convention used in this paper aregiven below(see also Figure 2):
C Vertical Contact Stress: Positive in the Z direction, FFzz;
C Transverse (or Lateral) Contact Stress:Positive in the Y direction , JJzy, at right anglesto the direction of the moving wheel ( across thecontact area), and
C Longitudinal Contact Stress: Positive in the X direction, JJzx, in the direction of the movingcontact area.
As was reported earlier, SIM MK I manifestedsome inaccuracies of up to 25 per cent of the totalload measured after integration of the vertical stressvolume (De Beer, 1994), but this was corrected withimprovements to the design of the SIM MK IIVRSPTA system used for the measurements given inthis paper (De Beer 1995b, 1995c, De Beer et al,1996).
Friction of the surface of the VRSPTA. Since itis critical to ensure an adequate amount of frictionbetween the tyre and the surface of the VRSPTA toobtain an effective transfer of especially thehorizontal forces (i.e. transverse (or lateral) andlongitudinal), it was necessary to design the surfaceof the VRSPTA to match a surface, equivalent infriction to an “average” asphaltic concrete orsurfacing material used on pavements. It was alsonecessary that the full tyre/pavement contact patch(area) be supported by the same stiffness or rigidityas those areas where the actual measurements arerecorded (i.e. instrumented pins) during themovement of the wheel across the surface of theVRSPTA.
Based on the general dimensions of aggregateused for asphaltic surfacings in South Africa, whichrange from 6 mm to 19 mm, the majority beingaround 13 mm, and taking into account that theseaggregates do not consist of flat planes on the surfaceshould it was decided that the diameter of the pins onthe VRSPTA surface to be approximately 9.7 mm,spaced at 17 mm from centre to centre. Anotherconsideration was the spacing of tread grooves ontypical on-road truck tyres which varies from 20 mmto 60 mm. The arrangement of the pins at 17 mmintervals was chosen to cover as much of the area aspractically possible to give in an adequate definitionof the contact stresses using only one coverage oftypical truck tyres. The surface frictioncharacteristics of the VRSPTA were tested at anearlier date (De Beer, 1995b) with the TRL(Transport Research Laboratory, UK) PendulumSkid Resistance Tester, in accordance with RoadNote 27 (1960). In dry conditions it gave a skidresistance value of 76 (mean of 15 values, s = 1.1).In wet conditions the skid resistance was 37 (n = 10,s = 4.7). The value of 37 relates to a “potentiallyslippery” road (values < 45), according to RN 27.The measured value of 76 during dry conditions onthe surface of the VRSPTA relates to an equivalentroad surface with a “good” skid resistance...“fulfilling the requirements even of fast traffic, andmaking it most unlikely that the road will be thescene of repeated skidding accidents” (RN 27,1960). It should be mentioned that RN 27 requiresthe skid resistance testing to be done in “wet”, i.e.the most unfavourable, conditions. Asmeasurements with the VRSPTA are done in dryconditions, however, it can be argued that thefriction between the rubber tyre and the VRSPTAsteel surface is relatively high. This represents acondition where the horizontal forces between tyreand VRSPTA can be considered as relatively close tothe expected maximum forces (hence maximumstresses). It is therefore unlikely that in practicethese stresses will be underestimated by the current
VRSPTA system.
However, it is acknowledged that the effectivefriction between the test tyre and the VRSPTAsurface has a dominant effect on the magnitude ofespecially the horizontal forces but, as stated, thecurrent VRSPTA surface represents an “averageequivalent dry road surface” according to thePendulum test and is assumed to be acceptable forthe purposes of this study.
Further research work, however, should alsoconcentrate on varying the effective surface frictionconditions of the VRSPTA, but this is outside thescope of this study.
Stiffness and calibration of the VRSPTA. Sincethe principle of measurement of the VRSPTA isbased on strain gauge technology, calibrating eachof the instrumented pins in three (3) directions (i.e.3 dimensional or triaxial load cells or sensors), thereal stiffnesses in the three measuring directions ofthe instrumented pins do not directly influence theresults, as long as the sensitivity of measurement islarge enough to obtain useful voltage outputreadings. In order to provide the pins with a moresensitive top area, a conical shape was preferred. Inaddition, the pins were hollowed out to increase thissensitivity. This resulted in a hollow conical-shapedpin, with diameters of 16 mm and 9.7 mm for thebottom and top respectively. In addition to the holein each pin, four windows at 90 degree spacingswere included near the top to further increase thesensitivity at the top of each pin. It is, however,important that the loaded wheel should be fullysupported by the same “stiffness” (or rigidity ) whenthe measurement is made, so that the tyre contactpatch is not distorted as a result of non-uniformsupport. Therefore all the pins on the VRSPTA(1041 in this case) have exactly the same shape,stiffness, contact area, sensitivity to loading, fixingand bending characteristics.
Each of the instrumented pins (sensors) isindependently calibrated using a high precisionminiature load cell (+ 1 per cent of full scale, i.e. 1per cent x 500 Newton = 5 Newton, according to themanufacturer’s calibration report). A separatecalibration frame is installed on top of the VRSPTAsystem and calibration for each of the threedirections of each instrumented pin is done fromzero load to a safe maximum recommended load ofapproximately 500 Newton. This is repeated severaltimes to provide for a linear fit between the voltageoutput and the load reading from the high precisionload cell during the calibration. This linear fit isobtained for each of the total 63 directions of theVRSPTA and then used in the software to convert
the voltage output to load. Figure 3 indicates atypical result of one of the 63 calibrations done onthe VRSPTA. It was found that the systematic errorassociated with this calibration method variesbetween 2 per cent at 80 per cent predictionconfidence limit, and 10 per cent at a 99 per centprediction confidence limit (De Beer et al, 1996).
Accuracy of the VRSPTA system. The accuracy(i.e. systematic and random errors) associated withthe current VRSPTA system, regarding the truthfulregistration of the contact stresses between the tyreand the pavement surface, is mainly determined bythe following factors:
i) the accuracy of the conversion of the forcecalculated from the voltage output of the measuringpins, and then the calculation of the stresses bydividing the calculated forces by a constant effectivearea. The initial conversion from voltage to loadcontains a certain systematic error with respect tothe linear fit obtained in the laboratory, as well as tothe spread of the data around the regression function.The effective diamond-shaped area applied duringpost-processing to convert the measured three loadcomponents to the three average contact stresscomponents over that area is illustrated in Figure 4.
ii) the accuracy of the simulation of whatactually happens at the interface between the tyreand the actual pavement, as the surface of theVRSPTA is not what pavements are usually made of.In this case the effective friction is regarded as thedominant factor. This is the second source of asystematic error from the VRSPTA.
(iii) the existence of random errors due to thenon-laboratory conditions under which the currentsystem operates in the field (also under the HVS). Asfar as “accuracy” of the VRSPTA is concerned, itdepends on the confidence level (or intervals)selected to describe the variation of the laboratorydata (from the instrumented pins) around the averagerelationship between the load and voltage output.
With the field testing done to date, it was foundthat the random error of the VRSPTA systemrelating to the measurement of total load, and also tothat of maximum contact stresses is generally lessthan 10 per cent (De Beer et al, 1996).
Figure 5 show a typical random error in total loadmeasurement found during a recent study on a wide-base single tyre with the VRSPTA (De Beer et al,1996).
TYRE/PAVEMENT CONTACT STRESSESMEASURED WITH THE VRSPTA

Since the development of the first prototypeVRSPTA system in 1994 (i.e SIM MK I), severalstudies regarding the tyre/pavement interface contactstresses have been done on a research basis (DeBeer, 1994; De Beer, 1995b, 1995c; De Beer et al,1996). These studies include the investigation ofseveral types of truck tyres, such as bias/cross-plytyres used on the HVS and radial tyres, includingsome wide-base singles. Limited testing wasrecently done on a light commercial vehicle andtrailer at speeds ranging from 5 km/h up to 60 km/h.In Table 1 below a description of the various types oftyres tested to date is given. Only the mostimportant characteristics of the 3-D contact stressesfound from using these tyres will be discussed here.
Basic three-dimensional (3-D) contact stressesunder a smooth tyre. During the 1994 study (DeBeer, 1994) some basic contact stress distributionsfor a smooth free-rolling, loaded bias-ply truck tyre(Reference Number I, i.e. tyre Type I , Table 1) wereidentified. This research prompted further interestin the actual stress distributions under real trucktyres, as well as the investigation of possibledifferences in contact stress definitions between tyretypes. Some of the basic contact stress distributionsfound during 1994 are illustrated in Figure 6. Thefigure indicates the three basic stress distributionsfound under a free-rolling single smooth bias/cross-ply tyre, namely:
C Vertical contact stress; C Transverse (or lateral) stress, and theC Longitudinal stress distributions.
Vertical contact stress: Based on the designlayout of the VRSPTA, load/stress recordings areobtained every 17 mm across the tyre contact patch.Therefore a typical patch width of 230 mm willresult in 13 load recordings from thirteeninstrumented pins from the VRSPTA during onesingle passage of a load. See Plate 1 and Figure 6.The system used here (SIM MK II) is 315 mm wide.Typically, for slow moving, free-rolling tyres, thevertical load on each instrumented pin increases toa maximum and then decreases. For the smooth tyreit was demonstrated that the maximum verticalcontact stress changed from the tyre centre towardsthe tyre edges when the tyre was heavily loadedand/or under inflated. Compare Figures 6A and 6D.Also for slow-moving, free-rolling tyres, the stressdistribution in the direction of travel is parabolic forrelatively lower loads and tends to flatten out for thehigher loads.
Transverse (or Lateral) contact stress. Thestress distribution found for the transverse direction
at right angles to the direction of travel for a free-rolling smooth tyre clearly indicated inward sheartowards the tyre centre and these stresses are inbalance, with zero stress at the tyre centre. SeeFigures 6B and 6E. Therefore the resultant force iszero. From this it may be postulated that thepavement surface is experiencing a tensile stressoutside the tyre edge and a state of compressiontowards the tyre centre. This has also beensuggested by others (Wardle, 1977; Jacobs et al,1992; Mante et al, 1995a, 1995b). For heavilyloaded tyres, the transverse stress also increases(Figure 6E). With limited testing in a mode ofsideways shear using the HVS, it was found that thetransverse stress increases towards the one side atmaximum shear. In this condition the difference intransverse shear stress equals the additional shearstress, owing to sideways shear or, more correctly, to“cornering” of a tyre at a curve.
Longitudinal contact stress. The measuredlongitudinal contact stresses in the direction oftravel are indicated in Figures 6C and 6F. For free-rolling tyres these stresses are the lowest of the threestresses and normally result in two or three peaks.These peaks occur near the fore and aft positions ofthe tyre and are highly dependent on the rollingresistance between the tyre and the road and on thetraction, braking or acceleration imposed on the tyre.In the case of heavy overloading, stress reversalswithin the contact patch are possible, resulting insome peak stress (in this case three) concentrations,as indicated in Figure 6F. In general thesemeasurements agree fairly well with those predictedby theory and by other experimental data (Clark,1981; Tielking et al, 1987, 1994; Lippmann et al,1974).
Basic relationships between tyre inflationpressure and contact stress of the smooth
tyre. In order to understand the tyre/pavementinterface stresses better it is worthwhile to studysome basics first. Several methods exist, and havebeen used in the past, to quantify the vertical contactstress between a tyre and the road surface. Most ofthese are based on the rather simplistic approach ofmeasuring the contact area using the tyre imprintand dividing the measured vertical load by this areato obtain the average vertical contact stress.
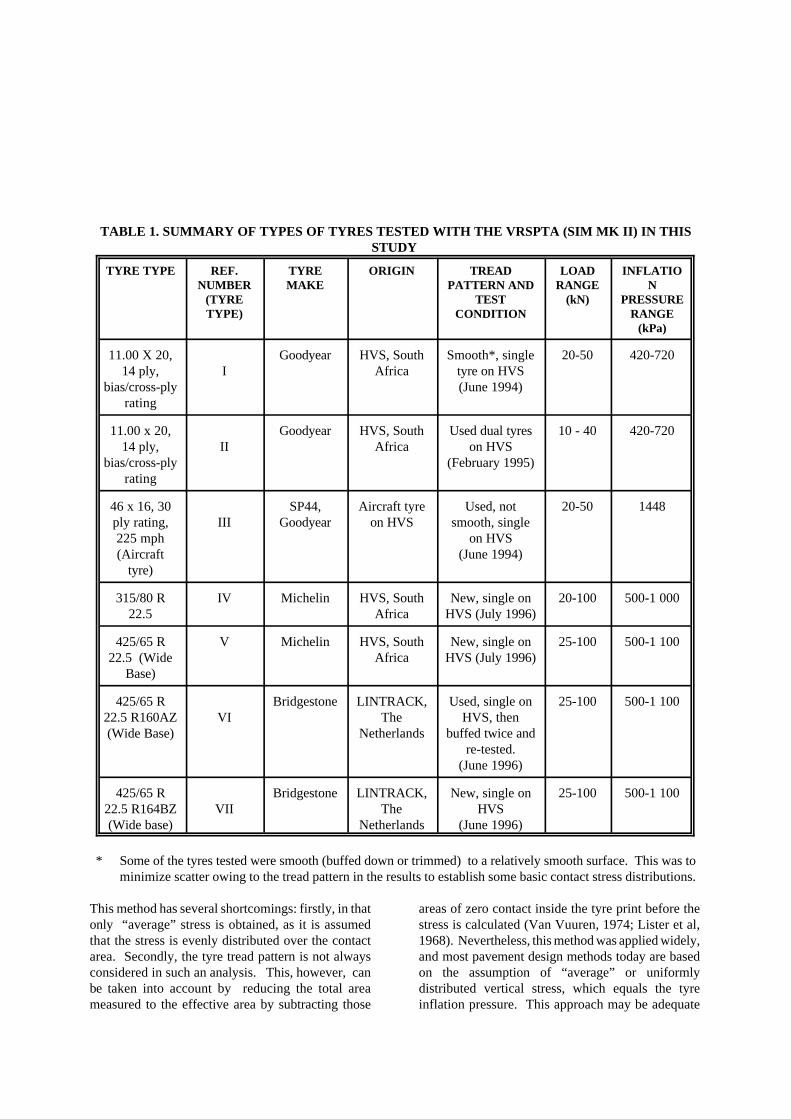
TABLE 1. SUMMARY OF TYPES OF TYRES TESTED WITH THE VRSPTA (SIM MK II) IN THISSTUDY
TYRE TYPE REF.NUMBER
(TYRETYPE)
TYREMAKE
ORIGIN TREADPATTERN AND
TESTCONDITION
LOADRANGE
(kN)
INFLATION
PRESSURERANGE
(kPa)
11.00 X 20,14 ply,
bias/cross-plyrating
IGoodyear HVS, South
AfricaSmooth*, single
tyre on HVS(June 1994)
20-50 420-720
11.00 x 20,14 ply,
bias/cross-plyrating
IIGoodyear HVS, South
AfricaUsed dual tyres
on HVS(February 1995)
10 - 40 420-720
46 x 16, 30ply rating,225 mph(Aircraft
tyre)
IIISP44,
GoodyearAircraft tyre
on HVSUsed, not
smooth, singleon HVS
(June 1994)
20-50 1448
315/80 R22.5
IV Michelin HVS, SouthAfrica
New, single onHVS (July 1996)
20-100 500-1 000
425/65 R22.5 (Wide
Base)
V Michelin HVS, SouthAfrica
New, single onHVS (July 1996)
25-100 500-1 100
425/65 R22.5 R160AZ(Wide Base)
VIBridgestone LINTRACK,
TheNetherlands
Used, single onHVS, then
buffed twice andre-tested.
(June 1996)
25-100 500-1 100
425/65 R22.5 R164BZ(Wide base)
VIIBridgestone LINTRACK,
TheNetherlands
New, single onHVS
(June 1996)
25-100 500-1 100
* Some of the tyres tested were smooth (buffed down or trimmed) to a relatively smooth surface. This was to
minimize scatter owing to the tread pattern in the results to establish some basic contact stress distributions.
This method has several shortcomings: firstly, in thatonly “average” stress is obtained, as it is assumedthat the stress is evenly distributed over the contactarea. Secondly, the tyre tread pattern is not alwaysconsidered in such an analysis. This, however, canbe taken into account by reducing the total areameasured to the effective area by subtracting those
areas of zero contact inside the tyre print before thestress is calculated (Van Vuuren, 1974; Lister et al,1968). Nevertheless, this method was applied widely,and most pavement design methods today are basedon the assumption of “average” or uniformlydistributed vertical stress, which equals the tyreinflation pressure. This approach may be adequate

for the design and analysis of relatively thick (>100mm) asphalt surfacing and base layers but in the caseof relatively thin surfacings, as discussed here, thisassumption needs more validation. In order to studythe vertical contact stress distribution of the smoothtyre and the associated relationship(s) with inflationpressure and load, several tests were done with theVRSPTA, where the wheel load was increased atconstant inflation pressure, and also where the tyreinflation pressure was increased under constant loadconditions. In this case the loads on the singlesmooth tyre varied between 20 kN and 50 kN, and theinflation pressure from 420 kPa to 720 kPa. Forsimplicity, the measured vertical contact stress testresults are shown graphically in Figure 7. Thelayout of the figure is designed to enable the differentload/inflation pressure cases to be compared, startingfrom the lower left corner with the lowest load (20kN) and lowest inflation pressure (420 kPa)conditions. Then, by moving upwards, the figurerepresents an increase in load for all cases, whilemoving across the figure to the right represents theincrease in tyre inflation pressure. The figure clearlydemonstrates that an increase in load results in anincrease in the contact stresses at the tyre edges,while an increase in inflation pressure results in anincrease in the contact stress at the tyre centre.Therefore it is obvious that the tyre/pavement contactstress includes both the inflation pressure and the tyreloading. It is, however, accepted that theload/inflation pressure conditions given here are notconfined to those prescribed by the tyre manufacturerfor normal operational use. The purpose of Figure 7is to convey a rather important message concerningthe basic problem of tyre/pavement interface stressconditions under normal loading as well asoverload/under-inflation cases. The dependence ofcontact stress on both tyre load and inflation pressureis therefore indicated. An analysis of the distributionof vertical contact stresses (De Beer, 1995b) indicatedthat the vertical stresses on the smooth tyre are notnormally distributed under the smooth tyre, and tendto be biased towards the higher stress at lower loads.However, a more normal distribution is obtainedunder higher loads. See the bar charts in Figures 8and 9.
Quantification of the vertical contact stresses.In order to study the simplistic approach discussedearlier of dividing the tyre load by the imprint area,the results of the smooth tyre discussed above wereused and compared with results based on the sameassumption that was made in South Africa during1974 for the mechanistic design of pavements inSouth Africa. Van Vuuren (1974) suggested that theaverage vertical contact stress for truck tyres is lowerthan the inflation pressure and is obtained from theequation below:
q = 0.61p + 145 .......................................Eq 1
where:q = Average vertical contact stress (kPa),
p = Tyre inflation pressure (kPa).
For the smooth tyre it was found that the methodabove suggested by Van Vuuren underestimates theactual vertical stress. In the light of the non-normaldistribution of vertical stresses (Figure 8), it issuggested that a percentile based approach shouldrather be used to obtain the contact stresses neededfor design purposes (De Beer, 1995a). As anindication of this approach, the results of the smoothtyre were used and compared to those of Van Vuuren(1974), and are illustrated in Figure 10. The figureclearly demonstrates the underestimation of contactstresses by Van Vuuren (1974) (indicated by the solidline in Figure 10). If the average tyre inflationpressure (620 kPa) for heavy vehicles obtained in1974 is used in Eq 1, the uniform vertical designcontact stress of 520 kPa is obtained, which was thebasic stress idealization used until now in the SouthAfrican Mechanistic Design Method (Theyse et al,1996).
The results of the smooth-bias/cross-ply tyre werethen converted into the same format as that of Eq 1.At the rated tyre load and inflation pressure of thistyre the maximum measured contact stressesmeasured with the VRSPTA exceed the inflationpressure by approximately 29 to 58 per cent. Becauseof the lack of any other direct relationships betweentyre inflation pressure and contact stress, it isrecommended (at least for HVS research andmechanistic design in South Africa) that the 1974 -Eq 1 should rather not be used. Instead, the newlydeveloped relationships (including only the inflationpressure1) for bias/cross-ply tyres given below inTable 2 at different percentile design values arerecommended for use if the tyre load is not known.
The design percentile approach suggested hereties in well with a similar approach towards thestructural design reliability for pavements in SouthAfrica suggested by Theyse et al (1996).
1 The dependence of the three-dimensional(3-D) tyre/pavement contact stresses on BOTH theinflation pressure and the tyre load for several typesof tyres is discussed in detail later.

TABLE 2: SUGGESTED INTERIM DESIGNRELATIONSHIPS BETWEEN TYRE
INFLATION PRESSURE AND VERTICALTYRE CONTACT STRESSES AT DIFFERENT
DESIGN PERCENTILE VALUES.
DESIGNPERCENTILE
(%)
A* BkPa
DESIGNCONTACTSTRESS**
(kPa)
50 0.730 174 700
80 0.690 296 800
90 0.723 310 840
95 0.746 311 860
Van Vuuren(1974)
0.61 145 590
Maximum 0.833 312 920
* q = Ap + B, with inflation pressure, p, inkPa, q = design contact stress.
** This design vertical contact stress applies to theaverage inflation pressure of 733 kPa recentlyfound for South African heavy vehicle traffic (DeBeer, 1995a) (See also Figure 1).
Table 2 also indicates that the higher the design
percentile value, the higher the vertical contact stressto be used for pavement design purposes, as expected.
Tyre centre vs tyre edge vertical contactstresses. The VRSPTA tests with the smooth
tyre clearly indicated that the higher the load, thehigher the vertical contact stresses at the tyre edge.This condition has been demonstrated experimentallyby various researchers, and postulated from a purelytheoretical approach (Bonse et al, 1962; Davisson,1969; Clark, 1981; Tielking, et al, 1987; Yap, 1988;Hansen et al, 1989; Huhtala, 1990). This aspect wasalso investigated further for the smooth tyre studiedhere, and some results are illustrated in Figures 11 to14. Figures 11 and 12 represent the case where theload was kept constant, and the inflation pressurevaried from 420 kPa to 720 kPa. Two load levels areshown here, namely 18 kN (Figure 11) and 48 kN(Figure 12). Both figures illustrate that the greatestinfluence on the development of contact stress istowards the tyre centre and is primarily controlled bythe tyre inflation pressure. It is also evident fromthese figures that the average stress over the tyrecentre (i.e. VRSPTA pin 7 to pin 16 on Figure 11,and pin 6 to 17 on Figure 12) is higher than theassociated inflation pressure. During extremely high
loading some effects of tyre pressure on the tyre edgecontact stresses are noted, possibly owing to the greaterdeflection and bulging of the tyre, which causes anadditional inflation pressure effect towards the tyre edgeand also as a result of reduced tyre volume. See Figure12. Figures 13 and 14 show the maximum developedvertical contact stresses at constant tyre inflationpressure, but with a varying tyre load. Figure 13illustrates the case of an inflation pressure of 420 kPa,where the load varied between 20 kN and 50 kN.Figure 14 illustrates the case in which the inflationpressure was 620 kPa, and the load varied from 20 kNto 50 kN. Both figures indicate clearly that the tyreloading studied here did not affect the development ofvertical contact stresses towards the tyre centre butstrongly influenced the development of vertical contactstresses at both the tyre edges. It should also be notedthat the cases given in Figures 13 and 14 represent, inprinciple, more of the “reality”, since it is more likelythat the tyre load will change on a moving vehicle as adirect result of vehicle load, and not because of a changein the tyre pressure. In addition, the development ofdynamic loading due to vehicle/tyre movement andirregularities on the road surface will also cause avariation in tyre load more than the tyre inflationpressure. It is therefore evident that relativeoverloading and under inflation will cause relativelyhigh tyre edge contact stresses. The vertical stresses atthe tyre edges could exceed the inflation pressure by afactor of two to three. This will be discussed in moredetail later. For general design purposes of especiallythin asphalt surfacings, it could be argued that it isimportant to differentiate between these two types ofcontact stress developments across the tyre width, sinceoverloading is generally considered a serious problemin South Africa. Recent statistics indicate that 44 percent of the 52 350 heavy vehicles weighed in SouthAfrica during 1995 were overloaded, of which 26 percent were charged (Sallie, et al, 1995, Nordengen et al,1995). It may therefore be that the position of themaximum vertical contact stresses of overloaded heavyvehicles in South Africa is at the tyre edges. If thedamage to road surfacings due to these vehicles is to beestimated, the correct magnitude of these stresses andof their distribution across the width of the tyre need tobe known. For this purpose two interim designrelationships were developed from the studies on thesmooth tyre. The two cases are, firstly, the verticalcontact stress at tyre centre, and secondly, the verticalcontact stresses at both the tyre edges:
Estimation of the vertical contact stress attyre centre. From Figures 11 to 14 it is clear that thevertical tyre/pavement contact stresses at the innerportion of the tyre width are primarily controlled by thetyre inflation pressure. In this case the inner 60 percent of the tyre width was selected over which therelationship between tyre inflation pressure and
measured contact stress was developed. The foundrelationship is given in Eq 2 below:
q60 = 0.86p + 175..........................................Eq2
where:q60 = Average vertical contact stress at
tyre centre area in kPa;
p = tyre inflation pressure in kPa overa range of 420 kPa to 720 kPa, anda single tyre load range from 20kN to 50 kN.
r2 = 0.98Standard Error in q60 = 20 kPa
Estimation of vertical contact stress at thetyre edges. In this case the contact stresses arepredominantly controlled by the tyre loading, and therelationship between tyre load and edge contact stressis given in Eq 3.
qe = -0.53L2+57.46L- 534.05......................Eq 3
where:qe = Vertical Contact Stress at the tyre
edges in kPa.
L = Tyre load in kN, ranging between20 kN and 50 kN.
r2 = 0.97Standard error in qe= 54 kPa.
Ratios of maximum stresses found for thesmooth tyre. Analysis of the ratio of the maximum(peak) contact stress values between the measuredstresses in the three directions: Vertical (Z),Transverse (Y), Longitudinal (X) of the free-rollingsmooth tyre measured on the new VRSPTA system(SIM MK II) resulted in the following: 10 : 3.6 : 1.4.This ratio was similar to an earlier finding on thesame tyre, but with the previous VRSPTA system,SIM MK I (De Beer, 1994). It is thereforesuggested that if studies need to be done on relativelysmooth (worn out) bias/cross-ply tyres based on allthree stress components, the ratio as given above beused. It should, however, be remembered that theeffect of sideways shear (or cornering) is not includedin the above ratio, and in such cases it may beadvisable to increase the transverse stress ratio valuefrom 3.6 to 4.5 or in extreme cases to 5, as it wasfound (with VRSPTA testing) that sideways shearresults in additional transverse shear forces. Morediscussion follows later on sideways shear measuredby the VRSPTA, on tyres with tread grooves.
Conclusions on the smooth tyre results. The testresults from the smooth tyre assisted in the improvedunderstanding of some of the most basic tyre/pavementcontact stress distributions under pneumatic truck tyres. The interdependency of the inflation pressure and tyreload was also clearly illustrated. Although the tyrestudied in this section was of the bias/cross-ply type (ofwhich many were used in South Africa up to the early1980's), it nevertheless, provided some basic insightpreviously not generally available to pavementengineers in practice.
Tests on tyres with tread grooves. Several tyres withtread grooves were also tested with the VRSPTA, and asummary of the test results is given in the followingsections. Table 1 gives a summary of seven (7) types oftyres tested and discussed here. Most of the VRSPTAtests were done at slow speed (0.31 m/s to 0.34 m/s), inthe free-rolling mode under the HVS04. Limited testingwas done in the sideways shear mode. Discussions ofthe tests on the different tyres from Table 1 follow in thenext sections, with a more detailed discussion on theresults of a typical bias/cross-ply tyre (Type II) usedpreviously in South Africa.
Tyre Ref Number II (Table 1). This type of tyrerepresents the normal truck tyres which were used formore than 20 years in the South African Heavy VehicleSimulator (HVS) testing. The tyre is a 11.00 x 20 14bias/cross-ply tyre and normally a set of dual wheels areused for normal accelerated pavement testing (APT)(HVS testing, Freeme et al, 1981, 1982, 1987, Horak etal, 1992, Steyn 1995).
Practice to “simulate” relative damage usingAccelerated Pavement Testing (APT) facilities suchas the HVS. Before the actual contact stressmeasurements for this tyre are discussed, it is importantto be familiar with the general widely accepted conceptof relative damage and its simulation by acceleratedpavement testing facilities such as the HVS. It was(and still is!) accepted that in order to accelerate theoperational efficiency (i.e maximize the number ofload/stress cycles in relatively short periods of time) ofthe HVS or other similar traffic load simulationsystems, like the Accelerated Loading Facility (ALF)(Jameson et al, 1996); Mobile Load Simulator (MLS)(Hugo, 1996); Circular test track at Nantes in France(LCPC), LINTRACK at Delft in the Netherlands-(Groenendijk et al, 1994, 1996a, 1996b); CAPTIF inNew Zealand (Pidwerbesky, 1989, Pidwerbesky et al,1990a, 1990b); etc, the test wheel load has to beincreased, often without an associated increase in tyreinflation pressure. Usually, the “4th power law” forrelative damage and “equivalency of loads” is thenassumed to study the effects of different loads onpavement damage (Irick et al, 1964, Sebaaly et al, 1992,Ioannides et al, 1993). By using this method the

number of “equivalent load applications” of a certainbase load, Pb, is obtained by raising the ratio of thetest load P and some base load, Pb, to the 4th power,i.e. (P/Pb)
4. This method is based on the assumptionof “equivalent load equivalent damage”, which maynot always be true. For relatively high loads, P, thismight have a large influence on the effective load (orstress ) cycles actually applied to the test pavement.For example, an increase of a test load P to 70 kN,were the legal load Pb = 40 kN, results in an“equivalent” number of load applications of (7/4)4 =9.4 times the legal load per single application of the70 kN load. This may be acceptable for certainrelatively thick surfacing layers (> 100 mm) andrelatively strong pavements, but owing to the actualcontact stress distributions resulting from this type ofload increase, it may be incorrect for use on pavementstructures with thin surfacings. This, however, willbe discussed later in more detail, based on actualmeasured contact stresses.
Basic Contact Stress Distributions on the HVSbias/cross-ply tyres with tread grooves. As may beexpected, because of the tread patterns on most trucktyres, the tyre/pavement contact stresses will behighly variable, and in almost all cases, it may bezero at a position between the tread grooves. Somebasic measured distributions on the tyre Type I (RefI, Table 1) are illustrated in Figure 15. The figureindicates digital images of all three basic stresses, i.e.vertical, transverse and longitudinal directions. It isclear that these stresses are highly variable comparedto those found for the smooth tyre (Compare Figure15 with Figures 6, 7 and 11 to 14) . For the verticalstress it is also clear that for relatively low loads themaximum stress occurs at the tyre centre rib, and athigher loads the maximum stresses move towards thetyre edge ribs (similar to what was found for thesmooth tyre). The transverse stresses seem to indicatebasic outward shear on some pins and some inwardshear on others. This, however, is to be expected,since some pins on the VRSPTA are fully loaded witha resultant transverse force in one direction or theother, and some pins will be partially loaded in onedirection or the other. Although this, in itself, is afunction of the layout of the pins in the VRSPTA, theauthors believe that it is closer to what is expected tohappen on relatively rough surfaces where theasperities of the individual aggregates penetrate thesurface of the tyre in the contact patch. Thelongitudinal stress seems to be the least affected bythe tyre tread pattern, and each of the ribs acts like a“smooth tyre” in itself. This is also believed to be thecase for the VRSPTA-measured transverse stresses.Figure 15 also shows cross sections of the verticalmeasured contact stress, and it is clear that betweenribs, relatively low stresses are measured, and in somecases zero stress, as might be expected. Figures 16and 17 illustrate the effect of inflation pressure andload on this tyre, again similar to those found on thesmooth tyre, where the inflation pressurepredominantly controls the contact stress at the tyre
centre (Figure 16), and the load controls the contactstresses at the tyre edges (Figure 17).
Analysis of maximum stresses for bias/cross-ply tyreswith tread grooves used on the HVS. Analysis of thevertical contact stress distribution of this tyre type (RefI, Table 1) indicated that the vertical stress is also notuniformly distributed about the mean, and is much moreirregular than that obtained for the smooth tyre. Figure18 illustrates this in a bar chart (similar to Figures 8and 9), for the bias/cross-ply HVS tyre at 420 kPa anda load of 17 kN. Figure 19 indicates the percentagecumulative frequency of the vertical contact stress for arange of loading from 14 kN to 40 kN, at an inflationpressure of 520 kPa. From Figure 19 an estimate of thepercentile stresses associated with this condition ofloading and inflation pressure is obtained. It should bepointed out that the HVS tyre load and inflationpressure rating is from 18 kN at 420 kPa to 26 kN at730 kPa (SABS 1550, Table 7, 1992).
Table 3. Percentile vertical contact stresses foundfor the HVS tyre ( load range 14 kN to 40 kN) at
520 kPa inflation pressure( see also Figure 19)
DESIGNPERCENTILE
(%)
RANGE OF VERTICALCONTACT STRESS (kPa)
NormalLoad:
14 to 21 kN(Stress at
tyre centre)
50 % to 100 %Overloading
(Stress at tyreedges)
50 620 - 700 820 - 900
80 780 - 950 1 050 - 1 100
90 950 - 1 000 1 075 - 1 250
95 970 - 1000 1 150 - 1 300
Max 980 - 1000 1 190 - 1320
The percentile stresses for this case at various loadingconditions are given in Table 3. When the tyre is notoverloaded, these stresses occur close to the centre ribsof the tyre. The stresses obtained under extremeoverloading conditions (approximately 50 per cent up to100 per cent overloading) are also given in this table.The stresses given are an indication of the actualcontact stresses (in this case mainly tyre edge stresses)when the loading on accelerated pavement test facilitiessuch as the HVS is arbitrarily increased to higher loadsat the same tyre inflation pressure (i.e. 520 kPa on theHVS). The above procedure is normally done toachieve “accelerated” test conditions, as discussedearlier, and clearly indicates possible errors in assumedcontact stress values during analyses of the results fromthese test systems. In the case discussed here, theincrease in actual contact stresses


TABLE 4. SUMMARY OF THE MAXIMUM 3-D (X,Y,Z) STRESSES MEASURED WITH THE VRSPTA ON THE TYRES DEFINED IN TABLE 1.
TYRE TYPE REFNo.
TYRELOADRANGE(kN)
INFLATIONPRESSURE RANGE(kPa)
RANGES OF MEASURED MAXIMUM CONTACT STRESSES (kPa), AND NORMALIZED CONTACT PRESSURE (NCP)*
RATIO OF AVERAGEMAXIMUM STRESSES
COMMENTS
VERTICAL(Z)
NCP TRANSE-VERSE(Y)
NCP LONGI-TUDINAL(X)
NCP Z Y X
11.00 X 20,14 ply(bias/cross)
I 20-50 420-720 662 - 1 424 1.6-2.0 230 - 470 0.5-0.6 97 - 438 0.2-0.6 10 3.60 1.40 Smooth tyre **Free rolling
11.00 x 20,14 ply(bias/cross)
II 10-40 420-720 952 - 1 501 2.0-2.1 117 - 408 0.3-0.6 41 - 248 0.1-0.3 10 2.10 1.65 Free rolling
46 x 16, 30ply (Aircraft)
III 20-50 1448 2 057 - 2 240 1.4-1.5 261 - 502 0.2-0.3 137 - 279 0.1-0.2 10 1.70 1.00 Free rolling
315/80 R 22.5IV 25-100 500-1 000 900 - 2 689 1.8-2.7 59 - 410 0.1-0.4 99 - 538 0.2-0.5 10 1.82 1.53 Free rolling
75 900 2 381 2.6 637 0.7 302 0.3 10 2.68 1.27 Shear mode***
425/65 R 22.5 (Wide Base)
V 25-100 500-1 100 978 - 2 204 2.0-2.2 58 - 388 0.1-0.4 53 - 316 0.1-0.3 10 1.75 1.43 Free rolling
75 950 2 048 2.2 579 0.7 264 0.28 10 2.80 1.30 Shear mode
425/65 R 22.5R160AZ(Wide Base)
VI 25-100 500-1 100970 - 1 837 1.9-1.7 91 - 354 0.2-0.3 53 - 386 0.1-0.4 10 1.52 1.15 Free rolling
791 - 1 827 1.6-1.7 132 - 250 0.3-0.2 127 - 390 0.25-0.4
10 1.12 1.11 Freerolling(Smooth)
425/65 R 22.5R164BZ(Wide base)
VII25-100 500-1 100 917 - 2 183 1.8-2.0 90 - 337 0.2-0.3 66 - 240 0.1-0.2 10 1.54 1.12 Free rolling
75 950 1 828 1.9 656 0.7 253 0.27 10 3.61 1.37 Shear mode
* Normalized Contact Pressure (NCP): NCP is the minimum and maximum measured contact stress divided by the associated inflation pressure (See also Tielking, 1989).* * Some of the tyres tested were smooth (buffed down or trimmed) to a relatively smooth surface. This was to minimize scatter in the results owing to the tread pattern.*** The shear mode was achieved by “shearing” the test tyre over the surface of the VRSPTA during measurement under the HVS, at an angle between 7.5 degrees to 8 degrees.
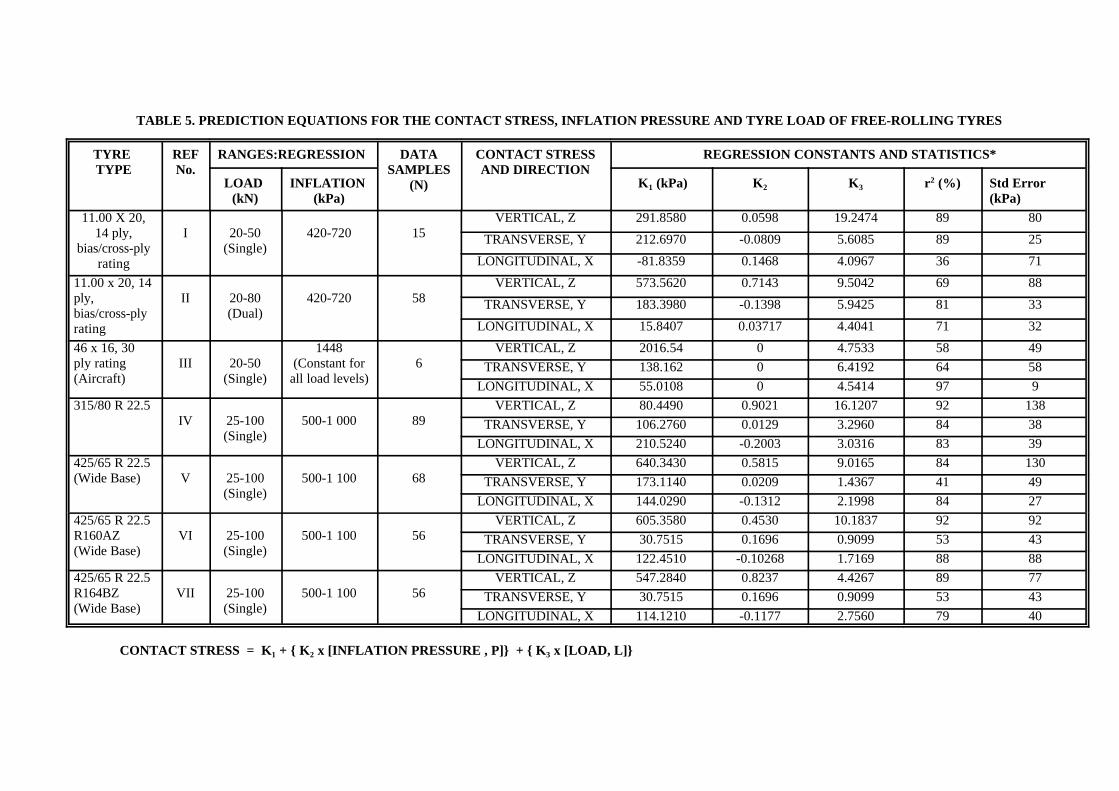
TABLE 5. PREDICTION EQUATIONS FOR THE CONTACT STRESS, INFLATION PRESSURE AND TYRE LOAD OF FREE-ROLLING TYRES
TYRE TYPE
REFNo.
RANGES:REGRESSION DATASAMPLES
(N)
CONTACT STRESSAND DIRECTION
REGRESSION CONSTANTS AND STATISTICS*
LOAD (kN)
INFLATION (kPa)
K1 (kPa) K2 K3 r2 (%) Std Error (kPa)
11.00 X 20,14 ply,
bias/cross-plyrating
I 20-50(Single)
420-720 15VERTICAL, Z 291.8580 0.0598 19.2474 89 80
TRANSVERSE, Y 212.6970 -0.0809 5.6085 89 25
LONGITUDINAL, X -81.8359 0.1468 4.0967 36 71
11.00 x 20, 14ply,bias/cross-plyrating
II 20-80(Dual)
420-720 58VERTICAL, Z 573.5620 0.7143 9.5042 69 88
TRANSVERSE, Y 183.3980 -0.1398 5.9425 81 33
LONGITUDINAL, X 15.8407 0.03717 4.4041 71 32
46 x 16, 30ply rating(Aircraft)
III 20-50(Single)
1448(Constant for
all load levels)6
VERTICAL, Z 2016.54 0 4.7533 58 49
TRANSVERSE, Y 138.162 0 6.4192 64 58
LONGITUDINAL, X 55.0108 0 4.5414 97 9
315/80 R 22.5IV 25-100
(Single)500-1 000 89
VERTICAL, Z 80.4490 0.9021 16.1207 92 138
TRANSVERSE, Y 106.2760 0.0129 3.2960 84 38
LONGITUDINAL, X 210.5240 -0.2003 3.0316 83 39
425/65 R 22.5 (Wide Base) V 25-100
(Single)500-1 100 68
VERTICAL, Z 640.3430 0.5815 9.0165 84 130
TRANSVERSE, Y 173.1140 0.0209 1.4367 41 49
LONGITUDINAL, X 144.0290 -0.1312 2.1998 84 27
425/65 R 22.5R160AZ(Wide Base)
VI 25-100(Single)
500-1 100 56VERTICAL, Z 605.3580 0.4530 10.1837 92 92
TRANSVERSE, Y 30.7515 0.1696 0.9099 53 43
LONGITUDINAL, X 122.4510 -0.10268 1.7169 88 88
425/65 R 22.5R164BZ(Wide Base)
VII 25-100(Single)
500-1 100 56VERTICAL, Z 547.2840 0.8237 4.4267 89 77
TRANSVERSE, Y 30.7515 0.1696 0.9099 53 43
LONGITUDINAL, X 114.1210 -0.1177 2.7560 79 40
CONTACT STRESS = K1 + { K2 x [INFLATION PRESSURE , P]} + { K3 x [LOAD, L]}

varied from 15 per cent to 34 per cent, when the loadwas increased from 50 to 100 per cent overloading.It is therefore obvious that these higher contact stressconditions should also be incorporated into therelative damage analysis in accelerated testing,especially in the case of relatively thin surfacings. Itis, however, doubtful (although not impossible) thatthese extreme load/stress conditions will generally befound on normal roads.
GENERAL: MEASURED STRESSES ANDPREDICTION EQUATIONS FOR SEVEN
TYPES OF TYRES
In the next section, a rather detailed analysis isgiven on the seven types of tyres tested. To aid inthe interpretation of data given later in Tables 4 and5,Figures 20 to 25 are included. These figuresillustrate six different conditions during VRSPTAtesting of five of the test tyres given in Table 1. InFigure 20 the three dimensional contact stress resultsof the HVS tyre (Type I) are illustrated. Note theeffect of tyre tread in the rather irregular pattern ofall three stresses. Typical results of the aircraft tyreand the wide-base tyres are given in Figures 21 to25. For both the aircraft tyre (Type III) and the315/80 R22.5 tyre (Type IV), the maximum verticalcontact stress occurred at the tyre centre at the loadand inflation pressure given. The wide-base tyre inFigure 23 (Tyre Type V) experienced somemaximum vertical and transverse stresses at the tyreedges at the rated load and inflation pressure.Figures 24 shows the results of another wide-basetyre at rated load and inflation pressure with themaximum stress at the tyre centre. In Figure 25 anoverloaded case on the same tyre as in Figure 24with the maximum stresses at the tyre edges is given.
In Figure 25d a typical imprint, i.e. contactpatch with vertical contact stress values from theVRSPTA is illustrated. This imprint is directlyobtained by the measured data and could therefore beused in subsequent analysis such as 3-D finiteelement, etc.
Maximum contact stresses and stress ratios. In this section a short summary of the measuredmaximum stresses obtained for the various tyres(seven types) tested is given. The most important ofthe measured data are summarized in Table 4. Thistable also gives the ranges of maximum stresses inthe X, Y, Z directions found for the various tyres,together with the maximum stress ratios. Asdiscussed for the smooth tyre, the relativemagnitudes of the three stress components measuredwith the VRSPTA (i.e. Vertical (Z), Transverse (Y)
and Longitudinal (X)) are expressed as the ratiobetween the maximum of these stresses. For all thecases investigated these ratios are given in the lastthree numerical columns in Table 4. In terms of tyreinflation pressure, the maximum stresses are alsonormalized, using the normalized contact pressure(NCP), and are also given in the table.
Discussion of the results in Table 4. Thetable indicates that the highest transverse stresses areobtained under the bias/cross-ply tyres under a“slow-moving free-rolling” condition. These stressesare between 21 per cent and 36 per cent of themaximum vertical stress. Most of the radial types oftyres tested here give transverse stresses between 11per cent and 18 per cent of the maximum verticalstresses. In general, for the tyres tested here under“slow-moving free-rolling” conditions it was foundthat the radial tyres give an average ratio of 10 : 1.6: 1.3. For the bias/cross-ply tyres the average ratiois 10 : 3 : 1.5. The smooth bias/cross-ply tyres seemto result in higher transverse ratios (up to 3.6). Interms of the NCP, it is seen that these ratios seldomexceed two (2), and, where they exceed this, it isassociated with extremely high loading. Thisfinding agrees well with an earlier theoreticalfinding by Tielking (1989).
Sideways shear (i.e. cornering). In order toobtain an idea of the additional transverse shearforces (stresses) that may develop under a conditionof cornering, the HVS test tyre was “sheared” overthe surface of the VRSPTA by moving the tyreduring testing towards the one side of the VRSPTAat an angle of approximately 7.5 to 8 degrees. Thetest results indicate that the transverse stressincreases by approximately 30 kPa/degree for thetyre Type IV, and approximately 50 kPa/degree forthe wide-base tyres. In terms of the ratio ofmaximum stresses, the transverse ratio increases toa range between 2.6 and 3.61. (See Table 4.)
Estimation of the three-dimensionaltyre/pavement contact stresses. Several predictionequations were developed for the estimation of thethree-dimensional maximum contact stresses of 7different types of tyres. Basically, a simple multiplelinear regression analysis was used relating themeasured maximum contact stress with both theinflation pressure and tyre load. These equations aresummarized in Table 5, for the Vertical (Z),Transverse (Y) and Longitudinal (X) stresses. Theanalysis indicated that both the tyre inflationpressure and load influence the contact stresses forall three directions. Some regression statistics arealso included in the table. The correlationcoefficient r2 is generally high for all the verticalstresses, except for one or two cases. The standard

error in predicted contact stress associated with thesecorrelations varies between 9 kPa and 138 kPa. Thegeneral form of the prediction equation is givenbelow:
CONTACT STRESS = K1 + { K2 x [INFLATIONPRESSURE , P]} + { K3 x [LOAD, L]}...................Eq 4
where:
Contact Stress in kPa;Inflation pressure, P in kPa;Tyre load, L in kN, andK1, K2 and K3 - the regression coefficientsfrom Table 5.
The purpose of these prediction equations is toassist engineers and practitioners to improve on theestimation of tyre/pavement contact stresses for usein pavement design, rehabilitation design, pavementevaluation, improved mechanistic design, possibletyre evaluation as well as the vehicle/road dynamicsproblem (Winkler, 1995). In Figures 26 and 27 theprediction equations are given in graphic formatover the range of loading and inflation pressuresused for the regression. It is important not to applythese equations (or graphs) outside the indicatedranges, as this may lead to some serious errors in theestimated contact stresses.
Vertical contact stress prediction at ratedtyre load and inflation pressure. For the practicalpurpose of estimating the actual maximum verticalcontact stress the regression equations given inTable 5 can also be used very effectively. Analysisof five of the tyres tested indicated that the predictedmaximum vertical stress from the regressionequations with the rated tyre load and rated inflationpressure is between 5 to 10 per cent of thatmeasured with the VRSPTA. Analysis of themaximum stresses at rated load and tyre inflationpressure of the five cases investigated here resultedin normalized contact pressure ratios (NCP, seeTable 4) between 1.6 and 2.7. This result comparesfavourably with similar findings from Yap (1988),where the NCP ranged between 1.2 and 2.0. It istherefore clear that the vertical stress in pavementdesign and analysis is grossly under-estimated byprevious methods by a factor of 1.6 to 2.7 times theinflation pressure in South Africa.
It is therefore suggested that the improved methodsfor estimating the contact stress given here be usedin pavement design and analysis until furtherresearch proves otherwise.
ANALYTICAL INVESTIGATION INTOSOME EFFECTS OF TWO-DIMENSIONAL
AND NON-UNIFORM TYRE CONTACTSTRESSES ON THIN ASPHALT
SURFACINGS
Introduction. In order to study some effects of thetwo-dimensional and sometimes highly non-uniformtyre/pavement contact stress distributions onrelatively thin asphaltic surfacings, a relativelysimplistic axi-symmetric two-dimensional finiteelement method was used. For the purposes of thisstudy it was decided to limit the analysis to a singlewheel load application on a typical B-category typeof pavement structure (TRH4, 1996). This pavementis normally designed to have a relatively thin (40mm) asphaltic surfacing layer, and is commonly usedin many areas in South Africa.
This pavement was also selected for analysishere since a great deal of HVS testing had been doneon the pavement, including several rehabilitationoptions (Steyn et al, 1996). The 40 mm asphalticsurfacing was constructed as one of the candidaterehabilitation options on a “cracked-and-seated”lightly cemented base/subbase layer, tested with theHeavy Vehicle Simulator (HVS) (Steyn et al, 1996).
Test pavement and materials. The pavementstructure is illustrated in Figure 28, together with thelinear elastic parameters used for the modelling withthe finite element method. Since the asphalt isrelatively thin, and the analysis aimed at thebehaviour under relatively high speed conditions, itwas decided to limit the study to instantaneousloading conditions. Therefore the time dependent(viscous) behaviour of the asphalt layer wasconsidered to be limited and not included here. Theauthors believe that for this condition the linearelastic solution (i.e. instantaneous loading) willsuffice for the purposes discussed here.
In the following section several load/stressidealizations are compared to one another, based onanalysis of the pavement structure given in Figure28.
J ))2''
12
[(FFrr&&FFbulk)2%%(FFtt&&FFbulk)
2%%(FFzz&&FFbulk)2]%%
SE/Volume ''12
[(FFrr,,rr%%FFtt,,tt%%FFzz,,zz)%%
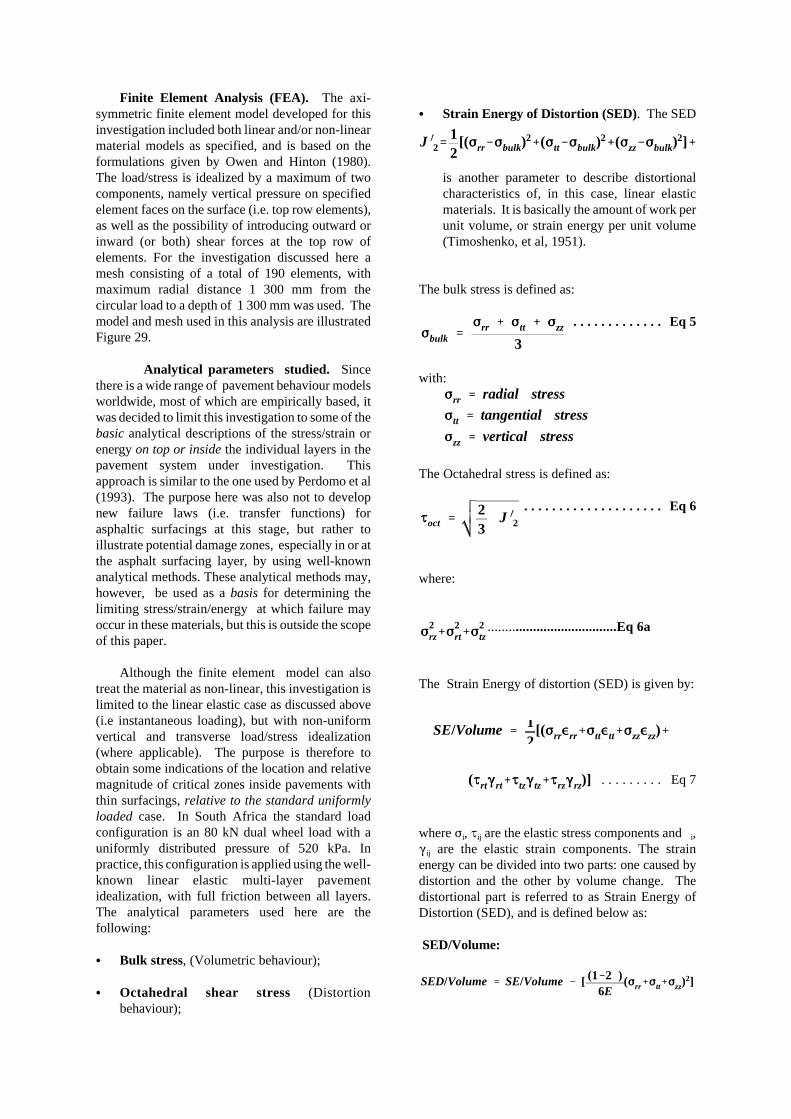
Finite Element Analysis (FEA). The axi-symmetric finite element model developed for thisinvestigation included both linear and/or non-linearmaterial models as specified, and is based on theformulations given by Owen and Hinton (1980).The load/stress is idealized by a maximum of twocomponents, namely vertical pressure on specifiedelement faces on the surface (i.e. top row elements),as well as the possibility of introducing outward orinward (or both) shear forces at the top row ofelements. For the investigation discussed here amesh consisting of a total of 190 elements, withmaximum radial distance 1 300 mm from thecircular load to a depth of 1 300 mm was used. Themodel and mesh used in this analysis are illustratedFigure 29.
Analytical parameters studied. Sincethere is a wide range of pavement behaviour modelsworldwide, most of which are empirically based, itwas decided to limit this investigation to some of thebasic analytical descriptions of the stress/strain orenergy on top or inside the individual layers in thepavement system under investigation. Thisapproach is similar to the one used by Perdomo et al(1993). The purpose here was also not to developnew failure laws (i.e. transfer functions) forasphaltic surfacings at this stage, but rather toillustrate potential damage zones, especially in or atthe asphalt surfacing layer, by using well-knownanalytical methods. These analytical methods may,however, be used as a basis for determining thelimiting stress/strain/energy at which failure mayoccur in these materials, but this is outside the scopeof this paper.
Although the finite element model can alsotreat the material as non-linear, this investigation islimited to the linear elastic case as discussed above(i.e instantaneous loading), but with non-uniformvertical and transverse load/stress idealization(where applicable). The purpose is therefore toobtain some indications of the location and relativemagnitude of critical zones inside pavements withthin surfacings, relative to the standard uniformlyloaded case. In South Africa the standard loadconfiguration is an 80 kN dual wheel load with auniformly distributed pressure of 520 kPa. Inpractice, this configuration is applied using the well-known linear elastic multi-layer pavementidealization, with full friction between all layers.The analytical parameters used here are thefollowing:
C Bulk stress, (Volumetric behaviour); C Octahedral shear stress (Distortion
behaviour);
C Strain Energy of Distortion (SED). The SED
is another parameter to describe distortionalcharacteristics of, in this case, linear elasticmaterials. It is basically the amount of work perunit volume, or strain energy per unit volume(Timoshenko, et al, 1951).
The bulk stress is defined as:
. . . . . . . . . . . . . Eq 5FFbulk ''
FFrr %% FFtt %% FFzz
3
with:FFrr '' radial stress
FFtt '' tangential stress
FFzz '' vertical stress
The Octahedral stress is defined as:
. . . . . . . . . . . . . . . . . . . . Eq 6JJoct ''
23
J ))2
where:
.....................................Eq 6aFF2rz%%FF
2rt%%FF
2tz
The Strain Energy of distortion (SED) is given by:
. . . . . . . . . Eq 7(JJrt((rt%%JJtz((tz%%JJrz((rz)]
where Fi, Jij are the elastic stress components and gi,(ij are the elastic strain components. The strainenergy can be divided into two parts: one caused bydistortion and the other by volume change. Thedistortional part is referred to as Strain Energy ofDistortion (SED), and is defined below as:
SED/Volume:
SED/Volume '' SE/Volume && [ (1&&2<<)6E
(FFrr%%FFtt%%FFzz)2]
where < is the Poisson’s ratio and E is the elasticmodulus.
Types of load/contact stress idealizations foranalysis purposes. Several types of load/contactstress idealization were evaluated in this study.These cases are summarized in Table 6 and inFigure 30. All the cases refer to the basic pavementstructure given in Figure 28 and to the analysismodel in Figure 29.
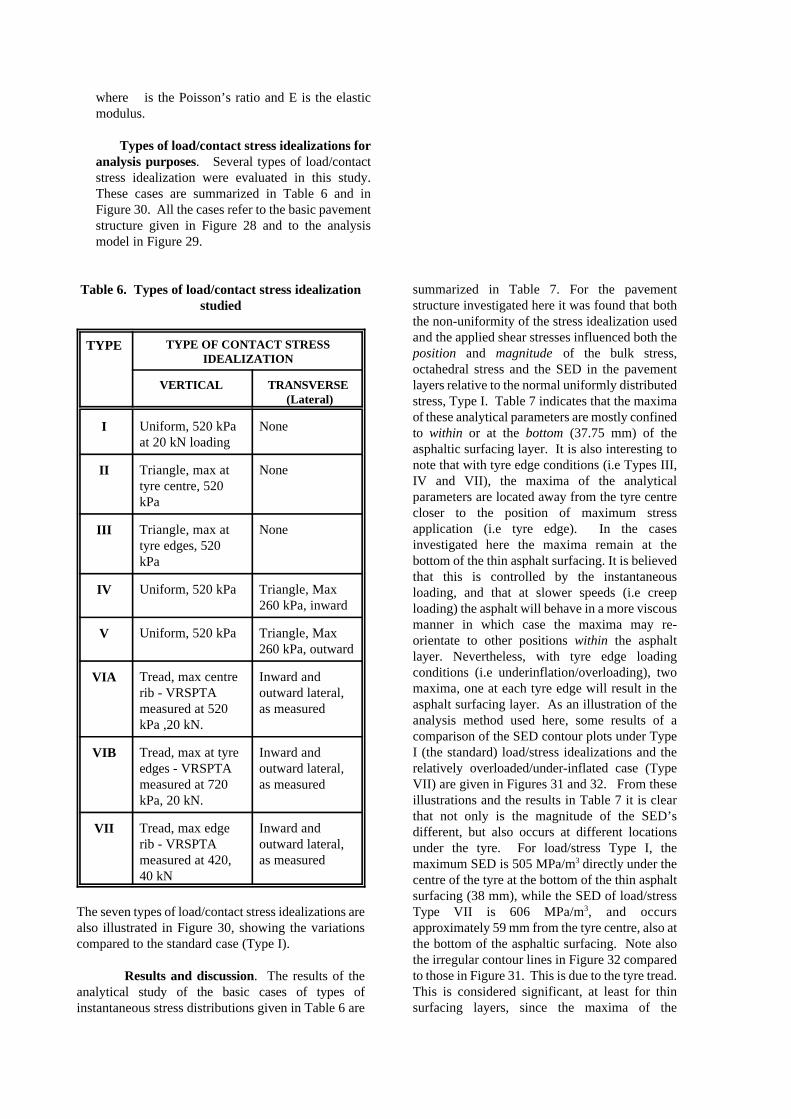
Table 6. Types of load/contact stress idealizationstudied
TYPE TYPE OF CONTACT STRESSIDEALIZATION
VERTICAL TRANSVERSE (Lateral)
I Uniform, 520 kPaat 20 kN loading
None
II Triangle, max attyre centre, 520kPa
None
III Triangle, max attyre edges, 520kPa
None
IV Uniform, 520 kPa Triangle, Max260 kPa, inward
V Uniform, 520 kPa Triangle, Max260 kPa, outward
VIA Tread, max centrerib - VRSPTAmeasured at 520kPa ,20 kN.
Inward andoutward lateral,as measured
VIB Tread, max at tyreedges - VRSPTAmeasured at 720kPa, 20 kN.
Inward andoutward lateral,as measured
VII Tread, max edgerib - VRSPTAmeasured at 420,40 kN
Inward andoutward lateral,as measured
The seven types of load/contact stress idealizations arealso illustrated in Figure 30, showing the variationscompared to the standard case (Type I).
Results and discussion. The results of theanalytical study of the basic cases of types ofinstantaneous stress distributions given in Table 6 are
summarized in Table 7. For the pavementstructure investigated here it was found that boththe non-uniformity of the stress idealization usedand the applied shear stresses influenced both theposition and magnitude of the bulk stress,octahedral stress and the SED in the pavementlayers relative to the normal uniformly distributedstress, Type I. Table 7 indicates that the maximaof these analytical parameters are mostly confinedto within or at the bottom (37.75 mm) of theasphaltic surfacing layer. It is also interesting tonote that with tyre edge conditions (i.e Types III,IV and VII), the maxima of the analyticalparameters are located away from the tyre centrecloser to the position of maximum stressapplication (i.e tyre edge). In the casesinvestigated here the maxima remain at thebottom of the thin asphalt surfacing. It is believedthat this is controlled by the instantaneousloading, and that at slower speeds (i.e creeploading) the asphalt will behave in a more viscousmanner in which case the maxima may re-orientate to other positions within the asphaltlayer. Nevertheless, with tyre edge loadingconditions (i.e underinflation/overloading), twomaxima, one at each tyre edge will result in theasphalt surfacing layer. As an illustration of theanalysis method used here, some results of acomparison of the SED contour plots under TypeI (the standard) load/stress idealizations and therelatively overloaded/under-inflated case (TypeVII) are given in Figures 31 and 32. From theseillustrations and the results in Table 7 it is clearthat not only is the magnitude of the SED’sdifferent, but also occurs at different locationsunder the tyre. For load/stress Type I, themaximum SED is 505 MPa/m3 directly under thecentre of the tyre at the bottom of the thin asphaltsurfacing (38 mm), while the SED of load/stressType VII is 606 MPa/m3, and occursapproximately 59 mm from the tyre centre, also atthe bottom of the asphaltic surfacing. Note alsothe irregular contour lines in Figure 32 comparedto those in Figure 31. This is due to the tyre tread.This is considered significant, at least for thinsurfacing layers, since the maxima of the
parameters therefore occur at both sides of the tyrecentre. It also indicates potential additional damagerelative to the accepted standard uniform loading case,Type I, where the maxima occur only at the tyre centre.This may not be the best illustration of this behaviour,but certainly points to the fact that overloaded/under-inflated tyres may cause potentially more damage to athis type of pavement than a tyre at its rated load andinflation pressure. The expected damage may includestructural distress such as cracking, rutting, crushingor a combination thereof, in or at the interface of thelayer directly beneath the thin asphaltic surfacinglayer.
It is also interesting to note that in some cases thetraditional use of a circular uniform stress distribution(Type I) results in higher SED’s than the actual non-uniform distribution, with lateral loading (Type VIA,Table 6). The implication of this finding should beinvestigated further, but may suggest possible “over-designing”, using higher stress conditions than reallyexist. It is, however, advisable to do a sensitivityanalysis, using several stress distributionsincorporating the most realistic pavementloading/stress situation that is to be catered for duringthe design and/or evaluation of the pavement.
A comparison of the bulk stress between Types Iand VIA shows that for Type VIA it is approximately26 per cent higher than that for Type I. In both casesit occurs at the tyre centre. This could have bothpositive and negative implications, depending on thestress stiffening/softening and viscous behaviour of thesurfacing material. For stress stiffening materials (likeconfined granular material) the higher bulk stressescould result in an increased effective elastic moduliunder the tyre. For stress softening and more viscousmaterials (like hot asphaltic surfacings, or wet clay forthat matter), these higher bulk stresses could result insome horizontal flow of the materials, squeezing out orinwards from the tyre contact patch, depending oninward or outward shear. Obviously the flow willoccur after some initial densification in the asphaltlayer, depending on the after-construction voidcontent.
Practical example from HVS testing. Followingthe method described above, a detailed analysis wasdone on the accelerated pavement test results of twoHVS test sections (HVS04 test no. 346A4 and 347A4),with a thin semi-gap graded asphalt surfacing. SeeFigure 29. In this case, using the contact stress Type
VIA2 on HVS section 346A4, transverse andlongitudinal fatigue cracking resulted on thesurface of the HVS test section after approximately1.4 million standard (40 kN, 520 kPa) load/stresscycles. On the other HVS section (347A4) on thesame pavement, a 70 kN dual wheel load at 520kPa inflation pressure was used to study therelative damage in terms of fatigue cracking,resulting from overloading (by load) on this typeof pavement. The stress idealization used herewas similar to Type VII in Table 6. This sectioncracked in a similar way to that of the previoussection at 40 kN dual wheel load, but only afterapproximately 2 million load/stress cycles.Clearly this illustrates some anomaly since it wasexpected that the higher load would result inearlier cracking than the lower load on a similarpavement structure. As a first step in the analysiseffective elastic moduli were back calculated usingsimple linear elastic multi-layer theory based onmeasured depth deflections from the Multi-DepthDeflectometer (MDD) (De Beer et al, 1988, Steynet al, 1996). This analysis resulted in the
2 Suggested it be the HVS standard 40 kNdual load @ 520 kPa inflation pressure, if themethod described here is used for analysis of HVSresults.

effective elastic moduli of the base and lower layers ofthe latter HVS test section being generally higher thanthose for the first section (346A4). This indicates thatthe pre-cracked cemented base and lower layers wereslightly stress stiffening, resulting in relatively highereffective elastic moduli for the 70 kN section. Thesemoduli values are indicated in Figure 29. The linearelastic theory with Type I loading could only partiallyexplain why the 40 kN section (346A4) cracked earlierthan the 70 kN section (347A4). Use of the analyticalparameters of bulk stress/strain, octahedralstress/strain, and hence the SED on both thesesections, indicated that the 70 kN section gaverelatively lower values for all the parameters studied.See Table 8. For instance, the strain energy ofdistortion (SED) is approximately 40 per cent lower onthe 70 kN section than on the 40 kN section. Inaddition, by comparing the SED from Type I loading(the results of Type I load/stress idealization are givenin bold and italics in Table 8), it can be seen that notonly are the SED and Octahedral stress/strain lowerfor Type I, but that they occur at the tyre centre, at thebottom of the asphalt layer. Furthermore for Type Iloading, some tensile stresses and strains are calculatedon the surface of the asphalt surfacing, outside the tyrecontact patch (approximately 204 mm from the tyrecentre). This is markedly different for the results fromthe Type VII load/stress idealization, where sometensile stresses were calculated at the bottom of theasphalt layer, away from the tyre centre but inside thetyre contact area. On the other hand, Type VII loadingfor the 70 kN section indicates maxima not only atdifferent positions from Type I and the 40 kN section,but also relatively lower values. Based on theforegoing, the authors believe that these lower valuesof the analytical parameters partly explain the anomalyfound with these HVS test sections, where the fatiguecracking of the thin surfacing occurred more rapidlyon the 40 kN section than on the 70 kN section.Further analysis based on a visco-elastic asphalt modeland varying the effective elastic moduli of the differentsupporting layers should however be done for moreconclusive results on this matter. This, however, isoutside the scope of this paper.
It is also interesting to note that the rutting on thesurfacing, at cracking in the asphalt layers, comparedfavourably with each other: 3.5 mm on the 40 kNsection (Section 346A4) and 5.5 mm on the 70 kNsection (Section 347A4). A study of the instantaneousbulk stress (in compression) on the 70 kN sectionshows it is only 5 per cent higher than that for the 40kN section (See Table 8). Note also that the Type Isolution resulted in quite different bulk stresses for thetwo sections.
Based on the findings above, and those indicatedby others (Perdomo et al, 1993), the authors are
confident that the approach described here willhave practical value. The calculations indicate animproved explanation of the macro observedbehaviour found on accelerated pavement testsections, as was illustrated by the case investigatedhere under HVS testing.
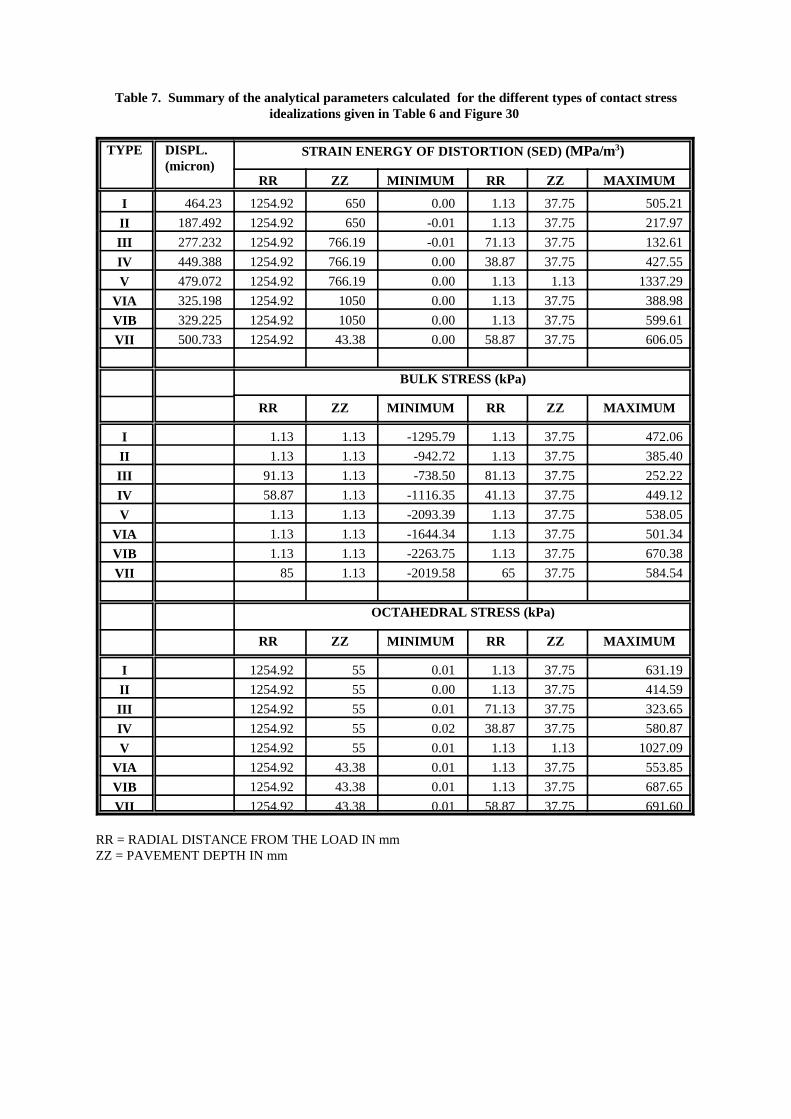
Table 7. Summary of the analytical parameters calculated for the different types of contact stressidealizations given in Table 6 and Figure 30
TYPE DISPL.(micron)
STRAIN ENERGY OF DISTORTION (SED) (MPa/m3)
RR ZZ MINIMUM RR ZZ MAXIMUM
I 464.23 1254.92 650 0.00 1.13 37.75 505.21
II 187.492 1254.92 650 -0.01 1.13 37.75 217.97
III 277.232 1254.92 766.19 -0.01 71.13 37.75 132.61
IV 449.388 1254.92 766.19 0.00 38.87 37.75 427.55
V 479.072 1254.92 766.19 0.00 1.13 1.13 1337.29
VIA 325.198 1254.92 1050 0.00 1.13 37.75 388.98
VIB 329.225 1254.92 1050 0.00 1.13 37.75 599.61
VII 500.733 1254.92 43.38 0.00 58.87 37.75 606.05
BULK STRESS (kPa)
RR ZZ MINIMUM RR ZZ MAXIMUM
I 1.13 1.13 -1295.79 1.13 37.75 472.06
II 1.13 1.13 -942.72 1.13 37.75 385.40
III 91.13 1.13 -738.50 81.13 37.75 252.22
IV 58.87 1.13 -1116.35 41.13 37.75 449.12
V 1.13 1.13 -2093.39 1.13 37.75 538.05
VIA 1.13 1.13 -1644.34 1.13 37.75 501.34
VIB 1.13 1.13 -2263.75 1.13 37.75 670.38
VII 85 1.13 -2019.58 65 37.75 584.54
OCTAHEDRAL STRESS (kPa)
RR ZZ MINIMUM RR ZZ MAXIMUM
I 1254.92 55 0.01 1.13 37.75 631.19
II 1254.92 55 0.00 1.13 37.75 414.59
III 1254.92 55 0.01 71.13 37.75 323.65
IV 1254.92 55 0.02 38.87 37.75 580.87
V 1254.92 55 0.01 1.13 1.13 1027.09
VIA 1254.92 43.38 0.01 1.13 37.75 553.85
VIB 1254.92 43.38 0.01 1.13 37.75 687.65
VII 1254.92 43.38 0.01 58.87 37.75 691.60
RR = RADIAL DISTANCE FROM THE LOAD IN mmZZ = PAVEMENT DEPTH IN mm
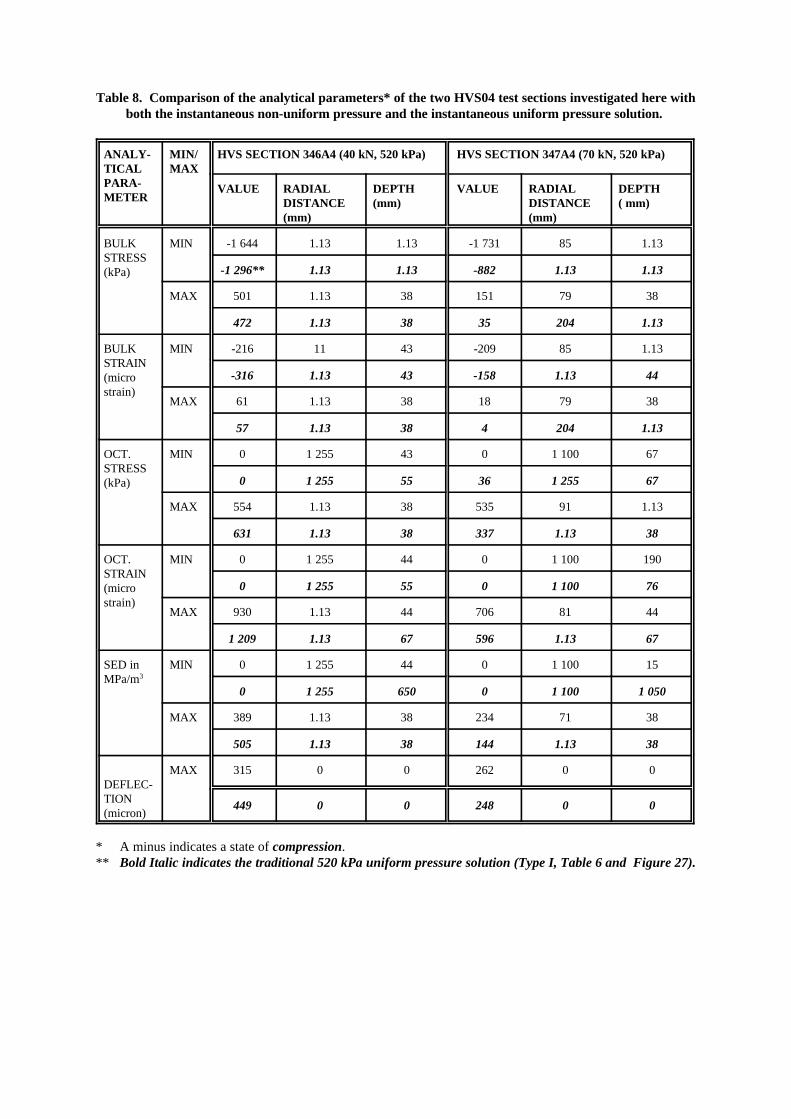
Table 8. Comparison of the analytical parameters* of the two HVS04 test sections investigated here withboth the instantaneous non-uniform pressure and the instantaneous uniform pressure solution.
ANALY-TICALPARA-METER
MIN/MAX
HVS SECTION 346A4 (40 kN, 520 kPa) HVS SECTION 347A4 (70 kN, 520 kPa)
VALUE RADIALDISTANCE (mm)
DEPTH(mm)
VALUE RADIALDISTANCE (mm)
DEPTH ( mm)
BULKSTRESS (kPa)
MIN -1 644 1.13 1.13 -1 731 85 1.13
-1 296** 1.13 1.13 -882 1.13 1.13
MAX 501 1.13 38 151 79 38
472 1.13 38 35 204 1.13
BULKSTRAIN(microstrain)
MIN -216 11 43 -209 85 1.13
-316 1.13 43 -158 1.13 44
MAX 61 1.13 38 18 79 38
57 1.13 38 4 204 1.13
OCT.STRESS(kPa)
MIN 0 1 255 43 0 1 100 67
0 1 255 55 36 1 255 67
MAX 554 1.13 38 535 91 1.13
631 1.13 38 337 1.13 38
OCT.STRAIN(microstrain)
MIN 0 1 255 44 0 1 100 190
0 1 255 55 0 1 100 76
MAX 930 1.13 44 706 81 44
1 209 1.13 67 596 1.13 67
SED inMPa/m3
MIN 0 1 255 44 0 1 100 15
0 1 255 650 0 1 100 1 050
MAX 389 1.13 38 234 71 38
505 1.13 38 144 1.13 38
DEFLEC-TION(micron)
MAX 315 0 0 262 0 0
449 0 0 248 0 0
* A minus indicates a state of compression.** Bold Italic indicates the traditional 520 kPa uniform pressure solution (Type I, Table 6 and Figure 27).

It is also believed that this type of approach will bevaluable in the everyday analysis of pavements,especially of pavement surfacings in need ofrehabilitation of some kind, as well as in the study ofthe effect of increased tyre inflation pressures andloads on existing road systems.
SUMMARY AND CONCLUSIONS
This paper describes a system developed for thesimultaneous measurement of tyre/pavementinterface contact stresses of slow-moving pneumatictruck tyres. The Vehicle-Road Surface PressureTransducer Array (VRSPTA) has been developedover the last few years in South Africa for theimproved quantification of the vertical, transverseand longitudinal tyre/pavement interface contactstresses. This instrument was needed since manyyears of accelerated pavement testing (APT)) hasbeen done on pavements with relatively thinsurfacing layers, using the Heavy Vehicle Simulator(HVS) assuming a uniform vertical stressdistribution in all analysis done. In addition to theAPT research, field evidence also suggested that animproved understanding of the actual contactstresses is urgently needed, since the evidencepointed to several failures from the “surface”, ratherthan from a lack of bearing capacity of thepavements. This therefore necessitated improveddefinitions of the associated contact stressesmentioned above.
The VRSPTA (SIM MK II) was used in thisstudy to investigate the three-dimensionaltyre/pavement contact stresses of seven differenttypes of tyres, ranging from bias/cross ply, to radials,including three types of wide-base tyres. These tyreswere loaded over wide ranges of load and inflationpressure. Several basic concepts of measuredtyre/pavement contact stresses are highlighted. Thestress ratios between the maximum of the threestresses were used to define some differencesbetween the different tyre types. It was clearlydemonstrated that most of the time the maximumvertical contact stresses are indeed higher than thetyre inflation pressure. Even under the rated loadand inflation pressure these contact stresses can beup to twice the tyre inflation pressure. In addition,several predictive equations for 3-D contact stresseswere developed for the tyres tested to allow arelatively accurate estimation of the maximumexpected tyre/pavement contact stresses for a fixedload and inflation pressure condition.
A detailed pavement analysis was also done,using a finite element approach in order to define thenon-uniform contact stresses, both vertical andtransverse. The analysis was confined to theinstantaneous loading on a pavement consisting of arelatively thin (< 50 mm) asphaltic surfacing layersince this is typical of many pavements in SouthAfrica. The analysis indicated that the strain energyof distortion, bulk stresses and octahedral shearstress (i.e. analytical parameters) in the pavementunder instantaneous loading change as a function ofthe applied stress. It was demonstrated that themaximum of these analytical parameters occurs closeto the maximum of the applied stress. Thiseffectively means that a tyre loaded at the rated loadand inflation pressure may produce maximumstresses, and hence the calculated analyticalparameters at the tyre centre position near thebottom of the thin surfacing. On the other hand, anoverloaded/under inflated tyre may result in twomaxima located within the asphalt layer under themaximum applied stress position (i.e. tyre edges) inthis case. It is also interesting to note that theconventional method using a uniform vertical stressdistribution, causes some tensile stresses on thesurface of the asphaltic layer, outside the tyre contactpatch which may suggest that load/stress associatedcracking originates from the surface of the asphaltlayer downwards. By using the method of strainenergy of distortion (SED) based on instantaneousnon-uniform and shear (lateral) stress application,the relative magnitude of the octahedral stress seemsto suggest possible damage from the surface of theasphalt layer. It appears therefore that improvedunderstanding and definition of the applied contactstress idealization may result in different answersfrom those achieved by conventional methods.Advanced analytical tools should be made availableto practitioners in order to take the identifieddifferences in contact stress into account duringanalysis and design of flexible pavement structures.
It is concluded that an effective method has beendeveloped for the measurement of tyre/pavementcontact stresses, and that the information gainedresulted in improved methods for the estimation ofthe vertical, transverse and longitudinal forces (i.e.stresses), of slow-moving pneumatic tyres. Also, theuse of non-uniform and shear (lateral) stresses in thedesign and analysis of flexible pavements with thinsurfacings indicates the possibility of large potentialdifferences compared to conventional design andanalysis methods.
RECOMMENDATIONS
It is recommended that the various methodsdescribe here be used in practice as well as in

accelerated pavement test facilities for the improveddefinition of the tyre/pavement contact stressproblem. It is also recommended that analysismethods be improved to incorporate non-uniformvertical and lateral shear stress, and that it should bemade available to practice as soon as possible.
The following are specific recommendations forfurther research:
C Include general and advanced tyrecharacteristics such as tyre stiffness, rubbermoduli, temperature effects, etc, in furtherstudies using the VRSPTA. The goal hereshould be to develop a simplistic tyre model tobe used for pavement design purposes.
C Study the effects of vehicle/tyre speed on thedistribution of the three stress components fortypical trucks. Limited work in this regard hasalready started and it is clear that tyre/wheeldynamics may dominate the shape of especiallythe vertical contact stress distribution.
C Study the effects of differential wear on trucktyres, since some evidence points to largevariations in contact stress distributions owingto local wear patches on the tyre tread (De Beeret al, 1996). Some research into this aspect isalready given by Changizi (1994).
C Study the effect of variable friction on thesurface of the VRSPTA, as well as differentheights of the measuring pins.
C Develop an improved tyre model for use in bothstatic and dynamic analysis of pavementstructures.
C Investigate the feasibility of the principle ofusing the VRSPTA technology for thedevelopment of future “Stress-in-Motion” (SIM)systems. This could enhance the current“Weigh-in-Motion” (WIM) technology. Theaim here should be to obtain the contact stressesdirectly under moving vehicles, as opposed toonly the axle loads, as also suggested byCunagin et al, (1986). Such a demonstrationproject is currently being constructed onNational Highway 1 (N1) near Montsole, northof Pretoria in South Africa.
ACKNOWLEDGEMENTS
The Gauteng Department of Public Roads(Gautrans) is thanked for their continuous supportduring this study, as well as for the use of their
Heavy Vehicle Simulator (HVS) which wasinvaluable for conducting the VRSPTA testing.Especially Me E Sadzick of Guatrans is thanked forher support. Messrs. Neil Kuhn, Danie Botha,Willie Diederiks and the support staff at the HVStest site are especially thanked for their invaluablecontribution in making this project a success.
The Road and Hydraulic Engineering Division(RHED) of the Dutch Ministry of Transport, PublicWorks and Water Management is also gratefullyacknowledged in sponsoring some of the researchmeasurements given in this paper.
Prof A A A Molenaar of the Road and RailroadResearch Laboratory of the Delft University ofTechnology (RRRL, TUDELFT), The Netherlands,is also thanked for his motivation and support withthis cooperative international contract researchproject.
The Director of Transportek, a Division of theCouncil for Scientific and Industrial Research(CSIR) in South Africa is thanked for his supportduring this study.
REFERENCES
Bonse, R.P.H., Kuhn, S.H (1959). Dynamic forcesexerted by Moving Vehicles on a Road Surface.Highway Research Board Bulletin 233:Flexible Pavement Design, pp 9 - 32.
Changizi, K. 1994. A Computer Method ofAnalysis for Tire Wear Characterization,Identification and Classification. ASTMJournal of Testing and Evaluation, JTEVA,Volume 22, Number 1, pp 45 - 47.
Cunagin, W. D., Auoub, N. A., (1986). Feasibilityof Automating Truck Tire Pressure DataCollection, Research performed in cooperationwith Federal Highway Administration,Department Of Transport. College Station, Tx:Texas Transportation Institute.
Davisson, J.A., ( 1969). Design and Application ofCommercial Type Tires, The Fifteenth L. RayBuckendale Lecture. Warrendale, PA: SocietyOf Automotive Engineers. (SP-344).
De Beer, M., Horak, E., Visser, A.T, (1988). TheMulti-Depth Deflectometer (MDD) System fordetermining the Effective Elastic Moduli ofPavement Layers. First InternationalSymposium on Non-destructive Testing ofPavements and Back Calculation of Moduli.Baltimore, USA, 26 June to 1 July 1988.
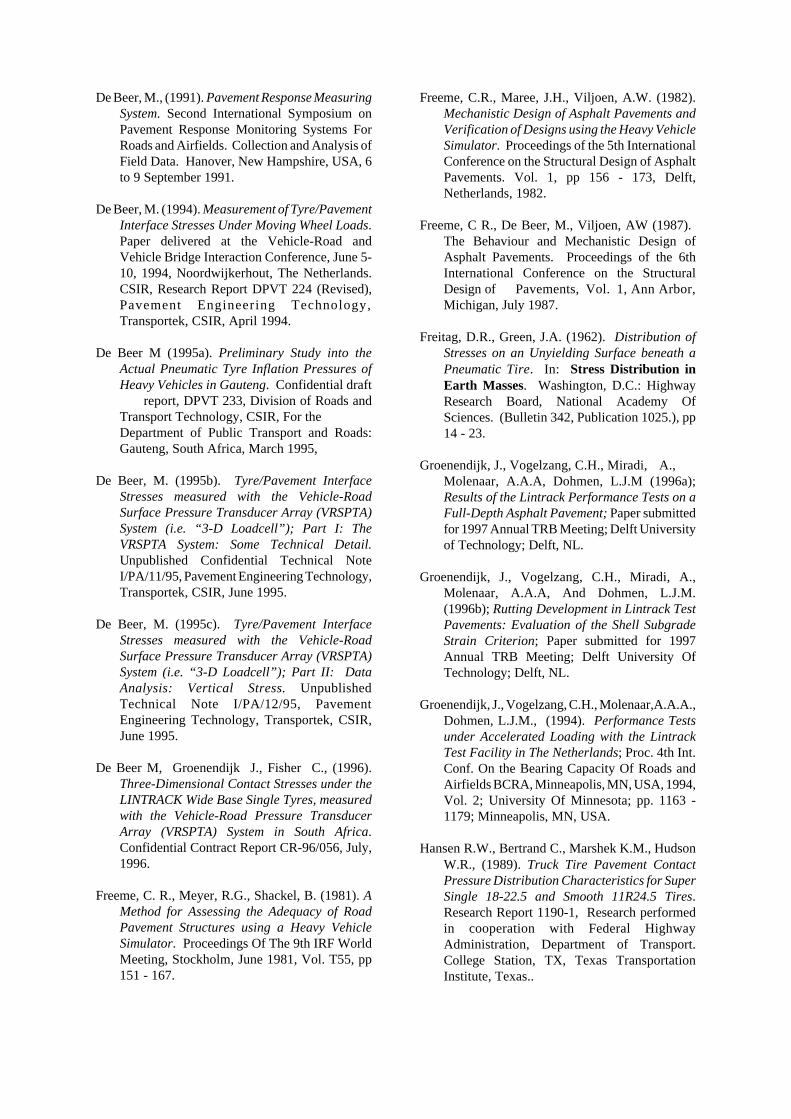
De Beer, M., (1991). Pavement Response MeasuringSystem. Second International Symposium onPavement Response Monitoring Systems ForRoads and Airfields. Collection and Analysis ofField Data. Hanover, New Hampshire, USA, 6to 9 September 1991.
De Beer, M. (1994). Measurement of Tyre/PavementInterface Stresses Under Moving Wheel Loads.Paper delivered at the Vehicle-Road andVehicle Bridge Interaction Conference, June 5-10, 1994, Noordwijkerhout, The Netherlands.CSIR, Research Report DPVT 224 (Revised),Pavement Engineering Technology,Transportek, CSIR, April 1994.
De Beer M (1995a). Preliminary Study into theActual Pneumatic Tyre Inflation Pressures ofHeavy Vehicles in Gauteng. Confidential draft
report, DPVT 233, Division of Roads andTransport Technology, CSIR, For the Department of Public Transport and Roads:Gauteng, South Africa, March 1995,
De Beer, M. (1995b). Tyre/Pavement InterfaceStresses measured with the Vehicle-RoadSurface Pressure Transducer Array (VRSPTA)System (i.e. “3-D Loadcell”); Part I: TheVRSPTA System: Some Technical Detail.Unpublished Confidential Technical NoteI/PA/11/95, Pavement Engineering Technology,Transportek, CSIR, June 1995.
De Beer, M. (1995c). Tyre/Pavement InterfaceStresses measured with the Vehicle-RoadSurface Pressure Transducer Array (VRSPTA)System (i.e. “3-D Loadcell”); Part II: DataAnalysis: Vertical Stress. UnpublishedTechnical Note I/PA/12/95, PavementEngineering Technology, Transportek, CSIR,June 1995.
De Beer M, Groenendijk J., Fisher C., (1996).Three-Dimensional Contact Stresses under theLINTRACK Wide Base Single Tyres, measuredwith the Vehicle-Road Pressure TransducerArray (VRSPTA) System in South Africa.Confidential Contract Report CR-96/056, July,1996.
Freeme, C. R., Meyer, R.G., Shackel, B. (1981). AMethod for Assessing the Adequacy of RoadPavement Structures using a Heavy VehicleSimulator. Proceedings Of The 9th IRF WorldMeeting, Stockholm, June 1981, Vol. T55, pp151 - 167.
Freeme, C.R., Maree, J.H., Viljoen, A.W. (1982).Mechanistic Design of Asphalt Pavements andVerification of Designs using the Heavy VehicleSimulator. Proceedings of the 5th InternationalConference on the Structural Design of AsphaltPavements. Vol. 1, pp 156 - 173, Delft,Netherlands, 1982.
Freeme, C R., De Beer, M., Viljoen, AW (1987). The Behaviour and Mechanistic Design ofAsphalt Pavements. Proceedings of the 6thInternational Conference on the StructuralDesign of Pavements, Vol. 1, Ann Arbor,Michigan, July 1987.
Freitag, D.R., Green, J.A. (1962). Distribution ofStresses on an Unyielding Surface beneath aPneumatic Tire. In: Stress Distribution inEarth Masses. Washington, D.C.: HighwayResearch Board, National Academy OfSciences. (Bulletin 342, Publication 1025.), pp14 - 23.
Groenendijk, J., Vogelzang, C.H., Miradi, A.,Molenaar, A.A.A, Dohmen, L.J.M (1996a);Results of the Lintrack Performance Tests on aFull-Depth Asphalt Pavement; Paper submittedfor 1997 Annual TRB Meeting; Delft Universityof Technology; Delft, NL.
Groenendijk, J., Vogelzang, C.H., Miradi, A.,Molenaar, A.A.A, And Dohmen, L.J.M.(1996b); Rutting Development in Lintrack TestPavements: Evaluation of the Shell SubgradeStrain Criterion; Paper submitted for 1997Annual TRB Meeting; Delft University OfTechnology; Delft, NL.
Groenendijk, J., Vogelzang, C.H., Molenaar,A.A.A.,Dohmen, L.J.M., (1994). Performance Testsunder Accelerated Loading with the LintrackTest Facility in The Netherlands; Proc. 4th Int.Conf. On the Bearing Capacity Of Roads andAirfields BCRA, Minneapolis, MN, USA, 1994,Vol. 2; University Of Minnesota; pp. 1163 -1179; Minneapolis, MN, USA.
Hansen R.W., Bertrand C., Marshek K.M., HudsonW.R., (1989). Truck Tire Pavement ContactPressure Distribution Characteristics for SuperSingle 18-22.5 and Smooth 11R24.5 Tires.Research Report 1190-1, Research performedin cooperation with Federal HighwayAdministration, Department of Transport.College Station, TX, Texas TransportationInstitute, Texas..

Horak, E., Kleyn, E.G., Du Plessis, J.A., De Villiers,E.M. And Thompson, A.J. (1992); The Impact
of the Heavy Vehicle Simulator (HVS) Fleet inSouth Africa; Proceedings of the 7thInternational Conference on Asphalt Pavements(ISAP), Performance Volume 2, August, 1992,pp 134 - 150, Nottingham, UK.
Hugo F., (1996). Texas Mobile Load Simulator TestPlan. Preliminary review copy, ResearchReport 1978-1, February 1996.
Huhtala, M. (1990) Truck Tires and Pavements. In: International Conference on BearingCapacity of Roads and Airfields. 3rd,Trondheim, Norway, 3 - 5 July 1990, pp 669 -679.
Ioannides A.M., Khazanovich L., (1993). LoadEquivalency Concepts: A MechanisticReappraisal. Pavement Design, Management,and Performance, TRR 1388, Washington DC,USA.
Irick P.E, Hudson W.R. (1964). Guidelines forSatellite Studies of Pavement Performance.NCHRP Report 2A, Highway Research Board,National Academy of Science, NationalResearch Council, 1964, USA.
Jacobs, M.M.J., Moraal, J. (1992). The Influence ofTyre Characteristics on the Normal Stresses inAsphalt Concrete Pavements. Heavy Vehiclesand Roads: Technology, Safety and Policy;Edited By D. Cebon and C.G.B. Mitchell.(Proceedings of the Third InternationalSymposium on Heavy Vehicle Weights andDimensions, organised by the University OfCambridge and held at Queen’s College,Cambridge, UK, 28 June - 2 July 1992), pp 218- 224.
Jameson G.W., Yeo R., Sharp K., Vertessy N.,(1996). Performance of Cement-StabilizedFlyash under Accelerated Loading: the EraringTrial 1995. APRG Report No 15/ARR 281,ARRB Transport Research, Australia, 1996.
Lippmann, S.A., Oblizajek, K.L (1974). The
Distribution of Stress between the Thread andthe Road. In: Automotive EngineeringCongress. Detroit, Michigan, February 25 -March 1, 1974.
Lister, N.W., Nunn, D.E. (1968). Contact Areas ofCommercial Vehicle Tyres. Crowthorne,Berkshire: Road Research Laboratory. (RRLReport; LR 172), UK.
Maasdorp, G., South Africa in a New World of Trade: The Implications for Transport Policy
and Infrastructure. Paper presented at theIntermodal Africa’96 Conference, Durban, 13-15 March 1996.
Mante, B.R., Molenaar, A.A.A., Groenendijk,J.(1995a). Stresses and Strains in Pavements(Non-uniform Three-Dimensional StressDistributions in the Tire Pavement Interface).Delft University of Technology, Faculty of CivilEngineering, Road and Railroad ResearchLaboratory. (Report 7-95-209-32m).
Mante, B.R., Molenaar, A.A.A., Groenendijk, J.(1995b); Stresses and Strain in Pavements -L in t rack Response Measurements :Identification of Damaging Effects of SeveralWheel-load Configurations, Part 1 Main ReportAnd Part 2, Measurement Data andAppendices; Reports 7-95-209-33M and 7-95-209-34M; Delft University of Technology,Faculty of Civil Engineering; Delft, NL.
Marshek K.M., Chen H.H. Connel R.B. Saraf C.L.(1986). The Effect of Truck Tire InflationPressure and Axle Load on Flexible and RigidPavement Performance, TransportationResearch Board (TRB) Meeting, 65th,January 1986, Washington D.C., USA.
Martin F,(1936). Druckverteilung inderBeruhrungsflache zwischen kraft-fahrzeugreifen und Fahrbahn. Band 80, No 44,pp 1333-1334, 31 October, 1936.
Nordengen, P.A., Sallie, I. (1995). A Survey ofHeavy Vehicles crossing the Namibia-SouthAfrica Border. (Unpublished Final Report byDivision of Roads and Transport Technology,CSIR, for Department of Transport,South Africa nd Department of Transport,Namibia), 1995.
Owen D.R.J., Hinton E. (1980). Finite Elements inPlasticity: Theory and Practice. Department ofCivil Engineering, University College ofSwansea, UK, Pineridge Press Limited, 91 WestCross Lane, West Cross, Swansea, UK
Perdomo, D., Nokes, B. (1993). TheoreticalAnalysis of the Effects of Wide-Base Tires OnFlexible Pavements. In: Rigid and FlexiblePavement Design and Rehabilitation (Pavement Design, Management, andPerformance). Washington, D.C.: Transportation Research Board. (TransportationResearch Record; 1388), pp 60 - 69.
Pezo, R.F., Marshek, KM., Hudson, W.R. (1989). Truck Tire Pavement Contact PressureDistribution Characteristics for the BiasGoodyear 18-22.5, the Radial Michelin 275/80
R/24.5, the Radial Michelin 255/70 R/22.5 andthe Radial Goodyear 11R24.5 Tires; Researchperformed in cooperation with Federal HighwayAdministration, Department of Transport.College Station, Tx: Texas TransportationInstitute.
Pidwerbesky, B.D. (1989). Canterbury AcceleratedPavement Testing Indoor Facility. NewZealand: Department of Civil Engineering,University of Canterbury. (Research Report 89-10)
Pidwerbesky, B.D., Dawe, R.W. (1990a). CAPTIFProject Two: Weak Subgrades, Geotextiles andTyre Trials. New Zealand: Department OfCivil Engineering, University Of Canterbury.(Research Report 90-1)
Pidwerbesky, BD., Dawe, R.W., (1990b). RelativeRutting Effects of Different Tyre Types. NewZealand: Department of Civil Engineering,University Of Canterbury. (Research Report 90-7).
Road Note 27. (1960). Instructions for using thePortable Skid-Resistance Tester. RoadResearch Laboratory, HMSO, London, 1960.
Clark S.K. (1981). Mechanics of Pneumatic Tires;Edited by S.K. Clark. Washington, D.C.: USDepartment of Transportation, NationalHighway Traffic Safety Administration.
Roberts, F.L., Rosson, B.T. (1985). EstablishingMaterial Properties for Thin Asphalt ConcreteSurfaces on Granular Bases, Researchperformed in cooperation with Federal HighwayAdministration, Department of Transport.College Station, Tx: Texas TransportationInstitute.
Sallie, I, Nordengen P.A., (1995). South AfricanHeavy Vehicle Overloading Statistics - 1995.Report CR-96/053, Division of Roads andTransport Technology, CSIR, Pretoria, SouthAfrica.
Sebaaly, P. & Tabatabaee, N. 1989. Effect of TirePressure and Type on Response of FlexiblePavements. In: Rigid and Flexible PavementDesign and Analysis; Unbound GranularMaterials, Tire Pressures, Back Calculation,And Design Methods. Washington, D.C.:Transportation Research Board, NationalResearch Council. (Transportation ResearchRecord; 1227), pp 97 - 106.
Sebaaly, P.E., & Tabatabaee, N. (1992). Effect ofTire Parameters on Pavement Damage andLoad-Equivalency Factors. Journal Of
Transportation Engineering, Volume 118,Number 6, pp 805 - 819. (Paper No 1824).
South African Bureau of Standards (SABS): SABS1550-1 to 7 and 10:1992. Specification: MotorVehicle Tyres and Rims - Dimensions andLoads, 1994.
South Africa. Department of Transport. 1996.Road Traffic Act, 1989, (Act No. 29 of 1989)
Amendment of the Road TrafficRegulations. South Africa. Republic ofSouth Africa Government Gazette, Vol.368 (16980), 16 February 1996.(Regulation gazette; No. 5639). pp 20 -24.
Steyn, W.J. vdM. (1995). Guideline to the Use andOperation of the Heavy Vehicle Simulator(HVS). Division of Roads and TransportTechnology, CSIR, Unpublished TechnicalReport I/PA/3/95, Pretoria, South Africa.
Steyn, W.J. vdM., De Beer M, Visser A.T. (1996).Thin Asphalt and Double Seal RehabilitatedLightly Cemented Pavements: Evaluation ofStructural Behaviour and Life Cycle Cost.Paper accepted for publication at the 8th ICAPin Seattle, August 1997, USA.
TRH4 (1996): Structural Design of FlexiblePavements for Interurban and Rural Roads,Draf t TRH4 (1996) . Technica lRecommendations for Highways (TRH),Pretoria, South Africa, .1996.
Theyse, H.L., De Beer, M., Rust F.C. (1996)Overview of The South African MechanisticPavement Design Analysis Method. PaperPreprint 961294, Transportation Research
Board Meeting, January 1996, Washington, DC
Tielking J.T., (1989). Aircraft Tire/PavementPressure Distributions. SAE Technical PaperSeries, 892351, Anaheim, California, September25-28, 1989, USA.
Tielking, J.T. (1984). A Finite Element Tire Model. Tire Science and Technology, Volume 11,
Number 1 - 4, pp 50 - 63.
Tielking, J.T., Roberts, F. L. (1987). Tire ContactPressure and its Effect on Pavement Strain.Journal of Transportation Engineering,Volume 113, Number 1, pp 56 - 71.
Tielking J T., Abraham, M. A. (1994). Measurements of Truck Tire FootprintPressures.In: Transportation Research Board(TRB) Meeting, 73rd, January 1994. (Paper No940052).
Timoshenko S., Goodier J.N., (1951). Theory ofElasticity, Second Edition, McGraw, Inc.
Uzan, J. , Sides, A. (1987). The Effect of ContactArea Shape and Pressure Distribution on Multi-Layer Systems Response. In: PavementEvaluation and Rehabilitation. Washington,DC.: Transportation Research Board, NationalAcademy of Sciences. (Transportation ResearchRecord; 1117), Pp 21 - 24.
Van Vuuren, D.J. 1974. Tyre Pressure and its Effecton Pavement Design and Performance. Pretoria:National Institute for Road Research (NITRR),Council for Scientific And Industrial Research(CSIR). (NITRR Report; RR 192).
Wardle, L.J. 1977. Program Circle. A ComputerProgram for the Analysis of Multiple ComplexCircular Loads on Layered and Isotropic Media.Mount Waverley, Victoria, Australia: DivisionOf Applied Geomechanics, CommonwealthScientific and Industrial Research Organization(CSIRO). (User’s Manual, GeomechanicsComputer Program, Number 2).
Winkler C..B., (1995). Road Transport Technology-4. Proceedings of the Fourth InternationalSymposium on Heavy Vehicle Weights andDimensions, organised by the University ofMichigan Transportation Research Institute incooperation with the International Forum forRoad Transport Technology, Ann Arbor, USA,June 25-29, 1995.
Woodside, A.R (1992). Assessment of the InterfacialStresses in a Composite Highway Surfacingunder Heavy Goods Vehicle Loading. In: HeavyVehicles and Roads: Technology, Safety AndPolicy; Edited by D. Cebon and C.G.B. Mitchell.(Proceedings of the Third InternationalSymposium on Heavy Vehicle Weights andDimensions, organised by the University ofCambridge and held at Queen’s College,Cambridge, UK, 28 June - 2 July 1992), pp 51 -58.
Woodside, A.R., Wilson, J.Liu, Guo Xin. (1992). The Distribution of Stresses at the Interfacebetween Tyre and Road and their Effect onSurface Chippings. In: InternationalConference on Asphalt Pavements, 7th, ISAP,Nottingham, 1992., UK.
Yap P., (1988). A Comparative Study of the Effectof Truck Tire Types on Road Contact Pressures.
Paper No. 881846 in Vehicle-PavementInteraction-where the truck meets the road, SP-765, Society of Automotive Engineers, Inc,Warrendale, PA, 15096-0001, November 1988.
Yoder E. J., Witczack K.M.W. (1975).. Principlesof Pavement Design, Second Edition, New York,
Wiley-Interscience Publications, 1975.
C:\ISAP\ICAPFIN4.MDB
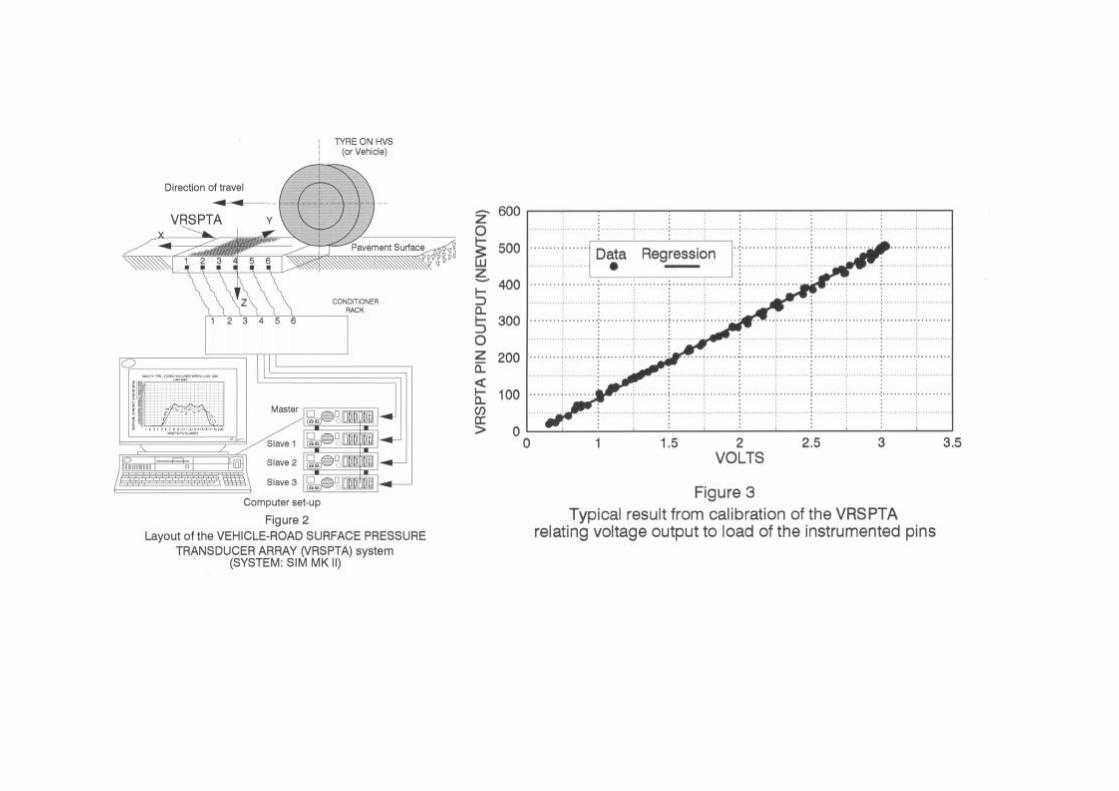

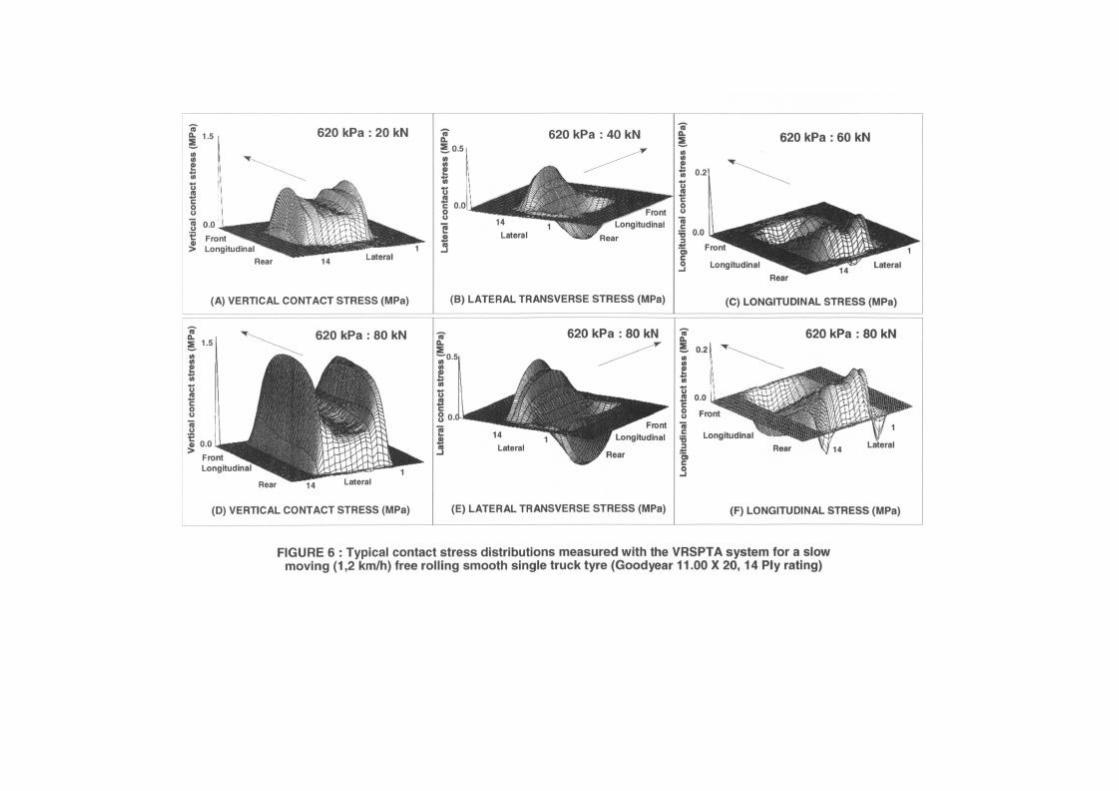
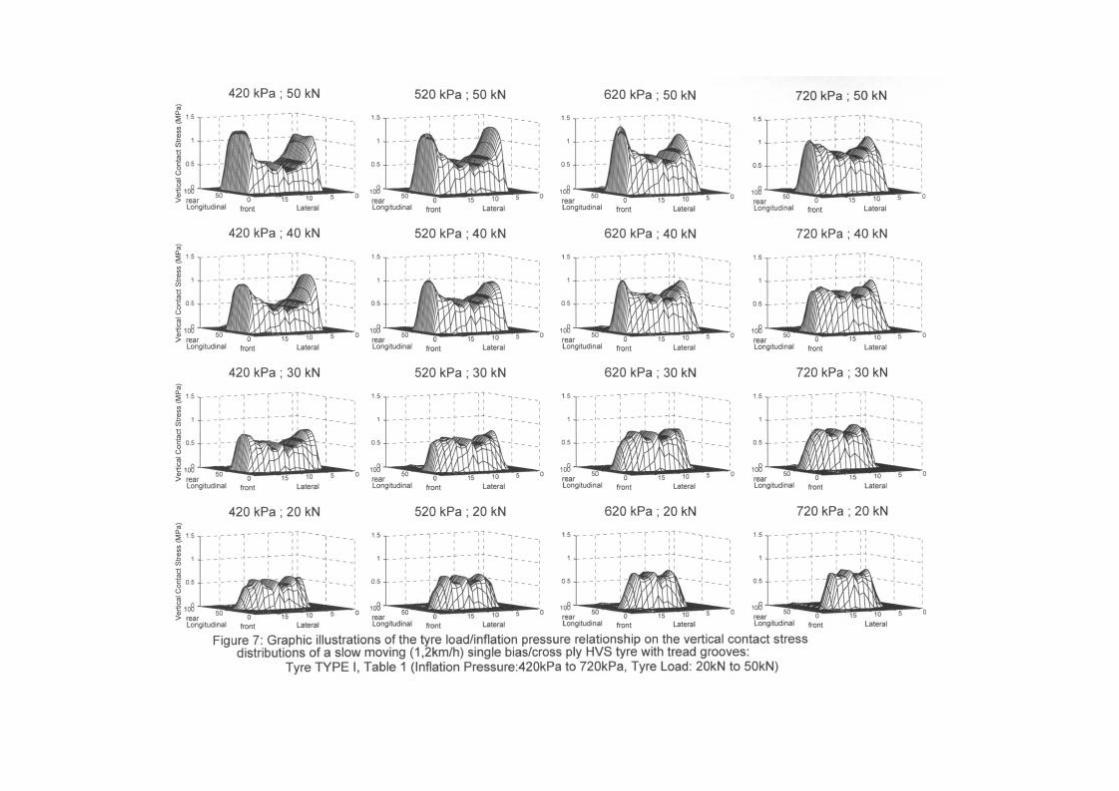
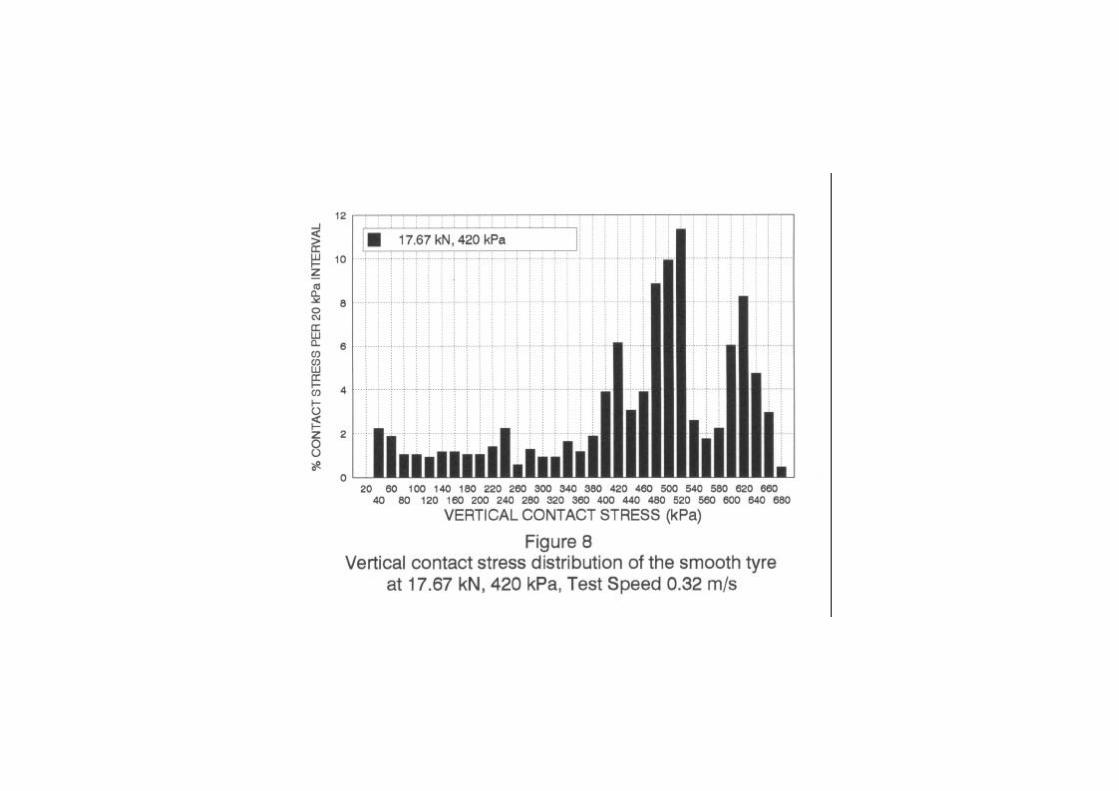


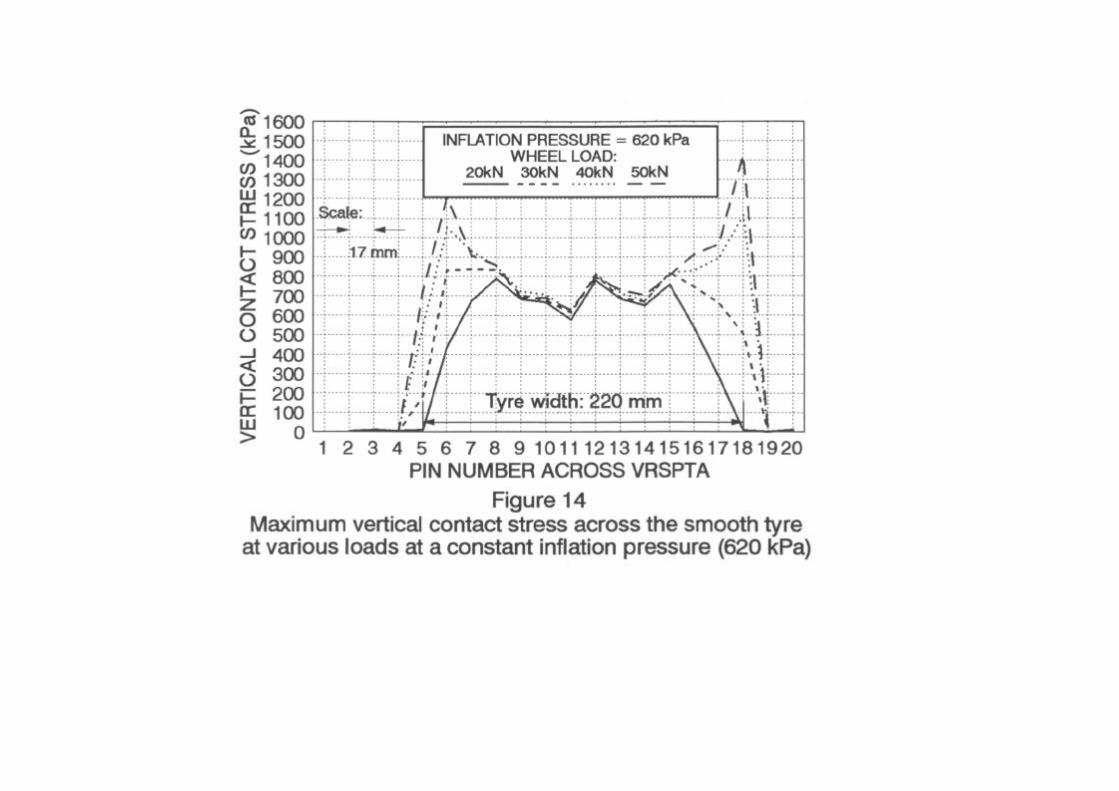
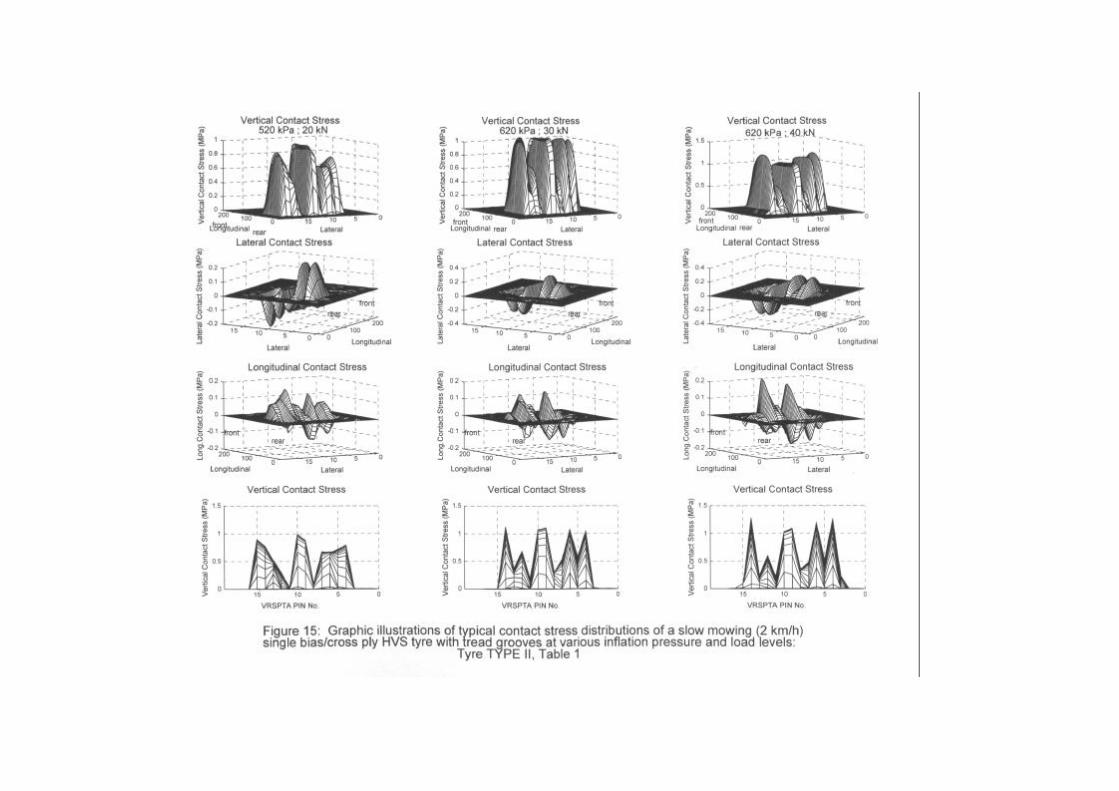

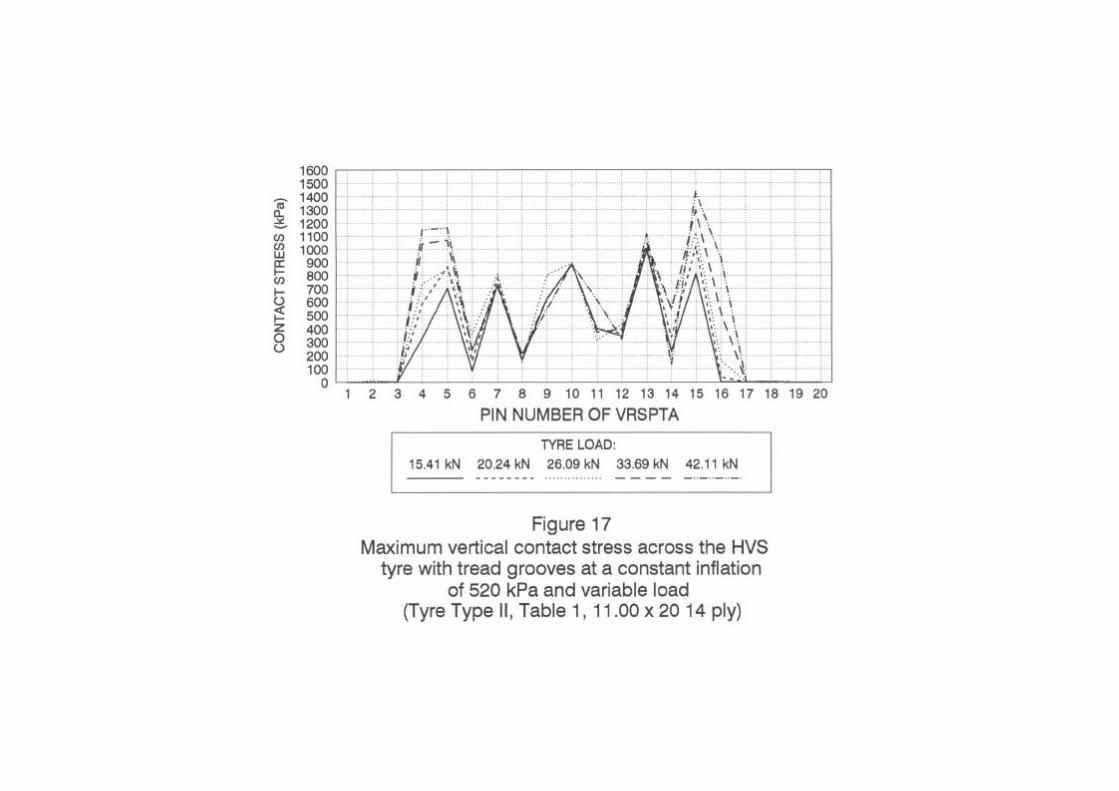


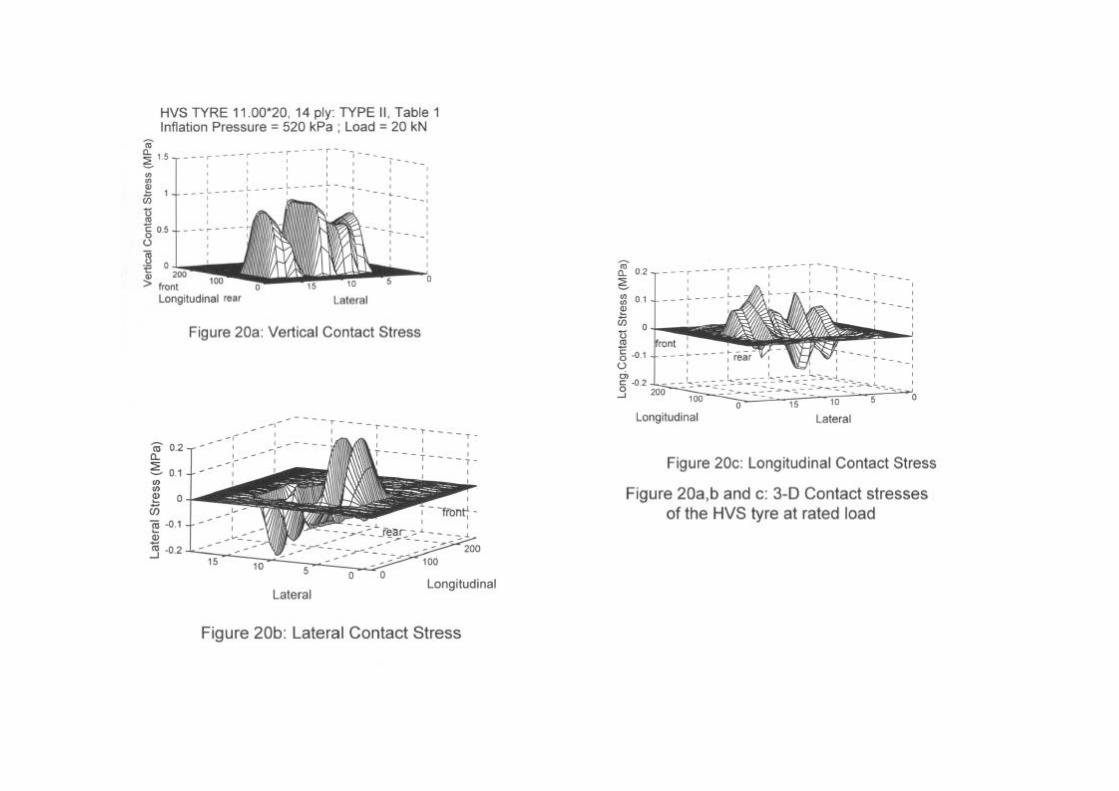
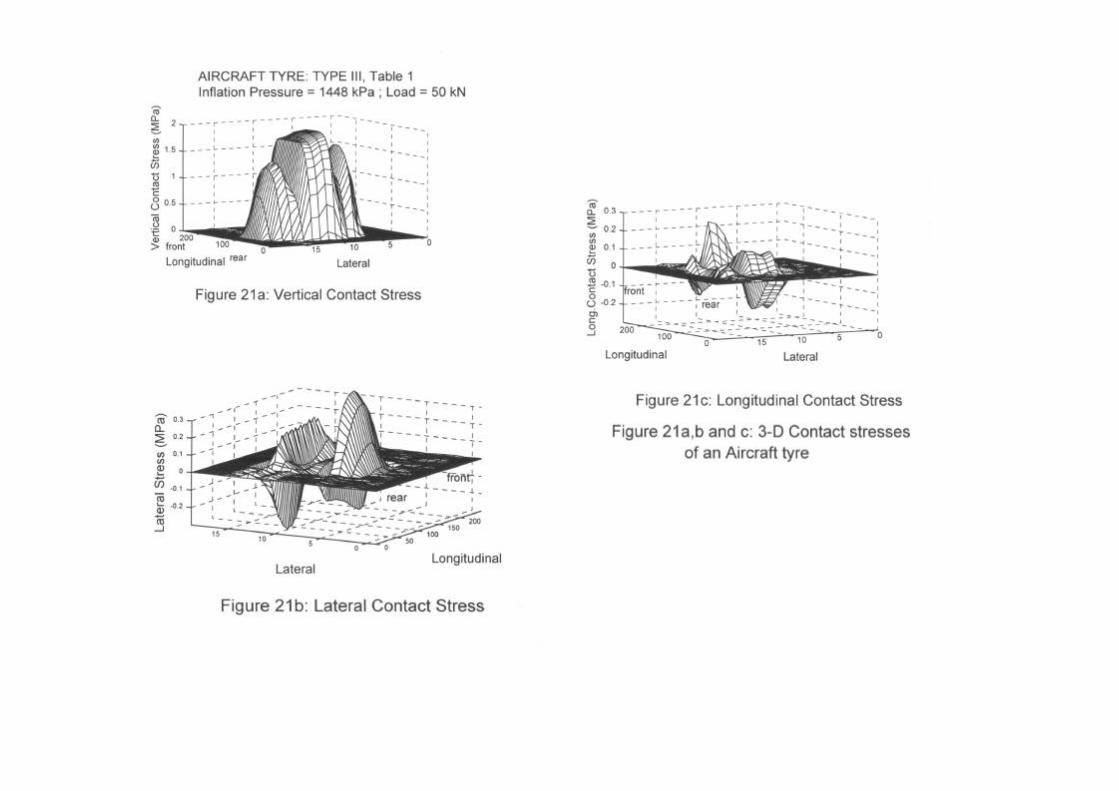

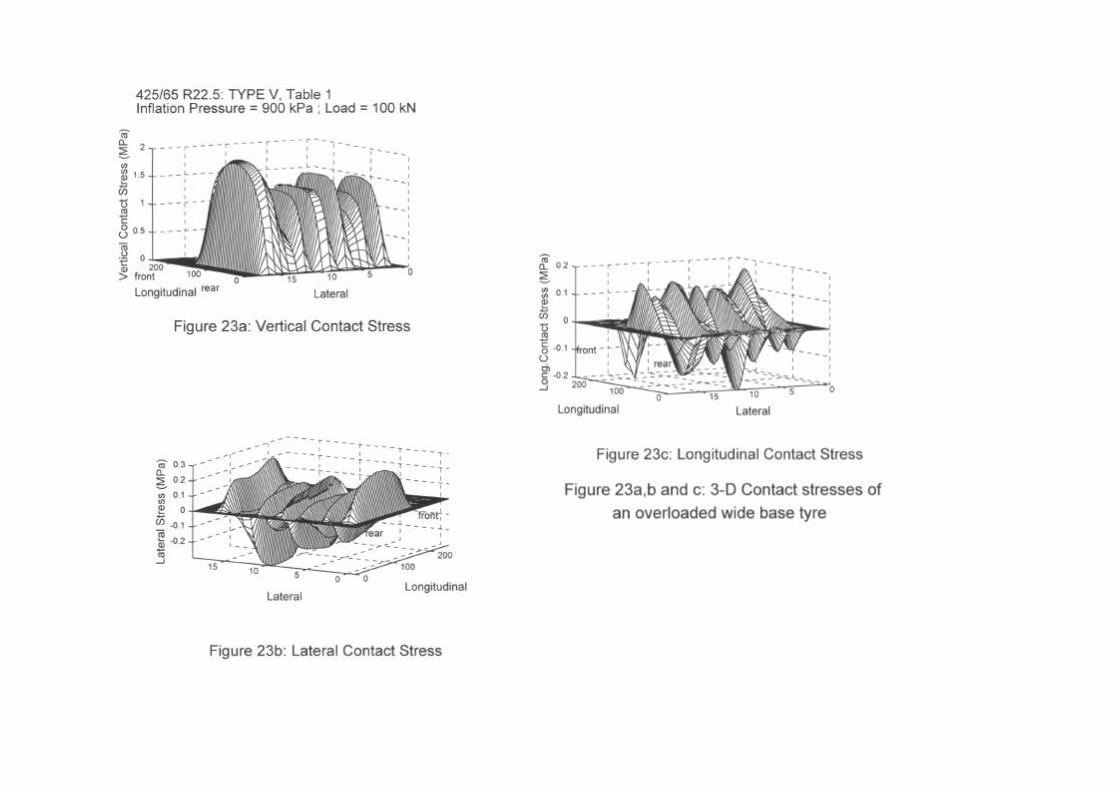

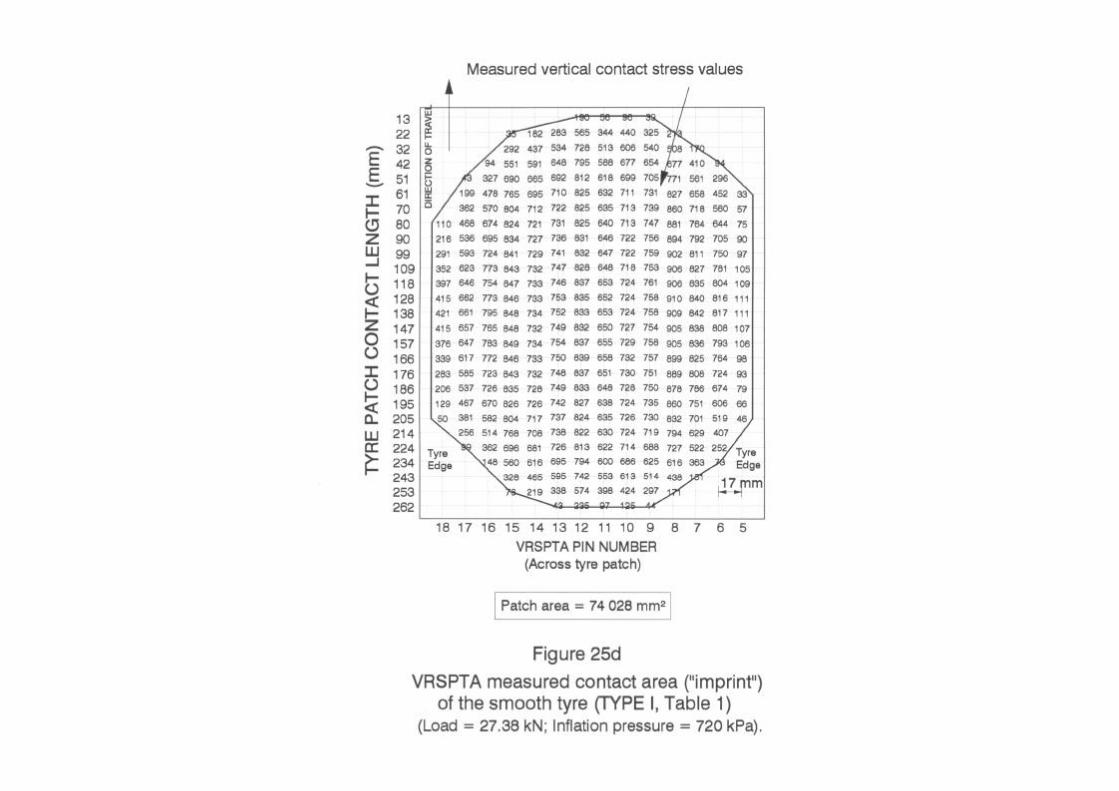
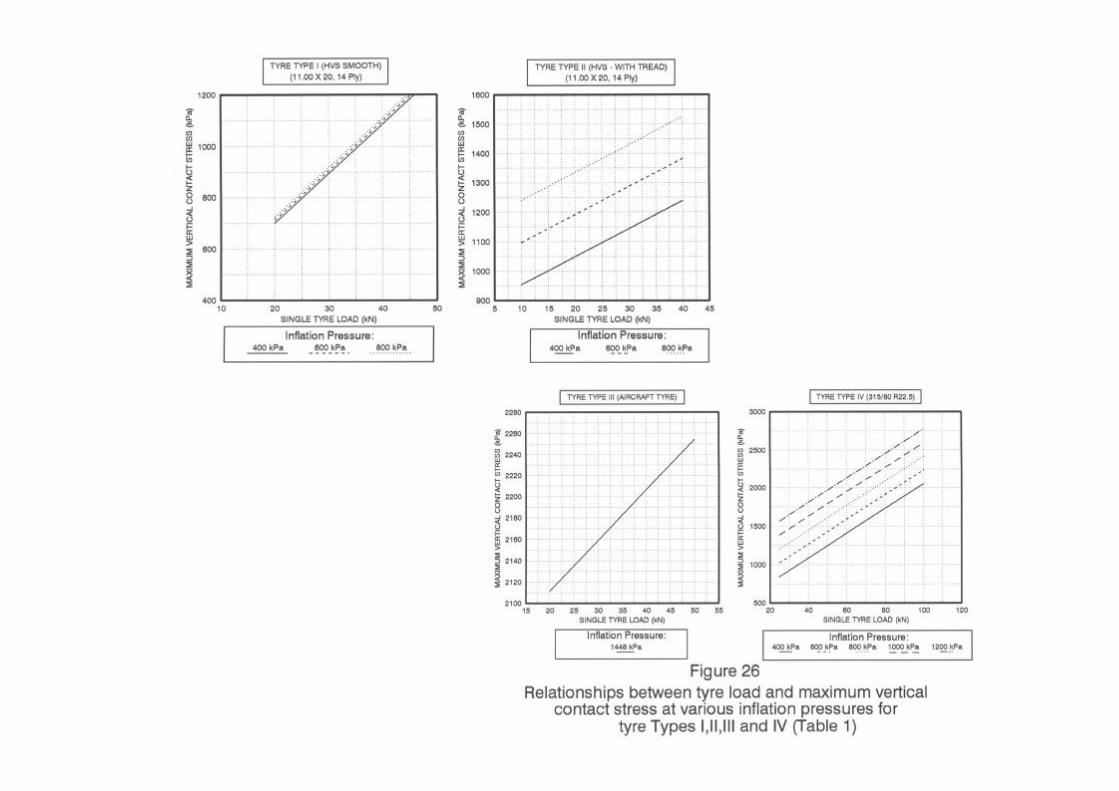
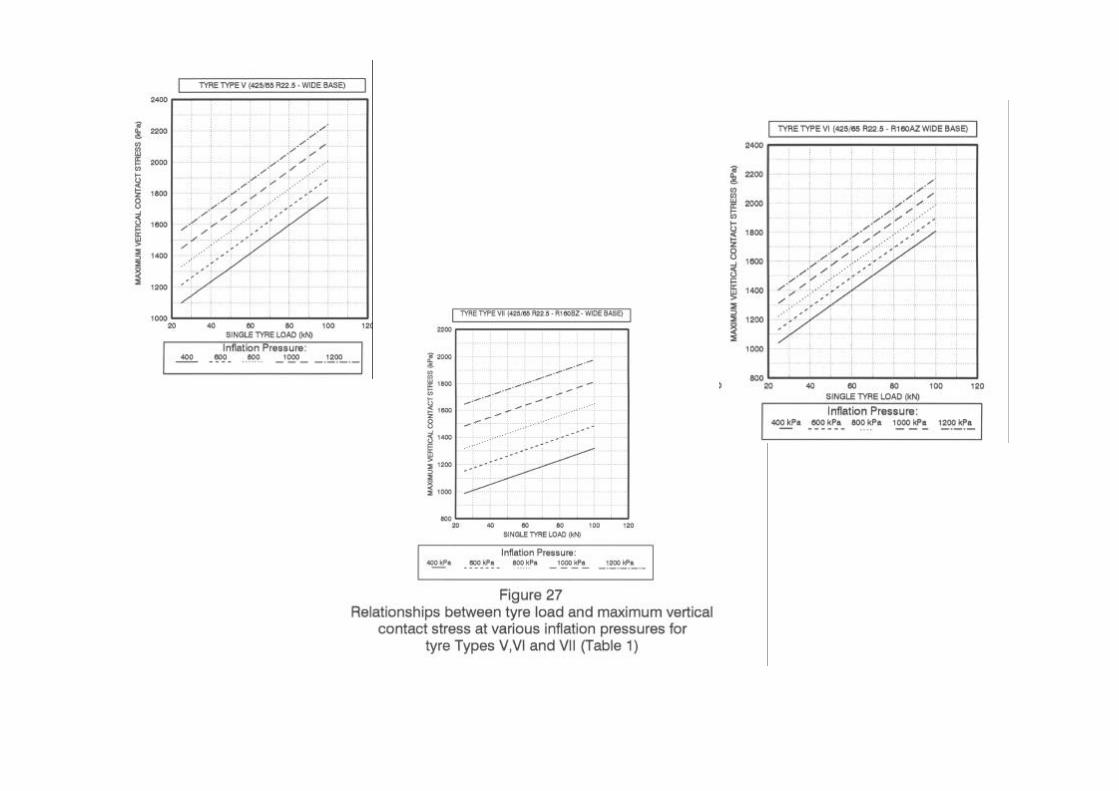


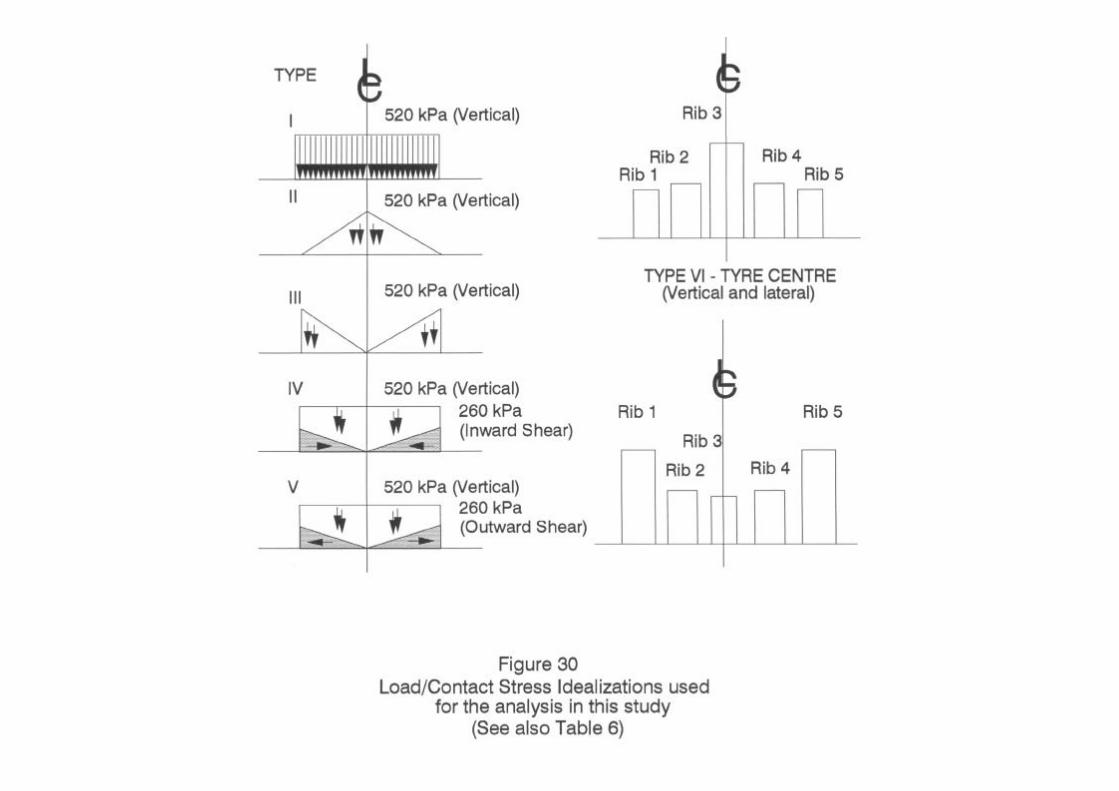

Plate 1 : Images of the Vehicle-Road Surface Pressure Transducer Array (VRSPTA) as usedunder the Heavy Vehicle Simulator (HVS). The tyre tested here is a wide base 425/65 R22.5 type.