refcl trial final report 140804 - energy - energy · the history of earthing practices in...
TRANSCRIPT

P a g e | 122
© Marxsen Consulting Pty Ltd Monday, 4 August 2014
8 Appendices

P a g e | 123
© Marxsen Consulting Pty Ltd Monday, 4 August 2014
8.1 Appendix A: History of distribution network earthing practices The history of earthing practices in distribution networks is a powerful aid to a sound understanding of the challenges to be faced in adoption of resonant earthing. This brief history has been compiled from a review of relevant technical literature and discussions with utility engineers with European experience, equipment manufacturers, and New Zealand utilities. Though brevity requires it to be incomplete in many details, the following broad outline of developments over the last 120 years can provide useful insights for those struggling with the complexity of the issues involved.
Before 1915
After a decade of feverish development6, three phase alternating current was established globally as the basis of public electricity networks by 1890. In such networks, the neutral is the single point of connection of the three individual phase windings of the substation transformer. It is so named because it is the only conductor in the power system not compelled to any particular voltage by the needs of network operation. It is normally extended outside the transformer tank to allow the network owner to decide its treatment. Hence, most substation transformers have four connections on the 22kV side – three phases plus the neutral. Customer loads are connected between phases.
The neutral can be left isolated or it can be earthed via a variety of arrangements. The choice of whether and how to earth the network neutral largely determines network protection philosophy in two areas: earth faults and over-voltages. Table 18: network earthing practices 1890-1915
Practice Earthed Neutral Isolated Neutral Adoption US, British Empire Europe Strength All network voltages closely controlled
– most network equipment can be rated to operate at phase-to-neutral voltage (13kV on 22kV networks), thus reducing costs. High earth fault currents allow easy fault detection using current sensing devices.
No current flows when earth fault occurs - earth fault arcs self-extinguish7 and no supply interruption is necessary. Neutral voltage rise is a very sensitive indicator of earth faults and can detect high resistance faults.
Weakness Supply interruption is the only way to extinguish arcs due to faults. Earth fault detection sensitivity is limited – cannot always detect high resistance faults. High earth fault currents can create safety and network damage risk. Earthing systems must be more robust to handle high currents and avoid dangerous earth potential rise.
Earth faults cause over-voltage on un-faulted phases – all network equipment must be rated for operation at full phase-to-phase voltage (22kV on 22kV networks), increasing costs and making this approach unsuitable for very high voltage (>220kV) networks where over-voltage control is critical. Only reduces fault current in single-phase-to-earth faults; other fault types still produce high currents. Fault current can be so low, some types of permanent fault are not easy to find.
In many of the earliest European networks built from 1890 to 1910, the neutral was left isolated, i.e. it was not connected to anything. In most of the then British Empire and in many areas of the US, it
6 See http://www.edisontechcenter.org/AC-PowerHistory.html for coverage of 1880-90. 7 50Hz current goes briefly to zero every ten milliseconds. If the electric field along the arc path after a current zero (called the Transient Recovery Voltage) is insufficient to re-ionise the hot air, the arc will cease to exist.
P a g e | 124
© Marxsen Consulting Pty Ltd Monday, 4 August 2014
was connected solidly to earth8. Though very different, these approaches were (and remain) two alternative ways of dealing with earth faults and over-voltages. National utilities in most countries had settled on one or the other by the early 1900s9.
In the early 1900s as small isolated-neutral networks grew in size, it was clear that even with no connection to the neutral, earth fault current was not actually zero. The capacitance (i.e. the electric fields) between the un-faulted powerline wires and the ground constituted a second connection that, together with the fault, could create current flow. By 1915, some networks with isolated neutrals were getting so large that this capacitive current flow was sufficient to sustain a continuous electric arc, i.e. earth faults did not extinguish themselves10. A new approach was required.
From 1915 to 1990
In 1917, Waldemar Petersen of Germany proposed resonant earthing to solve this problem11 and his solution was promptly adopted by many owners of isolated-neutral networks and by some owners of earthed-neutral networks12. He proposed the neutral be connected to earth through an inductor (a coil of wire wrapped around an iron core with some air gaps in the iron). If the inductance of this coil was selected for resonance13 with the network line capacitance at the system frequency (50Hz):
• In normal operation very little current would flow in the coil – the network voltages are balanced and the capacitive currents to ground from each phase sum to zero.
• If an earth fault occurred, the capacitive current that had previously prevented arcs from self-extinguishing would be cancelled by equal and opposite current from the coil.
With resonant earthing, arc extinction without a supply interruption was re-established as a normal outcome of earth faults even for large European networks. Momentary earth faults continued to be cleared without any supply disturbance at all. Permanent earth faults could remain on the network until operator action isolated them, i.e. even some permanent earth faults did not necessitate a supply interruption. The Petersen Coil became a standard item in network design toolkits worldwide, both under that name and as the ‘Arc Suppression Coil’ (ASC).
The invention of the Petersen Coil took place in the midst of World War 1. Germany, Eastern Europe and Scandinavia subsequently adopted resonant earthing as a standard. It was also widely adopted around the world in specialised networks such as those in mines where safety (especially absence of electric arcs) was paramount. Some public utilities in the UK and US experimented with it, but most ignored it as they did not have any problem with their earthed-neutral approach. Their customers accepted supply outages as a natural consequence of earth faults. Once fast auto-reclose was
8 A. Newbould and K. Chapman, Improving UK power quality with arc suppression coils, IEE, 2001. The author considers it possible the neutral was earthed to provide enough fault current to drive induction-disk relays - the prevailing protection technology in England at the time. 9 Connecting the neutral to earth through a resistor was a compromise approach. A low value resistor approached the British/US practice and a higher value resistor was aligned with the European approach. 10 In a 22kV network, this can happen if the capacitive current exceeds about 35 amps. (see footnote 14) 11 W Petersen, Limitation of Earth Current and Suppression of Earth Fault Arcs by the Earthing Coil, Elecktrotechnische Zeitschrift, June 1921. 12 E M Hunter, Some Engineering Features of Petersen Coils and Their Application, AIEE, Jan 1938. 13 A capacitance stores energy in an electric field, whereas an inductance stores energy in a magnetic field. If the two devices are connected in a circuit, they will have a natural resonance frequency at which energy is swapped back and forth between them at that frequency with minimal net current in the rest of the circuit.
P a g e | 125
© Marxsen Consulting Pty Ltd Monday, 4 August 2014
introduced, the brief supply interruptions required to clear momentary earth faults presented few problems in what were then the main uses of electricity: heating, lighting and electric motors.
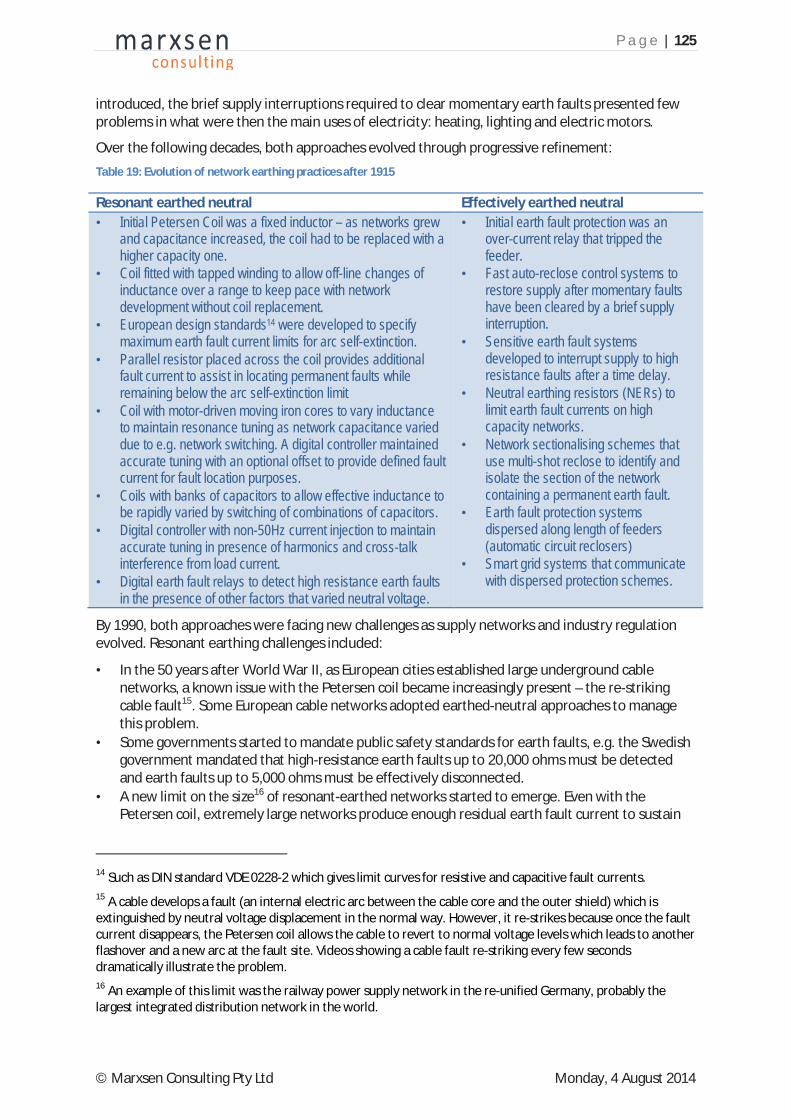
Over the following decades, both approaches evolved through progressive refinement: Table 19: Evolution of network earthing practices after 1915
Resonant earthed neutral Effectively earthed neutral • Initial Petersen Coil was a fixed inductor – as networks grew
and capacitance increased, the coil had to be replaced with a higher capacity one.
• Coil fitted with tapped winding to allow off-line changes of inductance over a range to keep pace with network development without coil replacement.
• European design standards14 were developed to specify maximum earth fault current limits for arc self-extinction.
• Parallel resistor placed across the coil provides additional fault current to assist in locating permanent faults while remaining below the arc self-extinction limit
• Coil with motor-driven moving iron cores to vary inductance to maintain resonance tuning as network capacitance varied due to e.g. network switching. A digital controller maintained accurate tuning with an optional offset to provide defined fault current for fault location purposes.
• Coils with banks of capacitors to allow effective inductance to be rapidly varied by switching of combinations of capacitors.
• Digital controller with non-50Hz current injection to maintain accurate tuning in presence of harmonics and cross-talk interference from load current.
• Digital earth fault relays to detect high resistance earth faults in the presence of other factors that varied neutral voltage.
• Initial earth fault protection was an over-current relay that tripped the feeder.
• Fast auto-reclose control systems to restore supply after momentary faults have been cleared by a brief supply interruption.
• Sensitive earth fault systems developed to interrupt supply to high resistance faults after a time delay.
• Neutral earthing resistors (NERs) to limit earth fault currents on high capacity networks.
• Network sectionalising schemes that use multi-shot reclose to identify and isolate the section of the network containing a permanent earth fault.
• Earth fault protection systems dispersed along length of feeders (automatic circuit reclosers)
• Smart grid systems that communicate with dispersed protection schemes.
By 1990, both approaches were facing new challenges as supply networks and industry regulation evolved. Resonant earthing challenges included:
• In the 50 years after World War II, as European cities established large underground cable networks, a known issue with the Petersen coil became increasingly present – the re-striking cable fault15. Some European cable networks adopted earthed-neutral approaches to manage this problem.
• Some governments started to mandate public safety standards for earth faults, e.g. the Swedish government mandated that high-resistance earth faults up to 20,000 ohms must be detected and earth faults up to 5,000 ohms must be effectively disconnected.
• A new limit on the size16 of resonant-earthed networks started to emerge. Even with the Petersen coil, extremely large networks produce enough residual earth fault current to sustain
14 Such as DIN standard VDE 0228-2 which gives limit curves for resistive and capacitive fault currents. 15 A cable develops a fault (an internal electric arc between the cable core and the outer shield) which is extinguished by neutral voltage displacement in the normal way. However, it re-strikes because once the fault current disappears, the Petersen coil allows the cable to revert to normal voltage levels which leads to another flashover and a new arc at the fault site. Videos showing a cable fault re-striking every few seconds dramatically illustrate the problem. 16 An example of this limit was the railway power supply network in the re-unified Germany, probably the largest integrated distribution network in the world.

P a g e | 126
© Marxsen Consulting Pty Ltd Monday, 4 August 2014
an arc purely due to energy losses on the network and leakage current across the thousands of insulators on the un-faulted phases – this current cannot be cancelled by the Petersen coil because it is resistive, not capacitive17.
The UK/US earthed-neutral approach also faced pressures:
• It could not match the performance of resonant earthing in assurance of public safety, especially in detection of very high resistance faults.
• Utilities world-wide were adopting common standards for reporting distribution network supply reliability performance18, i.e. the superior reliability with resonant earthing was becoming visible to a wider audience and regulators were demanding continuous improvement in response to customers’ unhappiness with momentary supply interruptions that disturb their new digital electronic equipment.
Both approaches were benefiting from the adoption of embedded digital ‘intelligence’ but the basic advantage of resonant earthing (it clears momentary earth faults without a momentary supply interruption) remained.
From 1990 to the present
In the early 1990s, Klaus Winter of Swedish Neutral developed the concept of active residual current compensation19. In this solution the fault current is minimised not only by the natural cancellation of network capacitive current by the coil’s inductive current, but an additional current is injected into the neutral to cancel much of the residual current that persists20.
Active residual current compensation promised solutions to all the strategic challenges then facing resonant earthing:
1. It can limit fault currents to extremely low values even in very high resistance faults. The system progressively adjusts its injected current to reduce voltage at the fault site to zero. It offers maximum fault detection sensitivity and maximum public safety for high resistance faults.
2. It can eliminate re-strike in cable faults. The system exhibits ‘memory’ and does not reset the network voltages to normal immediately the fault arc extinguishes. Hence it can provide high supply reliability on cable networks just as on overhead ones.
3. It can compensate any form of residual current, resistive as well as capacitive. It can even compensate harmonic currents. The limit on total network size can thus be overcome.
Within the EU community, the common performance reporting standards made it obvious that resonant earthing offered superior supply reliability over earthed neutral approaches. In the 1990s, both France21 and Italy22 formally adopted programs to introduce resonant earthing on their entire
17 The self-extinction limit is higher for resistive current: 60 amps in a 22kV network (VDE 0228-2). 18 IEEE standard supply reliability indices include SAIDI: system average interruption duration indicator and SAIFI: system average interruption frequency indicator. Resonant earthing can make a dramatic difference especially in respect of the newer MAIFI measure (Momentary Average Interruption Frequency Indicator). 19 Winter, K The RCC Ground Fault Neutraliser A Novel Scheme for Fast Earth Fault Protection, CIRED 2005. 20 Initially, Swedish Neutral proposed residual current compensation using electromagnetic technology (Swedish patent No 637 096) via phase-shifting transformers, but it soon moved to a much more flexible and cost-effective compensation capability using power electronics when these became available. 21 Karsenti L, Michel ODDI, A New Generation of Directional Fault Indicators in the ERDF Network, CIRED 2009. 22 A. Cerretti, G. Di Lembo, and G. Valtorta, Improvement in the continuity of supply due to a large introduction of Petersen coils in HV/MV substations, CIRED 2005.

P a g e | 127
© Marxsen Consulting Pty Ltd Monday, 4 August 2014
medium voltage public networks. More recently Ireland has done the same. At least one privatised UK utility8 facing supply reliability regulatory challenges also opted for resonant earthing solutions.
Many utilities have elected to move to resonant earthing selectively to improve quality of supply only where circumstances warrant, i.e. each substation network is assessed on its merits23. Many use bypass switches to revert to an earthed-neutral arrangement for permanent faults after a set time delay24, i.e. not all adopt the practice of leaving a permanent earth fault on the network until it can be located - a practice still sometimes used where high resistivity soil creates public safety risk.
Today
Resonant earthing now has an active presence in most areas of the world and its spread in mature economies continues to be driven by demands for improved quality of supply and enhanced public safety25 (lower risk of electrocution from fallen lines). Reduction of fire risk is not yet a driver of resonant earthing adoption26, though those who use it for other reasons freely state their confident expectation it would have clear benefits in this area.
The global resonant earthing market remains dominated by ASC installations, with local agents offering products from at least three manufacturers to network owners in Australia and New Zealand: Swedish Neutral, Czech company EGE, and Austrian company Trench (part of Siemens).
Swedish Neutral’s GFN has established itself as a premium product for networks where public safety, network size and cable re-strike imperatives exist. Around 170 GFNs have been installed world-wide to date, some 30 of them in New Zealand27.
In Victoria, one resonant earthing installation has been in service for five years, two more are on order for installation in 2014 and a third is currently subject to a tender process. No other Australian state yet has firm plans to adopt this technology, though many utilities both here and overseas are watching Victoria’s Powerline Bushfire Safety REFCL research with great interest.
23 In New Zealand, areas of intensive dairy farming demand a very low level of momentary supply interruptions. To quote one utility engineer: “if the power goes off even briefly during milking, the cups can drop off 100 cows and the subsequent disinfection procedure and work required to resume milking doesn’t make us look like the farmer’s friend”. 24 At FSH, this time delay is five seconds. In France it is 700 milliseconds. In one UK utility it is 30 seconds. 25 For example, in New Zealand there are now nearly 30 installations but only Orion has adopted a long term plan to introduce it across the majority of its network (for public safety reasons). Orion’s territory includes the Canterbury Plains area which like some other areas of NZ has extremely high resistivity soil. Earth faults can cause large (and dangerous) voltage rises in the vicinity of the fault. 26 Fire risk reduction has been mentioned (but not quantified) in one NZ business case where changing land use is leading to increased presence of pine plantations near powerlines. 27 For perspective, Czech manufacturer EGE sells around 400 ASCs per year world-wide.

P a g e | 128
© Marxsen Consulting Pty Ltd Monday, 4 August 2014
8.2 Appendix B: Operation of REFCLs28 A thorough understanding of how REFCLs operate in distribution networks is essential to identification and effective response to the challenges of REFCL adoption. One NZ utility estimates it takes about four years after first REFCL installation for engineering and operations staff to gain sufficient understanding to express enthusiasm for REFCL benefits – and that this culture change is a far greater challenge than the technical issues involved in REFCL adoption.
In some respects, resonant earthing makes little difference to the operation of distribution networks. In other respects, the differences are dramatic. It all depends what is happening on the network at the time:
Normal network operation
If there are no faults or transients on the network, there is little material difference between the operation of a network with resonant earthing and one without it. Technical operating procedures will be different and a small voltage will exist on the network neutral, but the network will function (deliver energy to customers) exactly the same as a traditional ‘effectively earthed’ one.
Response to network faults
Many different types of network faults occur in Victoria and the effect of resonant earthing varies greatly by the type of fault:
• It has little or no effect on three-phase faults. • It has little or no effect on phase-to-phase faults. • It has a limited effect on two-phase-to-earth faults. • It has a dramatic effect on phase-to-earth faults29.
Because of this variation, the overall effect of resonant earthing will depend on the mix of fault types that occur on the network. However, rigorous accurate evidence on the comparative frequency of different fault types is notoriously hard to obtain.
The predominance of earth faults on typical networks
Estimates30 developed in 2011 indicate momentary earth faults comprise 50 per cent of all network faults that result in supply interruptions in rural Victoria. This is consistent with a globally accepted ‘rule of thumb’ that, averaged over all medium voltage networks world-wide, earth faults comprise about 65 per cent of all faults and on overhead networks, the great majority of earth faults are momentary. NZ utilities’ analyses of experience on individual substation networks produced estimates of earth faults as high as 80 to 90 per cent of all faults, again the vast majority of them momentary.
All these estimates are consistent with anecdotal reports by network operations staff that the majority of network faults are earth faults (or at least start as earth faults before developing into
28 The terms ‘resonant earthing’ (the technology) and REFCL (Rapid Earth Fault Current Limiter, the device) can be taken as synonymous and are used interchangeably throughout this document. 29 Referred to throughout this document simply as ‘earth faults’ 30 The estimates were developed by the Powerline Bushfire Safety Taskforce based on data from a 2010 national survey of network owners. See National workshop on rural electricity network options to reduce bushfire risk, April 2010 and Powerline Bushfire Safety Taskforce Final Report, September 2011, both available at www.esv.vic.gov.au.

P a g e | 129
© Marxsen Consulting Pty Ltd Monday, 4 August 2014
other fault types) and the great majority of these are momentary, e.g. lightning strikes, tree branch touches, bird/possum touches, etc.
Sustained earth faults are much less frequent and tend to be a fallen conductor/pole or a fallen tree/structure/crane, etc. resting against a conductor.
It seems reasonable to adopt a working assumption that of all faults that cause supply outages (including momentary supply outages) on Victoria’s rural networks:
• momentary earth faults make up about 50 to 70 per cent of the total number of all fault types; and
• sustained earth faults make up a further ten to 15 per cent.
Since resonant earthing has a dramatic effect on network response to earth faults, it may have the potential to have a dramatic effect on up to 85 per cent of all network faults.
REFCL operation when an earth fault occurs
When an earth fault occurs on a 22kV distribution network, the presence of resonant earthing results in a large neutral voltage displacement31, i.e. the voltage32 of the neutral connection of the zone substation transformer(s) increases from a low level (generally less than 1kV) to a value close to 13kV. As a consequence, the voltage on the faulted phase falls to a value close to zero and the voltage on each of the two un-faulted phases increases from 13kV to 22kV.
The time this takes depends on the severity of the fault (as represented by the notional fault resistance). When a ‘heavy’ fault (low resistance - line fallen on wet ground or earthed structure, internal short circuit in pole mounted transformer or surge diverter, etc.) occurs, the effect of resonant earthing is virtually immediate – within 50 milliseconds. If the fault is high resistance (dry tree branch touching line) the neutral voltage displacement can appear over time – a second or two in extreme cases – and be partial rather than the full 13kV.
The consequences of the neutral voltage displacement are:
• The current drawn by the earth fault is very low (typically less than 20 amps compared to up to 1600 amps in Victoria’s non-REFCL network designs) as there is little voltage left on the faulted phase to drive current after the neutral voltage displacement takes effect.
• At the same time, the un-faulted phases of the network are exposed to over-voltage stress (22kV or 75 per cent greater than normal). This over-voltage stress on the two un-faulted phases creates the first and biggest technical challenge for Victoria’s network owners – the risk of so-called ‘cross-country’ faults.
Different REFCL types
REFCLs come in two main types: ASCs (Arc Suppression Coils)33 with no power electronic components and GFNs (Ground Fault Neutralisers)34 with active residual current compensation using power electronics. Simplistically, a GFN can be thought of as comprising an ASC plus an RCC (Residual Current Compensator).
31 See Different REFCL types below 32 The term ‘voltage’ in this document usually implies voltage with respect to ground. 33 ASCs are manufactured by EGE (sold here by NZ company HV Power) and Siemens (since its acquisition of Trench) as well as by multiple Chinese companies. There are no ASCs installed on Australian public networks. 34 The GFN is a single product family manufactured by Swedish Neutral and sold in Australia by Connetics, a subsidiary of NZ utility Orion. The only GFN in Australia is installed at Frankston South (FSH).

P a g e | 130
© Marxsen Consulting Pty Ltd Monday, 4 August 2014
In the initial 40-60 milliseconds post-fault period (prior to commencement of RCC operation in a GFN) there is essentially no difference between an ASC and a GFN in how the neutral voltage displacement comes about when an earth fault occurs. However, there is an important difference in the way the neutral voltage displacement is established and maintained beyond the first 40 to 60 milliseconds, i.e. once the GFN’s RCC operates.
In the case of ASCs, the resonant combination of the ASC inductance and the total network capacitance to earth exhibits very high impedance at 50Hz35 and since voltage in the ‘earth fault current loop’ is distributed in proportion to impedance, most of the available voltage appears across the resonant ASC/network combination as neutral voltage displacement rather than across other parts of the ‘loop’ where it would be available to drive high levels of fault current. This is simply another way of saying the fault current is reduced to a low level by the very high impedance the resonant ASC/network combination introduces into the ‘earth current loop’. There are two consequences of this:
• In the case of high resistance faults, the voltage at the location of the fault can remain substantial because the fault impedance is comparable to the high impedance of the resonant ASC/network combination. The ASC may produce neutral voltage displacement somewhat less than the full 13kV network voltage as the 13kV is divided pro rata across the two impedances.
• The fault current is required to maintain the neutral voltage displacement, i.e. if the fault current disappears, the neutral voltage displacement will quickly collapse.
A GFN exhibits a more pro-active response to an earth fault. Once an earth fault is detected (usually when the neutral voltage exceeds a set threshold) and the RCC operates, it injects a voltage equal to and opposite to the normal phase-to-earth voltage, so the total voltage around the earth fault ‘loop’ is reduced to near zero36 – the only voltage remaining to drive fault current is the voltage drop on the faulted phase conductor between the substation and the fault location. This voltage drop is caused by load current (not fault current) and line impedance37. Over the subsequent 10-20 seconds, the GFN controller calculates network parameters and adjusts the voltage injected by the RCC to ensure this voltage is cancelled as well. The end result is a very low (near-zero) voltage on the faulted conductor at the location of the fault - hence the adoption of GFNs in places where high resistance soil makes public safety (from electrocution) a special priority.
The difference between an ASC and a GFN is highlighted with high resistance faults since the GFN will actively produce full neutral displacement using its RCC38 whereas an ASC may produce less than complete voltage displacement. In effect, GFNs are designed to reduce residual fault current to near-zero levels within about 20 seconds regardless of the resistance of the fault.
A second major difference is with momentary earth faults. An ASC will quickly return to normal voltage levels after a momentary earth fault arc extinguishes itself and the fault current falls to zero. The neutral voltage displacement collapses and both the faulted and the un-faulted phases quickly return to normal operating voltage levels. With a GFN, because the neutral displacement is actively maintained (rather than occurring as a natural consequence of the fault current and the high
35 Practice in some countries is to tune the ASC slightly off resonance. Alternatively it is fitted with a parallel ‘damping’ resistor. These approaches reduce the risk of false earth fault detection by limiting the volatility of the neutral voltage. They also provide a guaranteed (low) level of fault current to aid fault location. 36 A somewhat similar effect can be produced without an RCC by using FPE (Faulted Phase Earthing) whereby an earth switch is used to solidly earth the faulted phase within the substation. 37 In the worst case, this may reach ten per cent of nominal network voltage, but rarely exceeds 500 volts. 38 Provided the initial neutral displacement has already exceeded the fault detection threshold – this constitutes detection of the fault by the GFN and is the trigger for RCC action.

P a g e | 131
© Marxsen Consulting Pty Ltd Monday, 4 August 2014
impedance of the resonant ASC/network combination) the voltage at the fault location will remain close to zero regardless of the continued presence (or absence) of the fault.
This means the network operator must define control logic for the GFN to remove the neutral voltage displacement if the fault is a momentary one. The GFN has functions to assist this choice, including an automated test for continuing fault presence after a defined period.

P a g e | 132
© Marxsen Consulting Pty Ltd Monday, 4 August 2014
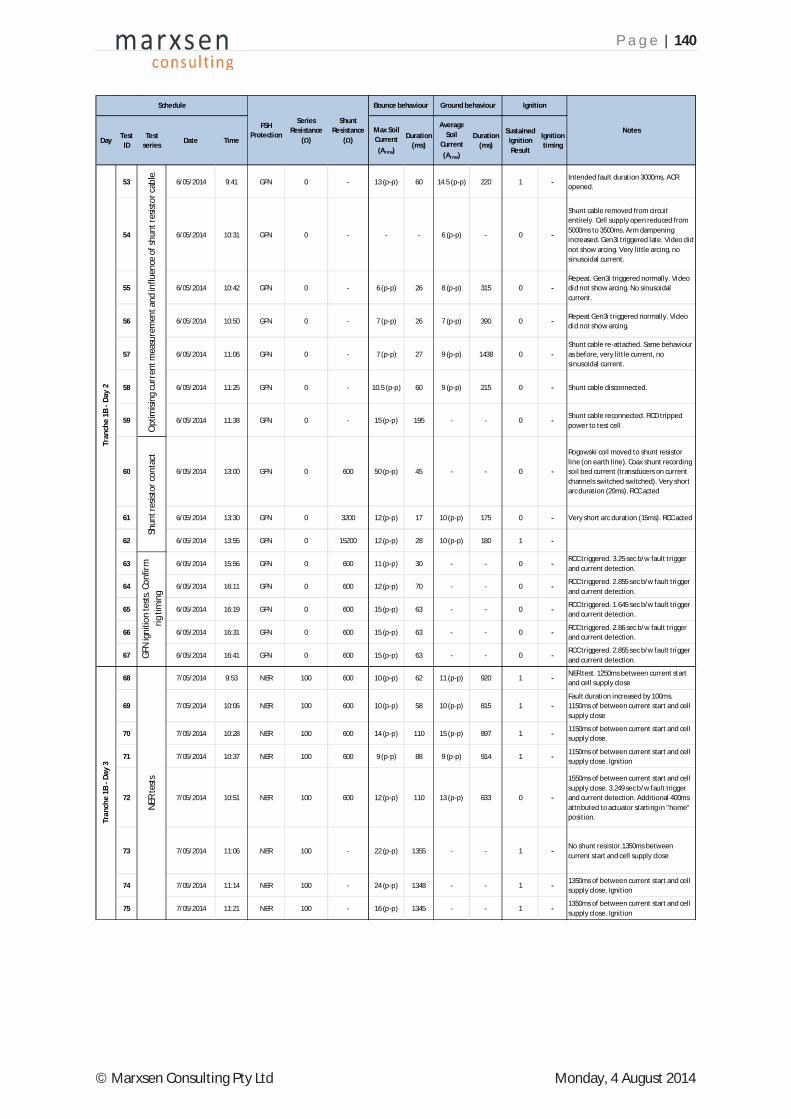
8.3 Appendix C: Test records The following tables summarise the tests and their results.
8.3.1 Valid ignition tests
All ignition tests were audited against a number of criteria to verify the result could reliably be regarded as valid. The tests shown in Table 20 were confirmed to be valid tests. Table 20: Valid ignition tests
DayTest
IDTest
seriesDate Time
Max Soil Current (Arms)
Duration (ms)
Average Soil
Current (Arms)
Duration (ms)
Sustained Ignition Result
Ignition timing
98 26/05/2014 14:51 NER 100 - 3.3 37 3.75 723 1 N/A
99 26/05/2014 15:10 NER 100 - 1.5 46 1.7 743 1 N/A
100 26/05/2014 15:26 NER 100 - 2.5 53 3.15 776 1 N/A
101 26/05/2014 15:34 NER 100 - 2.7 46 3.2 760 1 N/A
102 26/05/2014 15:40 NER 100 - 3 64 3.65 759 1 N/A
103 26/05/2014 15:45 NER 100 - 2.4 45 3.4 767 1 N/A
104 26/05/2014 15:52 NER 100 - 1.7 38 2.1 744 1 N/A
105 26/05/2014 15:56 NER 100 - 18.3 1110 22.9 1110 1 N/A Fulgurite formed.
106 26/05/2014 16:01 NER 100 - 2.5 48 3.25 747 1 N/A
107 26/05/2014 16:42 GFN 0 600 21 38 - - 0 -
108 26/05/2014 16:52 GFN 0 600 20 39 - - 0 -
109 27/05/2014 11:25 GFN 0 600 10 39 - - 0 -
110 27/05/2014 11:34 GFN 0 600 12.7 38 - - 0 -
111 27/05/2014 11:46 GFN 0 600 12.3 36 - - 0 -
112 27/05/2014 11:53 GFN 0 600 16.2 36 - - 0 -
113 27/05/2014 12:08 NER 100 - 24 920 21 920 1 N/A
114 27/05/2014 12:19 NER 100 - 24 920 21 920 1 N/A
115 27/05/2014 12:34 NER 100 - 22.5 918 19.75 918 1 N/A Fulgurite formation. Peak at 110A RMS
116 27/05/2014 12:50 NER 100 - 24.5 918 21.25 918 1 N/A
Series Resistance
(Ω)
Shunt Resistance
(Ω)
Schedule
FSH Protection
Tran
che
2 - D
ay 1
NER
igni
tion
test
s, lo
w re
sistiv
ity so
ilGF
N ig
nitio
n te
sts
Bounce behaviour Ground behaviour Ignition
Notes
NER
igni
tion
test
s
Tran
che
2 - D
ay 2

P a g e | 133
© Marxsen Consulting Pty Ltd Monday, 4 August 2014
DayTest
IDTest
seriesDate Time
Max Soil Current (Arms)
Duration (ms)
Average Soil
Current (Arms)
Duration (ms)
Sustained Ignition Result
Ignition timing
117 27/05/2014 14:35 ASC 100 600 12 55 - - 0 -No residual current through soil, all through shunt resistor.
118 27/05/2014 14:49 ASC 100 1600 13 58 1 1007 1 Ground
119 27/05/2014 15:07 ASC 100 1600 13 63 0.8 983 1 Ground
120 27/05/2014 15:19 ASC 100 1600 12.5 57 1 970 1 Ground
121 27/05/2014 15:30 ASC 100 1600 14.8 114 2.25 992 1 Bounce
122 27/05/2014 15:38 ASC 100 1600 4.8 43 0.18 800 0 -
123 27/05/2014 15:53 ASC 100 1600 13.5 110 0.75 1000 1 Bounce
124 27/05/2014 16:06 ASC 100 600 17 36 - - 0 -
125 27/05/2014 16:13 ASC 100 600 11 46 - - 0 -
126 27/05/2014 16:19 ASC 100 600 7.5 35 - - 0 -
127 27/05/2014 16:37 ASC 100 - 12.5 75 5 1022 1 Bounce
128 27/05/2014 16:45 ASC 100 - 12.5 76 4.75 1017 1 Bounce
129 27/05/2014 16:56 ASC 100 - 15 82 4.75 1020 1 Bounce
130 28/05/2014 9:49 ASC 100 - - - - - 1 Ground DAQ didn't trigger. RCC didn't act
131 28/05/2014 9:57 ASC 100 - 1 29 - - 1 Ground DAQ triggered on noise
132 28/05/2014 10:09 ASC 100 - 1 35 1 998 1 Ground
133 28/05/2014 10:22 ASC 100 - 5 41 3 1005 1 Ground
134 28/05/2014 10:39 ASC 100 1600 0.8 35 - - 0 -
135 28/05/2014 10:54 ASC 100 1600 1.5 28 - - 0 -
136 28/05/2014 11:02 ASC 100 1600 1 26 - - 0 -
137 28/05/2014 11:11 ASC 100 600 0.8 29 - - 0 -
138 28/05/2014 11:19 ASC 100 600 0.9 26 - - 0 -
139 28/05/2014 11:29 ASC 100 600 0.7 26 - - 0 -
Bounce behaviour Ground behaviour Ignition
NotesFSH
Protection
Series Resistance
(Ω)
Shunt Resistance
(Ω)AS
C ig
nitio
n te
sts
Tran
che
2 - D
ay 3
ASC
igni
tion
test
s
Tran
che
2 - D
ay 2
Schedule

P a g e | 134
© Marxsen Consulting Pty Ltd Monday, 4 August 2014
DayTest
IDTest
seriesDate Time
Max Soil Current (Arms)
Duration (ms)
Average Soil
Current (Arms)
Duration (ms)
Sustained Ignition Result
Ignition timing
140 28/05/2014 12:56 GFN 0 600 1 27 - - 0 -Timers not reset from ASC settings. Did not bias GFN action or test result.
141 28/05/2014 13:11 GFN 0 600 0.3 23 - - 0 -
142 28/05/2014 13:22 GFN 0 600 0.8 33 - - 0 -
143 28/05/2014 13:28 GFN 0 600 0.6 27 - - 0 -
144 28/05/2014 13:38 GFN 0 600 0.9 31 - - 0 -
145 28/05/2014 13:50 GFN 0 600 0.7 26 - - 0 -
146 28/05/2014 14:01 GFN 0 600 0.9 27 - - 0 -
147 28/05/2014 14:10 GFN 0 600 0.7 31 - - 0 -
148 28/05/2014 14:16 GFN 0 600 1.4 27 - - 0 -
149 28/05/2014 14:32 GFN 0 600 1.2 29 - - 0 -
151 28/05/2014 15:04 NER 100 - 3 270 4.5 505 1 Bounce
152 28/05/2014 15:15 NER 100 - 2 38 2.4 499 1 Ground
153 28/05/2014 16:24 GFN 0 1600 17.5 77 - - 0 - GFN sensitivity increased to 20%
154 28/05/2014 16:32 GFN 0 1600 13 76 - - 1 Bounce
155 28/05/2014 16:42 GFN 0 1600 14.8 88 - - 1 Bounce
156 28/05/2014 16:54 GFN 0 1600 12 44 - - 1 Bounce
157 28/05/2014 17:03 GFN 0 1600 11 74 - - 1 Bounce
158 28/05/2014 17:13 GFN 0 1600 15 45 - - 0 -
159 29/05/2014 10:49 GFN 0 - 13.5 120 - - 1 Bounce Test used to confirm rig timing
160 29/05/2014 11:01 GFN 0 - 13 47 - - 0 -
161 29/05/2014 11:10 GFN 0 - 17 92 - - 1 BounceRig damaged during attempted test #162. Slot cover left closed.
192 14/06/2014 17:41GFN - new firmware
0 5000 1.17 39 0.24 754 0 -GFN reverted to old fault confirmation check, i.e. disabled RCC
193 14/06/2014 18:08GFN - new firmware
0 5000 0.34 28 0.004 1050 0 -
Tran
che
2 - D
ay 3
Bounce behaviour Ground behaviour Ignition
NotesFSH
Protection
Series Resistance
(Ω)
Shunt Resistance
(Ω)GF
N ig
nitio
n te
sts
NER
igni
tion
test
sGF
N ig
nitio
n te
sts
ScheduleTr
anch
e 2
- Day
4
GFN
igni
tion
test
s
Tran
che
3 - D
ay 1
GFN
igni
tion
test
s

P a g e | 135
© Marxsen Consulting Pty Ltd Monday, 4 August 2014
DayTest
IDTest
seriesDate Time
Max Soil Current (Arms)
Duration (ms)
Average Soil
Current (Arms)
Duration (ms)
Sustained Ignition Result
Ignition timing
194
Sand
pit
curr
ent
16/06/2014 8:59 NER 100 5000 3.4 114 3.9 476 1 Bounce 2.5A in sandpit
195 16/06/2014 10:02GFN - new firmware
0 5000 0.55 37 0.001 1580 0 -
GFN parameters modified to increase likelihood of soft fault confirmation, threshold changed to reduce residual voltage. Conditions considered to be more conservative. Voltage collapsed to ~420V residual, (more than on Tranche 3 - Day 1)
196 16/06/2014 10:39GFN - new firmware
0 5000 1.2 47 0.26 1202 0 -
197 16/06/2014 10:53GFN - new firmware
0 5000 0.1 32 - - 0 -
198 16/06/2014 11:12GFN - new firmware
0 5000 0.54 47 0.031 1182 0 -
199 16/06/2014 11:25GFN - new firmware
0 5000 0.17 44 0.005 1118 0 -
200 16/06/2014 11:40GFN - new firmware
0 5000 0.28 45 - - 0 -
201 16/06/2014 13:16GFN - new firmware
0 5000 0.44 45 0.003 1001 0 -
202 16/06/2014 13:33GFN - new firmware
0 5000 0.19 44 0.012 1136 0 -
203 16/06/2014 13:45GFN - new firmware
0 5000 0.2 38 0.003 783 0 -
204 16/06/2014 14:00GFN - new firmware
0 5000 0.26 36 <.001 653 0 -
205 16/06/2014 14:56GFN - new firmware
0 5000 0.14 36 0.007 1197 0 -
206 16/06/2014 15:13GFN - new firmware
0 5000 0.07 42 0.006 1146 0 -
207 16/06/2014 15:25GFN - new firmware
0 5000 0.17 37 0.003 1164 0 -
218 25/06/2014 9:13 NER 3200 - 0.09 35 0.145 19513 0 - Lots of smoking but no flames
219 25/06/2014 9:41 NER 3200 - 0.03 27 0.035 59496 0 -
220 25/06/2014 10:04 NER 3200 - 0.24 35 0.375 14250 1 Ground Ignition following 5 sec
221 25/06/2014 10:29 NER 3200 - 0.23 26 0.335 12880 1 Ground Ignition following 1.2 sec
222 25/06/2014 10:40 NER 3200 - 0.22 27 0.315 14587 1 Ground Ignition following 9.3 sec
223 25/06/2014 10:50 NER 3200 - 0.26 28 0.38 11231 1 Ground Ignition following 1.7 sec
224 25/06/2014 11:08 NER 3200 - 0.04 32 0.03 59467 0 -
225 25/06/2014 11:16 NER 3200 - 0.1 27 0.095 43088 1 Ground Ignition following 32 sec
226 25/06/2014 11:31 NER 3200 - 0.19 26 0.32 9760 1 Ground Ignition following 3.2 sec
227 25/06/2014 11:47 NER 6400 - 0.18 27 0.225 15762 1 Ground Ignition following 3.8 sec
228 25/06/2014 13:38 NER 3200 5000 0.15 33 0.28 59476 1 Ground Ignition following 54 sec
229 25/06/2014 13:56 NER 3200 5000 0.11 22 0.12 41670 1 Ground Ignition following 31 sec
230 25/06/2014 14:15 NER 3200 5000 0.38 32 0.445 6560 1 Ground Ignition following 2.3 sec
231 25/06/2014 14:28 NER 3200 5000 0.16 25 0.31 10080 1 Ground Ignition following 3.6 sec
232 25/06/2014 14:46 NER 6400 5000 0.31 25 0.09 24684 1 Ground Ignition following 10.8 sec
Schedule
FSH Protection
Series Resistance
(Ω)
Shunt Resistance
(Ω)
Bounce behaviour Ground behaviour Ignition
Notes
NER
igni
tion
test
Tran
che
3 - D
ay 4
Tran
che
3 - D
ay 2
GFN
igni
tion
test
s

P a g e | 136
© Marxsen Consulting Pty Ltd Monday, 4 August 2014
DayTest
IDTest
seriesDate Time
Max Soil Current (Arms)
Duration (ms)
Average Soil
Current (Arms)
Duration (ms)
Sustained Ignition Result
Ignition timing
233 25/06/2014 14:56 NER 6400 5000 0.25 27 0.06 59455 0 -
234 25/06/2014 15:21 NER 100 - 1 27 - - 0
235 25/06/2014 15:47 NER 100 - ~16 816 13 820 1 Bounce
236 25/06/2014 15:59 NER 100 -~11.6+fulg
urite99 - - 0
Fulgurite for half a cycle after 90ms. 732A (p-p)
237 25/06/2014 16:14 NER 100 -~12.4+fulg
urite128 - - 1 Bounce Fulgurite following ~50ms
238 25/06/2014 16:23 NER 100 - 9.6 125 - - 1 Bounce
239 25/06/2014 16:36 NER 100 - 12 105 - - 1 Bounce
240 25/06/2014 16:44 NER 100 - 13.9 83 - - 1 Bounce Current settled to 10.8A RMS.
241
NER
igni
tion
test
s
25/06/2014 17:35 NER 3200 - 0.09 34 0.2 28936 1 Ground
Test 241-249 performed with 3/12 steel conductor. Appeared to have more arcs along conductor length than 19 strand Al. Ignition following 32.1 sec
242
NER
igni
tion
test
s
26/06/2014 9:40 NER 3200 - 0.2 36 0.345 9717 1 GroundScaling factor on blue phase changed to account for error in CVD measurement. Ignition following 4.55 sec
243 26/06/2014 9:57 NER 6400 - 0.26 32 0.305 10440 1 Ground Instantaneous. Ignition following 0.1 sec
244 26/06/2014 10:17 NER 12800 - 0.2 35 0.24 9457 1 Ground Ignition following 1.8 sec
245 26/06/2014 10:33 NER 15200 - 0.26 35 0.315 7662 1 Ground Ignition following 0.1 sec
246 26/06/2014 10:55 NER 15200 5000 0.21 27 0.002 59495 0 -Sand pit connected through 100 Ohm resistor.
247 26/06/2014 11:11 NER 6400 5000 0.3 30 0.03 10184 1 Ground Ignition following 2.5 sec
248 26/06/2014 11:27 NER 12800 5000 0.2 26 0.075 15753 1 Ground Ignition following 8.2 sec
249 26/06/2014 11:39 NER 12800 5000 0.26 32 0.0015 59492 0 Ground Ignition following 60 sec
251 26/06/2014 13:31 ASC 100 5000 1.8 37 0.58 4405 1 GroundIgnition following 670ms. Fault interrupted.
253 26/06/2014 14:39 ASC 100 5000 0.1 25 0.0125 1824 0 -
Red phase used henceforth. Current increased to 12ms following 5 sec, suspected fault detection by GFN. Feature disabled. No ignition.
255 26/06/2014 15:19 ASC 100 5000 0.14 25 0.055 19505 0 - Smoking but no fire.
256 26/06/2014 15:33 ASC 100 5000 0.33 30 0.0955 44488 0 - Lots of smoke but no fire.
257 26/06/2014 15:52 ASC 100 5000 0.26 28 0.225 18762 1 Ground Ignition following 12.5 sec
258 26/06/2014 16:02 ASC 100 5000 0.31 35 0.16 9679 1 Ground Ignition following 5.6 sec
259 26/06/2014 16:10 ASC 100 5000 0.31 37 0.16 9107 1 Ground Ignition following 2 sec
Bounce behaviour Ground behaviour Ignition
NotesFSH
Protection
Series Resistance
(Ω)
Shunt Resistance
(Ω)NE
R ig
nitio
n te
sts f
or liv
e lin
e se
quen
ce
Tran
che
3 - D
ay 5
ASC
igni
tion
test
s
Tran
che
3 - D
ay 4
Schedule

P a g e | 137
© Marxsen Consulting Pty Ltd Monday, 4 August 2014
8.3.2 Bolted fault tests
The following tests were performed with the test rig shorted out by a length of flexible welding cable. They were performed to for setup purposes and to explore and measure the performance of each REFCL type. Table 21: Bolted fault tests
Day Test IDTest
seriesDate Time
1 8/04/2014 14:06 GFN 400 - - DAQ false trigger.
2 8/04/2014 14:13 GFN 400 - - Did not record current
3 8/04/2014 14:42 GFN 200 - -Rogowski coil was set to 300A whereas DAQ scaling assumed setting of 3000A
4 8/04/2014 15:09 GFN 100 - -Peak current at 420 A. Rogowski coil setting changed to 30A
5 8/04/2014 15:30 GFN 0 - -Peak current very small. Rogowski coil setting changed to 300A
6 8/04/2014 16:01 NER 400 - - DAQ didn't trigger
7 8/04/2014 16:11 NER 400 - - DAQ manually triggered
8 8/04/2014 16:15 NER 400 - - DAQ manually triggered
9 8/04/2014 17:45 NER 400 - -
10 9/04/2014 11:05 NER 200 - -Rogowski coil replaced with shunt. Current not detected by DAQ
11 9/04/2014 11:19 NER 200 - - Shunt checked. Current not detected by DAQ
12 9/04/2014 11:37 NER 200 - -Resistor checked. Current not detected by DAQ
13 9/04/2014 12:05 NER 200 - -HV lines from resistors were reversed. RCGS1 open 65ms faster than RCGS1 close/ 135ms duration.
14 9/04/2014 12:27 NER 100 - - Stationary steel conductor.
27 10/04/2014 10:19 GFN 3200 - -Error in range and scaling multiplier in Perception software in previous tests addressed. RCC operated, DAQ did not trigger
28 10/04/2014 10:24 GFN 3200 3.07 220 RCC operated
29 10/04/2014 10:36 GFN 3200 3.16 300 Blue phase
30 10/04/2014 11:35 NER 3200 3.98 500
31 10/04/2014 12:51 NER 3200 2.7 500
32 10/04/2014 12:52 GFN 3200 0.775 330
33 10/04/2014 13:22 GFN 15200 0.775 2000RCC did not operate. Neutral displacement ~50-70% of threshold
34 10/04/2014 13:29 GFN 15200 0.795 2447RCC did not operate. Neutral displacement ~50-70% of threshold
35 10/04/2014 13:34 GFN 12800 0.915 2435RCC did not operate. Neutral displacement ~50-70% of threshold
36 10/04/2014 13:36 GFN 12800 0.915 2427RCC did not operate. Neutral displacement ~50-70% of threshold
37 10/04/2014 13:41 GFN 6400 1.6 600 RCC operated.
38 10/04/2014 14:36 GFN 300 20.3 78 RCC operated after only ~70ms.
39 10/04/2014 14:43 GFN 100 64 50
40 10/04/2014 14:53 NER 100 117 500
Tran
che
1A -
Day
1
Elec
tric
al co
mm
issio
ning
Tran
che
1A -
Day
2
Schedule
FSH ProtectionSeries Resistance
(Ω)Max Current (Arms) Duration (ms) Notes
Tran
che
1A -
Day
3
Faul
t cur
rent
wav
efor
m te
sts

P a g e | 138
© Marxsen Consulting Pty Ltd Monday, 4 August 2014
Day Test IDTest
seriesDate Time
41 10/04/2014 14:54 NER 100 116 500
42 10/04/2014 15:06 NER 100 118 500
43 10/04/2014 15:09 NER 100 117 503
44 10/04/2014 15:17 NER 100 117 500
45 10/04/2014 15:19 NER 100 117 500
49 10/04/2014 17:38 GFN 0 - -
76 7/05/2014 12:02 GFN 0 107 (p-p) 2074Initial cycle at 436A (p-p). Suspected ferro-resonance observed. ACR opened following 2s
77 7/05/2014 13:51 GFN 100 24 (p-p) 2430RCC acted, tripped and reverted to NER following 5s
78 7/05/2014 13:51 GFN 100 23 (p-p) 2410Initial ~30ms at 173 A (p-p). RCC acted, tripped and reverted to NER following 5s
79 7/05/2014 14:00 GFN 300 10 (p-p) 2440Initial ~94ms at 94 A (p-p). RCC acted, recovered without tripping to NER
80 7/05/2014 14:03 GFN 300 9 (p-p) 2350Initial ~84ms at 90 A (p-p). RCC acted, recovered without tripping to NER
81 7/05/2014 14:11 GFN 100 23 (p-p) 2390Initial ~40ms at 182 A (p-p). RCC acted, tripped and reverted to NER following 5s
86 7/05/2014 16:49 ASC 300 12.2 (p-p) 230 Initial current at 88 A (p-p)
87 7/05/2014 16:56 ASC 100 18 (p-p) 230 Initial current at 178 A (p-p)
162 29/05/2014 12:21 GFN 15200 0.79/0.65 2432
163 29/05/2014 12:58 GFN 12800 0.95/0.73 873
164 29/05/2014 13:51 GFN 6400 1.9/0.12 2432
165 29/05/2014 13:59 ASC 6400 1.9/1.1 2432
166 29/05/2014 14:03 ASC 3200 3.7/1.5 2432
167 29/05/2014 14:14 GFN 3200 3.7/0.24 2432
168 29/05/2014 14:25 GFN 1600 7.4/0.46 2432
169 29/05/2014 15:17 GFN 800 14.1/0.83 2432
170 29/05/2014 15:25 GFN 600 18.6/1.1 2432
171 29/05/2014 15:34 GFN 400 26.4/1.6 2432
172 29/05/2014 15:47 GFN 300 34.5/2.2 2432
173 29/05/2014 16:07 GFN 200 47.4/3.0 2432
174 29/05/2014 16:28 GFN 100 82.6/5.8 2432
188 14/06/2014 14:25GFN - new firmware
400 26.8 78White phase collapsed to ~250V. GFN could not identify faulted feeder
189 14/06/2014 16:40GFN - new firmware
400 25.8 83GFN tuned. White phase collapsed to ~200V. GFN tested for sustained fault.
190 14/06/2014 16:57GFN - new firmware
200 46.3 122
191 14/06/2014 17:10GFN - new firmware
100 81.2 56
Max Current (Arms) Duration (ms) Notes
Schedule
FSH ProtectionSeries Resistance
(Ω)
Tran
che
1A -
Day
3Tr
anch
e 3
- Day
1Tr
anch
e 1B
- D
ay 3
GFN
bol
ted
faul
t tes
ts
Tran
che
2 - D
ay 4
GFN
and
ASC
bol
ted
faul
tsAd
ditio
nal n
etw
ork
capa
citan
ceRC
C di
sabl
ed

P a g e | 139
© Marxsen Consulting Pty Ltd Monday, 4 August 2014
8.3.3 Setup and invalid tests
The following tests were performed for the purposes of setup or they were ruled invalid for some reason and excluded from the set of ignition results used in the analysis. Table 22: Setup and invalid tests
DayTest
IDTest
seriesDate Time
Max Soil Current (Arms)
Duration (ms)
Average Soil
Current (Arms)
Duration (ms)
Sustained Ignition Result
Ignition timing
15 9/04/2014 13:44 NER 100 600 - 490 - - - - 3/12 steel conductor.
16 9/04/2014 14:08 NER 100 600 - 493 - - - - 3/12 steel conductor. Wet soil
17 9/04/2014 14:17 NER 100 - - 494 - - - -3/12 steel conductor. Shunt resistor earth removed
18 9/04/2014 14:36 NER 100 - - 494 - - - -3/12 steel conductor. Shunt removed in container.
19 9/04/2014 15:05 NER 100 - - 500 - - - - Al conductor and thoroughly wet test bed
20 9/04/2014 16:14 NER 100 - - 317 - 1140 1 - First ignition test. ~1.2s duration
21 9/04/2014 16:14 GFN 100 - - 1240 - - 1 -First ignition test with GFN. RCC did not operate
22 9/04/2014 16:31 GFN 0 - - - - - 1 - RCC did not operate DAQ did not trigger
23 9/04/2014 16:56 GFN 0 - - 200 - - 0 - RCC acted
24 9/04/2014 17:15 GFN 0 600 - 100 - - 0 - RCC acted
25 9/04/2014 17:24 GFN 0 600 - - - - 0 -
26 9/04/2014 17:41 NER 100 600 - 200 - 737 1 -Error identified in Perception software range and scaling multiplier in previous tests
46 10/04/2014 16:42 NER 100 - - - 6.2 490 1 - Extinguished by CO2
47 10/04/2014 16:56 NER 100 - 6.7 290 108.6 205 - - Arcing on soil bed and fulgurite formation
48 10/04/2014 17:19 NER 100 - - - 3.8 494 - - Arcing on soil bed
50 5/05/2014 16:28 GFN 100 600 4 (p-p) 90 - - - -RCC operated. Large difference between RC and shunt current measurements.
51 5/05/2014 17:26 GFN 100 - - 1800 - - - -
Noise present but no 50Hz component of current recorded. Earth removed from shunt resistor to increase fault current. RCC did not operate.
52 5/05/2014 17:40 GFN 100 - 20 (p-p) 75 14.5 (p-p) 140 0 -Sinusoidal current recorded. Fewer spikes in shunt recording. Lots of arcing in video but no ignition
Opt
imisi
ng cu
rren
t m
easu
rem
ent
Ground behaviour Ignition
NotesSeries
Resistance (Ω)
Shunt Resistance
(Ω)
Tran
che
1B -
Day
1
Bounce behaviour
Rig
tuni
ngPr
elim
inar
y ig
nitio
n te
sts
Schedule
FSH Protection
Tran
che
1A -
Day
2Tr
anch
e 1A
- D
ay 3
Faul
t cur
rent
wav
efor
m
test
s
P a g e | 140
© Marxsen Consulting Pty Ltd Monday, 4 August 2014
DayTest
IDTest
seriesDate Time
Max Soil Current (Arms)
Duration (ms)
Average Soil
Current (Arms)
Duration (ms)
Sustained Ignition Result
Ignition timing
53 6/05/2014 9:41 GFN 0 - 13 (p-p) 60 14.5 (p-p) 220 1 -Intended fault duration 3000ms, ACR opened.
54 6/05/2014 10:31 GFN 0 - - - 6 (p-p) - 0 -
Shunt cable removed from circuit entirely. Cell supply open reduced from 5000ms to 3500ms. Arm dampening increased. Gen3i triggered late. Video did not show arcing. Very little arcing, no sinusoidal current.
55 6/05/2014 10:42 GFN 0 - 6 (p-p) 26 8 (p-p) 315 0 -Repeat. Gen3i triggered normally. Video did not show arcing. No sinusoidal current.
56 6/05/2014 10:50 GFN 0 - 7 (p-p) 26 7 (p-p) 390 0 -Repeat Gen3i triggered normally. Video did not show arcing.
57 6/05/2014 11:06 GFN 0 - 7 (p-p) 27 9 (p-p) 1438 0 -Shunt cable re-attached. Same behaviour as before, very little current, no sinusoidal current.
58 6/05/2014 11:25 GFN 0 - 10.5 (p-p) 60 9 (p-p) 215 0 - Shunt cable disconnected.
59 6/05/2014 11:38 GFN 0 - 15 (p-p) 195 - - 0 -Shunt cable reconnected. RCD tripped power to test cell
60 6/05/2014 13:00 GFN 0 600 50 (p-p) 45 - - 0 -
Rogowski coil moved to shunt resistor line (on earth line). Coax shunt recording soil bed current (transducers on current channels switched switched). Very short arc duration (20ms). RCC acted
61 6/05/2014 13:30 GFN 0 3200 12 (p-p) 17 10 (p-p) 175 0 - Very short arc duration (15ms). RCC acted
62 6/05/2014 13:55 GFN 0 15200 12 (p-p) 28 10 (p-p) 180 1 -
63 6/05/2014 15:56 GFN 0 600 11 (p-p) 30 - - 0 -RCC triggered. 3.25 sec b/w fault trigger and current detection.
64 6/05/2014 16:11 GFN 0 600 12 (p-p) 70 - - 0 -RCC triggered. 2.855 sec b/w fault trigger and current detection.
65 6/05/2014 16:19 GFN 0 600 15 (p-p) 63 - - 0 -RCC triggered. 1.645 sec b/w fault trigger and current detection.
66 6/05/2014 16:31 GFN 0 600 15 (p-p) 63 - - 0 -RCC triggered. 2.86 sec b/w fault trigger and current detection.
67 6/05/2014 16:41 GFN 0 600 15 (p-p) 63 - - 0 -RCC triggered. 2.855 sec b/w fault trigger and current detection.
68 7/05/2014 9:53 NER 100 600 10 (p-p) 62 11 (p-p) 920 1 -NER test. 1250ms between current start and cell supply close
69 7/05/2014 10:06 NER 100 600 10 (p-p) 58 10 (p-p) 815 1 -Fault duration increased by 100ms. 1150ms of between current start and cell supply close
70 7/05/2014 10:28 NER 100 600 14 (p-p) 110 15 (p-p) 897 1 -1150ms of between current start and cell supply close.
71 7/05/2014 10:37 NER 100 600 9 (p-p) 88 9 (p-p) 914 1 -1150ms of between current start and cell supply close. Ignition
72 7/05/2014 10:51 NER 100 600 12 (p-p) 110 13 (p-p) 633 0 -
1550ms of between current start and cell supply close. 3.249 sec b/w fault trigger and current detection. Additional 400ms attributed to actuator starting in "home" position.
73 7/05/2014 11:06 NER 100 - 22 (p-p) 1355 - - 1 -No shunt resistor.1350ms between current start and cell supply close
74 7/05/2014 11:14 NER 100 - 24 (p-p) 1348 - - 1 -1350ms of between current start and cell supply close. Ignition
75 7/05/2014 11:21 NER 100 - 16 (p-p) 1345 - - 1 -1350ms of between current start and cell supply close. Ignition
Tran
che
1B -
Day
3Bounce behaviour Ground behaviour Ignition
Notes
Opt
imisi
ng cu
rren
t mea
sure
men
t and
influ
ence
of s
hunt
resis
tor c
able
.
Schedule
FSH Protection
Series Resistance
(Ω)
Shunt Resistance
(Ω)
Tran
che
1B -
Day
2
Shun
t res
istor
cont
act
GFN
igni
tion
test
s. Co
nfirm
rig
tim
ing
NER
test
s

P a g e | 141
© Marxsen Consulting Pty Ltd Monday, 4 August 2014
DayTest
IDTest
seriesDate Time
Max Soil Current (Arms)
Duration (ms)
Average Soil
Current
Duration (ms)
Sustained Ignition Result
Ignition timing
82 7/05/2014 14:40 GFN 100 600 7 (p-p) 26 - - 0 -
83 7/05/2014 14:46 GFN 100 600 13 (p-p) 50 - - 0 -
84 7/05/2014 14:58 GFN 0 600 13 (p-p) 50 - - 0 -
85 7/05/2014 15:03 GFN 0 600 17 (p-p) 35 - - 0 -
88 7/05/2014 17:06 ASC 100 - 10.9 (p-p) 60 6.7 (p-p) 35 0 -
89 7/05/2014 17:17 ASC 100 - 12 (p-p) 30 9 (p-p) 1065 1 -
90 7/05/2014 17:25 ASC 100 - 15 (p-p) 30 8 (p-p) 1060 1 -
91 26/05/2014 12:16 NER 100 600 1.7 37 1.5 195 0 -28ms delay b/w shunt contact and fault current through bed
92 26/05/2014 12:16 NER 100 600 1.6 38 1.55 196 0 -Shunt contact dropped 25mm. Fuel bed levelled. 11ms delay b/w shunt contact and fault current through bed
93 26/05/2014 12:19 NER 100 600 2 48 1.75 218 0 -
No change, shunt lever reset itself to intermediate starting position. Bed re-used. 0.3ms delay b/w shunt contact and fault current through bed
94 26/05/2014 12:23 NER 100 600 1.9 39 2 237 0 -No change, bed re-used. 1ms delay b/w shunt contact and fault current through bed
95 26/05/2014 12:31 GFN 100 600 1.7 37 - - 0 - Impacted bed. 1.7ms delay
96 26/05/2014 12:38 GFN 100 600 1.9 38 - - 0 - 2.3 ms delay w/fresh soil bed.
97 26/05/2014 12:42 GFN 100 600 2 39 - - 0 - 2.5 ms delay w/fresh soil bed.
Tran
che
2 - D
ay 3
150
NER
igni
tion
test
s
28/05/2014 14:58 NER 100 - 3.4 44 4.4 456 1 N/ABed used twice. ACR prevented current flow during first strike. Test not counted towards ignition result.
175 29/05/2014 16:51 GFN 0 - 12.4 46 - - 0 -
Timing trial using previously impacted soil bed. Not counted towards ignition tests. Arm mechanism timing 2.875s. 50ms
176 29/05/2014 17:01 GFN 0 - 14 79 - - 1 BounceBounce behaviour different to that before conductor arm was damaged following test #161
177 29/05/2014 17:10 GFN 0 - 13 48 - - 1 Bounce
178 29/05/2014 17:17 GFN 0 - 12.4 48 - - 1 Ground
179 29/05/2014 17:27 GFN 0 - 0.9 25 0.4 1839 0 -
Ignition not sustained, review on Sony video. 25ms of 0.7A RMS arcing on first bounce. RCC did not act. 1.8s of low current following second bounce.
180 29/05/2014 17:33 GFN 0 - 0.8 37 0.65 1716 1 Ground0.7A RMS. RCC did not act. High speed video continued with residual arcing until arm lifts
181 14/06/2014 11:00 NER 100 5000 - - - - 0 - DAQ didn't record current signals
182 14/06/2014 11:18 NER 100 5000 - - - - 0 -DAQ didn't record current signals - Rogowski coil battery dead and current
183 14/06/2014 11:52 NER 100 5000 0.97 36 1.05 338 11A RMS into soil and 2.5A RMS into sand pit. 5000 Ohm resistance. Shunt (sand pit) engaged 3ms before soil bed
184 14/06/2014 12:16 NER 100 5000 1.2 38 1.3 346 0 - 2.5A RMS into sand pit. Shunt (sand pit)
185 14/06/2014 12:33 NER 100 5000 1.2 30 1.25 357 0 - 2.5A RMS into sand pit. Shunt (sand pit) engaged 5ms before soil bed
186 14/06/2014 12:54 NER 100 5000 7.3 45 8.1 343 1Soil bed replaced (old bed used). Shunt (sand pit) engaged 8.6ms after soil bed
187 14/06/2014 13:41 NER N/A N/A - - - - - -Voltage neutral displacement check to assess CVD performance
IgnitionNotes
ScheduleFSH
Protection
Series Resistance
(Ω)
Shunt Resistance
(Ω)
Bounce behaviour Ground behaviourTr
anch
e 3
- Day
1
Setu
p - C
onfir
m ri
g op
erat
ion,
'san
d pi
t' re
sista
nce,
CV
D m
easu
rem
ent
GFN
igni
tion
test
s
Tran
che
2 - D
ay 1
Setu
p, sh
unt r
esist
or ti
min
g.Ad
ditio
nal n
etw
ork
capa
citan
ceRC
C di
sabl
ed
Tran
che
2 - D
ay 4

P a g e | 142
© Marxsen Consulting Pty Ltd Monday, 4 August 2014
DayTest
IDTest
seriesDate Time
Max Soil Current (Arms)
Duration (ms)
Average Soil
Current (Arms)
Duration (ms)
Sustained Ignition Result
Ignition timing
208 16/06/2014 15:44GFN - new firmware
0 5000 >45 19 1.9 1166 1 BounceDamp soil. 600A peak on GFN record. Fulgurite
209 16/06/2014 16:23GFN - new firmware
400 5000 9.8 60 2 1288 1 Ground
No ignition on bounce. GFN could not identify fault location during soft confirmation test. Ignition during hard fault confirmation test (~2A RMS).
210 16/06/2014 16:57GFN - new firmware
0 5000 3.6 48 0.9 1177 0 -Grass not conditioned. No ignition, considerable smoking during hard fault confirmation test (~1A RMS)
211 16/06/2014 17:14GFN - new firmware
0 5000 0.7 45 0.2 1203 0 -Grass not conditioned. No ignition, lower current during hard fault confirmation test
212 16/06/2014 17:30 NER 0 5000 0.5 46 0.6 692 0 -NER with 1.9s fault duration. ACR opened. Smoke but no fire.
213 16/06/2014 17:36 NER 0 5000 0.34 44 0.6 1433 0 -Increased fault duration. Smoke but no fire.
214 16/06/2014 17:52 NER 0 5000 0.09 36 0.02 1936 0 -Duration increased further. No fire, very small current.
215 17/06/2014 10:23 NER 400 5000 1.2 891 - - 1 Bounce Arc didn't extinguish during bounce
216 17/06/2014 11:08 NER 400 5000 12.7 892 - - 1 Bounce
217 17/06/2014 11:35GFN - new firmware
100 5000 1.7 37 >100 2083 1 GroundMultiple faults on blue phase 300ms into test.
250 26/06/2014 ASC 100 5000 - - - ~4s 1 GroundASC tests. NER kicked in. Gen 3i not triggered.
252 26/06/2014 13:50 ASC 100 5000 0.52 27 0.265 11417 1 Ground
Current increased following 5 sec, due to suspected fault on red phase. Ignition following 7.6 s. Fault interrupted. Switch to Red phase following fault.
254 26/06/2014 15:11 ASC 100 5000 - - - - 0 - Same bed used. Current peak rectified.
Notes
Schedule
FSH Protection
Series Resistance
(Ω)
Shunt Resistance
(Ω)
Bounce behaviour Ground behaviour IgnitionTr
anch
e 3
- Day
3
Med
ia d
emon
stra
tion.
NER
and
GFN
igni
tion
test
sGF
N ig
nitio
n te
sts
NER
igni
tion
test
sAS
C ig
nitio
n te
sts
Tran
che
3 - D
ay 2
Tran
che
3 - D
ay 5

P a g e | 143
© Marxsen Consulting Pty Ltd Monday, 4 August 2014
8.4 Appendix D: ignition from fulgurite formation Fulgurites are hollow tubes of fused silica formed in soil by electric arcs. They occur naturally with lightning strikes and they can occur in powerline earth faults if there is buried metal near a fallen powerline conductor (water or gas pipe, electrical or telephone cables, foundations, etc.) at a depth and of a length sufficient to offer a low resistance path to earth current.
Fulgurite formation was first observed in the test program in the February 2014 proof-of-concept tests as shown in Figure 65. Figure 65: Fulgurite formation in February 2014 proof-of-concept tests at Ausgrid/TCA Lane Cove West facility
Immediately prior to fulgurite formation
Fulgurite ‘punch through’ to soil bed metal casing
Typical fulgurite structure dug out of soil, about 100 millimetres long
It was observed that fulgurites were a potent cause of ignition. High speed video records demonstrated that the open end of a fulgurite ejects copious amounts of incandescent molten silicaceous material which rapidly ignites surrounding vegetation.
After some consideration and consultation with the technical Working Group, it was decided that fulgurites were unlikely to feature in rural ‘wire on ground’ faults as those locations rarely have buried metal, with the possible exception of pole-stay anchors, so they were specifically excluded from the ignition mechanisms under study in the test program.
From the proof-of-concept test data, it was observed that:
• Fulgurites form almost instantly once the plasma tendrils from the conductor-soil arc reach earthed metal
• It can take significant time for the conductor-soil arc plasma tendrils to reach metal through soil. The reach of the plasma tendrils was observed to extend further with each half cycle of fault current. The time taken to reach earthed metal depended on the distance to be spanned by the plasma and the arc current involved. Values of 100 to 300 milliseconds were achieved with medium sized metal-sided soil trays.
On this basis, the soil bed container design was modified to reduce the likelihood of fulgurite formation in tests. The container was made of plastic not metal and the size was chosen to provide 23 cm of soil between the conductor and a 100 millimetres wide copper earth strip under the soil. These modifications successfully reduced the occurrence of fulgurite formation to a very low level.
Nevertheless, some tests produced fulgurites. These were mostly NER tests where current was high and the test duration was relatively long. Fulgurite formation also occurred in two REFCL tests – though both these events had anomalous features that resulted in their exclusion from ignition test data.
8.4.1 Fulgurite formation in NER tests
NER Tests 20, 115, 236, and 237 all contained instances of fulgurite formation. Even with the changes to soil bed container design following the proof-of-concept tests, it was recognised that
P a g e | 144
© Marxsen Consulting Pty Ltd Monday, 4 August 2014
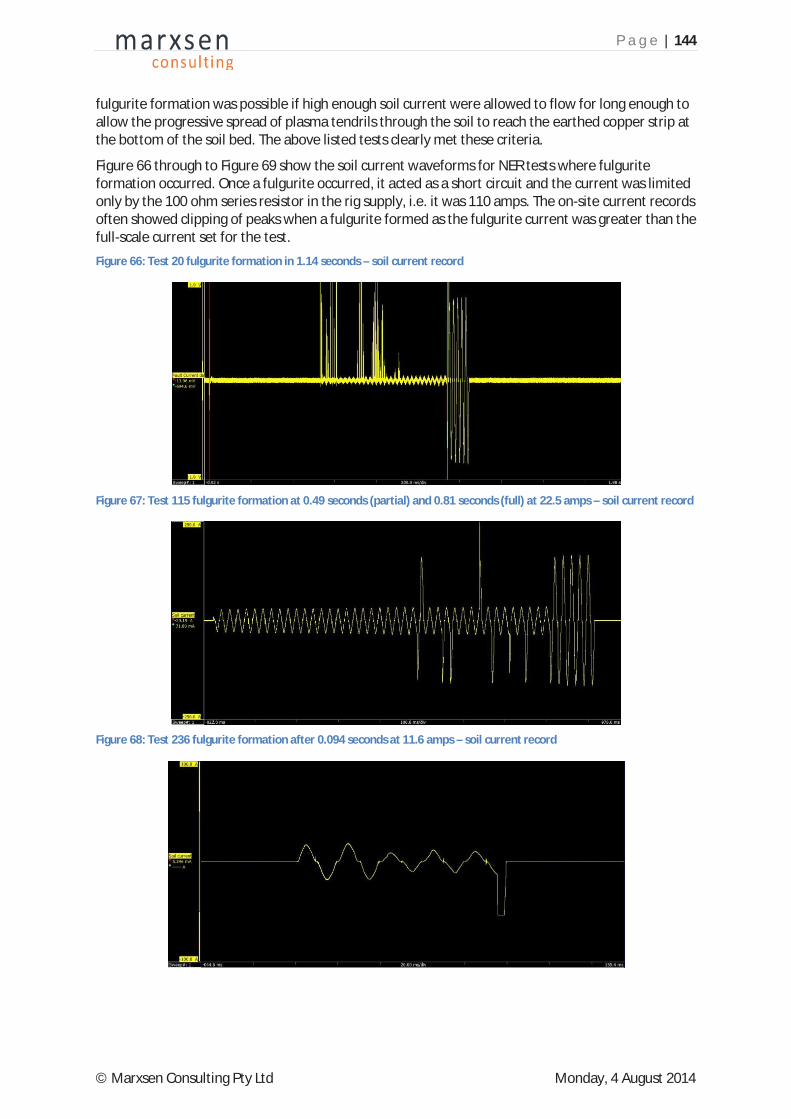
fulgurite formation was possible if high enough soil current were allowed to flow for long enough to allow the progressive spread of plasma tendrils through the soil to reach the earthed copper strip at the bottom of the soil bed. The above listed tests clearly met these criteria.
Figure 66 through to Figure 69 show the soil current waveforms for NER tests where fulgurite formation occurred. Once a fulgurite occurred, it acted as a short circuit and the current was limited only by the 100 ohm series resistor in the rig supply, i.e. it was 110 amps. The on-site current records often showed clipping of peaks when a fulgurite formed as the fulgurite current was greater than the full-scale current set for the test. Figure 66: Test 20 fulgurite formation in 1.14 seconds – soil current record
Figure 67: Test 115 fulgurite formation at 0.49 seconds (partial) and 0.81 seconds (full) at 22.5 amps – soil current record
Figure 68: Test 236 fulgurite formation after 0.094 seconds at 11.6 amps – soil current record

P a g e | 145
© Marxsen Consulting Pty Ltd Monday, 4 August 2014
Figure 69: Test 237 fulgurite formation after 0.044 seconds at 12.5 amps – soil current record
8.4.2 Test 208: anomalous fulgurite formation in a GFN test
Test 208 was a GFN ignition test with zero series resistance in the supply to the test rig. It was the only REFCL test in which fulgurite formation appeared to have occurred without an external network disturbance to trigger it. Examination of the test records revealed several puzzling features.
Upon initial impact of the conductor on the soil bed, soil current exhibited the following behaviour: it increased to 1.4 amps in the first 0.54ms of the fault period; the rate of current growth then increased so it reached 8.0 amps by 0.62ms and 41.0 amps by 2.7ms into the fault period; at this point, fulgurite formation appeared to occur. On-site soil current measurement systems saturated at 55 amps, but GFN records revealed the current reached 620 amps in the positive direction, followed by 280 amps in the negative direction before it returned to normal levels just 9.0ms into the fault period. During this excursion, the conductor voltage dropped 17.6kV (an exponential decay to 1.1kV with a decay time constant of 17us) before exhibiting a typical high power arc voltage profile (two half cycles clipped at +600 volts and -700 volts) for 6.3ms.
On-site records revealed the fulgurite arc extinguished and normal soil current behaviour (about one amp) was recorded from that point on. The conductor voltage recovered to about 4.0kV before the RCC response at around the 60ms mark reduced it to normal residual voltage levels. Figure 70: Test 208 fulgurite formation in a GFN test - on-site recordings

P a g e | 146
© Marxsen Consulting Pty Ltd Monday, 4 August 2014
Figure 71: Test 208 - fulgurite formation in a GFN test - GFN records
High speed video showed the typical appearance of a fulgurite: extremely bright light emission and ejection of incandescent molten material flowed by ignition of vegetation. Figure 72: Test 208 high speed video record of fulgurite formation
Test 208: last frame prior to fulgurite formation (normal one amp soil current arcs)
Test 208: first frame after fulgurite formation (600 amp fulgurite arc)
Test 208: 28ms after fulgurite formation (vegetation flame)
The fulgurite current in Test 208 was too brief to form the normal glass-lined tunnel through the soil bed. However, the track of the current was clearly visible as can be seen in Figure 73. Figure 73: Test 208 fulgurite track through soil
The fulgurite formation in Test 208 exhibited a number of anomalous features:
1. It was the only instance of fulgurite formation in more than a hundred REFCL tests (apart from Test 217 described below which was the result of a heavy cross-country fault).
2. The fulgurite formed within three milliseconds of conductor-soil contact. This rapidity had never been seen before, even with the prototype metal-sided soil bed designs which were quite susceptible to fulgurites. Typically, fulgurite onset times were tens to hundreds of milliseconds.
3. The arc current in the fulgurite was not 50Hz current but appeared to be around (but not quite equal to) the third harmonic, with a period close to 6.3ms.
-400.00
-200.00
0.00
200.00
400.00
600.00
800.00
-40,000
-30,000
-20,000
-10,000
0
10,000
20,000
30,000
40,000
1 11 21 31 41 51 61 71 81 91 101
111
121
131
141
151
161
171
181
191
201
211
221
231
241
251
261
271
281
291
301
311
321
331
341
351
361
371
381
391
401
411
421
431
441
451
461
471
481
491
501
511
521
531
541
551
561
571
581
591
601
611
621
631
641
651
661
671
681
691
701
711
721
731
741
751
761
771
781
791
801
811
821
831
841
851
861
871
881
891
901
911
921
931
941
951
961
Curr
ent (
A)
Volta
ge (V
)
Zero Sequence Current and Voltage from Slave
Neutral voltage FSH 21 3Io c urrent

P a g e | 147
© Marxsen Consulting Pty Ltd Monday, 4 August 2014
4. The fulgurite arc extinguished after a single cycle of heavy current. No other fulgurite had been observed that had done this. In all other cases, once a fulgurite had established itself to the extent it had conducted current for two half cycles, it persisted until the power was cut off.
5. Test 208 was a GFN test with zero series resistance between the network and the test rig. It was known that this configuration produced what appeared to be a form of ferro-resonance in bolted fault tests.
No clear conclusion was reached in the brief investigation of Test 208. However, the ignition that resulted was regarded as anomalous and not included in GFN bounce ignition results.
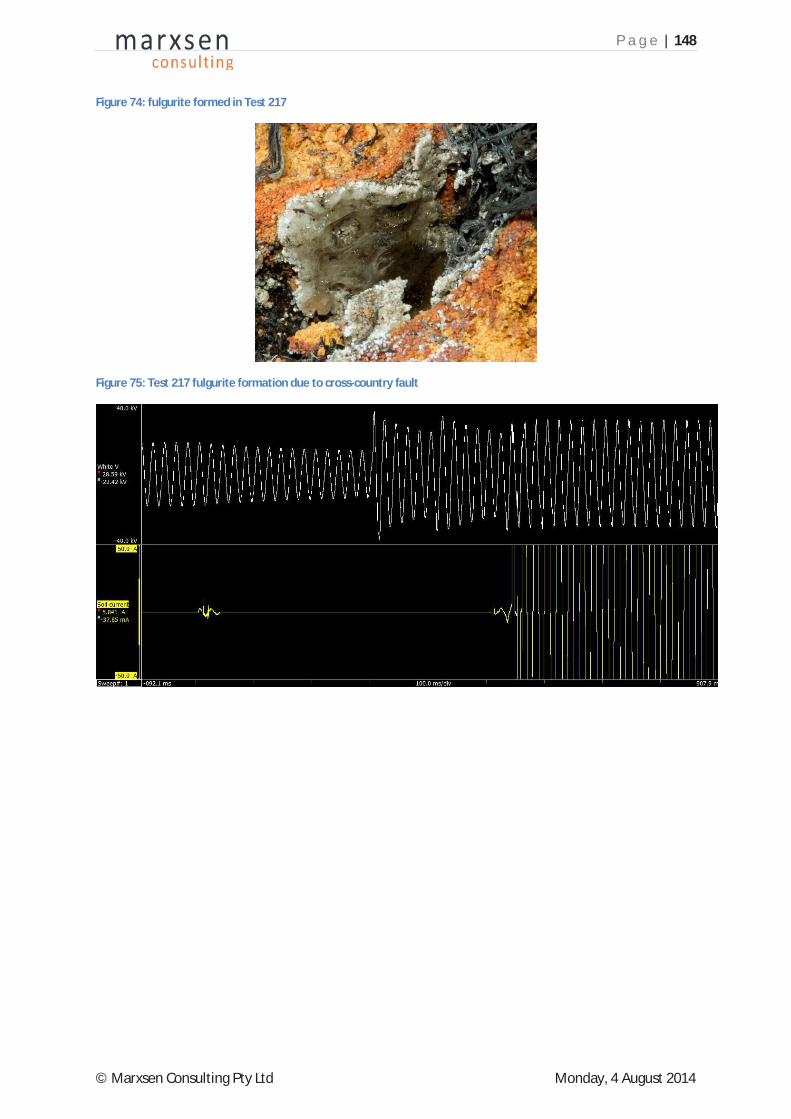
8.4.3 Test 217 – fulgurite formation due to a cross-country fault
In Test 217 a cross-country fault occurred during a GFN ignition test with a 100 ohm resistor in series in the rig supply. This caused the voltage applied to the rig during the test to rise to 22,000 volts and a fulgurite formed quickly after the second conductor bounce.
The current and conductor voltage in Test 217 are shown in Figure 75. The soil current peaked at 1.7 amps on the first bounce. The GFN did not immediately detect the fault so the initial white phase voltage collapse followed the natural ASC-style reduction due to the initial pulse of fault current. However, just as the GFN detected the fault and triggered the RCC response to reduce the conductor voltage, while the conductor was between bounces and with the conductor voltage at about 9,000 volts, a heavy cable fault occurred on blue phase instantly increasing the conductor voltage to 22,000 volts. The RCC was trying to compensate for a white phase fault and was overwhelmed by the heavy blue phase fault – the GFN log indicated it most likely tripped on overload and took no further part in events.
In the absence of RCC compensation of the blue phase cable fault, it re-struck twice by the time the conductor again contacted the soil bed. When the second bounce occurred, the soil current was a few amps for 30 milliseconds before a fulgurite formed. The current immediately increased to about 200 amps (limited only by the 100 ohm series resistor in the test rig supply) for the remaining 1.8 seconds of the test duration.
The mouth of the fulgurite formed in this event is shown in Figure 74. The glass lining of the hollow tube that contained the arc is clearly visible.
P a g e | 148
© Marxsen Consulting Pty Ltd Monday, 4 August 2014
Figure 74: fulgurite formed in Test 217
Figure 75: Test 217 fulgurite formation due to cross-country fault

P a g e | 149
© Marxsen Consulting Pty Ltd Monday, 4 August 2014
8.5 Appendix E: HRL Technology REFCL Trial report