reef check report 2001-2002 - coral cay … · reef check report (2001-2002) - prepared by - dianne...
TRANSCRIPT

FIJI REEF CONSERVATION PROJECT 2002
REEF CHECK REPORT (2001-2002)
- Prepared by -
Dianne Walker, CCC Project Scientist Jean-Luc Solandt, CCC Indo-Pacific Marine Scientist
Simon Haycock, CCC Science Officer Jessica Taylor, CCC Research Assistant
Simon Harding, CCC Marine Science Co-ordinator Peter Raines, CCC Managing Director
October 2002
Ministry of Tourism
and Transport
Coral Cay Conservation Ltd 13th Floor, The Tower
125 High Street, Colliers Wood London, SW19 2JG, UK
Tel: +44 (0) 870-750-0668 Fax: +44 (0) 870-750-0667
Email: [email protected] www: www.coralcay.org
TM
CONTENTS
ACKNOWLEDGEMENTS ..............................................................................................1
EXECUTIVE SUMMARY ...............................................................................................2
1. INTRODUCTION......................................................................................................3
1.1 BACKGROUND.......................................................................................................3 1.2 AIM OF THIS REPORT .............................................................................................4
2. REEFCHECK ............................................................................................................6
2.1 OVERVIEW ............................................................................................................6 2.2 METHOD ...............................................................................................................6 1.3 SURVEYS CARRIED OUT.........................................................................................8
3. RESULTS .................................................................................................................10
3.1 QUANTITATIVE ASSESSMENT BETWEEN 2001 & 2002.........................................10 3.2 ACCURACY ASSESSMENT....................................................................................11
4. DISCUSSION ...........................................................................................................19
6. CONCLUSIONS ......................................................................................................22
7. REFERENCES.........................................................................................................23
APPENDIX 1 ....................................................................................................................25
APPENDIX 2 ....................................................................................................................26
APPENDIX 3 ....................................................................................................................27

Introduction Fiji Reef Conservation Project
Coral Cay Conservation - October 2002
1
ACKNOWLEDGEMENTS The continuing success of the Fiji Reef Conservation Project would not have been possible without: the vision and leadership provided by the Government of Fiji, and in particular the Ministry of Tourism and Transport and the Fiji Visitors Bureau; the generous hospitality of Castaway Island Resort: in particular, Geoff Shaw, Garry Snodgrass, Craig and Karen Flannery, Geof and Trudy Loe, Veresa Naiqara, Tevita Layasewa and Joape Waqairawai; and the guidance, encouragement and generous support provided by the following project partners (listed in alphabetical order): Air New Zealand: Francis Mortimer, Simon Bean and colleagues. Aqua-Trek: Andrew Redfern, Yoshi Kyakuno and colleagues. Beachcomber Island Resort: Dan Costello and colleagues. Biological Consultants Fiji: Edward Lovell. British Airways. British High Commission, Fiji. Dive Pacific Magazine. Dive Tropex: Alex and Will Wragg. Fiji Institute of Technology: Winifereti U. Nainoca. International Secondary School, Suva: Litiana Temol and colleagues. Live & Learn: Christian Nielsen. Musket Cove Resort: Dick Smith and colleagues. PADI: Colin Melrose. Resort Support: Helen Sykes. SOPAC: Robert Smith and colleagues. South Seas Cruises: Mark Fifield and colleagues. Subsurface Fiji: Tony Cottrell, John Brown and colleagues. Tokoriki Island Resort: Andrew Turnbull and colleagues. UNDP: Jenny Bryant-Tokalau and colleagues. University of the South Pacific: Robin South, Robyn Cumming, Johnson Seeto, Shirley Mohammed and colleagues. West Side Water Sports: Lance and Lily Millar, John Purves and colleagues. WWF: Dermot O’Gorman, Lisette Wilson, Etika Rupeni and colleagues.
Finally, we would like to thank all the Coral Cay Conservation team members and local staff members at Ravinaki/Castaway Island Resort who have contributed to the production of this report in some way

Introduction Fiji Reef Conservation Project
Coral Cay Conservation - October 2002
2
EXECUTIVE SUMMARY ?? Reef Check surveys were carried out by CCC volunteer divers in the Mamanucas
region, Fiji at the same locations over a two year period (2001-2002) as part of the ‘Fiji Reef Conservation Project’ (FRCP).
?? Data was collected on anthropogenic impacts, benthic cover and a number of target
reef fish and invertebrates at 22 sites. ?? The results for benthic cover have been reported and discussed with reference to two
coral bleaching events. The first, in early 2000 was severe and resulted in significant loss of hard coral cover in the Mamanucas region. The second smaller event occurred in April 2002.
?? Data reported here indicates that mean hard coral cover has almost doubled between
the two survey periods from 14 % in 2001 to 27 % in 2002. There was a corresponding decrease in the amount of reef rock recorded by divers.
?? Benthic data suggests that the reefs of the Mamanucas region are recovering well
after the deleterious effect of coral bleaching in 2000. The smaller bleaching event of 2002 has not significantly altered the amount of live hard coral in the region.
?? Data collected on target reef fish and invertebrates has highlighted the apparent rarity
of some species in the Mamanucas although further information is required to confirm their scarcity. Crown-of-thorns sea stars (COTs) were recorded but at low levels.
?? Future CCC Reef Check surveys in the Mamanucas (2003 and beyond) will provide
evidence to determine whether the data presented here is part of an ongoing trend in terms of coral recovery.
Introduction Fiji Reef Conservation Project
Coral Cay Conservation - October 2002
3
1. INTRODUCTION Fiji is one of the wealthiest countries in the South Pacific. The nation’s wealth is partly attributed to its extensive marine resources, which generate significant revenue through tourism and fishing. Fiji’s marine environments are also an important source of protein for the local population. The country is made up of approximately 844 volcanic islands and is dominated by the Viti Levu and Vanua Levu platforms which account for 87% of the total land area (Vuki et al., 2000). Fiji has a moderate tropical climate which, over time has enabled the development of extensive coral reefs around all of the nation’s islands. Although the tropical forests and coral reefs of Fiji are of vital importance both ecologically and economically, they are under threat through rapid economic and population growth. Fiji’s natural forests are now seriously threatened from land-use conversion activities such as logging and agricultural development (Spalding et al, 2001). Similarly, the countries’ coral reef ecosystems are being adversely affected by a range of anthropogenic activities including over-fishing, destructive fishing, sedimentation, eutrophication and pollution. This has resulted in extensive loss of coral reef habitats and the inducement of coral diseases. Recent coral bleaching events and storm damage have synergistically exacerbated these effects to reduce reef health further (South and Skelton, 2000). Such impacts represent substantial threats to the ecological balance and health of reef ecosystems on a variety of temporal scales. If left unchecked these impacts will ultimately lead to reduced financial returns for coastal communities and other stakeholders who rely on fishing and marine-based tourism for their livelihoods. 1.1 Background The Mamanuca Islands in western Fiji (Fig. 1) have been the focus of tourism development in Fiji for many years (at least since the mid-1960s). The tourism industry in Fiji is very much aware of the value of conserving the coral reefs and fostering sustainable development. At the invitation of the Fiji Visitors Bureau, the Ministry of Tourism and Transport and other stakeholders, a small delegation from CCC visited Fiji in December 2000 to attend the annual Fiji Tourism Forum and enter into discussions with the aforementioned parties. As a result, the Forum passed a resolution enlisting the services of CCC. In March 2001, the FVB and other project partners sponsored a CCC follow up visit to Fiji to continue discussions. One significant outcome of this trip was the signing of a Memorandum of Understanding between the Ministry of Tourism and CCC, which formalised arrangements for the ‘Mamanuca Coral Reef Conservation Project – Fiji 2001’ (MCRCP). This pilot project was carried out between June and September 2001. (see Harborne et al., 2001) and its success led to the inception of a much more expansive series of activities collectively known as the Fiji Reef Conservation Project (FRCP). The current project started in March 2002 and is initially expected to run for three years until March 2005 (as stated in a Memorandum of Agreement between CCC and the Fijian Department for Tourism, Transport and Aviation, with collaboration with the Mamanucas Hoteliers Association signed in December 2001).

Introduction Fiji Reef Conservation Project
Coral Cay Conservation - October 2002
4
Figure 1. (a) The Fiji islands, showing the project area (dashed line) for the MCRCP.
Source: Fiji Visitors Bureau. (b) Major islands with the Mamanucas. 1.2 Aim of this report This report compares Reef Check data gathered from the Mamanucas Coral Reef Conservation Project in 2001with that collected exactly a year later in June/July 2002 during the FRCP. The comparison will highlight any significant differences in fish,
(a)
(b)

Introduction Fiji Reef Conservation Project
Coral Cay Conservation - October 2002
5
invertebrate and benthic population characteristics between 2001 and 2002, and in so doing offers an insight into potential changes in reef health over this time span. In February 2000 there was a considerable bleaching event which decimated many of the shallow water corals around the Mamanucas and across the wider Fiji area (South and Skelton, 2000). A minor bleaching event was also observed on many Fijian reefs in May 2002. Water temperatures in the Mamanucas reached 31ºC during April 2002, the threshold temperature at which many corals are thought to become most susceptible to bleaching (Brown, 1997). Reef Check data for 2002 was collected just after any effects of elevated water temperatures were noticed in other parts of the archipelago. The combination of data collected after the 2000 event and directly after the minor event of 2002 will give an indication of the relative health of corals for the Mamanucas in relation to the bleaching effects.

ReefCheck Fiji Reef Conservation Project
Coral Cay Conservation - October 2002
6
2. REEFCHECK 2.1 Overview Reef Check1 is the largest international coral reef monitoring programme designed for non-professional divers to assess reef health. The organisation recently published a five-year report summarising the results of surveys at more than 1500 reefs (Hodgson and Liebeler, 2002). Reef Check surveys generate relatively simple but useful quantitative information. Five types of data are recorded:
?? Physical and anthropogenic factors (site description sheet) ?? abundance of commercially important fish ?? abundance of target invertebrate taxa ?? percentage cover of substratum types and components of the benthic community ?? obvious anthropogenic impacts.
The FRCP has modified the standard Reef Check protocol to collect more detailed data (giving greater taxonomic resolution) and hence provide a better assessment of reef health. Such modifications are possible because all CCC volunteers on the FRCP receive more intensive training than regular pleasure divers who undertake Reef Check. 2.2 Method The standard Reef Check survey protocol utilises transects at two depths of approximately 3 and 10 m. During the FRCP all transects were carried out at 2 and 10 m as at most sites, the reef community in the slightly shallower water was more representative of Fijian reef systems. Along each depth contour a 100 m transect was deployed. Four replicate transects, each 20 m in length were surveyed along the 100 m. The replicate transects followed the designated depth contour in sequence but the start and end points are separated by a 5 m space (Fig. 2). Therefore the distance between the start of the first transect and end of the last transect was 20 + 5 + 20 + 5 + 20 + 5 + 20 = 95 m. By collecting data from each of the 20 m sections, four replicates were collected per survey, allowing the calculation of a mean value per transect and hence more powerful statistical analysis. Five types of data were recorded via three surveys along each transect line at each depth. Firstly, a site description sheet was completed which included locations, anecdotal, observational and historical information and other data. Secondly, four 5 m wide by 20 m long transects (centred on the transect line) were sampled for commercially important fish, for example those typically targeted by fisherfolk and aquarium collectors. Fish were only counted if they were less than 5 m above the transect line, giving a survey area for each transect replicate of 20 x 5 x 5 m = 500 m3. CCC volunteers in Fiji recorded data for more fish species than specified by the standard Reef Check protocol. Divers on fish surveys remained stationary at the start of each replicate transect for three minutes and recorded target fish in this time. This method ensures minimal disturbance to the fish population allowing reef fish to resume ‘normal 1 Further details at http://www.reefcheck.org
ReefCheck Fiji Reef Conservation Project
Coral Cay Conservation - October 2002
7
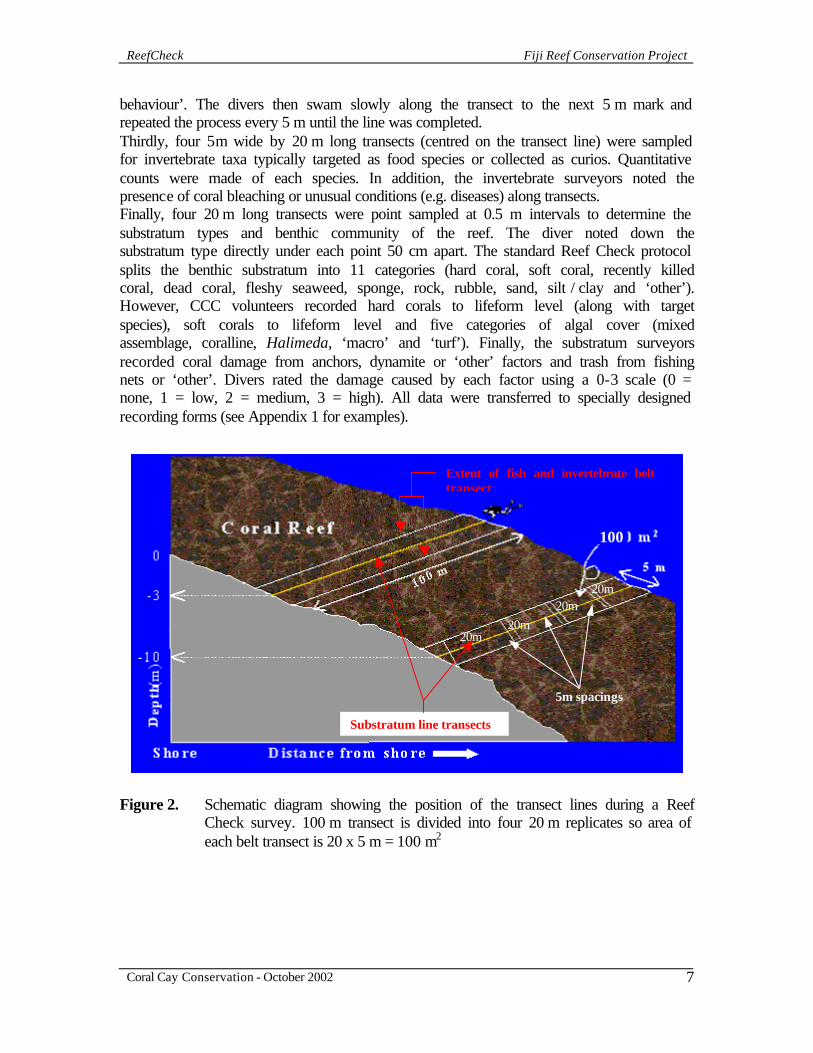
behaviour’. The divers then swam slowly along the transect to the next 5 m mark and repeated the process every 5 m until the line was completed. Thirdly, four 5 m wide by 20 m long transects (centred on the transect line) were sampled for invertebrate taxa typically targeted as food species or collected as curios. Quantitative counts were made of each species. In addition, the invertebrate surveyors noted the presence of coral bleaching or unusual conditions (e.g. diseases) along transects. Finally, four 20 m long transects were point sampled at 0.5 m intervals to determine the substratum types and benthic community of the reef. The diver noted down the substratum type directly under each point 50 cm apart. The standard Reef Check protocol splits the benthic substratum into 11 categories (hard coral, soft coral, recently killed coral, dead coral, fleshy seaweed, sponge, rock, rubble, sand, silt / clay and ‘other’). However, CCC volunteers recorded hard corals to lifeform level (along with target species), soft corals to lifeform level and five categories of algal cover (mixed assemblage, coralline, Halimeda, ‘macro’ and ‘turf’). Finally, the substratum surveyors recorded coral damage from anchors, dynamite or ‘other’ factors and trash from fishing nets or ‘other’. Divers rated the damage caused by each factor using a 0-3 scale (0 = none, 1 = low, 2 = medium, 3 = high). All data were transferred to specially designed recording forms (see Appendix 1 for examples).
Figure 2. Schematic diagram showing the position of the transect lines during a Reef Check survey. 100 m transect is divided into four 20 m replicates so area of each belt transect is 20 x 5 m = 100 m2
Extent of fish and invertebrate belt transect
Substratum line transects
100
20m 20m
20m 20m
5m spacings

ReefCheck Fiji Reef Conservation Project
Coral Cay Conservation - October 2002
8
This report documents the results of reef check surveys, comparing data collected in 2001 and 2002. The particular relevance for the collection of this data was the occurrence of the major bleaching event in 2000. Data presented here gives preliminary information on recovery rates of benthic communities affected by bleaching and the subsequent effects on the community structure. All information will be made available to the global (Reef Check) and national databases, hence increasing the impact of the project. 1.3 Surveys carried out Between the 18th of June and the 12th of July 2002, the Fiji Coral Reef Conservation Project (FCRCP) completed 23 Reef Check surveys. Of these, 22 surveys were carried out at sites visited by the Pilot Phase of the FCRCP which were resurveyed to check on the change in reef health over the year that has passed since the original surveys were carried out. The locations of the Reef Check transects carried out are shown in Figure 3 and Table 1. Note that because of limited reef development below 6m, most of the transects were completed in the ‘shallow’ depth band (3-6m) defined by the standard Reef Check methodology. Deeper transects were generally restricted to platform reefs or the Outer Malolo Barrier Reef where reef development was more extensive. Table 1. Sites revisited in June and July 2002 of the MCRCP. See Figure 2? for the exact location of
each site. Reef complexes: MA = Mana Island; NO = Namotu Group; IM = Inner Malolo Group; OM = Outer Malolo Group; NA = Navini Island.
Site code Site name / General location Reef
complex Depth
(m) RCA 1 Cousteau Rock IM 5 RCA 2 Castaway house reef IM 5 RCA 3 Runners Beach IM 3 RCA 4 Castaway wall IM 4 RHM 1 Mothiu (Honeymoon) Island IM 5 RIB 1 Inner barrier reef (Castaway Cut) OM 3 RIB 2 Outside of inner barrier reef close to Waidigi Island OM 1 RIB 3 Outside of inner barrier reef, south west of Qalito (Castaway) Island OM 3 RMI 1 Wilkes Passage NO 20 RMI 3 Outer barrier reef close to Namotu (Magic) Island NO 6 RMI 4 Outer barrier reef close to Namotu (Magic) Island NO 13.5 RML 1 Malolo Island IM 7 RML 2 Malolo Island IM 4 RML 3 Malololailai IM 6 RNA 1 Nayauu Levu OM 3 RNI 1 Navini Island NA 5 RRA 1 Raviniyake (close to CCC base) IM 3 RRA 2 Raviniyake (close to CCC base) IM 4 RSF 1 Sunflower OM 14 RSF2 Sunflower OM 4
RSM 1 Supermarket MA 8 RWI 1 Waidigi Island IM 6

ReefCheck Fiji Reef Conservation Project
Coral Cay Conservation - October 2002
9
Figure 3. Location of Reef Check sites (red stars) completed during the pilot phase of the MCRCP, and subsequently during the
Fiji Reef Conservation Project in June/July 2002. (Key to codes in Table 1).

Results Fiji Reef Conservation Project
Coral Cay Conservation – August 2002
10
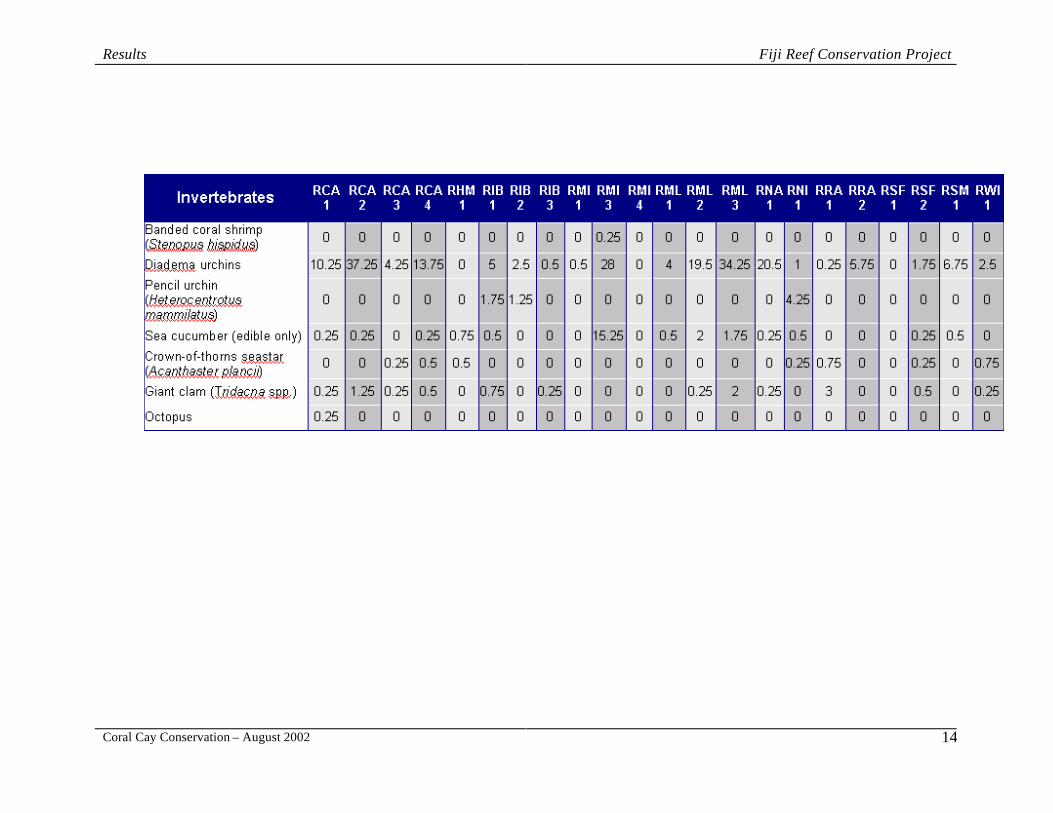
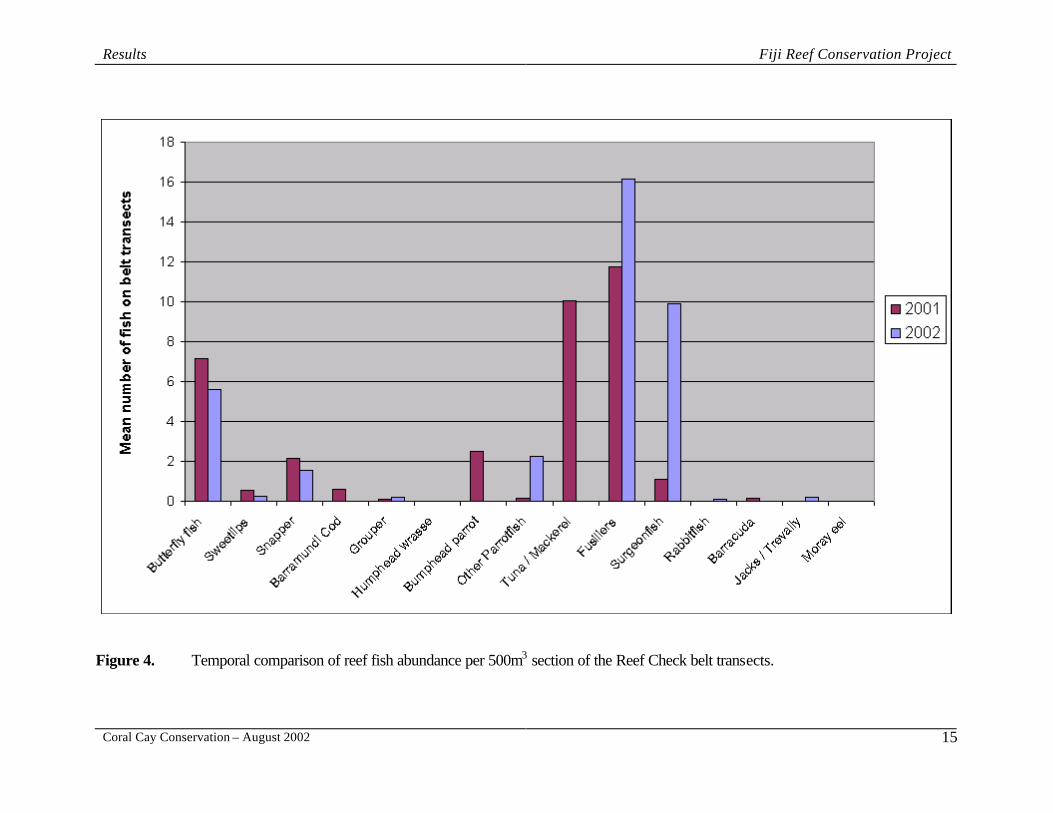
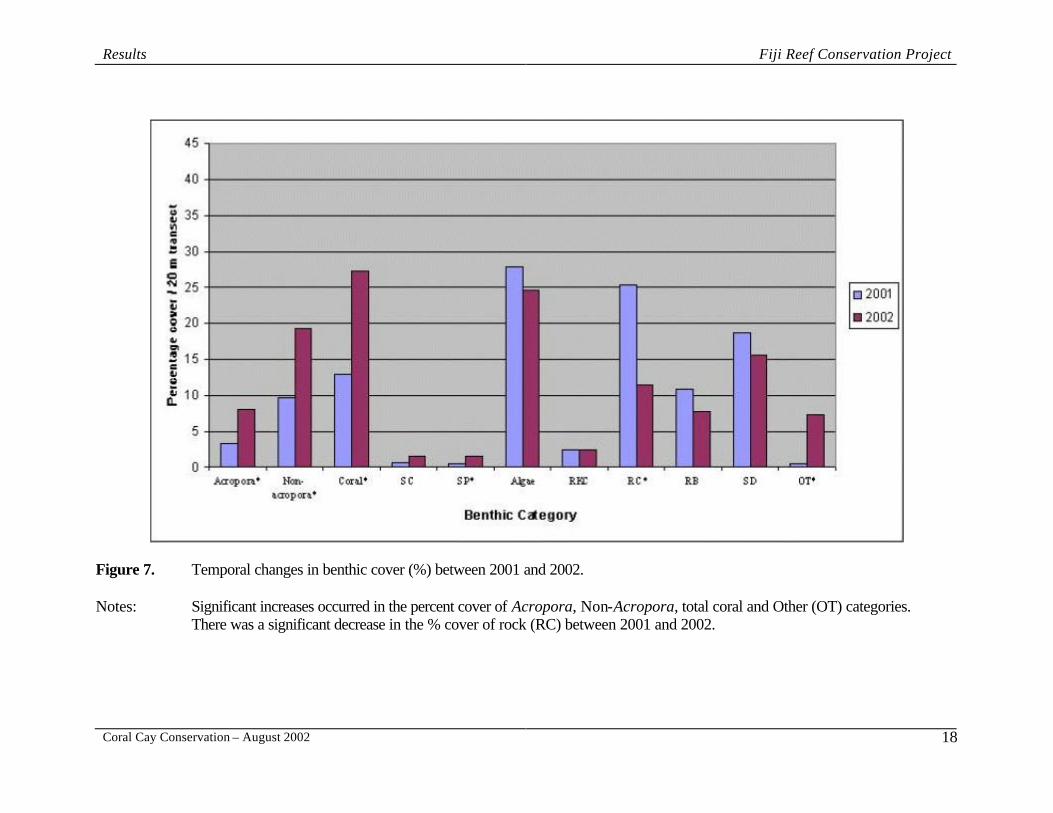
3. RESULTS 3.1 Quantitative assessment between 2001 & 2002 A summary of the parameters recorded along each transect line during the Reef Check surveys in 2002 are shown in Tables 2, 3 and 4. A graphical summary of all sites combined is shown in Figures 4 - 7. An overall increase in coral cover was recorded, from 14 % in 2001 to 27 % in 2002. Figures 6 and 7 show a comparison of the mean benthic cover recorded during 2001 and 2002 surveys. All sites surveyed in 2002 had greater percent cover of non-Acropora corals than Acropora corals (means of 19.86 % and 7.36 % respectively), with the exception of Navini Island. The highest coral cover was recorded on the two Sunflower transects (means of 49.38 % and 51.26 % total cover) which was also found in 2001. The increase in mean total coral cover (non-Acropora and Acropora combined) between 2002 and 2001 suggests that the region has recovered slightly from the bleaching event in 2001. An increase in cover was also shown by both non-Acropora and Acropora corals; non-Acropora increased from 10.7 % in 2001 to 19.9 % in 2002, whilst Acropora cover more than doubled, from 3.0 % in 2001 to 7.4 % in 2002. The 2002 surveys showed a similar amount of algal cover to the 2001 surveys (25 % and 27 % respectively) including mixed assemblage, coralline, Halimeda and Macroalgae. Sponges and soft corals were rarely seen on the transect lines (both had mean coverage of 2 %) and no zooanthids recorded at all. The habitats surveyed in 2002 were very similar to those surveyed in the previous year. The subject of inter-year differences in the habitats surveyed is discussed in the accuracy section later in this report. The most abundant fish seen were fusiliers (Caesionidae) and surgeonfish (Acanthuridae) with mean abundances of 16.1 and 9.9 per 500m3 respectively. Surgeonfish were generally common on each transect but fusiliers, as schooling fish were patchily distributed. Hence this family was recorded as abundant at some locations (mean abundance of 162.5 on the first Sunflower transect) and absent at others. Butterflyfish (Chaetonitidae), ‘other parrotfish’ (Scaridae; not Bumphead) and snappers were the only other taxa with a mean abundance greater than 1 individual in 500m3. Significantly, no humphead wrasse (Cheilinus undulatus), bumphead parrotfish (Bolbometopon muricatum) or barramundi cod (Cromileptes altivelis) were seen on any of the surveys. These are targeted by fishers and aquarium trade collectors (barramundi cod only) and are likely to have been ‘fished out’ in the region. Most of the invertebrate taxa targeted by the Reef Check surveys were rarely seen in either year. However, the number of Diadema urchins decreased significantly between 2001 and 2002 (mean of 9.0 per 100m2 in 2002 compared with 24.9 in 2001). Again, in 2002 these were patchily distributed and ranged from 37.2 per 100m2 at Castaway House reef to none at Magic Island and Sunflower. All other taxa had a mean abundance that was less than 1 individual per 100 m2. The commercially important sea cucumbers and

Results Fiji Reef Conservation Project
Coral Cay Conservation – August 2002
11
clams rarely seen during 2001 surveys were seen even less frequently during 2002. Lobsters and squid were not seen at all during the 2002 surveys, and only a single reef octopus was recorded at Castaway East. A similarly low number of crown-of-thorns sea stars (Acanthaster plancii) were seen during 2002 as compared with 2001 (mean abundance of 0.14 per 100m2 as compared with 0.11 in 2001). However, no triton trumpet shells (Charonia tritonis), a natural predator of the corallivorous COTs were seen. Also, no corallivorous Drupella gastropods were recorded on surveys. 3.2 Accuracy Assessment As no permanent markers of the transects were used, two sources of error are apparent when comparing the 2002 data with that of 2001. GPS points were taken over the start and end points in 2001, and in 2002 when the sites were revisited using these GPS readings. Dive teams were dropped in as close to the original points as possible. However, due to several factors, including adverse weather conditions and currents, this was only possible to within about 10-15 metres in some cases. It would be very difficult to drop divers in on the same point that was used as the start point from the year before unless the start and end points are permanently marked underwater. Similarly, it would be difficult to know exactly how the measuring tape was laid in 2001, and that the bearing of the line may be slightly different without submerged markers. As a result, all transects will have probably been taken along a slightly different line in 2002 to that swam in 2001. In light of these factors it is highly likely that the data collected will be valid for a gross temporal comparison in benthic cover and faunal abundance. Data were collected along the same depth contours at all sites in both years, and trends in increased coral cover existed at over 80 % of the sites visited.

Results Fiji Reef Conservation Project
Coral Cay Conservation – August 2002
12
Table 2. Summary of percentage cover for each parameter per 20 metre section of the Reef Check line transect at each site. See Table 1 for the location of each site. (2002 data).

Results Fiji Reef Conservation Project
Coral Cay Conservation – August 2002
13
Table 3. Summary of abundance of each fish taxa per 500 m3 section of the Reef Check belt transect at each site in 2002. (See Table 1 for the location of each site).
Notes: 1. No Barracuda, Bumphead Parrotfish, Humphead Wrasse, Barramundi Cod or Checkered Snapper were recorded, and
have been omitted for clarity. 2. Twospot Snapper, Black and White Snapper, Flagtail Grouper, Peacock Grouper, Lyretail Grouper, Tuna/Mackerel and Moray Eels have been omitted due to their mean abundance being lower than 0.1
Table 4. Summary of abundance of each invertebrate taxa per 100 m2 section of the Reef Check belt transect at each site during
2002 surveys. See table 1 for the location of each site.. Note; No squid, lobster, triton shells or Drupella were recorded and have been omitted for clarity.
Results Fiji Reef Conservation Project
Coral Cay Conservation – August 2002
14
Results Fiji Reef Conservation Project
Coral Cay Conservation – August 2002
15
Figure 4. Temporal comparison of reef fish abundance per 500m3 section of the Reef Check belt transects.

Results Fiji Reef Conservation Project
Coral Cay Conservation – August 2002
16
Figure 5. Temporal comparison of invertebrate abundance per 100m2 section of the Reef Check belt transect.

Results Fiji Reef Conservation Project
Coral Cay Conservation – August 2002
17
Figure 6. Proportion of different benthic categories from all Reef Check sites for 2001 data (pie chart on top) and 2002 data (lower pie chart).
Results Fiji Reef Conservation Project
Coral Cay Conservation – August 2002
18
Figure 7. Temporal changes in benthic cover (%) between 2001 and 2002. Notes: Significant increases occurred in the percent cover of Acropora, Non-Acropora, total coral and Other (OT) categories.
There was a significant decrease in the % cover of rock (RC) between 2001 and 2002.

Discussion Fiji Reef Conservation Project
Coral Cay Conservation – August 2002
19
4. DISCUSSION The most obvious difference between 2001 and 2002 data sets is the increase in both Acropora and Non-Acropora and therefore, total coral cover at almost all of the study sites. This increase is extremely encouraging. A small factor in this increase may be due to the difference in exact placement of the 2002 transects in relation to those surveyed in 2001. However, the fact that at over 80% of the sites there was an increase in coral cover makes this unlikely to be significant over the whole study area. Therefore, it can be assumed that there has been a significant increase in coral cover for the Mamanucas area between 2001 and 2002. Survey sites spanned the complete range of geomorphological reef types present in the region at widely dispersed localities. The ASEAN system for describing the health of coral reefs (Chou et al., 1984) states that coral reefs with cover less than 25% are described as being in ‘poor’ health, whilst those of cover in excess of 25% are described as ‘fair’. Therefore, the reefs appear to have doubled in live hard coral cover in this area in one year, and increased their ASEAN health rating from poor to fair. Acropora coral, normally known for its susceptibility to bleaching has also recovered significantly with volunteers recording branching Acropora coral cover in areas such as Namotu Island backreef and Sunflower reef (to the south of Malololailai). Acropora corals are designed to recover quickly from breakage, are amongst the fastest growing corals and have high fecundities. This makes them able to recover quickly from population crashes as a result of this life history strategy (r-selected traits) over the slower-growing K-selected species such as Porites lobata, Diploastrea heliopora and some other massive coral species.
Figure 8. Shallow Acropora rich coral reef platforms on the intertidal area of Mana
Island. These corals are exposed as a result of an extreme low tide.
Discussion Fiji Reef Conservation Project
Coral Cay Conservation – August 2002
20
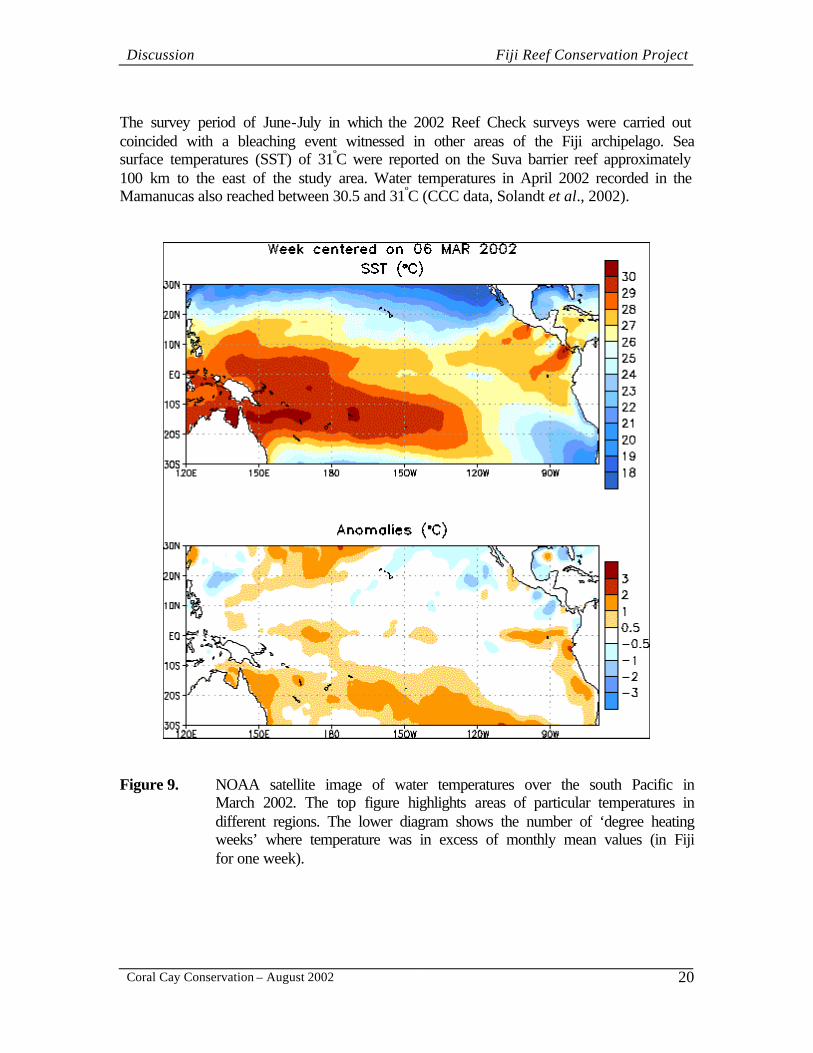
The survey period of June-July in which the 2002 Reef Check surveys were carried out coincided with a bleaching event witnessed in other areas of the Fiji archipelago. Sea surface temperatures (SST) of 31ºC were reported on the Suva barrier reef approximately 100 km to the east of the study area. Water temperatures in April 2002 recorded in the Mamanucas also reached between 30.5 and 31ºC (CCC data, Solandt et al., 2002).
Figure 9. NOAA satellite image of water temperatures over the south Pacific in
March 2002. The top figure highlights areas of particular temperatures in different regions. The lower diagram shows the number of ‘degree heating weeks’ where temperature was in excess of monthly mean values (in Fiji for one week).

Discussion Fiji Reef Conservation Project
Coral Cay Conservation – August 2002
21
30ºC is generally regarded as the watershed point at which corals start to bleach (Brown, 1997). In April 2002, water temperatures around the Mamanucas reached approximately 30-31ºC for approximately one month. This led to some bleaching at a national scale, principally of the genus Acropora corals, but only in shallow waters. Shallow areas (2-4m) in which the CCC Fiji data is derived showed 5 % of coral colonies of the genus Acropora having been bleached. There was also one large area of Acropora coral at 14 m near Sunflower reef where a 15 m2 area was bleached, but only the apical portions of the colony’s branches. Other than this small percent of bleached coral and the deeper bleaching at Sunflower, there appeared to be little overall impact of the bleaching in the Mamanucas for April-May 2002. Bleaching in 2002 was not nearly as significant as the bleaching event that occurred in 2000. Comparison of reef fish and invertebrate data between 2001 and 2002 reveal little significant difference in the motile populations of reef associated fish and invertebrate organisms. This is to be expected over such a short time period. There was a significant decrease in the abundance of tuna and mackerel between the years. However, these tend to be non-reef associated species that have large feeding ranges, and would therefore not be likely to be recorded all the time at one individual reef site. The complete lack of some target fish and invertebrate species (e.g. humphead wrasse, triton shell) suggests that these species have been subject to overfishing. However, further work is required to confirm that this suggestion is not just an artefact of the surveying technique in relation to organism distribution patterns.

Appendices Fiji Reef Conservation Project
Coral Cay Conservation – August 2002
22
6. CONCLUSIONS There was a significant increase in hard coral cover in the Mamanucas over the survey period with values increasing from a mean of 14% to 27% which is more than double the original 2001 cover. This massive increase over such a short time period is reason for optimism, showing recovery of a ‘poor’ reef rating in 2001 (possibly due to mass bleaching and typhoon damage in 2000 (South and Skelton, 2000)) to a ‘fair’ reef rating in July 2002.

Appendices Fiji Reef Conservation Project
Coral Cay Conservation – August 2002
23
7. REFERENCES Brown, B. 1997. Coral bleaching: causes and consequences. Proceedings of the 8th International Coral Reef Symposium 1: 65-74. Chou, L. M. and 9 other authors. 1984. Status of coral reefs in the ASEAN region. p. 1-10. In: Wilkinson, C.R., Suraphol Sudara and Chou, L.M (Eds). Proceedings of the Third ASEAN-Australia Symposium on Living Coastal Resources. Volume 1: Status reviews. Australian Institute of Marine Science. Harborne, A., Solandt, J-L., Afzal, D., Andrews, M. and Raines, P. 2001. Mamanuca Coral Reef Conservation Project – Fiji 2001. Pilot Project Final Report. 124 pp. Report produced by Coral Cay Conservation Ltd. for the Ministry of Tourism and Transport, Government of Fiji. Hodgson, G and Liebeler, J. 2002. The Global Coral Reef Crisis; Trends and Solutions. Reef Check Foundation. 77 pp. Solandt, J-L., Harding, S., Walker, D., Slater, J. and Raines P. 2002. Fiji – Castaway Island Progress Report. Baseline Survey Data March-May 2002. 39 pp. Report produced by Coral Cay Conservation Ltd. for the Ministry of Tourism and Transport, Government of Fiji. South, R and P. Skelton. 2000. Status of coral reefs in the southwest Pacific: Fiji, Nauru, New Caladonia, Samoa, Solomon Islands, Tuvalu and Vanuata. Pages 159-180. In: C. Wilkinson (ed.), Status of coral reefs of the world: 2000. Australian Institute of Marine Science. Spalding, M.D., Ravilious, C. and E.P. Green. 2001. World Atlas of Coral Reefs. Prepared at the UNEP World Conservation Monitoring Centre. University of California Press, Berkely, USA. Vuki, C., L.P. Zann, M. Naqasima and M. Vuki. 2000. The Fiji Islands. Pages 751-764. In: C. Sheppard (Ed.). Seas at the millennium: an environmental evaluation. Elsevier Science.

Appendices Fiji Reef Conservation Project
Coral Cay Conservation – August 2002
24
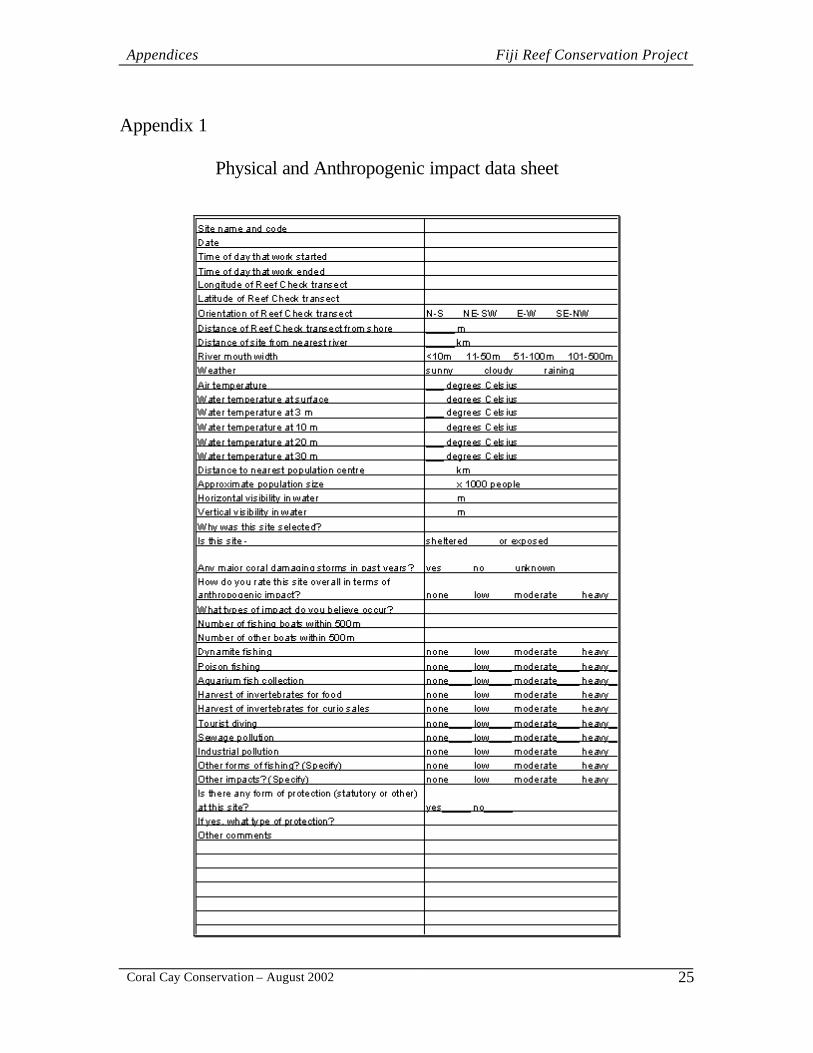
Recording forms used for data collected during Reef Check surveys. Note that these are modified from the standard forms available at http://www.ReefCheck.org/
Appendices Fiji Reef Conservation Project
Coral Cay Conservation – August 2002
25
Appendix 1
Physical and Anthropogenic impact data sheet

Appendices Fiji Reef Conservation Project
Coral Cay Conservation – August 2002
26
APPENDIX 2 Benthic cover data sheet

Appendices Fiji Reef Conservation Project
Coral Cay Conservation – August 2002
27
APPENDIX 3
Target Fish and Invertebrate data sheet