reduction in mortality associated with influenza and pneumococcal vaccination of nursing home...
TRANSCRIPT
Reduction in Mortality Associated with Influenza and Pneumococcal
Vaccination of Nursing Home Residents
Sophia Kazakova1, Dale Bratzler2, Wato Nsa2, Amy Curtis1 Linda McKibben1, Abigail Shefer1, Lynn Steele1,
Chesley Richards1, John Jernigan1
Centers for Disease Control and Prevention1
Oklahoma Foundation of Medical Quality2
Background• In the US 1.6 million residents live in more
than 17,000 long term care facilities (LTCF)
• Incidence of invasive pneumococcal disease 4 times higher among LTCF residents compared to older adults in the community1
• 90% of influenza related deaths in the US occur among the elderly2
1Kupronis et.al. J Am Geriatr Soc 2003;51:1520-1525.
2Thompson et. Al. JAMA 2003;289:179
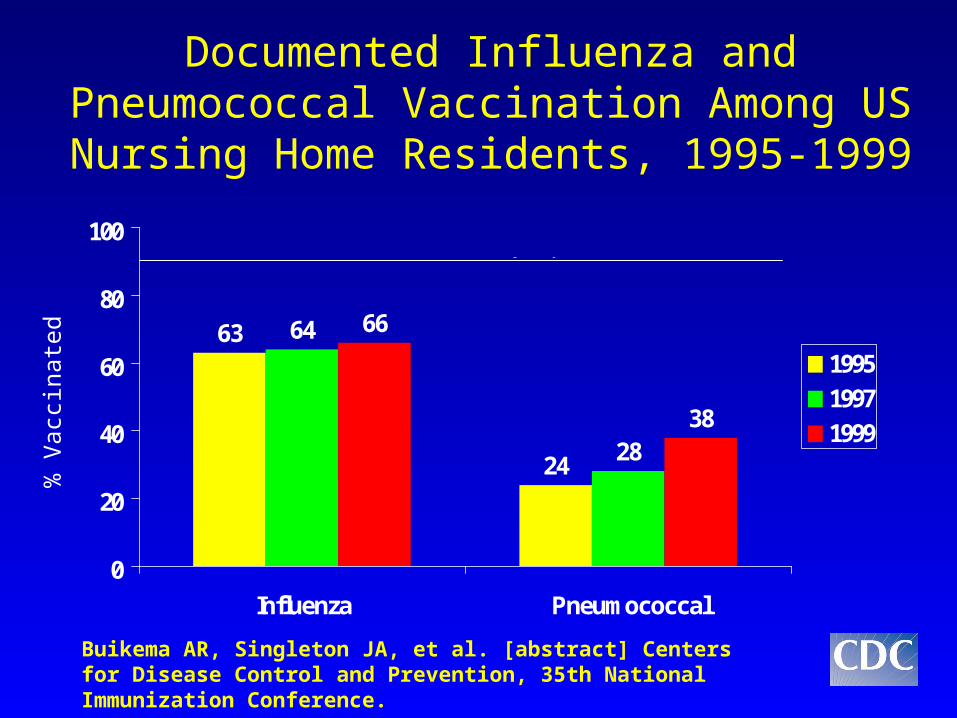
Documented Influenza and Pneumococcal Vaccination Among US Nursing Home Residents, 1995-1999
63
24
64
28
66
38
0
20
40
60
80
100
Influenza Pneumococcal
1995
1997
1999
Healthy People 2010 Goal
Buikema AR, Singleton JA, et al. [abstract] Centers for Disease Control and Prevention, 35th National Immunization Conference.
% V
acci
nate
d

Vaccine Efficacy Among ElderlyVaccine Efficacy Among Elderly
• General and LTCF elderly populations– Influenza1
• Reduces respiratory illness, pneumonia and death
– Pneumococcal vaccine2
• Small sample size• unable to examine facility-level
characteristics
1Gross PA, et al. Ann Int Med 1995;123:518-5272 Jackson LA, et al. N Engl J Med 2003;348:1747-55, 2003
Study Objective
• To examine the impact of individual influenza and pneumococcal vaccination of Nursing Home residents on individual mortality controlling for individual and facility-level characteristics
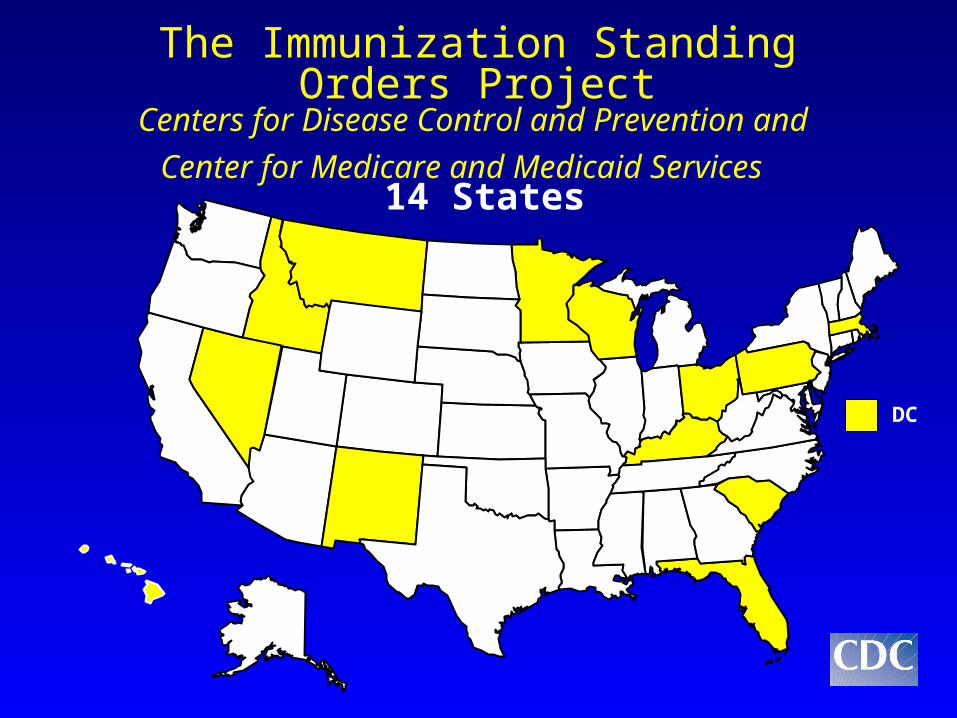
The Immunization Standing Orders ProjectCenters for Disease Control and Prevention and
Center for Medicare and Medicaid Services
DC
14 States

Methods
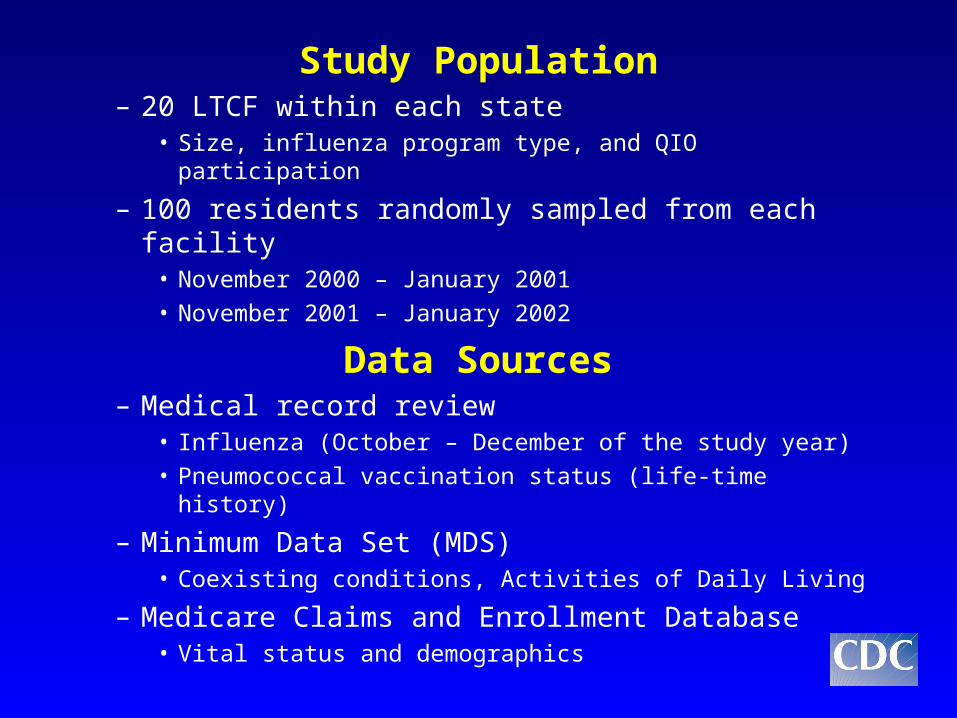
Study Population– 20 LTCF within each state
• Size, influenza program type, and QIO participation
– 100 residents randomly sampled from each facility • November 2000 – January 2001• November 2001 – January 2002
Data Sources– Medical record review
• Influenza (October – December of the study year)• Pneumococcal vaccination status (life-time history)
– Minimum Data Set (MDS)• Coexisting conditions, Activities of Daily Living
– Medicare Claims and Enrollment Database • Vital status and demographics
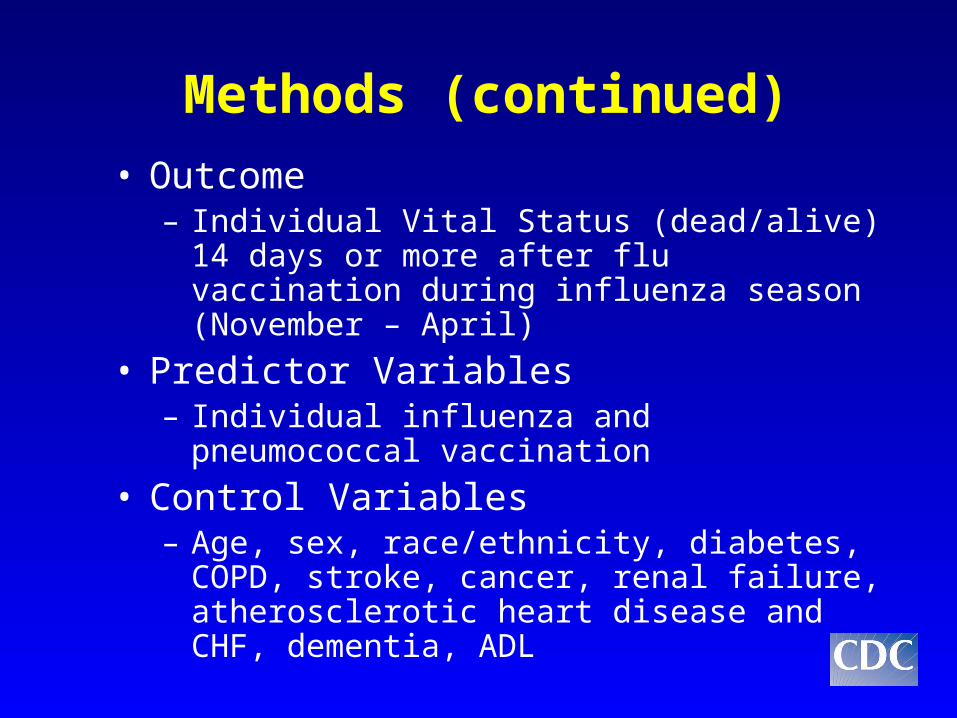
Methods (continued)• Outcome
– Individual Vital Status (dead/alive) 14 days or more after flu vaccination during influenza season (November – April)
• Predictor Variables– Individual influenza and pneumococcal
vaccination
• Control Variables– Age, sex, race/ethnicity, diabetes, COPD, stroke,
cancer, renal failure, atherosclerotic heart disease and CHF, dementia, ADL
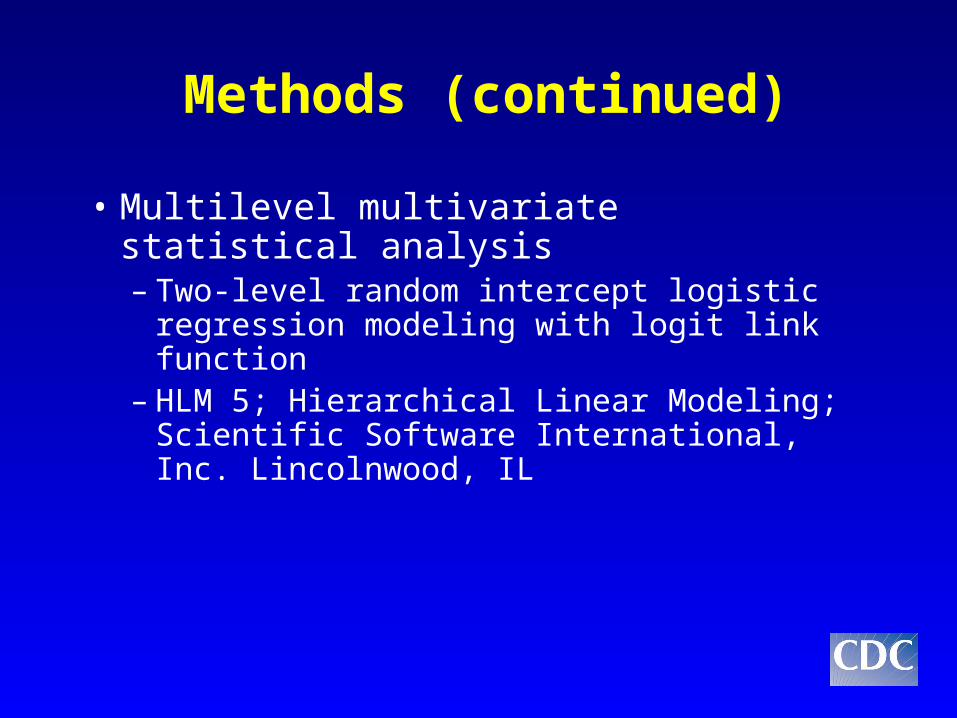
Methods (continued)
• Multilevel multivariate statistical analysis– Two-level random intercept logistic
regression modeling with logit link function – HLM 5; Hierarchical Linear Modeling;
Scientific Software International, Inc. Lincolnwood, IL
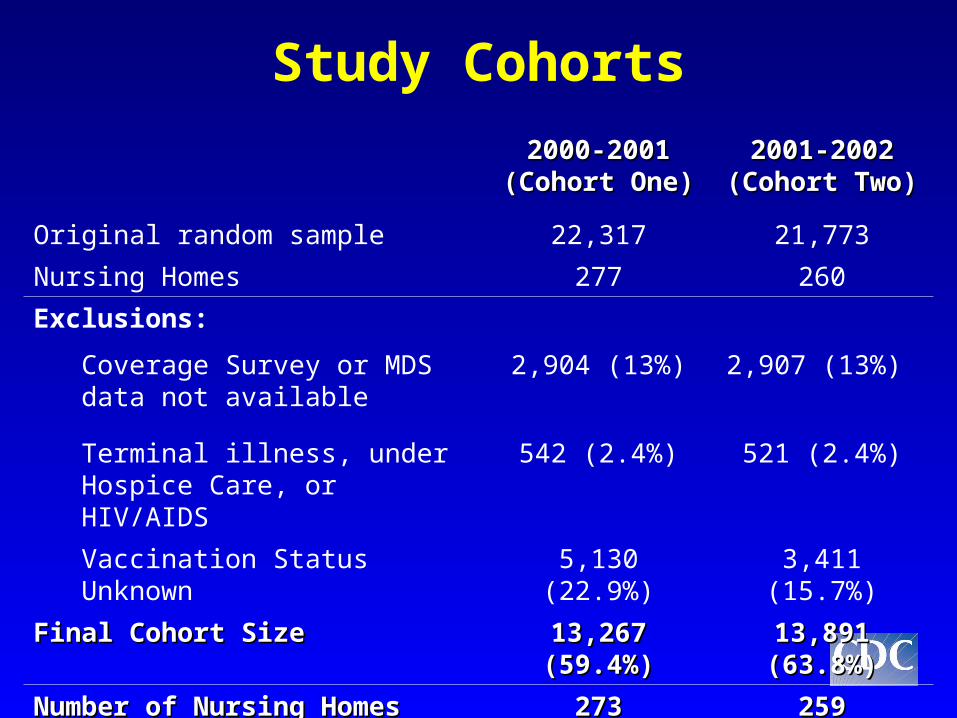
2000-2001 2000-2001 (Cohort One)(Cohort One)
2001-2002 2001-2002 (Cohort Two)(Cohort Two)
Original random sample 22,317 21,773
Nursing Homes 277 260
Exclusions:
Coverage Survey or MDS data not available
2,904 (13%) 2,907 (13%)
Terminal illness, under Hospice Care, or HIV/AIDS
542 (2.4%) 521 (2.4%)
Vaccination Status Unknown 5,130 (22.9%) 3,411 (15.7%)
Final Cohort Size Final Cohort Size 13,267 (59.4%)13,267 (59.4%) 13,891 (63.8%)13,891 (63.8%)
Number of Nursing HomesNumber of Nursing Homes 273273 259259
Study Cohorts

Results
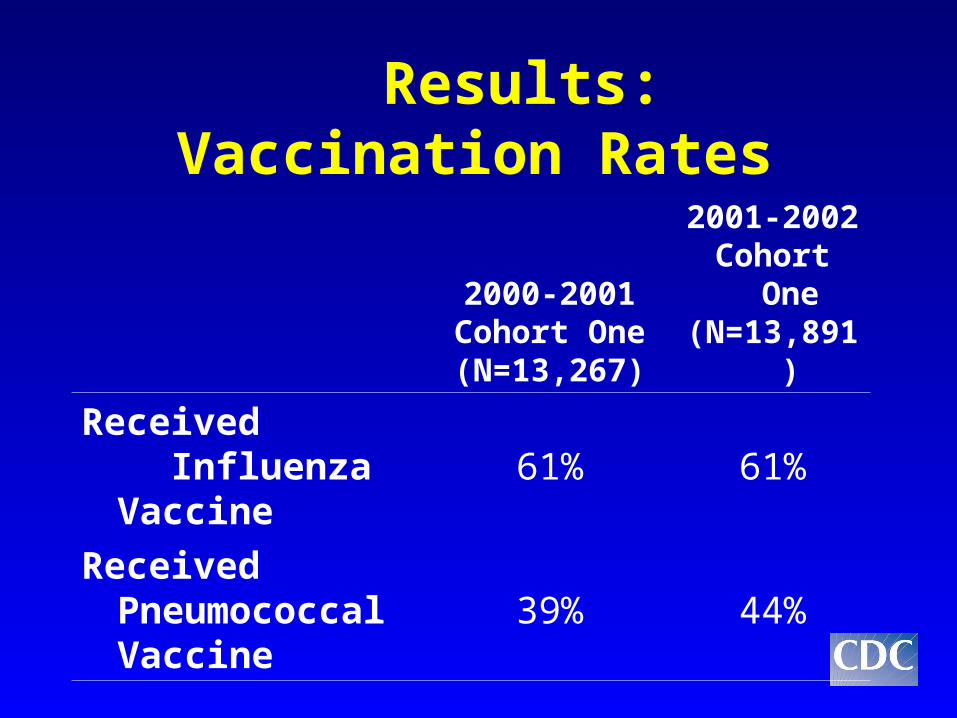
Results: Vaccination Rates
2000-2001Cohort One(N=13,267)
2001-2002Cohort One(N=13,891)
Received Influenza
Vaccine61% 61%
Received Pneumococcal Vaccine
39% 44%
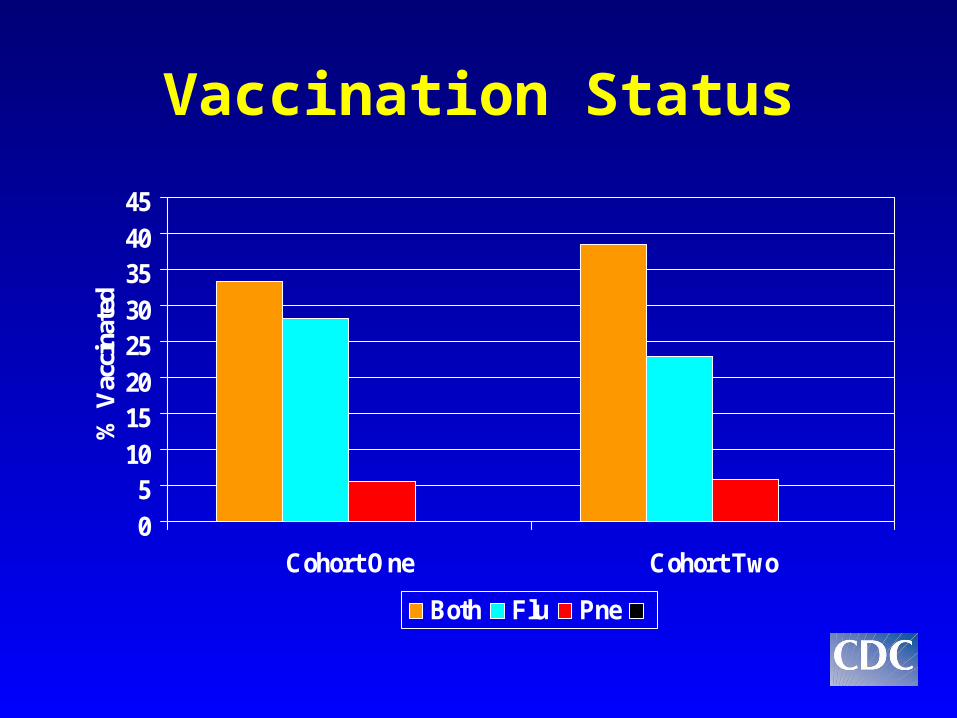
Vaccination Status
05
1015202530354045
Cohort One Cohort Two
% V
acci
nate
d
Both Flu Pne
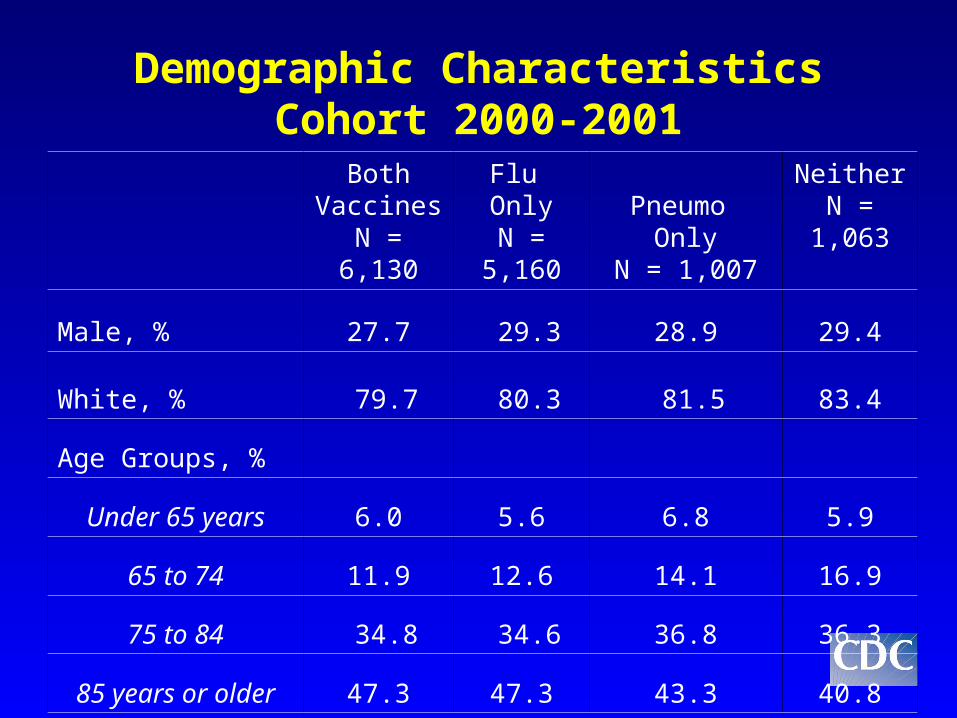
Demographic Characteristics Cohort 2000-2001
Both VaccinesN = 6,130
Flu OnlyN =
5,160
Pneumo Only
N = 1,007
NeitherN = 1,063
Male, % 27.7 29.3 28.9 29.4
White, % 79.7 80.3 81.5 83.4
Age Groups, %
Under 65 years 6.0 5.6 6.8 5.9
65 to 74 11.9 12.6 14.1 16.9
75 to 84 34.8 34.6 36.8 36.3
85 years or older 47.3 47.3 43.3 40.8
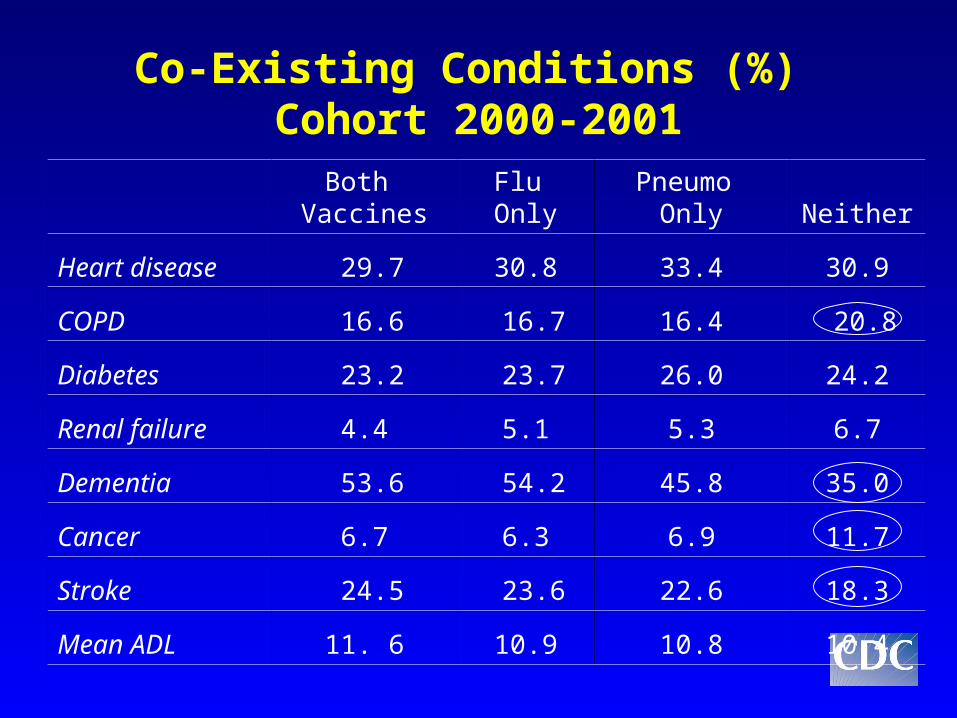
Co-Existing Conditions (%) Cohort 2000-2001 Both
VaccinesFlu Only
Pneumo Only Neither
Heart disease 29.7 30.8 33.4 30.9
COPD 16.6 16.7 16.4 20.8
Diabetes 23.2 23.7 26.0 24.2
Renal failure 4.4 5.1 5.3 6.7
Dementia 53.6 54.2 45.8 35.0
Cancer 6.7 6.3 6.9 11.7
Stroke 24.5 23.6 22.6 18.3
Mean ADL 11. 6 10.9 10.8 10.4
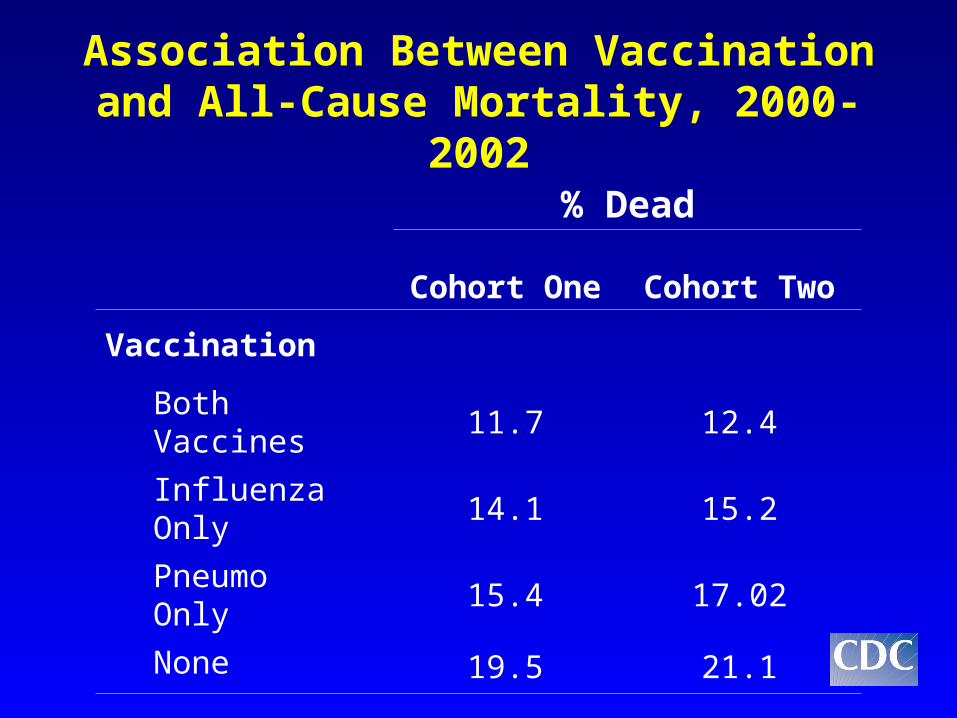
% Dead
Cohort One Cohort Two
Vaccination
Both Vaccines 11.7 12.4
Influenza Only 14.1 15.2
Pneumo Only
15.4 17.02
None 19.5 21.1
Association Between Vaccination and All-Cause Mortality, 2000-2002
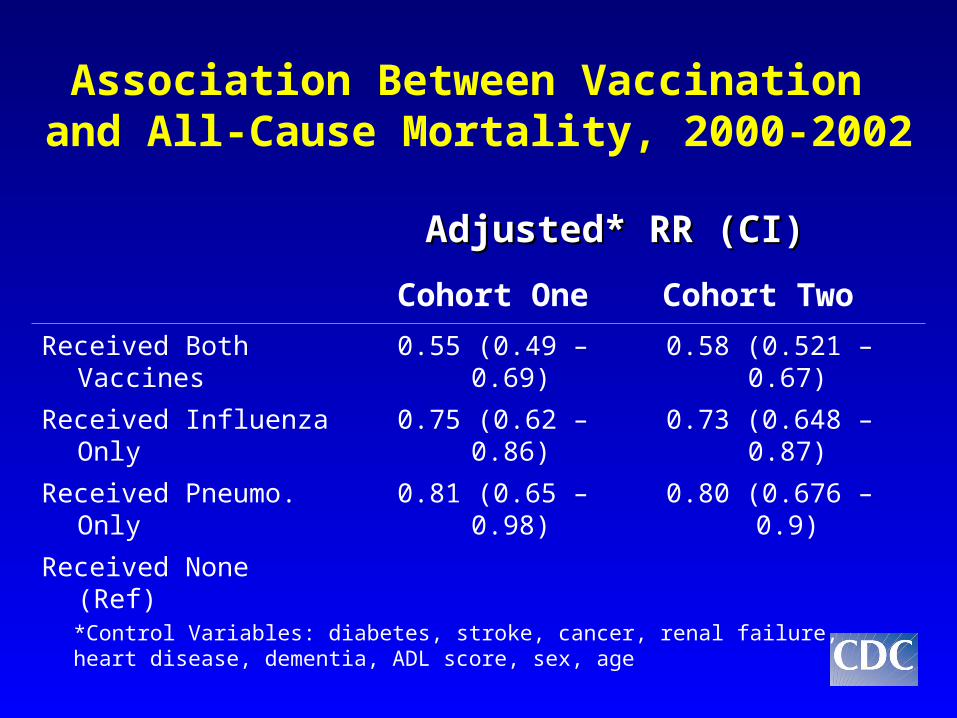
Association Between Vaccination and All-Cause Mortality, 2000-2002
*Control Variables: diabetes, stroke, cancer, renal failure, heart disease, dementia, ADL score, sex, age
Adjusted* RR (CI)Adjusted* RR (CI)
Cohort One Cohort Two
Received Both Vaccines 0.55 (0.49 – 0.69) 0.58 (0.521 – 0.67)
Received Influenza Only 0.75 (0.62 – 0.86) 0.73 (0.648 – 0.87)
Received Pneumo. Only 0.81 (0.65 – 0.98) 0.80 (0.676 – 0.9)
Received None (Ref)
Facility-Level Vaccination Coverage
• In initial analysis, without exclusion of residents with unknown vaccination status– >80% coverage with influenza
significantly and independently associated with decreased risk of mortality
• After exclusion, this association became insignificant
Summary
• The first prospective study of Nursing Home residents to demonstrate a significant protective effect of pneumococcal vaccination on mortality.
• Confirmed the important role of influenza vaccination in preventing the adverse outcome.

Limitations
• Facility selection non-randomized
• Vaccination status non-randomized
• Possibility of exclusion bias
• Possibility of misclassification bias in ascertaining vaccination status
• Possibility of unmeasured confounders
Health Policy Implications• Unvaccinated residents are at increased risk for
adverse outcomes
• Failure to vaccinate residents of long term care facilities is a patient safety issue
• Wider implementation of standing orders programs or other effective interventions to increase vaccination rates
• A better understanding of the barriers to vaccination in this setting is needed
• Poor documentation of vaccination status in NHs
Acknowledgments
• CDC– Jeremy Miller
• Oklahoma Foundation For Medical Quality– Jennifer O’Hagan
• CMS– Jackie Harley– Kathy Pirotte– Peter Houck
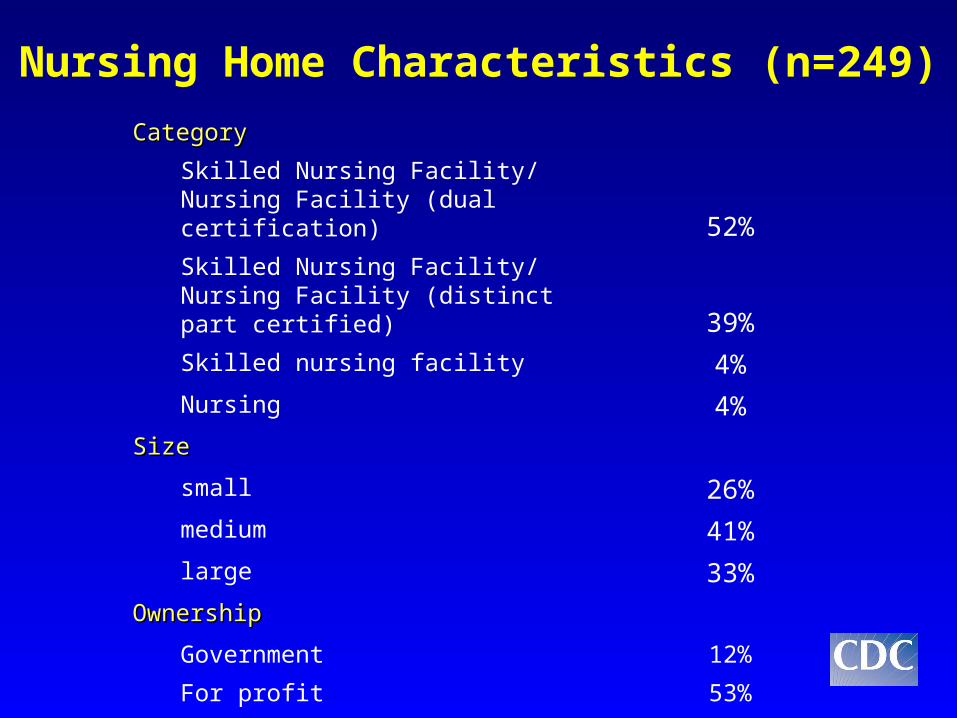
CategoryCategory
Skilled Nursing Facility/Nursing Facility (dual certification) 52%
Skilled Nursing Facility/Nursing Facility (distinct part certified) 39%
Skilled nursing facility 4%
Nursing 4%
SizeSize
small 26%
medium 41%
large 33%
OwnershipOwnership
Government 12%
For profit 53%
Non-profit 34%
Nursing Home Characteristics (n=249)
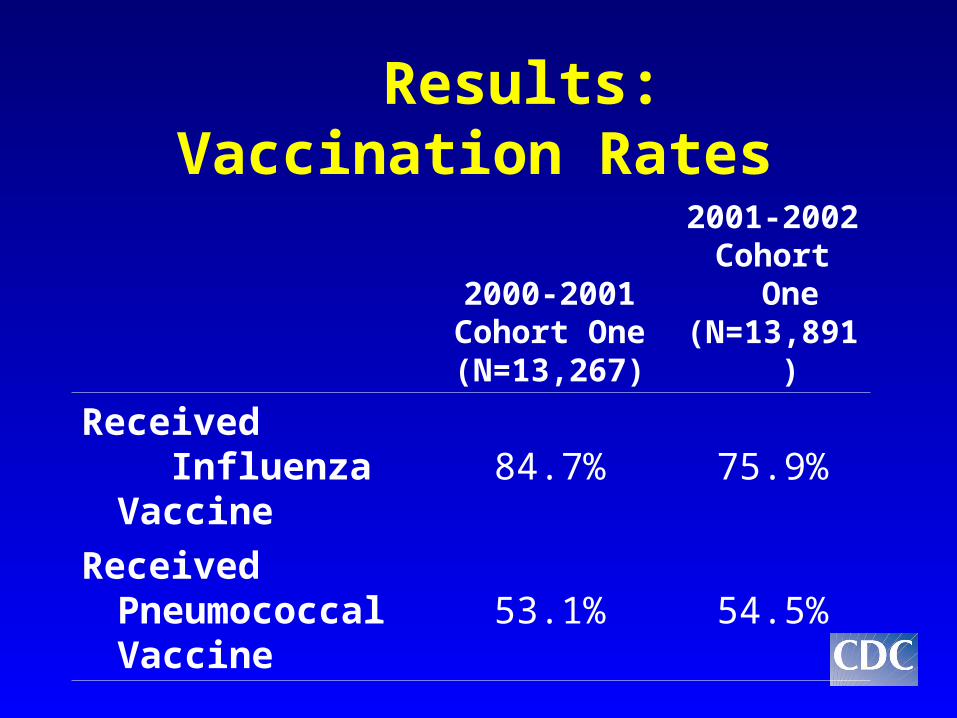
Results: Vaccination Rates
2000-2001Cohort One(N=13,267)
2001-2002Cohort One(N=13,891)
Received Influenza
Vaccine84.7% 75.9%
Received Pneumococcal Vaccine
53.1% 54.5%