reducing turnover time to improve efficiency in the
TRANSCRIPT
The University of San FranciscoUSF Scholarship: a digital repository @ Gleeson Library |Geschke Center
Master's Projects and Capstones Theses, Dissertations, Capstones and Projects
Fall 12-15-2017
Reducing Turnover Time to Improve Efficiency inthe Operating RoomMyrna [email protected]
Follow this and additional works at: https://repository.usfca.edu/capstone
Part of the Perioperative, Operating Room and Surgical Nursing Commons
This Project/Capstone is brought to you for free and open access by the Theses, Dissertations, Capstones and Projects at USF Scholarship: a digitalrepository @ Gleeson Library | Geschke Center. It has been accepted for inclusion in Master's Projects and Capstones by an authorized administratorof USF Scholarship: a digital repository @ Gleeson Library | Geschke Center. For more information, please contact [email protected].
Recommended CitationJafari, Myrna, "Reducing Turnover Time to Improve Efficiency in the Operating Room" (2017). Master's Projects and Capstones. 661.https://repository.usfca.edu/capstone/661
Running Head: REDUCING TURNOVER TIME 1
Reducing Turnover Time to Improve Efficiency in the Operating Room
Myrna N. Jafari
University of San Francisco
REDUCING TURNOVER TIME 2
Abstract
The purpose of this project is to improve efficiency by reducing turnover time in the operating
room (OR) that can consequently enhance patients’ and physicians’ satisfaction, promote
teamwork, and decrease the cost of operating room delays. The increasing trend of turnover time
(TOT) requires attention for microsystem improvement in the OR of Santa Rosa Memorial
Hospital. The intervention to improve efficiency is to educate the OR team members on roles and
responsibilities to establish a standard workflow which can promote accountability and
teamwork during the turnover process. Havelock’s theory of change is used as a framework for
the action plan to cultivate synergy and team engagement. Fishbone diagram, process mapping,
and strength, weakness, opportunities, threats (SWOT) analysis were used as quality
improvement tools to identify causes of delays and to guide the improvement process. Based on
the data collected from the pilot test using the plan, do, study, act (PDSA) cycle, the post-
intervention average TOT was reduced to 29 minutes compared to 37 minutes at pre-intervention
phase. There is a positive response from the pilot team on the standardized workflow as reflected
by the post-intervention survey. The clinical nurse leader student as the team manager has
influenced the implementation of this project by providing the support and leadership needed in
engaging and promoting the change in the microsystem.
Keywords: improve efficiency, turnover time, operating room, teamwork, workflow, and
clinical nurse leader.

REDUCING TURNOVER TIME 3
Clinical Leadership Theme
The Clinical Nurse Leader (CNL) is empowered with a skill set for clinical leadership
and serves as an advocate for the patient, healthcare team, and profession, while practicing at the
point of care and focused on quality, evidence-based and cost-effective care to ensure patient
safety and to improve health care outcomes (ACCN, 2007). The CNL provides a thorough
assessment of the microsystem using the 5 P’s framework of purpose, patients, professionals,
processes, and patterns before embarking on a quality improvement project (Harris, Roussel,
Thomas, 2014).
The project to reduce turnover time (TOT) towards improving efficiency in the operating
room (OR) focuses on the CNL role as a Team Manager. The team manager serves as a leader in
the interdisciplinary health care team to identify clinical and cost outcomes that improve safety,
effectiveness, timeliness, efficiency, and quality patient-centered care (AACN, 2013). The CNL
as a team manager, can provide support to the issues of turnover process related to procedural
flow in the OR with focus on outcomes and variances affecting delays in turnover times
(Wesolowski, Casey, Berry & Gannon, 2014). The CNL can properly delegate tasks and
promote team collaboration, anticipate and mitigate barriers, as well as evaluate outcomes
(ACCN, 2007).
The global aim of this project is to improve efficiency during a turnover process that
involves well-defined roles and responsibilities for the OR staff to establish a standardized
workflow and to ensure accountability of work (see Appendix A). Educating the team members
on their roles and responsibilities will set clear expectations and promote teamwork that can
influence efficiency and timeliness of scheduled surgical procedures. The CNL uses appropriate

REDUCING TURNOVER TIME 4
teaching principles, strategies and current information to prepare OR staff with the change and
improvement process (ACCN, 2007).
Statement of the Problem
Based on the microsystem assessment in the OR of Santa Rosa Memorial Hospital
(SRMH), TOT is a process that requires improvement. According to the Association of
Anesthesia Clinical Directors (AACD), turnover time, also known as turnaround time (TAT), is
defined as the time when the patient leaves the OR to the time the next patient arrives in the OR
for the sequentially scheduled procedure. TOT is typically described as “wheels out to wheels
in” (Vassell, 2016). The following activities are included in TOT: Cleaning the room, gathering
equipment and opening sterile supplies for the next procedure, and physically transporting the
patient from the preoperative area to the OR (Burlingame, 2014).
The microsystem’s trend of increasing turnover time became evident in 2015 with an
average TOT of 30 minutes, increase to 35 minutes in 2016 and the first quarter of 2017, and
plateau to 37 minutes during the second quarter of 2017 as compared to the average TOT of 29
minutes in 2014 (see Appendix B1). The average daily turnover time is calculated in the
computer system based on the elapsed time in between cases excluding all times beyond 60
minutes which falls in the delay category. Based on the analysis of the OR Benchmarks
Collaborative (ORBC) from both hospital and ambulatory settings of 134 US facilities and 107
Canadian facilities, the national benchmark median average turnover time is 28.5 minutes
(“Data”, 2012). Benchmarking allows organizations to compare performance with the use of
data that drives awareness and focus on improvement (Finkelman, 2016). The TOT of the
microsystem keeps trending longer and it falls short of the national benchmark average by 8.5
REDUCING TURNOVER TIME 5
minutes. Every minute that is wasted correlates to financial loss and longer waiting time for
patients and physicians.
Project Overview
The theme for this project is to improve efficiency by reducing turnover time while
maintaining patient safety, enhancing patient and physician satisfaction, promoting teamwork,
and creating an opportunity to reduce cost of delays in the operating room. The goal is to
educate the team members on roles and responsibilities to establish a standardized workflow
during the turnover process.
According to Norman and Bidanda (2014), teamwork inefficiencies and variations
impact TOT with teams that work and complete tasks effectively while other members of the
team would simply take a break and disappear during the turnover process. By educating the
team members of their roles and responsibilities, it is expected to establish a standard workflow
to set clear expectations and to ensure accountability, thereby promoting teamwork and
efficiency. In implementing this project, it is important to recognize that achieving a rapid room
turnover involves following the protocols of patient safety. Amid the efforts to improve
efficiency and contain cost, it is essential for the members of the team to understand that patient
safety is the main priority (Vassell, 2016).
The turnover process starts when the patient is wheeled out of the OR, which initiates the
cleaning phase, followed by the setting-up phase which involves bringing in equipment, case
carts, instrument trays, and opening of sterile supplies for the succeeding procedure. The process
ends with wheeling the next patient to the OR. The turnover team includes the registered nurse
(RN), scrub technician (ST), patient care technician (PCT), equipment technician (EQ), and
anesthesia technician (AT). The multiple activities during the turnover process need to be
REDUCING TURNOVER TIME 6
coordinated to establish an efficient workflow, which can be accomplished by providing
education on standardized roles and responsibilities to the turnover team.
The specific aim of this project is to reduce the average TOT from the current baseline of
37 minutes to 30 minutes by November 2017, to improve efficiency, thereby increasing
satisfaction from the patients and physicians, enhancing staff teamwork, and fostering cost-
effectiveness for the microsystem (see Appendix B2).
Rationale
Turnover time (TOT) is an efficiency indicator in the OR that requires attention for
improvement as reflected by the increasing trend of TOT from 2015 to the second quarter of
2017. It is important to work on this process because of the need to improve satisfaction from
the patients and physicians as well as to decrease costs by potentially eliminating the occurrence
of on-call staff staying over their work shifts to finish delayed cases. The Consumer Assessment
of Healthcare Providers and Systems (CAHPS) is a program funded and administered through
the Agency for Healthcare Research and Quality (AHRQ) that develops patient surveys to assess
patient experience and health care (Finkelman, 2016). The 2017 CAHPS overall rating of
SRMH is 70% (Health Grades, 2017). Reduced TOT will decrease delays and wait times for
patients and physicians, thus creating an opportunity to promote favorable experiences and
outcomes which can positively influence the CAHPS rating. Reduced TOT equates to OR time
efficiency, which translates to potential savings and financial gain. It also fulfills the goal to
provide efficient and excellent service to patients and physicians by a team who takes pride in
their work and who understands that while cost containment is important, patient safety and
satisfaction is a priority. The Association of periOperative Registered Nurses (AORN)
REDUCING TURNOVER TIME 7
recommended practice (RP) includes provision of a clean and safe environment for patients
which requires a multidisciplinary team working together (Allen, 2014).
The stakeholders of this improvement project include the patients, physicians, staff (RN,
ST, PCT, AT, EQ), CNL student, and leadership team of the OR director, managers, and
educator. The patients and physicians are the customers in the OR, therefore meeting their needs
revolve around providing excellent customer service. If not limited by insurance coverage, the
patients and physicians have a choice where to schedule surgical procedures which makes them
customers in the OR (Taylor, 2014). The staff who are the focus of the intervention need to be
engaged with the process change. Their attitudes and participation greatly influence the success
of the project. The leadership team provides financial, administrative, and managerial support
that can impact the implementation of the project. The CNL student is the project owner who is
responsible in planning, analyzing data, implementing, and sustaining the change.
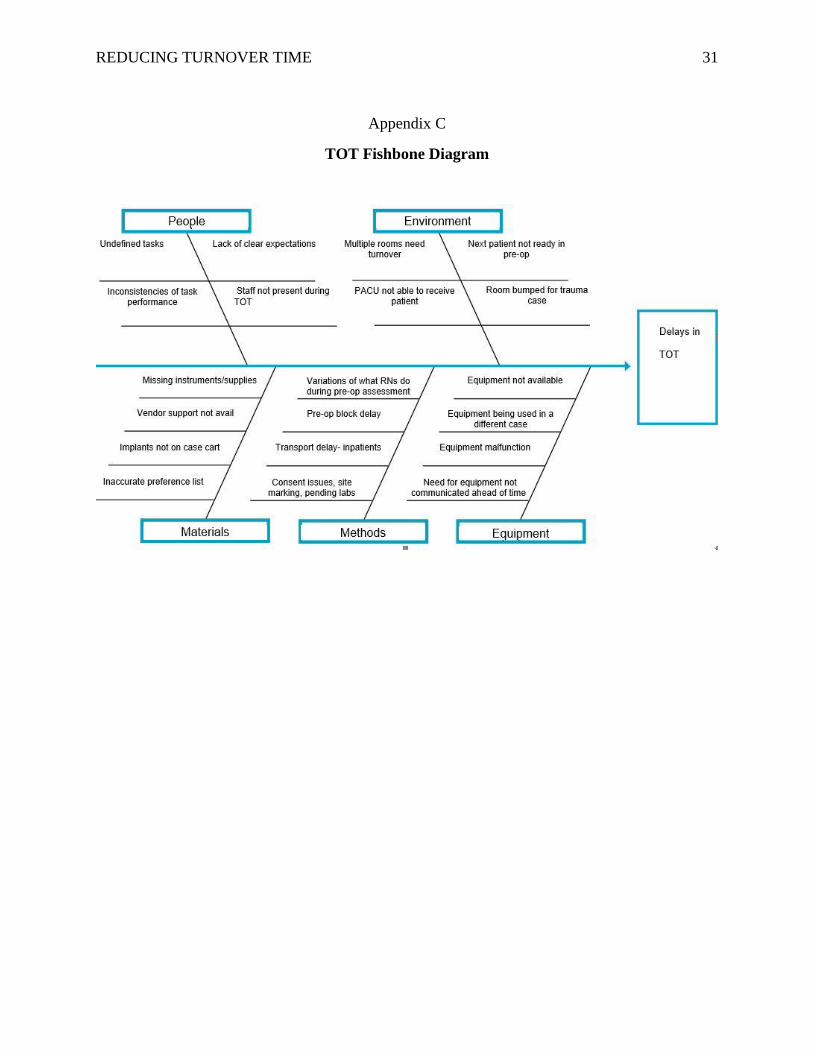
The fishbone diagram shows what influences turnover time and provides a visual
representation of the various opportunities to improve during the turnover process. The fishbone
diagram is an important graphic tool used to identify and clarify the causes, and to guide a
process improvement (Nelson, Batalden, & Godfrey, 2007). The categories of the fishbone
diagram that influences TOT include people/staff, environment, materials, methods, and
equipment/supplies (see Appendix C). Several factors that can alter TOT include the time
required to (a) transfer care of previous patient; (b) clean equipment and surfaces in the OR; (c)
remove all the instruments and equipment that will not be used for the next procedure; (d) gather
the instruments and equipment needed for the next procedure; (e) open sterile supplies for the
next procedure; and (f) get the next patient ready in the preoperative area, as identified by
Burlingame (2014). Based on the views of staff members, inconsistency and lack of clear
REDUCING TURNOVER TIME 8
expectations on roles and responsibilities during the turnover process is the primary issue making
the turnover time longer, hence the education intervention was chosen to be implemented.
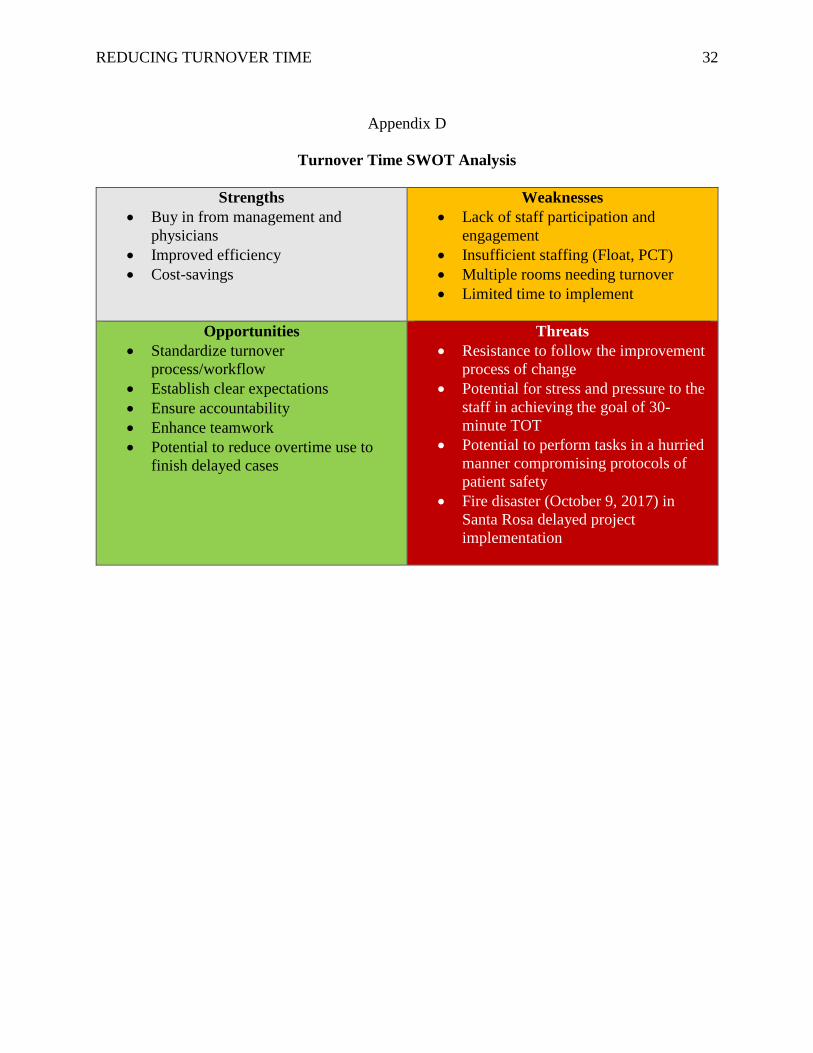
To identify the aspects that may affect this project negatively or positively, the need to
accomplish an assessment of the strengths, weaknesses, opportunities and threats (SWOT) is
vital for successful planning and implementation (King & Gerard, 2016). The strength of the
improvement project includes the increased satisfaction from patients and physicians, improved
efficiency, and the potential to decrease costs by avoiding schedule delays. Lack of participation
from the staff, insufficient staffing, and multiple rooms needing simultaneous turnover can pose
challenges, thus weakening the process change. The fire disaster on October 9, 2017 in Sonoma
county caused three weeks of implementation delay resulting to limited time in standardizing and
observing the sustainable outcome. The project can bring opportunities to establish a standard
workflow, setting clear expectations, promoting teamwork and accountability, and offers the
potential to reduce the occurrence of the staff staying over work shifts to finish cases running
past the scheduled time. Threats to successful implementation can emerge from resistance to
follow the improvement process, stress and pressure from the 30-minute TOT expectation, and
the potential to compromise protocols of patient safety if tasks are performed in hurried manner
to meet the target TOT (see Appendix D).
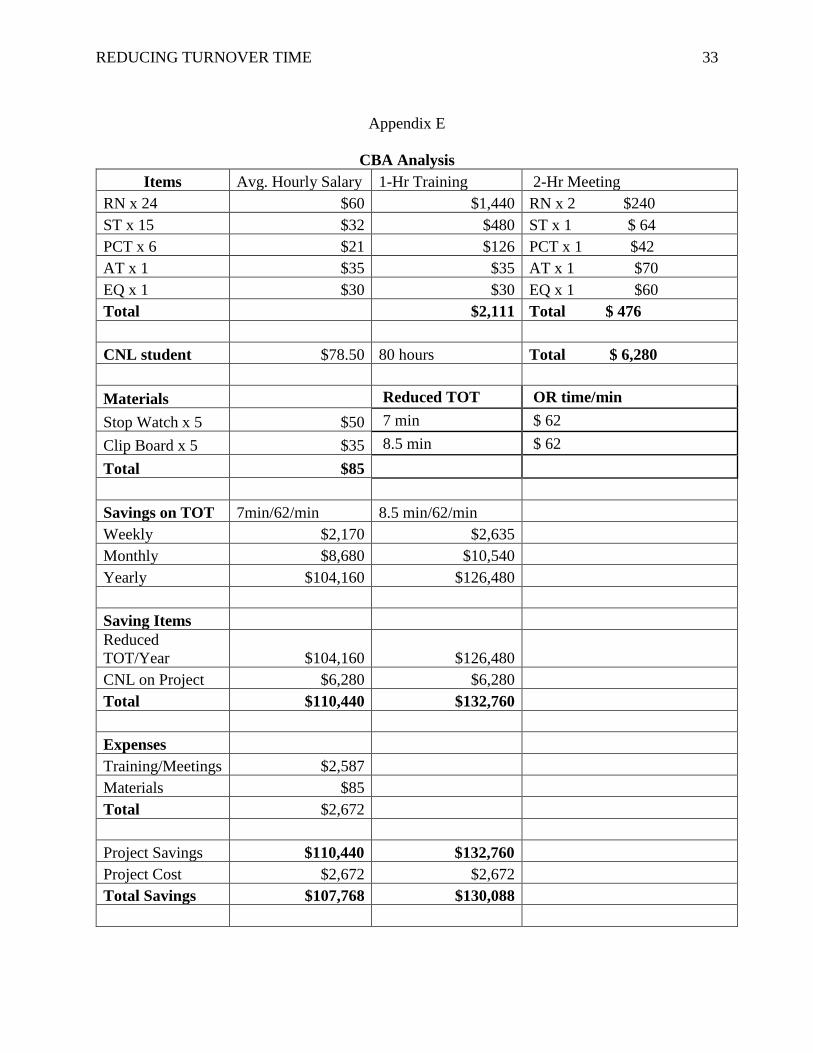
The direct cost of the project to reduce TOT is about $2,672 which includes 1-hour
training of staff, 2-hour meeting of stakeholders, and materials needed to track or collect data
(see Appendix E). Based on clinical studies of US hospitals, the average cost per minute of
operating room time was $62 (Surgical Devices, 2016), therefore if the TOT is reduced by 7
minutes, it has the potential yearly savings of $104,160 (see appendix F). If the average TOT
benchmark is met with an 8.5 minutes TOT reduction, the potential yearly savings is $126,480.
REDUCING TURNOVER TIME 9
Moreover, reduced TOT will decrease delays correlating to less frequent occurrences of on-call
staff staying over their work shifts to finish cases that have gone past the scheduled time. The
savings on reduction of delay in the OR and overtime can be tracked as a productivity measure
or dark green dollars. Light green dollars represent theoretical or potential savings while dark
green dollars can be tracked in budgets, and other financial reports (Penner, 2017).
Methodology
The focus of this project is to educate the staff members on roles and responsibilities
during the turnover process. Having well-defined roles and responsibilities for the OR staff
ensures that each member knows which steps they are accountable for (Norman & Bidanda,
2014). Creating a meaningful change requires leadership from the CNL student in
implementation of the evidence-based intervention. The CNL student can help implement the
change by recognizing, along with the staff, the need to reduce turnover time by showing current
baseline data and comparing it with benchmark data available.
Havelock’s theory of change will be used as a framework for the action plan. Using a
change theory is necessary in quality improvement projects to provide the framework for
implementing, managing, and evaluating the change (Mitchell, 2013). Havelock’s theory of
change comprises six simple steps (a) establishing a relationship with the members of team; (b)
identifying the problem that needs change; (c) investigating, gathering information and
researching literature; (d) choosing the interventions to create the planned change; (e) accepting
and adapting the chosen intervention; and (f) sustaining the change and preventing relapse to old
practice, as illustrated by Lane (1992). Teamwork needs to be developed to support each other’s
role and to foster process improvement and long-term success.
REDUCING TURNOVER TIME 10
Following the framework of Havelock’s theory of change, a positive relationship needs
to be established by empowering and encouraging the staff to own the change through
involvement and representation of every shift and role category. Engaging the team members
can promote understanding of the initiative and garner support for the improvement process.
The staff in the OR were randomly surveyed through informal discussions regarding their
encountered challenges during turnover time. The theme that emerged from the informal survey
was the lack of clear expectations for each member during the turnover process.
A turnover task force team was formed composed of the CNL student, business manager
of the unit, 2 physicians, RN, ST, PCT, EQ, and AT. A scheduled one-hour meeting on October
2, 2017 was held to discuss the goals and plans of the project. One of the elements of quality
improvement is team involvement inclusive of representatives that implement current work
processes and those who will implement the workflow change (Harris et al, 2018). Due to the
enormity of the work that needed to be accomplished and the detail oriented nature of the
project, the task force team decided to have a follow-up meeting on October 9, 2017. It was
planned to be a continuation of a deep dive process for in-depth brainstorming on the
intervention (Finkelman, 2016). However, due to the circumstances of evacuation, loss,
devastation, and uncertainty brought about the fire disaster, the second task force team meeting
did not happen until November 13, 2017.
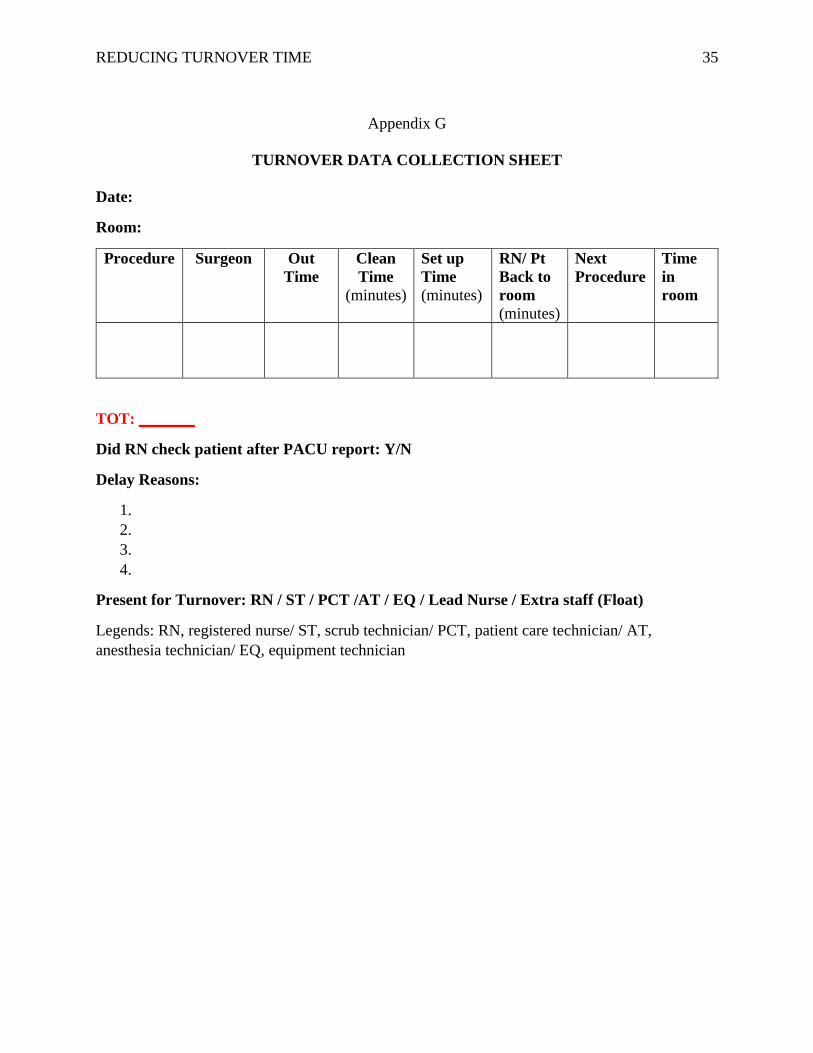
Prior to the educational intervention, a three-day observation and data collection on
turnover time was done on twelve surgical procedures inclusive of five total joint cases during
the third week of September (see Appendix G). The purpose for this data collection was to
observe the current state of the turnover process, obtain baseline TOT data for total joint cases,
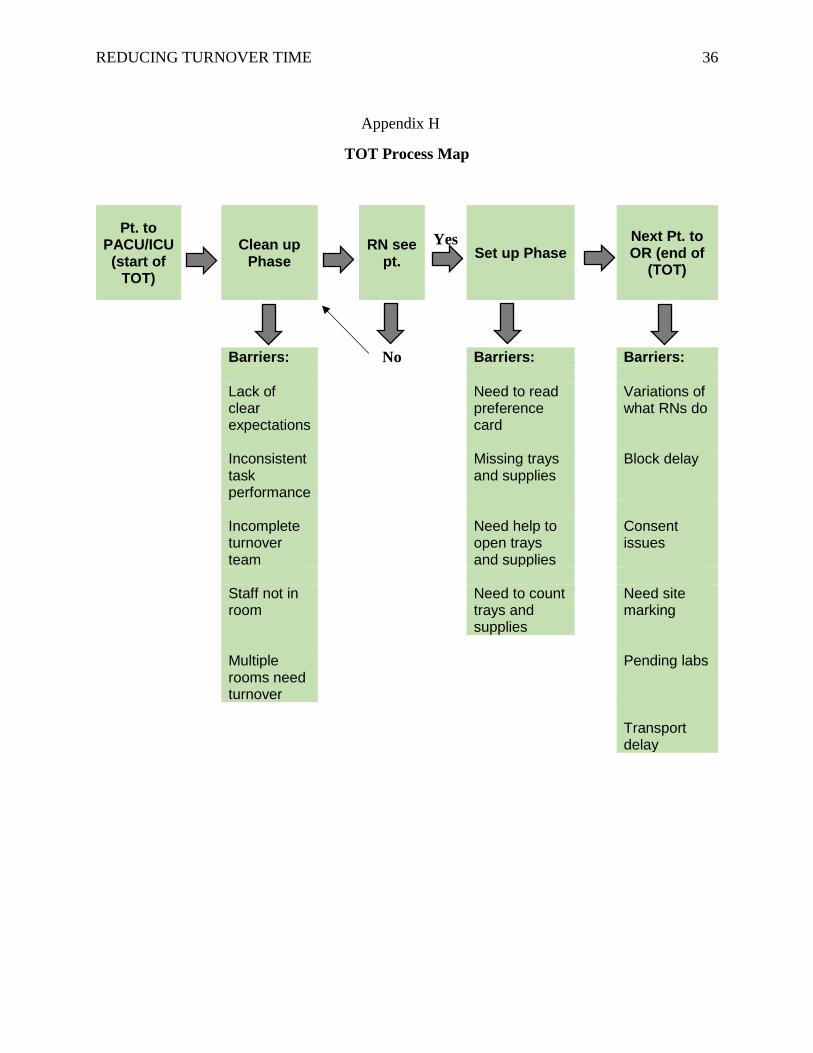
and to identify the key elements causing delays through process mapping. Process mapping is a
REDUCING TURNOVER TIME 11
method for creating a diagram that illustrates the steps and flow of the process (Nelson et al,
2007). The opportunities identified during the data collection that have impacted TOT are
specifically illustrated on the process mapping (see Appendix H). These key elements causing
the delays will be given emphasis during education on roles and responsibilities for each team
member. There were variances noted when RNs check their next patients. Some RNs check the
patient at the beginning of set-up phase (which is right after taking the previous patient to the
patient anesthesia care unit-PACU) and some do it after the set-up phase. Based on the data
collected, the RNs who check patients after the set-up phase take twice the time to bring the
patient to the OR. Reasons for the delay are missing physician signature on the consent and/or
site marking, lacking history and physical assessment update, and the patient needing to go to the
bathroom, activities which could have been handled by the preoperative nurse had the missing
components been identified by the OR nurse. Some STs leave the room without any relief staff
coverage during the turnover process, making the turnover longer because the responsibilities are
not done concurrently. Another finding from this TOT observation was the need of an assigned
float person (RN or ST) to be available of help during the set-up phase in opening instrument
trays and sterile supplies. The observation data further validates the outcome of the informal
survey from the staff regarding the need to educate on and redefine roles and responsibilities
during the turnover process. It also provided an opportunity to obtain the baseline data of the
average TOT for total joint cases which can be used to compare with the pilot test data.
Using the plan, do, study, act (PDSA) cycle can lead to early, measured improvements
and increased staff enthusiasm that will diminish anxiety and resistance to change (Nelson et al,
2007). The plan is to do a pilot test for a week in total joint rooms to evaluate the effect of the
standardized turnover process and to identify needs for modification before implementing the

REDUCING TURNOVER TIME 12
change (see Appendix I). Again, due to time constraints and project implementation delay, the
plan to do a pilot test for a week in total joint cases was reduced to one and a half days with five
observed turnover processes. The education on roles and responsibilities for a standard
workflow was only limited to the team assigned to do the total joint cases during the pilot test.
Each member of the team assigned in the pilot test was given a list of expectations with
coordinated responsibilities based on their role for the turnover process. Total joint rooms were
chosen for testing because the turnover times in 2014 had a consistent average of 22-25 minutes.
The CNL student supervised the pilot test, collected, and analyzed data using the TOT data
collection form. The pilot test helped determine if an educational intervention is effective in
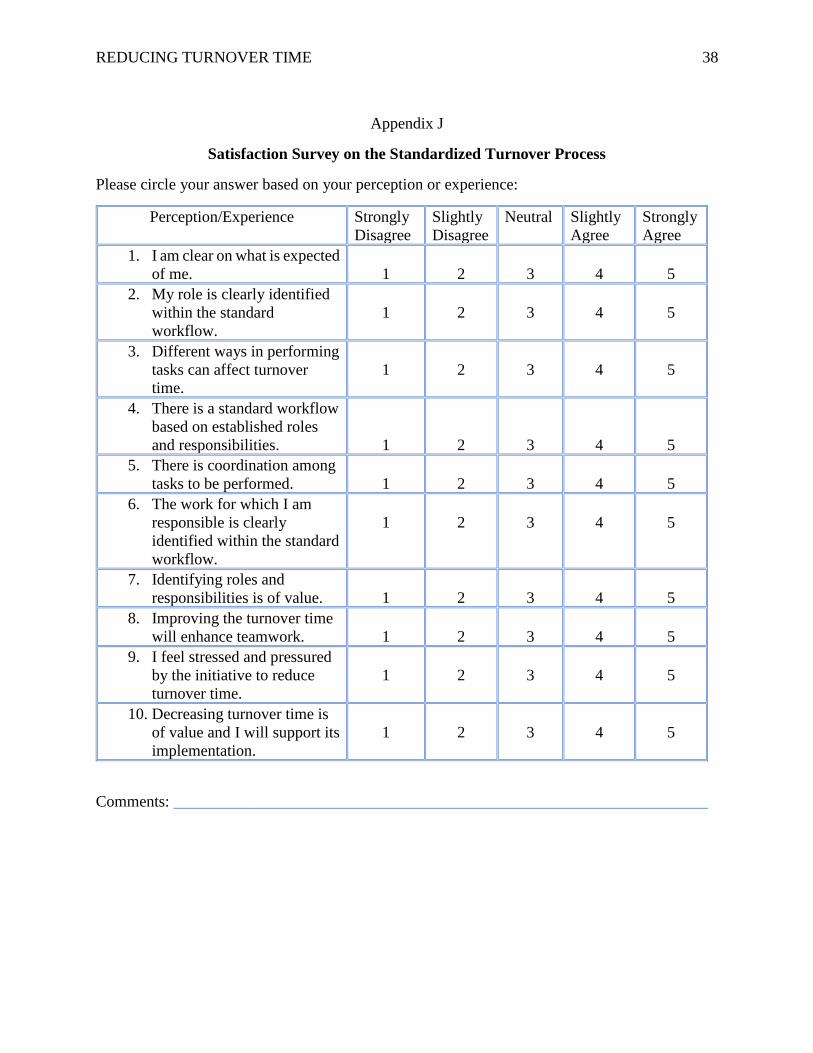
influencing the key elements that impact delays during the turnover process. In addition, a post-
intervention survey from the pilot test team was completed on November 17, 2017 to measure
staff satisfaction (Appendix J for survey questions; Appendix K for survey results).
A run chart, graphical data to show the average TOT trend, will be displayed on the
operating room daily pursuit of clinical excellence board (DPCE) to reflect the daily average of
turnover times in minutes starting from the third week of November. The microsystem’s average
TOT data from 2014-2017, and the national benchmark average TOT will also be displayed for
comparison. The previous day turnover average time will be announced daily by the lead nurse
during morning shift huddle to keep the staff informed on the TOT progress. Problems and
barriers will be discussed during monthly staff meetings, and changes or adjustments will be
made based on assessments and feedback presented. Any improvements necessary will be
included during the monthly staff in-service as well as communicated through staff email to
facilitate an across the board involvement.
REDUCING TURNOVER TIME 13
The education for OR staff on standard workflow will be provided by the CNL student
on December 4, 2017 during the monthly staff meeting. Implementing the change and
integrating the turnover process into the daily workflow will impact and sustain the results of the
reduced TOT shown during the pilot testing. According to Nelson et al. (2007), standardize-do-
study-act (SDSA) cycle is an approach to hold the gains that were made and to standardize the
process in daily work. Teamwork needs to be developed to support the process improvement
and to foster long-term success. If positive outcomes are achieved, celebrate the team success, if
not, examine the data and identify opportunities for improvement (Vassell, 2016). Based on
Havelock’s theory of change, Lane (1992) recommends continued recognition of the members’
contributions to promote ongoing cooperation and engagement.
Data Source/Literature Review
The population, intervention, comparison, and outcome (PICO) statement utilized to help
search for literatures needed to support the project includes:
• P- Operating room staff
• I- Education on Roles and Responsibilities for a Standard Workflow during
Turnover Process
• C- Prior Turnover Time (2014, 2015)
• O- Reduced Turnover Time
The search strategy included in the literature during 2012-2017 are from CINAHL
database with research articles from AORN Journal, Journal of Nursing Management, Journal of
Clinical Outcomes Management, International Journal of Health Care Quality and Assurance,
Hospital Topics, Canadian Journal of Surgery, International Journal of Collaborative Enterprise,
and British Journal of Health Management. Relevant articles on reducing turnover time in

REDUCING TURNOVER TIME 14
surgical settings were peer reviewed and published in English using the key words: Improve
efficiency, turnover time, operating room, teamwork, workflow and clinical nurse leader. To
focus on the roles of the operating room staff during TOT and be able to compare the benchmark
average of TOT to the outcome of the project, additional search was done on Google Scholar
using the combination of words such as operating room staff, role, turnover time and turnover
time benchmark.
The CNL has the skill to critically appraise literature and to gather sources for evidence-
based projects to determine their strengths, limitations, and significance to reducing turnover
time (King & Gerard, 2016). Nine studies will be reviewed to determine the relevance of
reducing TOT in improving efficiency in the operating room.
Beaule, Frombach, & Ryu (2015) performed a cohort retrospective study which
established the benchmark times for successful completion of four joint replacement surgeries
within an 8-hour shift by maximizing operating room efficiency with a turnover time of 15
minutes. This initiative was instituted to minimize wait times for joint replacements by
improving throughputs while also minimizing the need to increase the number of OR days due to
the increasing demand of joint replacement surgeries. This study provides a guide to efficient
utilization of resources within a standard 8-hour shift without increasing the budgetary demands
of overtime, extra personnel, or extra rooms for spinal or block anesthetic. Four successful
benchmarks on joint replacement surgeries were established on anesthesia prep time, surgical
prep time, anesthesia finishing time, and turnaround time, which can be replicated to other
surgical specialties. This proves that reducing TOT can improve efficiency in the OR.
Burlingame (2014) defines turnover time and identifies the team involved and the several
factors that alter TOT. The article briefly discussed common areas of concern affecting TOT
REDUCING TURNOVER TIME 15
that can determine steps to alter without compromising patient safety. This article supports the
contributing factors illustrated on the fishbone diagram that resulted from the microsystem
assessment on aspects affecting turnover time.
Fixler & Wright (2013) identified the important performance and efficiency indicators as
follows: Average turnover time, excess staffing cost, off-hours surgery, same day cancellation,
first-case start accuracy, case duration accuracy, and percentage of OR use/unplanned closures.
The authors concluded that developing a scorecard or dashboard tracking of core performance
indicators is essential in measuring, monitoring, and benchmarking OR performance and
efficiency. This article supports the need to visually display a run chart in the operating room to
show the daily average of turnover times in minutes and to reflect the progress of the
improvement project.
Norman & Bidanda (2014) performed a case study on OR turnaround analysis that
focused on identifying areas of improvement to reduce turnaround time from 45-55 minutes to
30 minutes. The recommended guidelines to address the identified problems affecting
turnaround time include standardization of responsibilities to ensure accountability, effective
synchronization and sequencing of activities, teamwork efficiency, accurate surgical length
estimation, and improved communication. A six-step process was initiated to (a) establish
project goals, objectives and performance metrics; (b) process observation and documentation;
(c) data collection; (d) data analysis to identify barriers, constraints, and challenges; (e)
recommendations and guidelines to reduce OR TOT; and (f) implement the change, as illustrated
by the authors. This study supports and validates the need to establish standardized roles and
responsibilities of team members involved in the turnover process as well as the recommended
methodology of change implementation.
REDUCING TURNOVER TIME 16
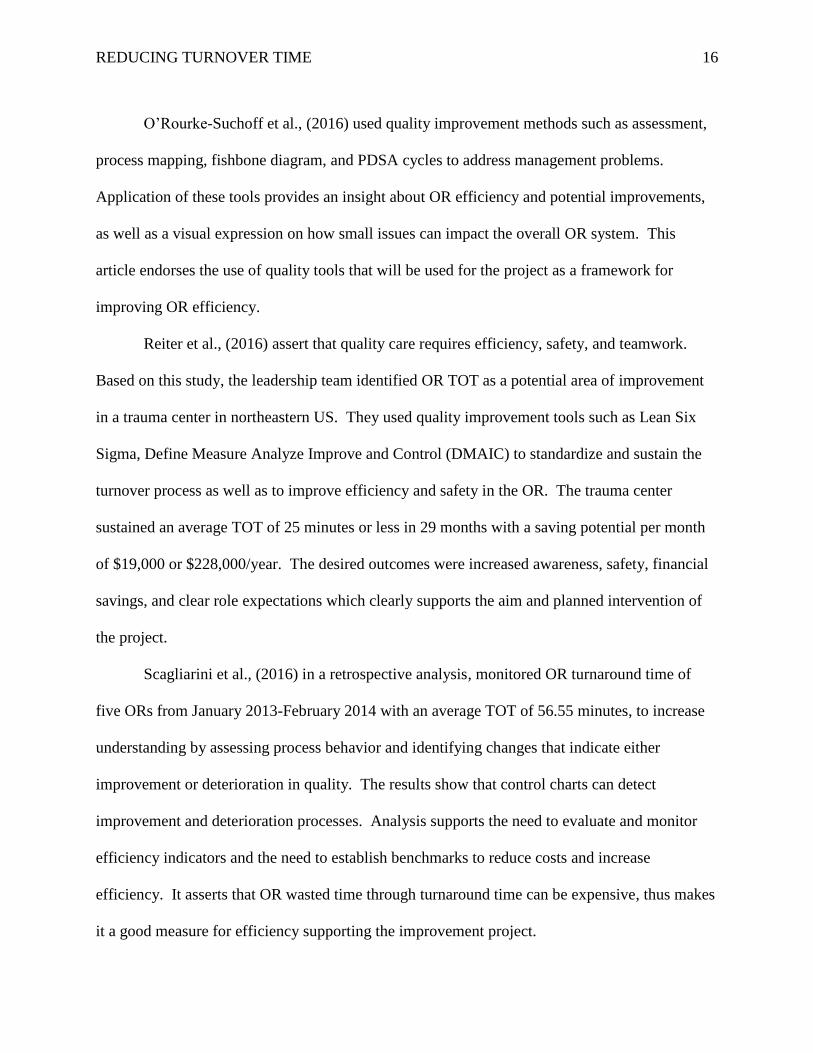
O’Rourke-Suchoff et al., (2016) used quality improvement methods such as assessment,
process mapping, fishbone diagram, and PDSA cycles to address management problems.
Application of these tools provides an insight about OR efficiency and potential improvements,
as well as a visual expression on how small issues can impact the overall OR system. This
article endorses the use of quality tools that will be used for the project as a framework for
improving OR efficiency.
Reiter et al., (2016) assert that quality care requires efficiency, safety, and teamwork.
Based on this study, the leadership team identified OR TOT as a potential area of improvement
in a trauma center in northeastern US. They used quality improvement tools such as Lean Six
Sigma, Define Measure Analyze Improve and Control (DMAIC) to standardize and sustain the
turnover process as well as to improve efficiency and safety in the OR. The trauma center
sustained an average TOT of 25 minutes or less in 29 months with a saving potential per month
of $19,000 or $228,000/year. The desired outcomes were increased awareness, safety, financial
savings, and clear role expectations which clearly supports the aim and planned intervention of
the project.
Scagliarini et al., (2016) in a retrospective analysis, monitored OR turnaround time of
five ORs from January 2013-February 2014 with an average TOT of 56.55 minutes, to increase
understanding by assessing process behavior and identifying changes that indicate either
improvement or deterioration in quality. The results show that control charts can detect
improvement and deterioration processes. Analysis supports the need to evaluate and monitor
efficiency indicators and the need to establish benchmarks to reduce costs and increase
efficiency. It asserts that OR wasted time through turnaround time can be expensive, thus makes
it a good measure for efficiency supporting the improvement project.

REDUCING TURNOVER TIME 17
Sohrakoff et al., (2014) launched an initiative at University of California, Davis in 2010
to increase OR capacity and bolster patient and staff satisfaction by identifying key opportunities
for improvement. Efficiency freed up roughly 5,500 annual hours for three years translating to
how many million dollars in additional revenue, and improved patient and staff satisfaction as
the microsystem ran more smoothly, with less waiting and delay, and stronger teamwork and
coordination. This corroborates that efficiency in the OR has important implications on reducing
cost of delays and patient satisfaction which align with the goals of the project.
Vassell (2016) stated that inefficiency in the OR can increase cost and lead to dissatisfied
patients, physicians, and staff members. Metrics for evaluating efficiency include on-time starts,
turnover time, procedure cancellation, and delay. The author also pointed out to consider the
regulations for improving efficiency and to recognize standard processes of a working
environment such as communication, collaboration, effective decision-making, appropriate
staffing, meaningful recognition, and authentic leadership. This article reinforces that efficiency
in the OR requires staff member engagement in achieving desired outcomes.
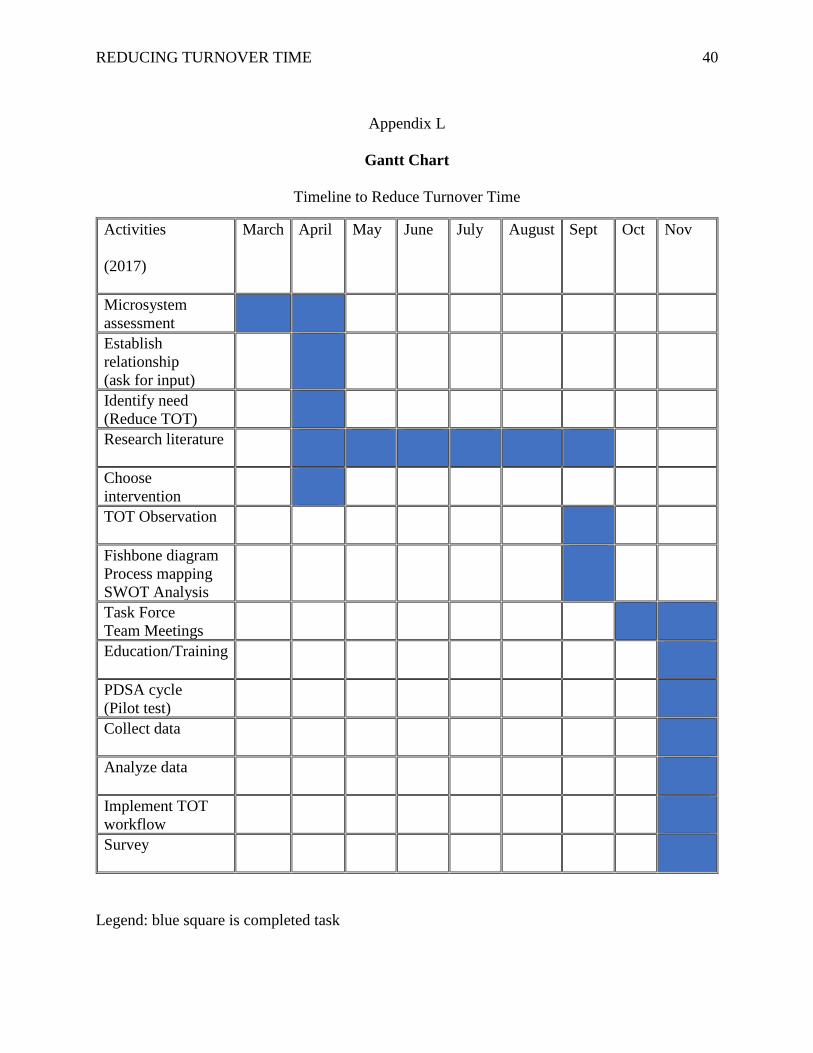
Timeline
The Gantt chart is used to illustrate the timeline created and to keep the project on track
as it trends over time to achieve the goal to improve efficiency by reducing TOT (see appendix
L). The action plan for tracking is based on the framework of Havelock’s model for change and
use of PDSA cycles.
The microsystem assessment was conducted from March to April 2017. Based on
microsystem assessment and upward trending of TOT, the need to improve efficiency by
reducing turnover time was identified. Staff were randomly surveyed through informal
discussions regarding their encountered challenges during turnover time. The theme that has
REDUCING TURNOVER TIME 18
emerged from the informal survey was the lack of clear expectations on the roles and
responsibilities of the team members during the turnover process. Literature search and relevant
articles on improving efficiency and TOT in the operating room were reviewed from April until
September. Microsystem observation and data collection on TOT was carried out through
September, enabling the creation of fishbone diagram, process mapping, and SWOT analysis.
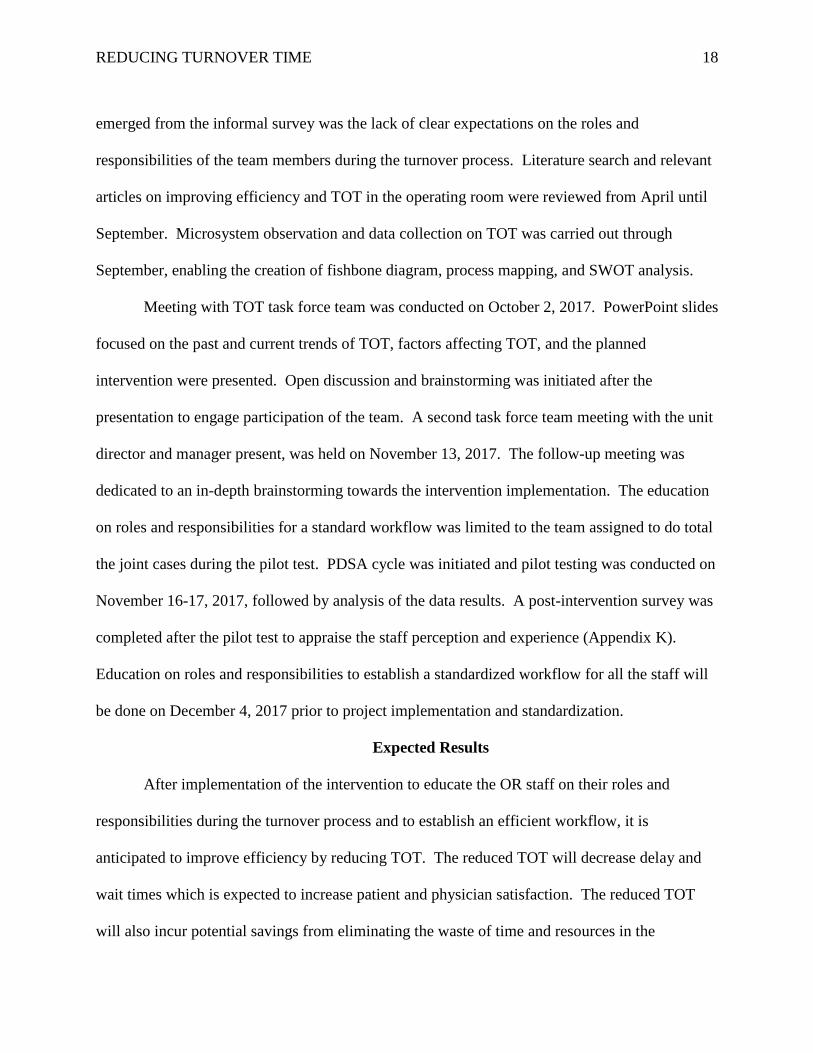
Meeting with TOT task force team was conducted on October 2, 2017. PowerPoint slides
focused on the past and current trends of TOT, factors affecting TOT, and the planned
intervention were presented. Open discussion and brainstorming was initiated after the
presentation to engage participation of the team. A second task force team meeting with the unit
director and manager present, was held on November 13, 2017. The follow-up meeting was
dedicated to an in-depth brainstorming towards the intervention implementation. The education
on roles and responsibilities for a standard workflow was limited to the team assigned to do total
the joint cases during the pilot test. PDSA cycle was initiated and pilot testing was conducted on
November 16-17, 2017, followed by analysis of the data results. A post-intervention survey was
completed after the pilot test to appraise the staff perception and experience (Appendix K).
Education on roles and responsibilities to establish a standardized workflow for all the staff will
be done on December 4, 2017 prior to project implementation and standardization.
Expected Results
After implementation of the intervention to educate the OR staff on their roles and
responsibilities during the turnover process and to establish an efficient workflow, it is
anticipated to improve efficiency by reducing TOT. The reduced TOT will decrease delay and
wait times which is expected to increase patient and physician satisfaction. The reduced TOT
will also incur potential savings from eliminating the waste of time and resources in the
REDUCING TURNOVER TIME 19
operating room. Another expectation is enhanced teamwork, cooperation, and engagement of
the staff towards achieving the goals of this project. After successful adoption of the
standardized workflow, this improvement project can segue to improving case carts and
preference cards accuracy to complement the established workflow and to gain more traction in
reducing turnover time.
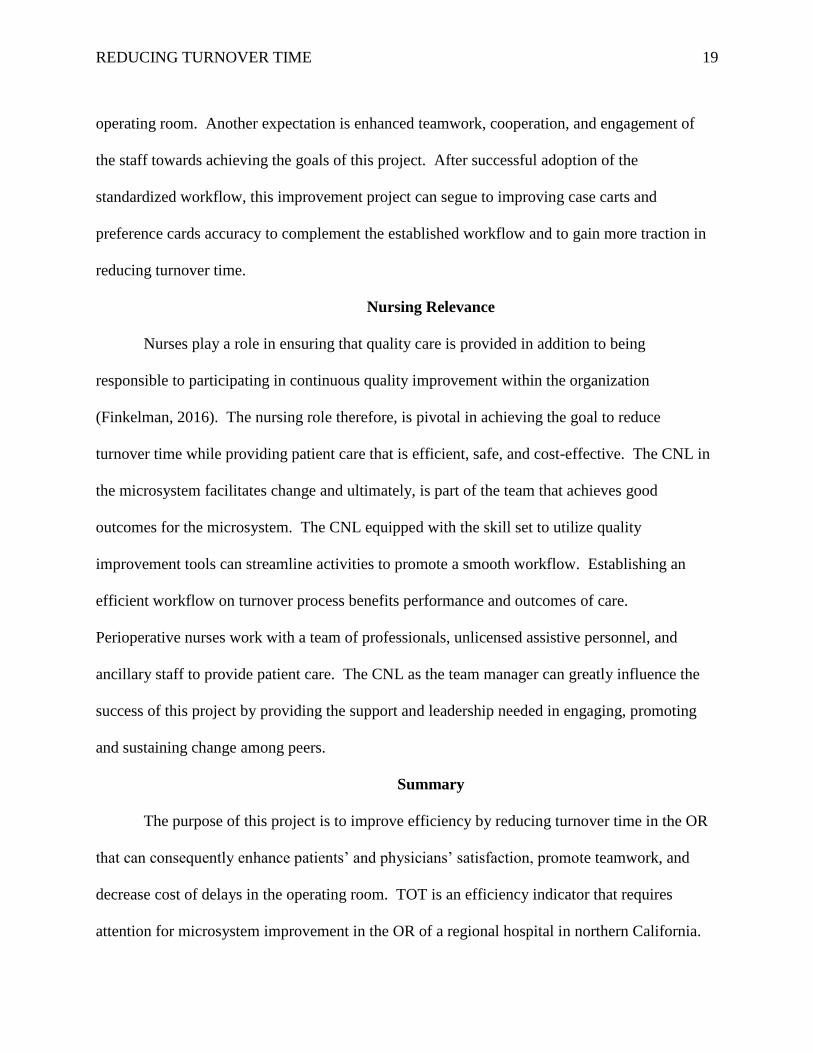
Nursing Relevance
Nurses play a role in ensuring that quality care is provided in addition to being
responsible to participating in continuous quality improvement within the organization
(Finkelman, 2016). The nursing role therefore, is pivotal in achieving the goal to reduce
turnover time while providing patient care that is efficient, safe, and cost-effective. The CNL in
the microsystem facilitates change and ultimately, is part of the team that achieves good
outcomes for the microsystem. The CNL equipped with the skill set to utilize quality
improvement tools can streamline activities to promote a smooth workflow. Establishing an
efficient workflow on turnover process benefits performance and outcomes of care.
Perioperative nurses work with a team of professionals, unlicensed assistive personnel, and
ancillary staff to provide patient care. The CNL as the team manager can greatly influence the
success of this project by providing the support and leadership needed in engaging, promoting
and sustaining change among peers.
Summary
The purpose of this project is to improve efficiency by reducing turnover time in the OR
that can consequently enhance patients’ and physicians’ satisfaction, promote teamwork, and
decrease cost of delays in the operating room. TOT is an efficiency indicator that requires
attention for microsystem improvement in the OR of a regional hospital in northern California.
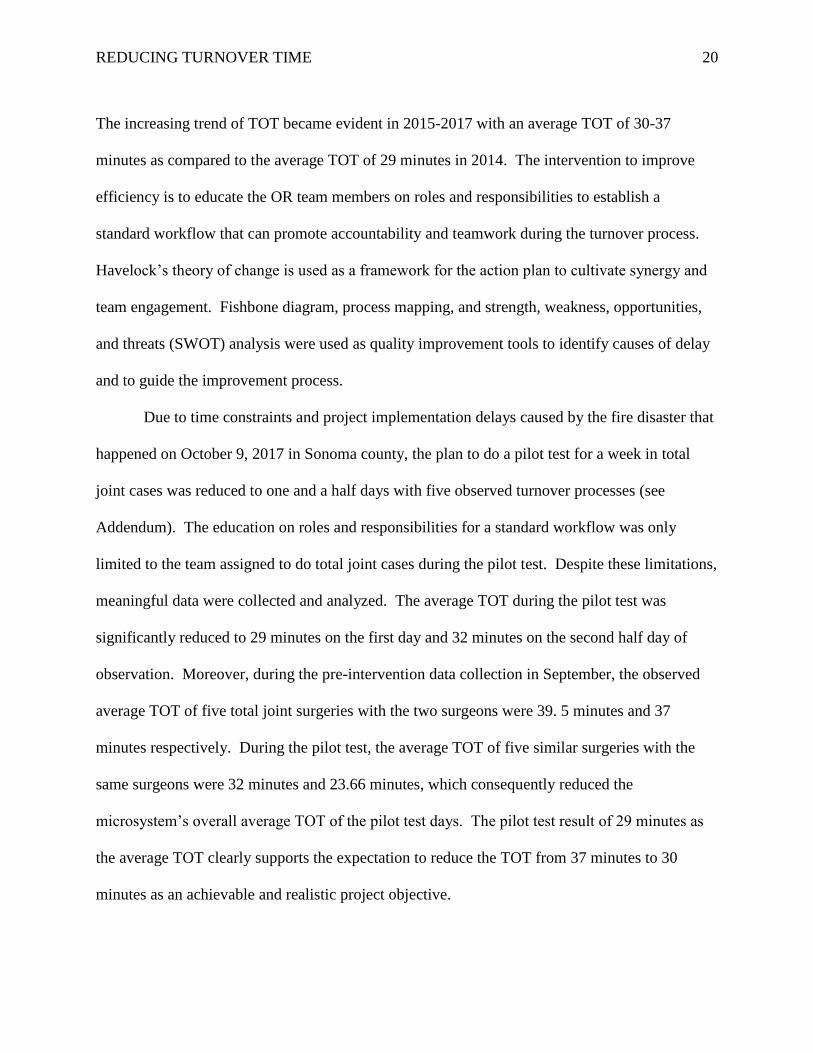
REDUCING TURNOVER TIME 20
The increasing trend of TOT became evident in 2015-2017 with an average TOT of 30-37
minutes as compared to the average TOT of 29 minutes in 2014. The intervention to improve
efficiency is to educate the OR team members on roles and responsibilities to establish a
standard workflow that can promote accountability and teamwork during the turnover process.
Havelock’s theory of change is used as a framework for the action plan to cultivate synergy and
team engagement. Fishbone diagram, process mapping, and strength, weakness, opportunities,
and threats (SWOT) analysis were used as quality improvement tools to identify causes of delay
and to guide the improvement process.
Due to time constraints and project implementation delays caused by the fire disaster that
happened on October 9, 2017 in Sonoma county, the plan to do a pilot test for a week in total
joint cases was reduced to one and a half days with five observed turnover processes (see
Addendum). The education on roles and responsibilities for a standard workflow was only
limited to the team assigned to do total joint cases during the pilot test. Despite these limitations,
meaningful data were collected and analyzed. The average TOT during the pilot test was
significantly reduced to 29 minutes on the first day and 32 minutes on the second half day of
observation. Moreover, during the pre-intervention data collection in September, the observed
average TOT of five total joint surgeries with the two surgeons were 39. 5 minutes and 37
minutes respectively. During the pilot test, the average TOT of five similar surgeries with the
same surgeons were 32 minutes and 23.66 minutes, which consequently reduced the
microsystem’s overall average TOT of the pilot test days. The pilot test result of 29 minutes as
the average TOT clearly supports the expectation to reduce the TOT from 37 minutes to 30
minutes as an achievable and realistic project objective.
REDUCING TURNOVER TIME 21
The debriefing done with the pilot test team revealed significant information that can help
improve and sustain the gains of the standard workflow. Along with the need to establish
standard roles and responsibilities for a better workflow during the turnover process, the other
factors that can exert an influence in improving efficiency include:
• assign a float person (RN or ST) to help open instrument trays and sterile
supplies during the set-up phase
• team coordination during the cleaning phase
• pick and sort out suture supplies on the case cart by the PCT
• sort out implant instrument trays as open or hold and labelled accordingly
by the company representative
• open sterile supplies in a designated space on the sterile table to provide
the scrub person enough working space to organize the trays and instruments
• take out empty trays and cart out of the room by PCT or float person
• include the standard workflow as part of the unit orientation for new staff.
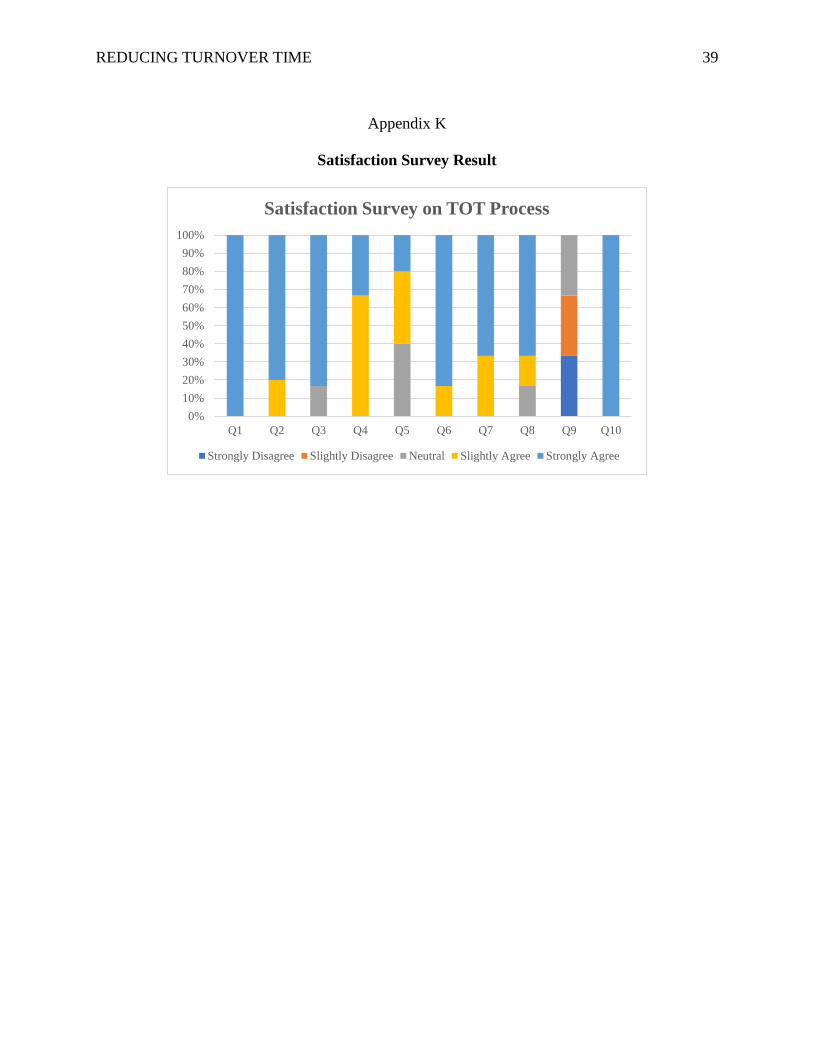
The post-intervention survey was done to measure staff satisfaction which showed a
positive result. Based on the survey, the six staff members involved in the pilot test all strongly
agree that the intervention established what is expected of them and that decreasing turnover
time is of value, therefore will support its implementation (see Appendix K).
The two surgeons with total joint cases during the pilot test expressed great satisfaction
both verbally and through e-mail correspondence to the leadership team. The OR team involved
showed cooperation and engagement in the initiative to improve the workflow of the turnover
process. Upon implementation, the average TOT of the previous day will be announced daily by
the lead nurse during huddle to keep the OR staff informed. Keeping the OR team involved and
REDUCING TURNOVER TIME 22
updated with the TOT outcome and progress will encourage interest and motivation. Sustainable
results can be celebrated with a monthly pizza party as suggested during the stakeholders’
meeting which will be presented for final group approval at the staff meeting in December.
To take advantage of the momentum and successful result of the pilot test, the education
on the standard workflow for the OR staff during the turnover process will be provided by the
CNL student on December 4, 2017 during the monthly staff meeting. Integrating the
standardized turnover process into the daily workflow will impact and hold the gains of the
reduced TOT. To complement, gain traction, and sustain the reduced turnover time and
improved efficiency over time, it is suggested to segue the improvement project into checking
the surgeons’ preference cards and case cart lists for updates and accuracy. This transition
project will address the delay factors identified on the fishbone diagram under materials category
and will require the participation of all team members. Following Havelock’s theory of change,
empowering and encouraging the staff to own the change through involvement and continued
recognition will promote teamwork that can foster process improvement and long-term success.
REDUCING TURNOVER TIME 23
References
Allen, G. (2014). Implementing AORN recommended practices for environmental cleaning.
AORN Journal, 99(5), 571-577
American Association of Colleges of Nursing. (2007). White paper on the education and role of
the clinical nurse leader. Retrieved from http://www.aacn.nche.edu/publications/white-
paper/ClinicalNurseLeader.pdf
American Association of Colleges in Nursing (AACN). (2013). Competencies and curricular
expectations for clinical nurse leader education and practice. Retrieved from
http://www.accn.nche.edu/publications/white-paper/cnl
Beaule, P. E., Frombach, A.A. & Ryu, J. (2015). Working toward benchmarks on orthopedic OR
efficiency for joint replacement surgery in an academic centre. Canadian Journal of
Surgery, 58(8), 408-413
Burlingame, B. (2014). Clinical issues: Definition of turnover time. AORN Journal, 99(4), 546-
547.
Data for benchmarking your OR’s performance. (2012). OR Manager, 28(1).
Finkelman, A. (2016). Implementing healthcare quality improvement. Leadership and
management for nurses: Core competencies for quality care (pp 419-443). USA:
Pearson.
Fixler, T., & Wright, J. G. (2013). Identification and use of operating room efficiency indicators:
the problem definition. Canadian Journal of Surgery, 56(4), 224-226. doi:
10.1503/cjs.020712

REDUCING TURNOVER TIME 24
Harris, J. L., Roussel, L., Thomas, P. L., (2014). Quality care and risk management. Initiating
and sustaining the clinical nurse leader role (p. 226). Burlington, MA: Jones & Bartlett
Learning.
Harris, J. L., Roussel, L., Thomas, P. L., (2018). Initiating and sustaining the clinical nurse
leader role. Burlington, MA: Jones & Bartlett Learning.
Health Grades, INC. (2017). Health grades- Santa Rosa Memorial Hospital. Retrieved from
https://www.healthgrades.com/hospital-directory/california-ca-northern/santa-rosa-
memorial-hospital-hgst14518d46050174
King, C. R., & Gerard, S. O. (2016). Evidence-based practice. Clinical Nurse Leader
Certification Review (2nd ed., pp. 129-137). New York: NY. Springer Publishing
Company.
King, C. R., & Gerard, S. O. (2016). Health care systems/organizations. Clinical Nurse Leader
Certification Review (2nd ed., pp. 185-186). New York: NY. Springer Publishing
Company.
Lane, A. (1992). Using Havelock's model to plan unit-based change. Nursing
Management, 23(9), 58-60.
Mitchell, G. (2013). Selecting the best theory to implement planned change. Nursing
Management - UK, 20(1), 32-37.
Nelson, E. C., Batalden, P. B., & Godfrey, M. (2007). Quality by design: A clinical microsystems
approach. San Francisco; CA: Jossey-Bass.
Norman, B. A., & Bidanda, B. (2014). Operating room turnaround time analysis: A case study.
International Journal of Collaborative Enterprise, 4(1/2), 101-114
REDUCING TURNOVER TIME 25
O'Rourke-Suchoff, D., Hyman, S., Young, T., Maeder, C., Dolansky, M. A. (2016). Applying a
quality improvement framework to improve operating room efficiency in an academic
practice partnership. Journal of Clinical Outcomes Management, 23(3), 120-126
Penner, S. J. (2017). Economics and financial management for nurses and nurse leaders. New
York, NY: Springer Publishing Company.
Reiter, K., Hannig, M., Lingle, M., Monacelli, S., Wells, V. (2016). Balancing efficiency and
safety in the OR. Journal of Nursing Management, pp. 31-34
Scagliarini, M., Apreda, M., Weinand, U., Valpiani, G. (2016). Monitoring operating room
turnaround time: a retrospective analysis. International Journal of Health Care Quality
Assurance, 29(3), 351-359
Sohrakoff, K., Westlake, C., Key, E., Barth, E., Antognini, J., & Johnson, V. (2014). Optimizing
the OR: A bottom-up approach. Hospital Topics, 92(20), 21-27
Surgical Devices. (2016). Clinical studies of U.S. hospitals have demonstrated that the average
cost per minute of operating time was $62. Retrieved from
http://surgicaldevices.com/clinical-studies-of-u-s-hospitals-have-demonstrated-that-the-
average-cost-per-minute-of-operating-room-time-was-62
Taylor, D. L. (2014). Perioperative leadership: Managing change with insights, priorities, and
tools. AORN Journal, 100(1), 11-25. doi:http://dx.doi.org/10.1016/j.aorn.2013.06.013
Vassell, P. (2016). Improving OR efficiency. AORN Journal, 104(2), 121-129.
doi:http://dx.doi.org/10.1016/j.aorn.2016.06.006
Wesolowski, M., Casey, G., Berry, S. J., Gannon, J. (2014). The clinical nurse leader in a
perioperative setting: A preceptor experience. AORN Journal, 100(1), 30-41. doi:
http://dx.doi.org/10.1016/j.aorn.2013.11.0
REDUCING TURNOVER TIME 26
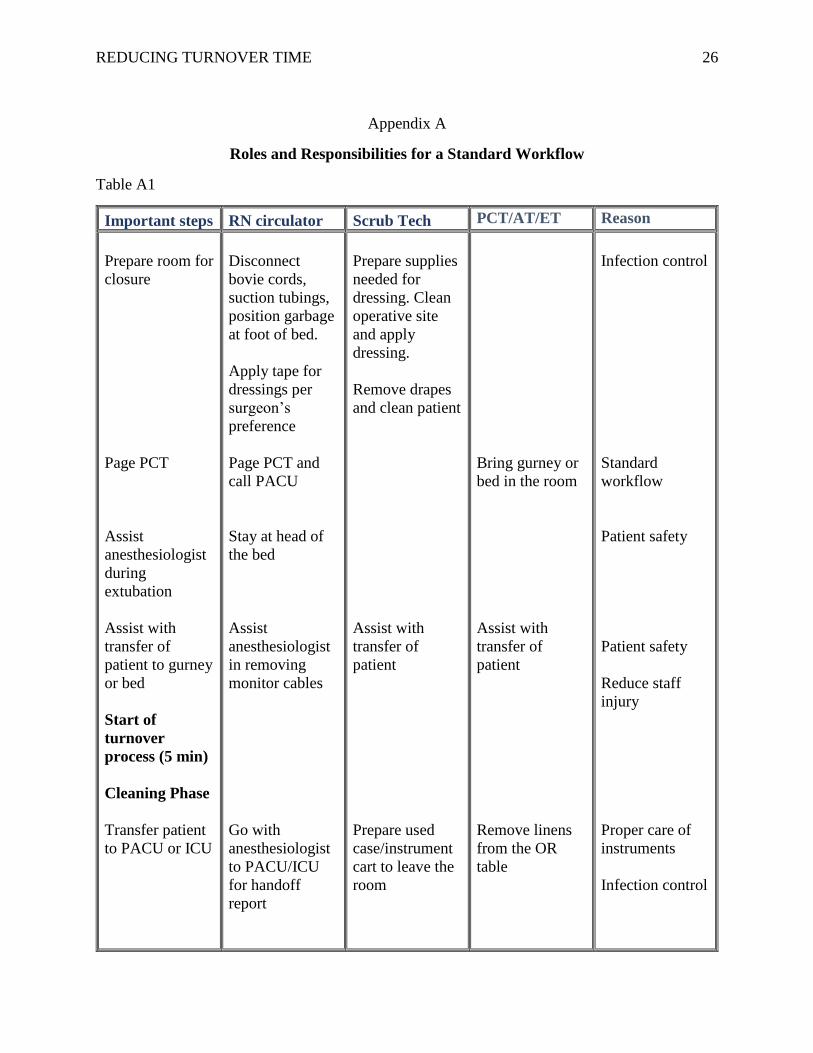
Appendix A
Roles and Responsibilities for a Standard Workflow
Table A1
Important steps RN circulator Scrub Tech PCT/AT/ET Reason
Prepare room for
closure
Page PCT
Assist
anesthesiologist
during
extubation
Assist with
transfer of
patient to gurney
or bed
Start of
turnover
process (5 min)
Cleaning Phase
Transfer patient
to PACU or ICU
Disconnect
bovie cords,
suction tubings,
position garbage
at foot of bed.
Apply tape for
dressings per
surgeon’s
preference
Page PCT and
call PACU
Stay at head of
the bed
Assist
anesthesiologist
in removing
monitor cables
Go with
anesthesiologist
to PACU/ICU
for handoff
report
Prepare supplies
needed for
dressing. Clean
operative site
and apply
dressing.
Remove drapes
and clean patient
Assist with
transfer of
patient
Prepare used
case/instrument
cart to leave the
room
Bring gurney or
bed in the room
Assist with
transfer of
patient
Remove linens
from the OR
table
Infection control
Standard
workflow
Patient safety
Patient safety
Reduce staff
injury
Proper care of
instruments
Infection control
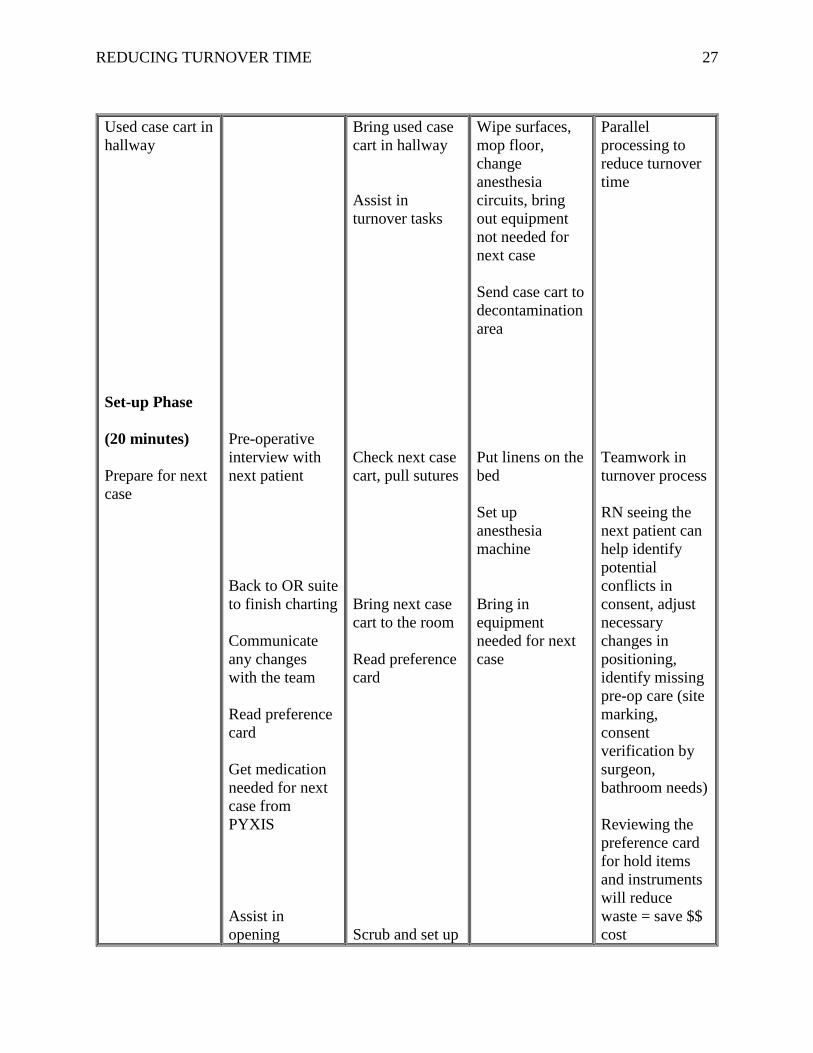
REDUCING TURNOVER TIME 27
Used case cart in
hallway
Set-up Phase
(20 minutes)
Prepare for next
case
Pre-operative
interview with
next patient
Back to OR suite
to finish charting
Communicate
any changes
with the team
Read preference
card
Get medication
needed for next
case from
PYXIS
Assist in
opening
Bring used case
cart in hallway
Assist in
turnover tasks
Check next case
cart, pull sutures
Bring next case
cart to the room
Read preference
card
Scrub and set up
Wipe surfaces,
mop floor,
change
anesthesia
circuits, bring
out equipment
not needed for
next case
Send case cart to
decontamination
area
Put linens on the
bed
Set up
anesthesia
machine
Bring in
equipment
needed for next
case
Parallel
processing to
reduce turnover
time
Teamwork in
turnover process
RN seeing the
next patient can
help identify
potential
conflicts in
consent, adjust
necessary
changes in
positioning,
identify missing
pre-op care (site
marking,
consent
verification by
surgeon,
bathroom needs)
Reviewing the
preference card
for hold items
and instruments
will reduce
waste = save $$
cost
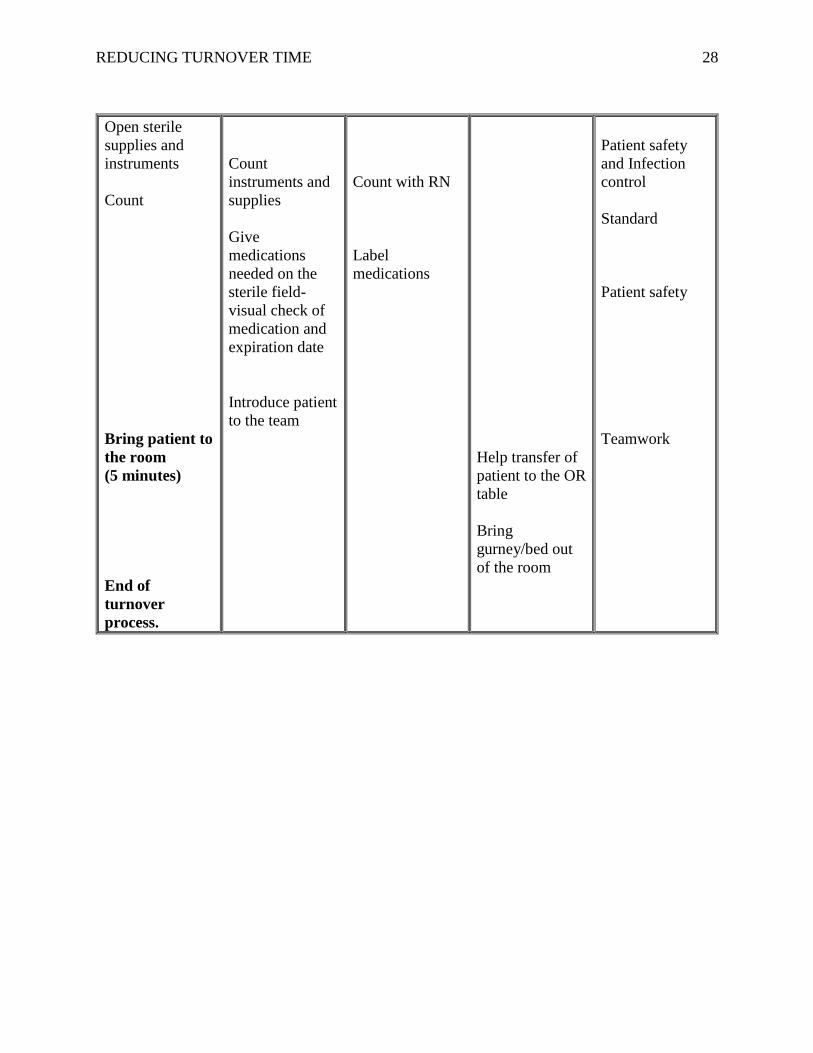
REDUCING TURNOVER TIME 28
Open sterile
supplies and
instruments
Count
Bring patient to
the room
(5 minutes)
End of
turnover
process.
Count
instruments and
supplies
Give
medications
needed on the
sterile field-
visual check of
medication and
expiration date
Introduce patient
to the team
Count with RN
Label
medications
Help transfer of
patient to the OR
table
Bring
gurney/bed out
of the room
Patient safety
and Infection
control
Standard
Patient safety
Teamwork
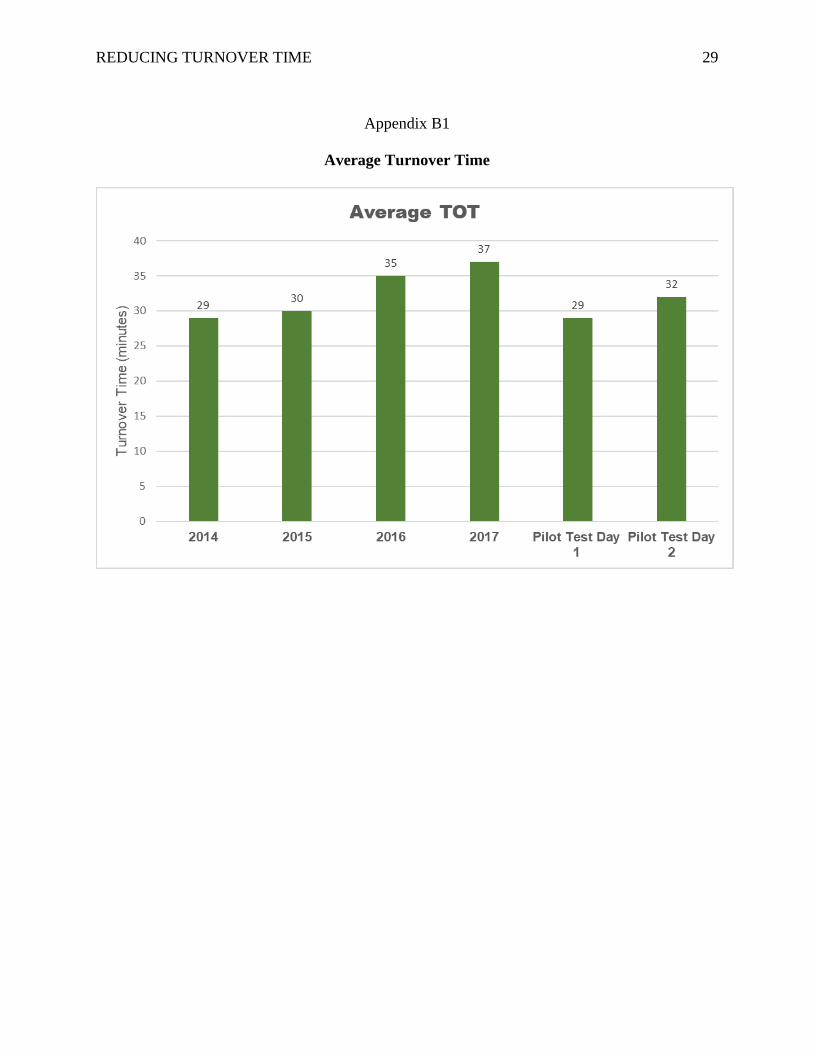
REDUCING TURNOVER TIME 29
Appendix B1
Average Turnover Time

REDUCING TURNOVER TIME 30
Appendix B2
Pilot Test Average Turnover Time on Total Joint Cases
REDUCING TURNOVER TIME 31
Appendix C
TOT Fishbone Diagram
REDUCING TURNOVER TIME 32
Appendix D
Turnover Time SWOT Analysis
Strengths
• Buy in from management and
physicians
• Improved efficiency
• Cost-savings
Weaknesses
• Lack of staff participation and
engagement
• Insufficient staffing (Float, PCT)
• Multiple rooms needing turnover
• Limited time to implement
Opportunities
• Standardize turnover
process/workflow
• Establish clear expectations
• Ensure accountability
• Enhance teamwork
• Potential to reduce overtime use to
finish delayed cases
Threats
• Resistance to follow the improvement
process of change
• Potential for stress and pressure to the
staff in achieving the goal of 30-
minute TOT
• Potential to perform tasks in a hurried
manner compromising protocols of
patient safety
• Fire disaster (October 9, 2017) in
Santa Rosa delayed project
implementation
REDUCING TURNOVER TIME 33
Appendix E
CBA Analysis
Items Avg. Hourly Salary 1-Hr Training 2-Hr Meeting
RN x 24 $60 $1,440 RN x 2 $240
ST x 15 $32 $480 ST x 1 $ 64
PCT x 6 $21 $126 PCT x 1 $42
AT x 1 $35 $35 AT x 1 $70
EQ x 1 $30 $30 EQ x 1 $60
Total $2,111 Total $ 476
CNL student $78.50 80 hours Total $ 6,280
Materials Reduced TOT OR time/min
Stop Watch x 5 $50 7 min $ 62
Clip Board x 5 $35 8.5 min $ 62
Total $85
Savings on TOT 7min/62/min 8.5 min/62/min
Weekly $2,170 $2,635
Monthly $8,680 $10,540
Yearly $104,160 $126,480
Saving Items
Reduced
TOT/Year $104,160 $126,480
CNL on Project $6,280 $6,280
Total $110,440 $132,760
Expenses
Training/Meetings $2,587
Materials $85
Total $2,672
Project Savings $110,440 $132,760
Project Cost $2,672 $2,672
Total Savings $107,768 $130,088

REDUCING TURNOVER TIME 34
Appendix F
Cost Benefit Analysis
$104,160
$6,280
$110,440
$2,672
CBA on 7 Minutes TOT Reduction
Reduced TOT/Yr CNL on Project Total Savings Project Cost
REDUCING TURNOVER TIME 35
Appendix G
TURNOVER DATA COLLECTION SHEET
Date:
Room:
Procedure Surgeon Out
Time
Clean
Time
(minutes)
Set up
Time
(minutes)
RN/ Pt
Back to
room
(minutes)
Next
Procedure
Time
in
room
TOT: _______
Did RN check patient after PACU report: Y/N
Delay Reasons:
1.
2.
3.
4.
Present for Turnover: RN / ST / PCT /AT / EQ / Lead Nurse / Extra staff (Float)
Legends: RN, registered nurse/ ST, scrub technician/ PCT, patient care technician/ AT,
anesthesia technician/ EQ, equipment technician
REDUCING TURNOVER TIME 36
Appendix H
TOT Process Map
Pt. to PACU/ICU (start of
TOT)
Clean up
Phase
RN see
pt.
Yes Set up Phase
Next Pt. to OR (end of
(TOT)
Barriers: No Barriers: Barriers:
Lack of
clear expectations
Need to read preference card
Variations of what RNs do
Inconsistent
task performance
Missing trays and supplies
Block delay
Incomplete
turnover team
Need help to open trays and supplies
Consent issues
Staff not in
room Need to count
trays and supplies
Need site marking
Multiple
rooms need turnover
Pending labs
Transport
delay

REDUCING TURNOVER TIME 37
Appendix I
PDSA Pilot Test
• Educate staff on standard workflow
• Pilot test on total joint cases
• Collect data
• Debrief
• Analyze data
• Reflect on results
• Modify intervention as needed
• Reduce TOT
• Meet and gather imput from stakeholders
• Educate team on standard workflow
• Pilot test
• Data collection
• Implement the standard workflow (roles/ responsibilities) for turnover process
• Adopt the actions identified to sustain change
Act Plan
DoStudy
REDUCING TURNOVER TIME 38
Appendix J
Satisfaction Survey on the Standardized Turnover Process
Please circle your answer based on your perception or experience:
Perception/Experience Strongly
Disagree
Slightly
Disagree
Neutral Slightly
Agree
Strongly
Agree
1. I am clear on what is expected
of me.
1
2
3
4
5
2. My role is clearly identified
within the standard
workflow.
1
2
3
4
5
3. Different ways in performing
tasks can affect turnover
time.
1
2
3
4
5
4. There is a standard workflow
based on established roles
and responsibilities.
1
2
3
4
5
5. There is coordination among
tasks to be performed.
1
2
3
4
5
6. The work for which I am
responsible is clearly
identified within the standard
workflow.
1
2
3
4
5
7. Identifying roles and
responsibilities is of value.
1
2
3
4
5
8. Improving the turnover time
will enhance teamwork.
1
2
3
4
5
9. I feel stressed and pressured
by the initiative to reduce
turnover time.
1
2
3
4
5
10. Decreasing turnover time is
of value and I will support its
implementation.
1
2
3
4
5
Comments: ___________________________________________________________________
REDUCING TURNOVER TIME 39
Appendix K
Satisfaction Survey Result
0%
10%
20%
30%
40%
50%
60%
70%
80%
90%
100%
Q1 Q2 Q3 Q4 Q5 Q6 Q7 Q8 Q9 Q10
Satisfaction Survey on TOT Process
Strongly Disagree Slightly Disagree Neutral Slightly Agree Strongly Agree
REDUCING TURNOVER TIME 40
Appendix L
Gantt Chart
Timeline to Reduce Turnover Time
Activities
(2017)
March April May June July August Sept Oct Nov
Microsystem
assessment
Establish
relationship
(ask for input)
Identify need
(Reduce TOT)
Research literature
Choose
intervention
TOT Observation
Fishbone diagram
Process mapping
SWOT Analysis
Task Force
Team Meetings
Education/Training
PDSA cycle
(Pilot test)
Collect data
Analyze data
Implement TOT
workflow
Survey
Legend: blue square is completed task
REDUCING TURNOVER TIME 41
Addendum
While the improvement project is about to be implemented, the most destructive fire in
California’s history wrought devastation on Santa Rosa as the wee hours of morning approached
on October 9, 2017 (Callahan & Warren, 2017). The fires devastated Coffey Park, Fountain
Grove, Larkfield-Wikiup, and various parts of Sonoma county. Many lives were lost, thousands
of homes destroyed, and half of the city residents, including my husband and I, were displaced
from home for a week due to mandatory evacuations. In the aftermath of the fire, residents
experienced shock, loss, and hardship. It will take years for Santa Rosa to recover from this
tragedy; however, the community rallied together, coming out stronger than ever. The quote
posted around the city, “The love in the air is thicker than the smoke” resonates within the hearts
of all the residents of Santa Rosa (CNN, 2017).
REDUCING TURNOVER TIME 42
Reference
Callahan, M. Warren, C. (2017). Tubbs fire in Santa Rosa now ranks as California’s most
destructive wildfire. Retrieved from http://www.pressdemocrat.com/news/7546956-
181/tubbs-fire-in-santa-rosa?artslide=0
CNN. (2017). California residents rally ‘The Love in the Air is Thicker than Smoke’. Retrieved
from http://wkrg.com/2017/10/14/california-residents-rally-the-love-in-the-air-is-thicker-
than-smoke/