reducing non-revenue water in the durban central business ... · african utility week reducing...
TRANSCRIPT

African Utility Week
Reducing Non -Revenue Waterin the Durban
Central Business District
Mark Shepherd PrEngJOAT Consulting

Background to Programme:
• Durban home to approximately 3,5 million• 12 000km of distribution and reticulation
mains• 437 000 registered service connections• Average operating pressure of 52m• Current bulk water purchases of 920Ml/day;
consumer sales of 530Ml/day• ILI of 9,6 (NRW around 36%)

NRW Reduction Framework:
Reducing leaks/physical losses: Reducing apparent/co mmerciallosses/improving billing:

Background to Programme:
• NRW Reduction Master Plan advocated increase in PRV -controlled reticulation from 25% to approximately 40%, and ultimately 50%
• Pressure supply zones reviewed – old standard 30m to 90m
• New standard – informal areas: 15m to 60m• New standard – formal areas: 25m to 60m• Targeted high -impact supply zones

Background to CBD Project:• Durban CBD 147km of reticulation mains and
approximately 1 600 connections• Characterised by daily influx of business
population, but also large resident population (300 – 400 000)
• MNF at commencement 830m 3/hr• Real loss volume of approximately 440m 3/hr
(approximately R10m/year)• Mixed pipe material and average pipe age of
60 years• Average operating pressure 58m

Supply Zone Extent:

Feasibility Study:• Feasibility study December 2005• Pressure/flow step test carried out in
zone, with flow and pressure measurements recorded at all critical points
• N1 factor determined as 0,96 i.e. relationship between flow and pressure approximately linear. For every % decrease in pressure, a corresponding % decrease in flow could be expected

Project Constraints:
• Design had to accommodate supply into adjacent zones if required
• Fire-fighting capacity not to be compromised• Pressure in CBD could not drop below 25m• No new valves to be purchased – Client’s
stock to be used - largest allowable PRV size of 400mm dia
• Space constraint so compact building required, with above-ground installation
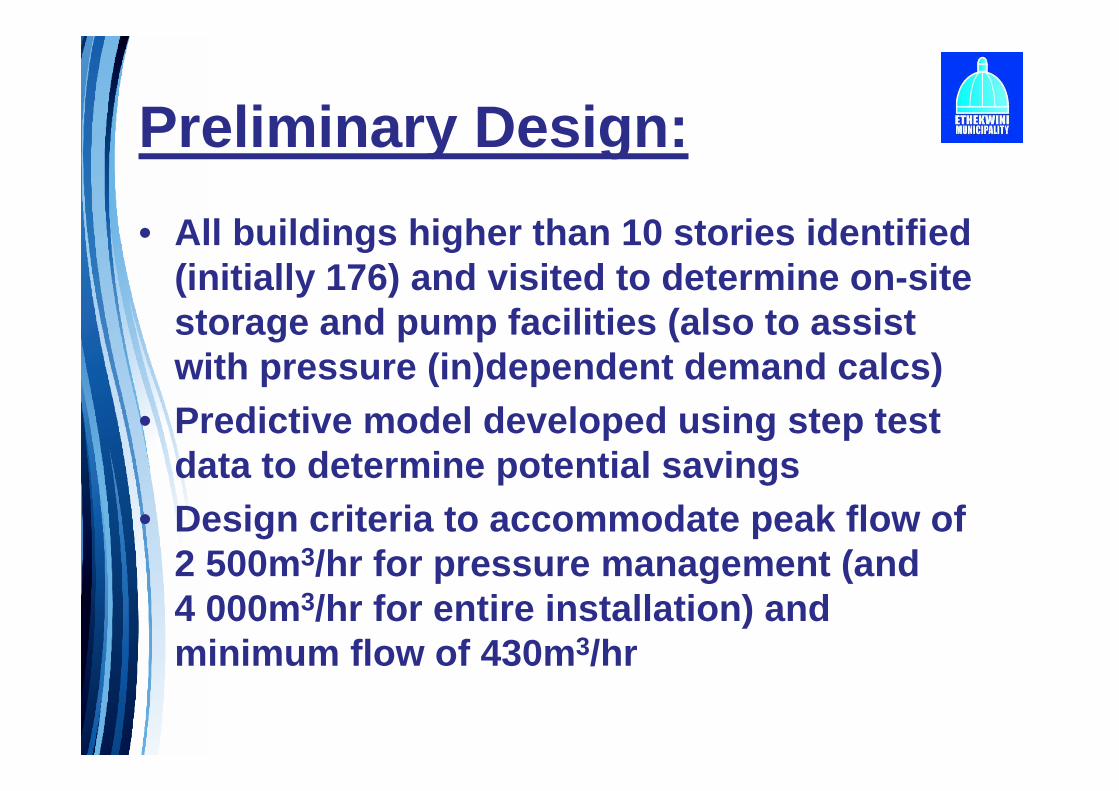
Preliminary Design:
• All buildings higher than 10 stories identified (initially 176) and visited to determine on -site storage and pump facilities (also to assist with pressure (in)dependent demand calcs)
• Predictive model developed using step test data to determine potential savings
• Design criteria to accommodate peak flow of 2 500m3/hr for pressure management (and 4 000m3/hr for entire installation) and minimum flow of 430m 3/hr

PRV Station Design:


Inside PRV Station

Bylaw Considerations:
• Neither pressure nor flow guaranteed• National Building Regulations apply• Customer responsible for on -site
boosting, storage and fire -fighting• Normally work to 20m – 30m residual
head• All “sensitive ” customers had to be
inspected

Bylaw Considerations:Montille ReservoirT WL 73 m AMSL
Tallest building – 28 stories
Focus height:> 10 stories
Minimum level of service:20 m residual (6 stories)
Required residualFire fighting head: 15 m

Customer Relations:• Press release in media (articles & legal
notice) – 9 month warning• Hand-delivered letters to affected
customers – 6 month warning• Registered letters to all affected
customers – 3 month warning• Non-compliant buildings identified &
handed over to Client (NRW and Fire Chief)

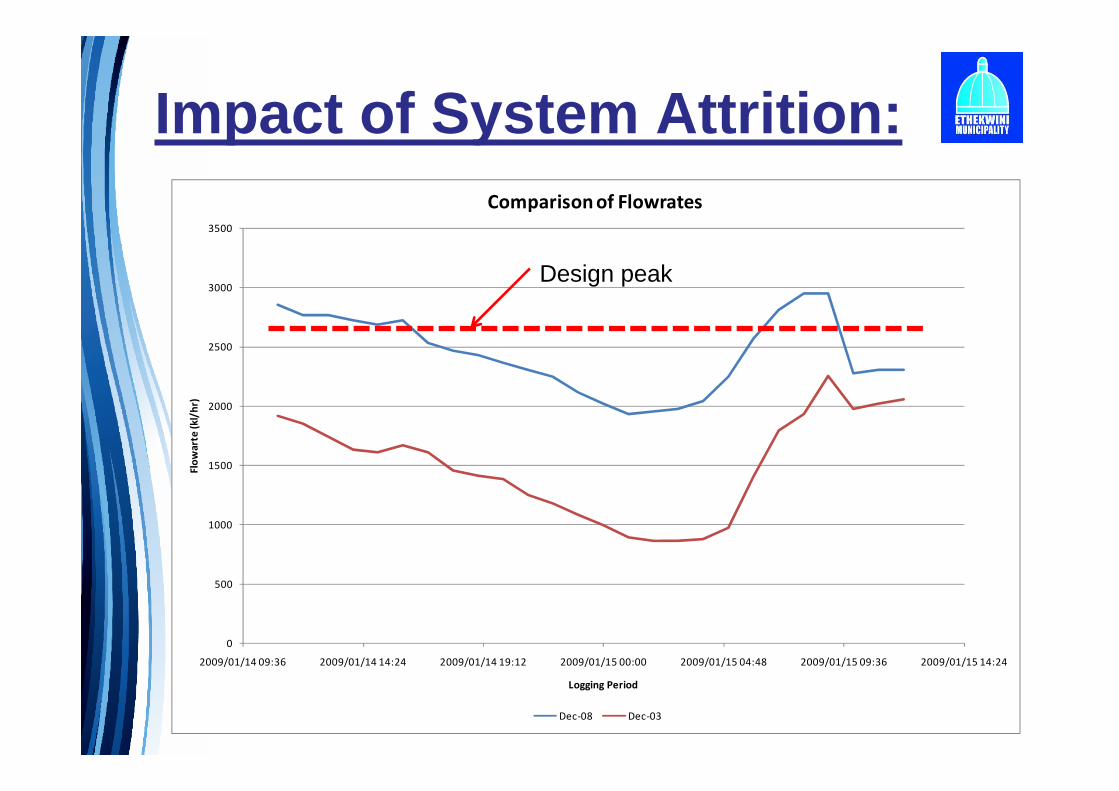
Impact of System Attrition:Why decision delays can be counter-productive……
• From prelim design to pre-commissioning, average supply pressures in the CBD had deteriorated, on average, 31%, with the worst loss of average pressure being 47%, from the oldest baseline measurements from 2003
• The minimum night flow to the CBD had increased from 860m 3/hr to 1 935m 3/hr over the same time period, a deterioration of 124%
• Billed volumes had not increased in five years• PRV eventually commissioned in February 2009
0
500
1000
1500
2000
2500
3000
3500
2009/01/14 09:36 2009/01/14 14:24 2009/01/14 19:12 2009/01/15 00:00 2009/01/15 04:48 2009/01/15 09:36 2009/01/15 14:24
Flo
wa
rte
(k
l/h
r)
Logging Period
Comparison of Flowrates
Dec-08 Dec-03
Design peak
Impact of System Attrition:

Commissioning Delays:Leak Detection and Step -Testing• High water table affected by tides• Multiple services (storm water)• High noise pollution• Three unsuccessful surveys conducted• Because of environment, contractors
reluctant to commit to confirming leaks through traditional methods

1
2
987
6
54
3

Commissioning Delays:
Customer Non -Compliance• Of 185 buildings inspected:
• 36 – no booster pumps• 4 – booster pumps not working• 9 – no rooftop storage
• “Dry commissioning” run multiple times –confirmed non-compliant customers

CustomerNon-Compliance:

Commissioning Delays:Main Line vs Customer Pressure• All design was based on main line
pressures (at hydrants)• Occasionally hydrant pressures were
higher than internal building pressures• Condition of service connection pipework
required further investigation – original samples inconclusive, but eventually replaced large number of connection pipes

Commissioning Delays:Fires• Three tests were aborted at the last minute
due to fires in CBD as could not afford to create perception that pressure reduction adversely affects fire-fighting capacity
• Field measurements were taken during two of the fires – system coped, but control adjusted
• Documented fire hydrant tests completed


Mains Replacement:
• Simultaneous mains replacement programme underway
• Aim to replace approx 3 000km of AC mains across Durban
• Condition assessment of mains in CBD accelerated
• Confirmed deterioration of joints and fittings• 29 km of existing pipe replaced through pipe
cracking with HDPE pipe• All service connection pipes replaced
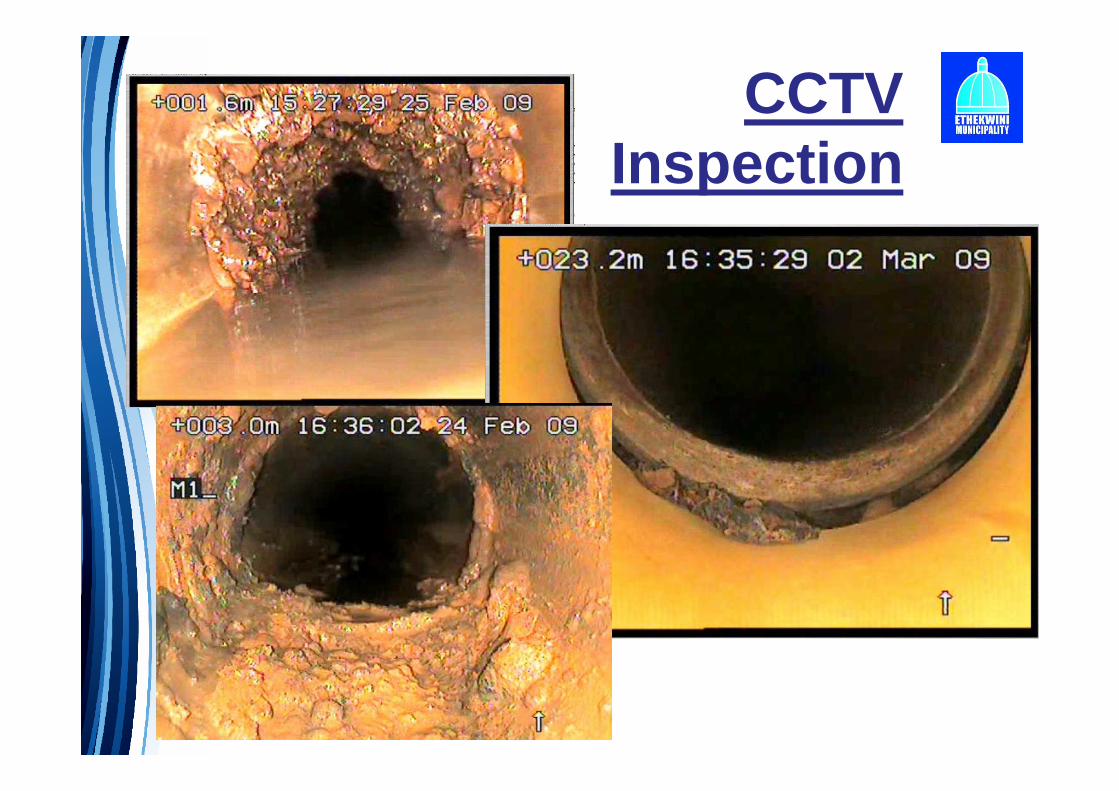
CCTV Inspection

Pipe cracking
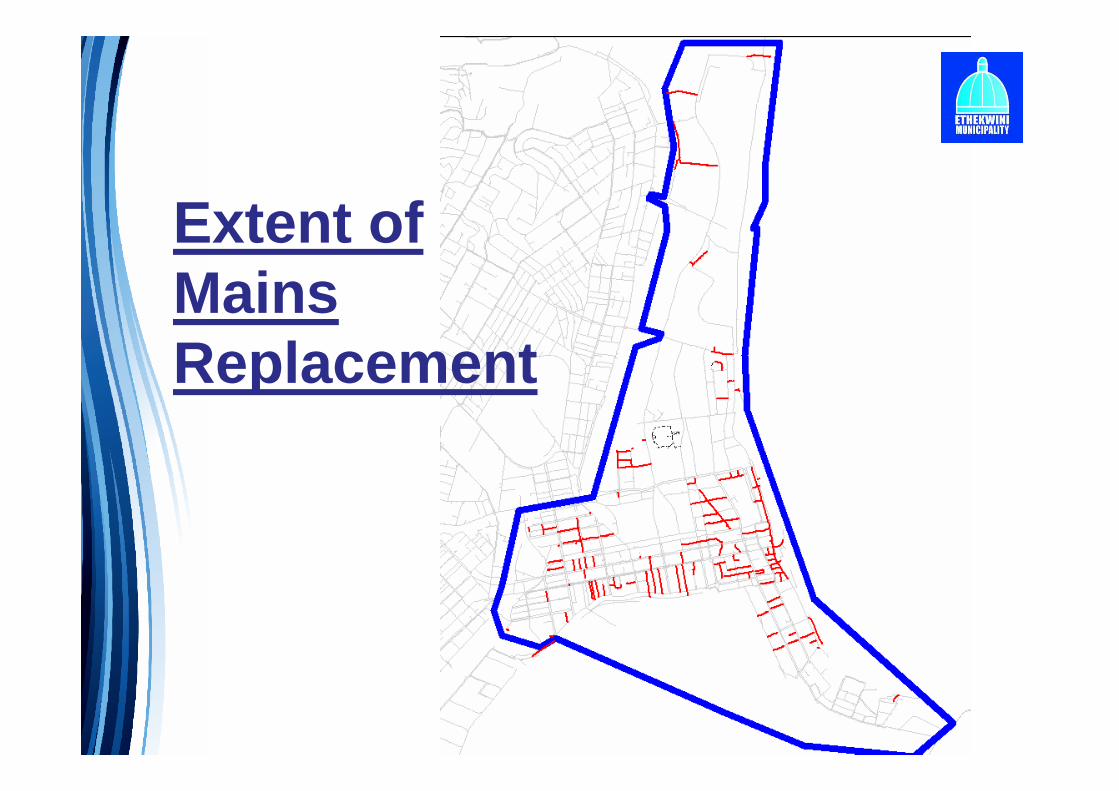
Extent of Mains Replacement

Billing Improvement/ Apparent Loss Reduction• Concerns around accuracy of billing data
and sales volumes• Particular concerns around illegal
connections• Decided a field -based approach to discover
all meters on a door-to -door inspection and correlate with billing database
• Additional information obtained from mains replacement – CCTV footage, service connection replacement and pipe recommissioning

Billing Improvement/ Apparent Loss Reduction
Count % of Total
Total Records 1407 100.0
Resolved - In COINS 973 69.2
Resolved - COINS Updated 20 1.4
Resolved - Other* 46 3.3
Illegal Connections 6 0.4
Fault Number has been Issued ** 78 5.5
Fault Number is to be Issued ** 141 10.0
Miscellaneous Follow Up Required *** 78 5.5
Currently Being Processed by WH/MG 65 4.6

PRV Commissioning:
• Because of rapid deterioration in reticulation condition and burst frequency, pressure management system commissioned, but not as designed
• At first commissioning, actual flows were greater than PM design flows
• 400mm & 300mm dia PRV ’s open during peak periods (approx 5 hours)
• 400mm dia flow -modulated control in place for balance of 24-hour period

Results to Date:
0
500
1000
1500
2000
2500
3000
16
:50
17
:05
17
:20
17
:35
17
:50
18
:05
18
:20
18
:35
18
:50
19
:05
19
:20
19
:35
19
:50
20
:05
20
:20
20
:35
20
:50
21
:05
21
:20
21
:35
21
:50
22
:05
22
:20
22
:35
22
:50
23
:05
23
:20
23
:35
23
:50
00
:05
00
:20
00
:35
00
:50
01
:05
01
:20
01
:35
01
:50
02
:05
02
:20
02
:35
02
:50
03
:05
03
:20
03
:35
03
:50
04
:05
04
:20
04
:35
04
:50
05
:05
05
:20
05
:35
05
:50
Min
imu
m N
igh
t F
low
Ra
te (
m3
/h
r)
Typical Time Period
Durban CBD PRV Project
Demand Flow Trends
14-Jan-09 04-Feb-09 18-Feb-09 14-Mar-09 18-Mar-09 25-Mar-09 20-Aug-09 29-Nov-09
Baseline MNF: 1865m3/hr
PRV Commissioning - Stage 1
MNF: 760m3/hr
MNF reduction since baseline:
1 378m3/hr or 24,8Ml/day
Qadd reduction since baseline:
32,2 Ml/day
Qmax reduction since baseline:
1395 m3/hr
PRV Commissioning - Stage 2
MNF: 531m3/hr
PRV Commissioning - Stage 3
MNF: 487m3/hr

Results to Date:
• Qmnf (baseline): 860m 3/hr• Qmnf (pre-commissioning): 1 865m 3/hr• Qmnf (post-commissioning): 487m 3/hr• 5,2Ml/day reduction in real losses from initial
baseline – annual savings R6,5m• 24,8Ml/day reduction in real losses in 6
months – annual savings R32m. Impact at Umgeni Water sales level immediately evident
• Bursts practically eliminated• ROI – 6 weeks

Results to Date
• “Artificial Intelligence” controller installed• Self-learning and optimizing controller• Remote critical point monitoring• Additional 1 Ml/day savings• ROI 6 weeks


Lessons Learned:
• There is a fine balance between satisfying customers
(ensuring a preconceived level of service) and
optimizing the distribution/operational efficiency of
a supply system
• When simultaneously implementing all real loss
reduction interventions (as captured in the 4-
component approach to reducing real losses), some
strategic direction and coordination is necessary
otherwise “collateral damage” from one intervention
may offset or negate the impact of other
interventions

Lessons Learned:
• Never underestimate the need or extent of field
work and getting your hands dirty
• Customers and general public must be treated firmly
but fairly in the interests of ensuring sustained water
supply for all
• Nothing beats simple communication and
engagement with customers once the need and
reasons are explained, people are more
accommodating

Thank You!