reducing nitrous oxide emissions while supporting subtropical cereal production...
TRANSCRIPT

REDUCING NITROUS OXIDE EMISSIONS WHILE SUPPORTING SUBTROPICAL CEREAL PRODUCTION IN OXISOLS
Massimiliano De Antoni Migliorati
M.Sc.
Submitted in fulfilment of the requirements for the degree of
Doctor of Philosophy
Institute for Future Environments
School of Earth, Environmental and Biological Sciences
Science and Engineering Faculty
Queensland University of Technology
March 2015

2

3
KEYWORDS
Nitrous oxide, Oxisols, subtropical, cereal cropping systems, sustainable
intensification, fertilisation, legumes, nitrification inhibitor, DMPP, urea, maize,
sorghum, wheat, alfalfa, sulla, nitrogen management practices, nitrogen uptake,
nitrogen recovery efficiency, 15N tracer technique, automated greenhouse gas
measuring system, climate change, DAYCENT.


5
ABSTRACT
Mitigating climate change and achieving food security are two of the key
challenges of the twenty-first century. By 2050 the world’s population is forecast to
be over a third larger than at present and cereal demand is predicted to increase by
60%. Pronounced intensification of cereal production is expected to take place in
Oxisol-dominated tropical and subtropical regions (Smith et al., 2007), identifying
the need for more nitrogen (N) to be supplied to these agroecosystems. It is
established however that boosting food production though an increased use of
synthetic N fertilisers will result in sharp increases in greenhouse gas emissions,
especially N2O. It is therefore critical to identify alternative N management strategies
aimed at supporting future intensification of tropical and subtropical agricultural
systems without provoking an increase of N2O emissions from these agroecosystems.
A unique dataset of high-frequency observations and N recovery data referring to
multiple cropping seasons, crop rotations and N fertiliser strategies was gathered in
this study using a fully automated greenhouse gas measuring system, 15N-tracer
techniques and a process-based biogeochemical model. The aim was to define
profitable, agronomically viable and environmentally sustainable N management
strategies to support future intensification of cereal production on subtropical
Oxisols. This study also aimed to improve the current understanding of
environmental factors influencing N2O emissions in fertilised Oxisols and to assess
the magnitude and main pathways of fertiliser N losses that limit crop yields in these
agroecosystems. These aims were achieved by way of the following three research
objectives:
• Evaluating the use of urea coated with the DMPP nitrification inhibitor to
limit N2O emissions and increase grain yields compared to conventional
urea.
• Evaluating whether the introduction of a legume phase in a cereal-based
crop rotation can reduce the reliance of cereal crops on synthetic N
fertilisers and minimise N2O emissions during the cereal cropping phase.

6
• Use model simulations to test the hypotheses underlining the first two
objectives and assess the sustainability of the N management practices
investigated under a broader spectrum of environmental conditions.
The results of this study indicate that in subtropical Oxisol-based cereal cropping
systems there is significant scope for limiting N2O losses and improving the fertiliser
N use efficiency, especially during the summer cropping season. The warm and
humid soil conditions of subtropical summers, associated with the higher N fertiliser
rates applied to summer crops, were conducive for greater nitrification and
denitrification rates compared to winter. Among the N management strategies tested,
the application of DMPP urea was the most effective in minimising N2O losses
during a summer crop.
The slower nitrification rates of DMPP urea enabled a better match between the
NO3- released by the fertiliser and plant N uptake, resulting in almost no
accumulation of NO3- in the topsoil and therefore effectively limiting denitrification.
As a result, the use of DMPP urea on average abated N2O emissions by 65%
compared to the same N rate with conventional urea. However, the enhanced
synchrony of DMPP urea was limited to the top soil and DMPP did not increase crop
productivity compared to conventional urea. The high clay content of the soil
prevented fertiliser N losses via deep leaching, while the low soil C and the short-
lived periods of soil saturation limited N2 emissions. Consequently, a good
synchrony between fertiliser N supply and plant uptake was achieved with
conventional urea and DMPP had limited scope to increase the N use efficiency of
the urea-based fertiliser.
The introduction of a legume phase in a cereal-based crop rotation showed
multiple environmental and agronomic advantages. Planting the cereal crop shortly
after incorporating legume residues ensured the synchrony between the crop N
uptake and the mineral N progressively released by the decomposition of the
residues. This practice avoided the accumulation of relevant amounts of N in the soil
that would have been available to nitrifying and denitrifying microorganisms, and
N2O emissions were primarily a function of the N fertiliser rate applied. As a result,
decreasing the synthetic N rates applied to the cereal in the legume crop rotation led
on average to a 35% reduction of N2O losses. Concurrently, the incorporation of

7
legume residues provided enough readily available N to support crop development
and grain yields were not affected by the reduction of synthetic N.
Overall, the results of this study reveal that the use of DMPP urea in subtropical
Oxisols cannot be regarded as an economically viable standard farming practice to
reduce N2O emissions unless governmental incentive policies are established.
Conversely, introducing a legume phase in cereal-based crop rotations is the most
effective N management practice under the environmental and agronomical
perspective. If properly implemented, this strategy enables to significantly reduce
N2O emissions, achieve high yields, reduce the costs associated with N fertilisation
and provides greater flexibility to the farmer in terms of timing and rate of fertiliser
application. The results of this study will contribute to define N management
practices for the sustainable intensification of subtropical cereal production.


9
TABLE OF CONTENTS
Keywords ................................................................................................................................................ 3
Abstract ................................................................................................................................................... 5
Table of Contents .................................................................................................................................... 9
List of Figures ....................................................................................................................................... 13
List of Tables ........................................................................................................................................ 17
List of Abbreviations ............................................................................................................................. 19
Publications Incorporated into the Thesis ............................................................................................. 21
Statement of Original Authorship ......................................................................................................... 23
Acknowledgements ............................................................................................................................... 25
CHAPTER 1: INTRODUCTION ..................................................................................................... 27 1.1 Background and significance ..................................................................................................... 27
1.2 The problem statement ............................................................................................................... 28
1.3 Research aim and objectives ...................................................................................................... 31
1.4 Thesis outline ............................................................................................................................. 33
CHAPTER 2: BACKGROUND AND LITERATURE REVIEW .................................................. 37
2.1 N2O and global warming............................................................................................................ 38 2.1.1 Global warming: trends and predicted impacts on agriculture ....................................... 38 2.1.2 Causes of global warming and relevance of N2O ........................................................... 41 2.1.3 Factors controlling N2O production ................................................................................ 45
2.2 N2O emissions from tropical and subtropical cereal cropping systems ..................................... 49 2.2.1 Intensification of tropical and subtropical cereal production .......................................... 49
2.3 Alternative N management strategies to reduce N2O emissions and sustain subtropical cereal production ............................................................................................................................................. 53
2.3.1 Nitrification inhibitors .................................................................................................... 55 2.3.2 Introducing legumes in cereal-based cropping systems .................................................. 56
2.4 Quantifying N2O emissions and REfN in subtropical cereal agroecosystems ............................. 58 2.4.1 Measuring N2O emissions .............................................................................................. 59 2.4.2 Measuring REfN .............................................................................................................. 61 2.4.3 Modelling N2O emissions and cereal production ........................................................... 62
2.5 Summary and implications ........................................................................................................ 69
CHAPTER 3: INFLUENCE OF DIFFERENT NITROGEN RATES AND DMPP NITRIFICATION INHIBITOR ON ANNUAL N2O EMISSIONS FROM A SUBTROPICAL WHEAT-MAIZE CROPPING SYSTEM (PAPER 1) ...................................................................... 75 3.1 Abstract ...................................................................................................................................... 75
3.2 Introduction ................................................................................................................................ 76
3.3 Materials and Methods ............................................................................................................... 78 3.3.1 Study site ........................................................................................................................ 78 3.3.2 Experimental design ....................................................................................................... 82 3.3.3 Continuous N2O measurements ...................................................................................... 87 3.3.4 Ancillary measurements ................................................................................................. 88 3.3.5 Calculations and statistical analysis ................................................................................ 89

10
3.4 Results ....................................................................................................................................... 91 3.4.1 Environmental and soil conditions ................................................................................. 91 3.4.2 N2O emissions ................................................................................................................ 92 3.4.3 Plant yields and plant N contents .................................................................................... 96
3.5 Discussion .................................................................................................................................. 96 3.5.1 Factors influencing N2O emissions in wheat and maize ................................................. 96 3.5.2 Effects of reduced N fertiliser rates on N2O emissions and yields ................................. 99 3.5.3 Effects of DMPP application on soil mineral N and N2O emissions ............................ 100 3.5.4 N2O emission factors and N2O intensities .................................................................... 102
3.6 Conclusions ............................................................................................................................. 104
CHAPTER 4: LEGUME PASTURES CAN REDUCE N2O EMISSIONS INTENSITY IN SUBTROPICAL CEREAL CROPPING SYSTEMS (PAPER 2) ................................................. 109 4.1 Abstract .................................................................................................................................... 109
4.2 Introduction ............................................................................................................................. 110
4.3 Materials and Methods ............................................................................................................. 112 4.3.1 Local climate and soil characteristics ........................................................................... 112 4.3.2 Experimental set-up ...................................................................................................... 112 4.3.3 Cropping histories ........................................................................................................ 113 4.3.4 Sorghum establishment and management ..................................................................... 114 4.3.5 Measurement of N2O and CO2 emissions ..................................................................... 116 4.3.6 Calculation of N2O and CO2 emissions ........................................................................ 118 4.3.7 Auxiliary measurements ............................................................................................... 120 4.3.8 Statistical analysis ........................................................................................................ 122
4.4 Results ..................................................................................................................................... 123 4.4.1 Environmental conditions ............................................................................................. 123 4.4.2 Seasonal variability of soil conditions .......................................................................... 124 4.4.3 N2O emissions .............................................................................................................. 126 4.4.4 CO2 emissions .............................................................................................................. 130 4.4.5 Crop biomass, grain production and N uptake ............................................................. 131
4.5 Discussion ................................................................................................................................ 133 4.5.1 N2O emissions from cropped soils after termination of a pasture phase ...................... 133 4.5.2 Factors influencing N2O emissions and yields ............................................................. 133 4.5.3 N fertilisation rates ....................................................................................................... 134 4.5.4 Synchrony of N supply ................................................................................................. 135 4.5.5 Cropping history ........................................................................................................... 136
4.6 Implications for managing N2O emissions from a cereal crop following a legume pasture .... 138
CHAPTER 5: ASSESSING AGRONOMIC AND ENVIRONMENTAL IMPLICATIONS OF DIFFERENT N FERTILISATION STRATEGIES IN SUBTROPICAL GRAIN CROPPING SYSTEMS IN OXISOLS (PAPER 3) .............................................................................................. 143
Abstract ............................................................................................................................................... 143
5.1 Introduction ............................................................................................................................. 144
5.2 Materials and Methods ............................................................................................................. 146 5.2.1 Study site ...................................................................................................................... 146 5.2.2 First investigation (nitrification inhibitor trial) ............................................................. 147 5.2.3 Second investigation (legume N trial) .......................................................................... 149 5.2.4 Samples collection, preparation and analysis ............................................................... 150 5.2.5 Ancillary measurements ............................................................................................... 151 5.2.6 Calculations and statistical analysis .............................................................................. 152
5.3 Results ..................................................................................................................................... 153 5.3.1 First investigation ......................................................................................................... 153 5.3.2 Second investigation ..................................................................................................... 157
5.4 Discussion ................................................................................................................................ 158 5.4.1 Fertiliser as source of crop N ........................................................................................ 158

11
5.4.2 Crop N recoveries and N losses .................................................................................... 159 5.4.3 Implications .................................................................................................................. 163
5.5 Conclusions .............................................................................................................................. 164
CHAPTER 6: LEGUMES OR NITRIFICATION INHIBITORS TO REDUCE N2O EMISSIONS IN SUBTROPICAL CEREAL CROPPING SYSTEMS? (PAPER 4) ................... 169
Abstract ............................................................................................................................................... 169
6.1 Introduction .............................................................................................................................. 170
6.2 Materials and Methods ............................................................................................................. 172 6.2.1 Study site and experimental design .............................................................................. 172 6.2.2 Crop development and fertiliser N recovery ................................................................. 175 6.2.3 N2O emissions and ancillary measurements ................................................................. 176 6.2.4 DAYCENT biogeochemical model .............................................................................. 176 6.2.5 Model initialisation, calibration and validation ............................................................ 177 6.2.6 N management scenarios .............................................................................................. 179 6.2.7 Calculations and Statistical analysis ............................................................................. 179
6.3 Results ...................................................................................................................................... 181 6.3.1 Model validation ........................................................................................................... 181 6.3.2 N management scenarios .............................................................................................. 188
6.4 Discussion ................................................................................................................................ 190 6.4.1 Model performance ....................................................................................................... 190 6.4.2 Scenarios and best N management practices ................................................................ 193
6.5 Conclusions .............................................................................................................................. 197
CHAPTER 7: DISCUSSION AND CONCLUSIONS ................................................................... 169
7.1 Overall study findings .............................................................................................................. 199
7.2 Economic implications ............................................................................................................. 207
7.3 Recommendations for future research ..................................................................................... 211
7.4 Conclusions .............................................................................................................................. 213
BIBLIOGRAPHY ............................................................................................................................. 199


13
LIST OF FIGURES
Figure 2-1 - (a) Observed global mean temperature anomalies (relative to the mean of 1961−1990) calculated from 1850 to 2012 using three independents datasets. Top panel reports annual mean values, while in the bottom panel are depicted the 10-year average values including the estimates of uncertainty. (b) Map representing the observed surface temperature changes from 1901 to 2012. (Hartmann et al., 2013). .......... 39
Figure 2-2 - Predicted variations in global surface temperature for the rest of the 21st century relative to the period 1986–2005. (IPCC, 2013). ................................................................. 40
Figure 2-3 - Atmospheric concentrations of the three main long-lived greenhouse gases over the last 2000 years. Increases since about 1750 are attributed to human activities in the industrial era. (Cubasch et al., 2001). ............................................................................. 43
Figure 2-4 - Observed and predicted globally averaged N2O concentrations from 1950 to 2035. The shading shows the largest model projected range of global annual N2O concentrations from the first IPCC assessment report (FAR, 1990), second IPCC assessment report (SAR, 1996), third IPCC assessment report (TAR, 2001), and from three different emission scenarios presented in the fourth IPCC assessment report (AR4, 2007). (Cubasch et al., 2013). ......................................................................... 44
Figure 2-5 - The processes of nitrification and denitrification. The numbers indicate enzyme reactions, i.e., 1: ammonium monooxygenase; 2: hydroxylamine oxidoreductase; 3: nitrite oxidoreductase; 4: nitrate reductase; 5: nitrite reductase; 6: NO reductase; 7: N2O reductase. (Conrad, 2001). ........................................................................................... 46
Figure 2-6 - Relationship between water-filled pore space (WFPS) of soils and the relative fluxes of nitrogen gases from nitrification and denitrification. (Bouwman, 1998b). ........... 48
Figure 2-7 - Current maize (above), sorghum (centre) and wheat (below) yields in tropical and subtropical countries of Central and Latin America, Africa and Asia. Yields are expressed in Mt ha-1. (Ericksen et al., 2011). ....................................................................... 51
Figure 2-8 - Global distribution of Oxisols. (USDA-NRCS). ............................................................... 52
Figure 2-9 - Cultivation potential for drier-climate cereal crops (e.g. maize, sorghum and wheat) in the tropics. Cultivation potential is calculated as the ‘‘agro-climatically attainable yield’’ for each rainfed crop as a percentage of the global maximum for that crop. (Phalan et al., 2013). ............................................................................................ 52
Figure 2-10 - Example of synchrony (a) and asynchrony (b) between crop N demand (grey line) and N supply (black line). Adapted from Crews and Peoples (2005). ......................... 54
Figure 2-11 - Global N fertiliser consumption by product. (IAEA, 2008). ........................................... 55
Figure 2-12 - Automated closed static chamber during the sampling campaign in wheat (see Chapter 3). The automated sampling unit and the analytical equipment are both housed in the white trailer seen in the background. Photo credit: Massimiliano De Antoni Migliorati. ................................................................................................................. 60
Figure 2-13 - Schematic diagram of DNDC model structure. (Giltrap et al., 2010). ............................ 64
Figure 2-14 - Visual representation of the APSIM simulation framework with individual crop and soil modules, module interfaces and the simulation engine. (Keating et al., 2003). ................................................................................................................................... 66
Figure 2-15 - Conceptual diagram of the DAYCENT ecosystem model. (Del Grosso et al., 2011). ................................................................................................................................... 68

14
Figure 3-1 - Global distribution of humid subtropical climate zones. The red mark indicates the location on the experiment. (Peel et al., 2007). .................................................................... 80
Figure 3-2 - Monthly mean maximum and minimum temperatures at Kingaroy research station. Values are calculated using observations from 1905 to present. (Australian Bureau of Meteorology website). ..................................................................................................... 80
Figure 3-3 - Mean monthly rainfall (mm) at Kingaroy research station. Values are calculated using observations from 1905 to present. (Australian Bureau of Meteorology website). ............................................................................................................................... 81
Figure 3-4 - Soil ammonium and nitrate contents (0-30 cm) for four fertilisation treatments during the wheat (a, b) and maize (c, d) seasons in Kingaroy (Queensland, Australia) in 2011/12. Arrows indicate the timing of N fertiliser applications. .................................... 85
Figure 3-5 - Minimum and maximum daily air temperatures, soil temperatures (0-30 cm), rainfall and irrigation events at Kingaroy (Queensland, Australia) in 2011/12. ................... 91
Figure 3-6 - Daily soil N2O fluxes and water-filled pore space (WFPS, 0-30 cm) for Control (CNT), Adjusted N fertiliser rate (CONV-ADJ), Conventional (CONV) and Conventional with DMPP (CONV-DMPP) treatments during the wheat (a) and maize (b) seasons in Kingaroy (Queensland, Australia). Arrows indicate the timing of N fertiliser applications. N2O emissions in panel (a) and (b) are reported using different scales. .................................................................................................................... 94
Figure 3-7 - Cumulative N2O fluxes (a) and daily soil N2O fluxes, water-filled pore space (WFPS, 0-30 cm), soil temperatures (0-30 cm) (b) for the four fertilisation treatments in a wheat-maize rotation at Kingaroy (Queensland, Australia) in 2011/12. Arrows indicate the of N fertiliser applications. ................................................... 97
Figure 4-1 - Minimum and maximum daily air temperatures, soil temperatures (0-30 cm), rainfall and irrigation events at Kingaroy (Queensland, Australia) during the sorghum season. ................................................................................................................. 123
Figure 4-2 - Daily soil N2O fluxes and water-filled pore space (WFPS, 0-30 cm) for the four treatments during the sorghum season in Kingaroy (Queensland, Australia). Arrows indicate the timing of N fertiliser applications. .................................................................. 124
Figure 4-3 - Soil ammonium (a) and nitrate (b) contents (0-30 cm) for the four treatments during the sorghum seasons in Kingaroy (Queensland, Australia). Arrows indicate the timing of N fertiliser applications. ................................................................................ 125
Figure 4-4 - 95% confidence intervals of N2O fluxes in the different treatments during the period of highest emissions (December 2012-March 2013) in Kingaroy (Queensland, Australia). Confidence intervals are displayed using different scales. Arrows indicate the timing of N fertiliser applications. ..................................................... 127
Figure 4-5 - Daily soil N2O fluxes measured in the row (R) and inter-row (IR) chambers for the L70 (a), L0 (b), G100 (c) and G0 (d) treatments during the period of highest emissions (December 2012-March 2013) in Kingaroy (Queensland, Australia). Arrows indicate the timing of N fertiliser applications. Graphs are in different scales. ..... 129
Figure 4-6 - Daily soil CO2 fluxes and water-filled pore space (WFPS, 0-30 cm) for the four treatments during the sorghum season in Kingaroy (Queensland, Australia). Arrows indicate the timing of N fertiliser applications. .................................................................. 131
Figure 5-1 - Water filled pore space (WFPS) measured at 0-30 cm, soil temperature (0-30 cm) and rainfall and irrigation events during the wheat, maize and sorghum seasons at Kingaroy research station, Queensland, Australia. Arrows indicate the time of application of 15N-labelled fertiliser. .................................................................................. 153
Figure 5-2 - Soil mineral N levels (NH4+ + NO3
-) in the top 30 cm for the four treatments during the wheat, maize and sorghum seasons at Kingaroy research station. Arrows indicate the time of application of 15N-labelled fertiliser. .................................................. 154
Figure 5-3 - 15N-labelled fertiliser recovered in the soil by depth increment during the wheat, maize and sorghum seasons. Depth increments in maize were the same of wheat. Error bars indicate the standard errors. .............................................................................. 155

15
Figure 5-4 - Mean cumulative crop and soil recoveries and losses of 15N-labelled fertiliser for the four treatments during the wheat, maize and sorghum seasons. ................................... 161
Figure 6-1 - Measured and simulated volumetric soil water content for three layers (0–10 cm, 10–20 cm, 20–30 cm) and rainfall/irrigation events during the wheat-maize (a, b, c) and sorghum (d, e, f) seasons at the Kingaroy research station, Australia. ........................ 181
Figure 6-2 - Measured and simulated soil ammonium and nitrate contents (0-10 cm) for the eight fertilisation treatments during the wheat-maize (a, b, c, d) and sorghum (e, f, g, h) seasons in Kingaroy, Australia. Arrows indicate the timing of N fertiliser applications. ....................................................................................................................... 182
Figure 6-3 - Measured (mean ± SD) and simulated aboveground biomass (expressed as dry matter) for the eight fertilisation treatments during the wheat-maize (a, b, c, d) and sorghum (e, f, g, h) seasons in Kingaroy, Australia. .......................................................... 183
Figure 6-4 - Daily N2O fluxes for the eight treatments during the wheat-maize (a, b, c, d) and sorghum (e, f, g, h) seasons in Kingaroy, Australia. Arrows indicate the timing of N fertiliser applications. ......................................................................................................... 187


17
LIST OF TABLES
Table 3-1 - Main soil physical and chemical properties of the experimental site at Kingaroy research station, Queensland, Australia. ............................................................................... 81
Table 3-2 - N fertilisation rates and amount of irrigation water applied on a wheat-maize rotation at Kingaroy research station in 2011 -2012. ........................................................... 83
Table 3-3 - Seasonal and estimated annual N2O average fluxes, N2O cumulative fluxes, emission factors, plant N uptake, grain yield and N2O intensities (mean ± SE, n=3) as a function of the four fertilisation treatments. Means denoted by a different letter indicate significant differences between treatments (p<0.05). ............................................. 95
Table 3-4 - Correlation between daily N2O emissions and measured soil/environmental parameters for the wheat and maize season. Soil parameters refer to the first 30 cm of soil profile. ....................................................................................................................... 98
Table 4-1 - Main soil physical and chemical properties of surface 30 cm of soil profile for the two cropping histories (mean ± SE, n=3) at the beginning of the sorghum season at Kingaroy research station, Queensland, Australia. ............................................................. 113
Table 4-2 - Details of crop rotations and farming operations for the four treatments at Kingaroy research station. .................................................................................................................. 115
Table 4-3 - Seasonal N2O average fluxes, cumulative N2O fluxes, N2O intensities (mean ± SE, n=3), emission factors and cumulative CO2 fluxes as a function of the four treatments. Means denoted by a different letter indicate significant differences between treatments (p<0.05). ............................................................................................. 128
Table 4-4 - Significance of treatment effect (applied fertiliser rate and cropping history) on N2O emissions and grain yields during the sorghum season. ............................................. 130
Table 4-5 - Sorghum grain yield (expressed as dry weight), above ground biomass (expressed as dry weight), harvest index, total N uptake (mean ± SE, n=3) and recovery efficiency of fertiliser N in the crop (REfN) as a function of the four treatments. Means denoted by a different letter indicate significant differences between treatments (p<0.05). ........................................................................................................... 132
Table 5-1 - Main soil physical and chemical properties (0-30 cm) of the experimental site at Kingaroy research station, Queensland, Australia .............................................................. 147
Table 5-2 - Times of application and N rates of labelled and unlabelled fertilisers during the two investigations at Kingaroy research station, Queensland, Australia ............................ 148
Table 5-3 - Dry matter, plant N derived from 15N-labelled fertiliser (Ndff) and recovery of added 15N measured at the end of the two investigations (mean ± SD, n=3). Statistically significant differences are denoted ................................................................. 156
Table 6-1 - Times of application and N rates of isotopically labelled and unlabelled fertilisers during the two investigations at Kingaroy research station, Queensland, Australia. .......... 174
Table 6-2 - Measured (mean ± SD) and DAYCENT simulated N2O fluxes, grain yield, aboveground (AG) plant biomass, aboveground plant N uptake, N2O emission factors and N2O intensities in the treatments tested during the wheat and maize cropping seasons at Kingaroy (Queensland). ..................................................................... 184
Table 6-3 - Measured (mean ± SD) and DAYCENT simulated N2O fluxes, grain yield, aboveground (AG) plant biomass, aboveground plant N uptake, N2O emission factors and N2O intensities in the treatments tested during the sorghum cropping seasons at Kingaroy (Queensland). .................................................................................... 185

18
Table 6-4 - DAYCENT simulated grain yields, N2O fluxes, cumulative N losses, aboveground (AG) plant N uptake, N2O emission factors and N2O intensities for twelve N management scenarios at Kingaroy (Queensland) using daily weather data from 1999 to 2013 (mean ± SD). Means denoted by a different letter indicate significant differences between treatments (p<0.05). .......................................................................... 189

19
LIST OF ABBREVIATIONS
AEfN Agronomic Efficiency of Fertiliser N AgMIP Agricultural Model Intercomparison and Improvement
Project C Carbon C:N Carbon-to-Nitrogen ratio CO2 Carbon dioxide DMPP 3, 4-dimethylpyrazole phosphate EEF Enhanced Efficiency Fertilisers EF Emission Factor FAO Food and Agriculture Organization (UN) REfN Recovery Efficiency of Fertiliser N GHG Greenhouse Gas GWP Global Warming Potential IPCC Intergovernmental Panel on Climate Change (UN) N Nitrogen N2 Dinitrogen N2O Nitrous oxide NH2OH Hydroxylamine NH3 Ammonia NH4
+ Ammonium NO Nitric oxide NO2
- Nitrite NO3
- Nitrate NI Nitrification Inhibitor O2 Oxygen SOC Soil Organic Carbon SOM Soil Organic Matter WFPS Water Filled Pore Space


21
PUBLICATIONS INCORPORATED INTO THE THESIS
De Antoni Migliorati M, Scheer C, Grace PR, Rowlings DW, Bell M, McGree J
(2014). Influence of different nitrogen rates and DMPP nitrification inhibitor on
annual N2O emissions from a subtropical wheat–maize cropping system. Published
in Agriculture, Ecosystems & Environment, 186, 33-43.
De Antoni Migliorati M, Bell M, Grace PR, Scheer C, Rowlings DW, Liu S
(2015). Legume pastures can reduce N2O emissions intensity in subtropical cereal
cropping systems. Published in Agriculture, Ecosystems & Environment, 204, 27-39.
De Antoni Migliorati M, Bell M, Grace PR, Rowlings DW, Scheer C,
Strazzabosco A (2014). Assessing the agronomic and environmental implications of
different N fertilisation strategies in subtropical grain cropping systems in Oxisols.
Published in Nutrient Cycling in Agroecosystems, 100, 369-382.
De Antoni Migliorati M, Parton WJ, Del Grosso SJ, Grace PR, Bell M,
Rowlings DW, Scheer C. Legumes or nitrification inhibitors to reduce N2O emissions
in subtropical cereal cropping systems? Submitted to Agriculture, Ecosystems &
Environment on 24 February 2015.


23
STATEMENT OF ORIGINAL AUTHORSHIP
The work contained in this thesis has not been previously submitted to meet
requirements for an award at this or any other higher education institution. To the
best of my knowledge and belief, the thesis contains no material previously
published or written by another person except where due reference is made.
Signature: __________________________________________________
Date: 9th March 2015
QUT Verified Signature


25
ACKNOWLEDGEMENTS
I would like to thank my supervisors Professor Peter R. Grace, Professor Mike J.
Bell and Dr Clemens Scheer for providing me with the opportunity to study such an
interesting topic. I thank them for their encouragement, guidance and assistance
throughout the term of this research project.
I would also like to thank the following organisations for their significant
contributions towards my PhD:
• The Queensland University of Technology and the Institute for Future
Environments for providing the scholarship;
• The Federal Department of Agriculture and the Australian Grains
Research and Development Corporation (GRDC) as funding bodies of the
National Agricultural Nitrous Oxide Research Program (NANORP);
• The Queensland Department of Agriculture, Fisheries and Forestry
(QDAFF) for providing the field site, the machinery and the staff for the
farming operations.
I am extremely grateful to Gary Harch, Karyn Gonano, the whole HEEM team
and the Kingaroy crew for their professional, technical - and often physical - help
during these three great years.
A very special thank-you to my dad, Daniele, my mum, Gigliola, my brother,
Giovanni, and, most of all, to my wife Alice for her love, encouragement and
unwavering support. This thesis is dedicated to her.

26

27
Chapter 1: Introduction
1.1 Background and significance
Agriculture in the twenty-first century faces unprecedented challenges. The
coming decades will demand agricultural systems to provide adequate food supply to
a growing world population without increasing the already elevated anthropic
pressure on natural resources. Increasing food production without provoking
unacceptable levels of environmental damage is not however just an extremely
complex problem, is also a matter of urgency. By 2050, less than forty years from
now, global agricultural production will have to double to meet the increasing
demand of a world population forecast to be over a third larger than at present
(Godfray et al., 2010; Tilman et al., 2011).
A major contribution to the increased global calorie demand will come from
cereals, which contribute 50% of daily energy intake worldwide and up to 70% in
some developing countries (Kearney, 2010). As a result, global cereal demand is
predicted to increase by 60% (FAO, 2009). Specifically, virtually all the increase in
cereal consumption will come from the tropical and subtropical regions of Africa,
South America and Asia (Alexandratos and Bruinsma, 2012), where the vast
majority of future global demographic growth is projected to take place (UNFPA,
2011).
It is recognised that future increases in cereal production should be achieved
through augmenting current crop yields (intensification) rather than converting more
land to cultivation (extensification) (Godfray et al., 2010; Foley et al., 2011; Phalan
et al., 2011). This will result in increasing pressure on cereal cropping systems in the
tropics and subtropics, where productivity will need to be maximised to meet the
needs of those countries. The increase in tropical and subtropical cereal production
will be supported largely by farming systems conducted in Oxisols (USDA Soil
Taxonomy), the most common soil type in these regions (Fageria and Baligar, 2008).

28
Oxisols occupy 46% and 23% of soil area in the tropics and subtropics,
respectively (von Uexküll and Mutert, 1995; Buol and Eswaran, 1999; Thomas and
Ayarza, 1999) and, together with Ultisols, are the soil type where half of the world’s
population currently lives (Yang et al., 2004). The fact that Oxisols have low natural
fertility and moderately high susceptibility to degradation can limit crop yields in
these agricultural systems. However, many of these constraints can be amended with
modern technologies and, when managed with correct agronomic practices, Oxisols
are capable of high productivity levels. This, in conjunction with the favourable
climatic conditions of tropics and subtropics, makes Oxisols capable of supporting
multiple cropping cycles each year.
Due to their extent and potential productivity, Oxisols are today regarded as the
most extensive agricultural frontier in the world (Borlaug and Dowswell, 1997),
which means that if appropriate agronomic techniques are implemented, the quantity
of cereal produced in these soils will significantly contribute to meeting future grain
demand.
1.2 The problem statement
Nitrogen (N) deficiency is one of the major factors limiting crop production in
Oxisols. For example, Sánchez and Salinas (1981) have estimated that in tropical and
subtropical regions of the American continent soil N deficiency is a major
agricultural constraint in over 90% of Oxisols. N deficiency results in an inability of
Oxisols to sustain continuous crop production (Fageria and Baligar, 1995) and as
such the addition of sufficient quantities of fertiliser N becomes a key factor to
enable the intensification of cereal production in these agroecosystems.
It is widely recognised that both the manufacture and use of synthetic N fertilisers
in crop production generate substantial environmental threats (Tilman et al., 2002;
Crews and Peoples, 2004; Jensen et al., 2012). The synthesis and transport of N
fertilisers are associated with high fossil fuel requirements and every year are
responsible for the emission of over 300 Tg of carbon dioxide (CO2), the primary
greenhouse gas emitted through human activities (Barker et al., 2007). Once applied
in the field, fertiliser N can be lost via soil erosion, runoff, nitrate (NO3-) leaching or

Introduction
29
gaseous emissions into the atmosphere in the form of ammonia (NH3), mono-
nitrogen oxides (NOx), dinitrogen (N2) and nitrous oxide (N2O). The majority of
these compounds are identified as pollutants and their emissions in the environment
can cause severe damage both on a local and global scale (Crews and Peoples, 2004;
Goulding, 2004).
Amongst these environmental threats, the emission of significant amounts of N2O
is arguably one of the most important. The environmental relevance of N2O
emissions resides both in terms of its elevated global warming potential (298 times
that of CO2 over a 100 year time horizon (Myhre et al., 2013)) and its contribution to
the depletion of the ozone layer in the stratosphere (Ravishankara et al., 2009).
Agricultural soils are the main anthropogenic source of N2O emissions, contributing
approximately 50% of the global human-derived N2O emissions (Ehhalt et al., 2001;
Syakila and Kroeze, 2011; Smith et al., 2012). Numerous studies on agricultural soils
have proven a clear correlation between N2O emissions and N fertilisation, with
increasing N2O fluxes corresponding to increasing N fertilisation rates (Matthews,
1994; Kroeze et al., 1999; Bouwman et al., 2002a; Del Grosso, 2006; Butterbach-
Bahl et al., 2013; Shcherbak et al., 2014).
Reducing the contribution of agriculture to global warming is paramount since
numerous studies indicate that increased temperatures and climate change will likely
have a negative impact on tropical and subtropical agriculture and therefore food
production in these regions (Alexandratos and Bruinsma, 2012; Hoffmann and
UNCTAD secretariat, 2013). In fact, if specific mitigation strategies are not
implemented, climate change is expected to cause a decrease in average yields
ranging between 15% and 30% in the next 70 years (Hoffmann and UNCTAD
secretariat, 2013). This decline will be particularly acute in the tropical and
subtropical regions of Sub-Saharan Africa, South Asia and Central America, the
territories that are most exposed to climate change (Ericksen et al., 2011). It is
critical therefore to identify alternative N management strategies to support future
intensification of tropical and subtropical agricultural systems without exacerbating
N2O emissions from these agroecosystems. Critically, these strategies will have to be
profitable for the farmer and transferable to both low- and high-income cropping
systems in order to guarantee their widespread adoption.
30
One proposed method to sustain high crop productivity while limiting N2O
emissions is the application of fertilisers coated with nitrification inhibitors. Coating
urea-based fertilisers with nitrification inhibitors has been shown in some cases to
improve yields through reducing the amount of N lost via leaching, nitrification or
denitrification (Linzmeier et al., 2001a; Pasda et al., 2001; Hatch et al., 2005). On
the other hand, nitrification inhibitors are expensive and on average increase
fertilisation costs by 10% (Weiske, 2006; Eagle et al., 2012). Moreover, their
agronomic efficiency is affected by soil properties and climatic conditions, and
several authors have reported no significant yield increase when using fertilisers
coated with nitrification inhibitors (Díez López and Hernaiz, 2008; Liu et al., 2013).
Alternatively, the reintroduction of legumes in cereal-based cropping systems has
been suggested as one possible strategy to reduce the synthetic N inputs required and
consequently to decrease N2O emissions due to synthetic N fertilisers (Jensen and
Hauggaard-Nielsen, 2003; Emerich and Krishnan, 2009). However, the efficacy of
this strategy depends on site-specific environmental conditions and in some cases
elevated N2O emissions have been reported after the incorporation of legume
residues (Jensen et al., 2012).
To date, research has focused primarily on the agronomic and environmental
efficacy of these N management strategies in temperate agroecosystems. Even
though the technical feasibility of increasing cereal production in Oxisols has
attracted considerable research interest over the last decade (Fageria and Baligar,
2001; Calegari et al., 2008; Fageria and Baligar, 2008), efforts have focused on the
correction of the key constraints of these soils (soil acidity, available phosphorus and
soil organic matter). This means that data on N2O emissions from tropical and
subtropical cereal systems in Oxisols are still sparse and the efficacy of the
abovementioned N management strategies in these environments remains unclear.
Quantifying N2O emissions in these agroecosystems is made even more critical by
the fact that the warm and humid conditions typical of tropical and subtropical
summers can potentially exacerbate N2O losses from fertilised soils (Bouwman et al.,
2002b; Stehfest and Bouwman, 2006). Together, these issues confirm that research
on alternative means of intensification is crucial to avoid the increase of future
tropical and subtropical cereal production through an overuse of synthetic N, which
will increase N2O emissions from these agroecosystems.
Introduction
31
1.3 Research aim and objectives
The primary aim of this study was to define profitable, agronomically viable and
environmentally sustainable N management strategies to support future
intensification of cereal production in Oxisols. Established with a focus on
subtropical conditions, this study also aimed to extend the current understanding of
environmental factors influencing N2O emissions in fertilised Oxisols and to
determine the magnitude and main pathways of fertiliser N losses that limit crop
yields in these agroecosystems. These aims were achieved by way of the following
three research objectives.
Objective 1 – Evaluate the use of urea coated with a nitrification inhibitor to
limit N2O emissions and increase grain yields compared to conventional urea.
The hypothesis underlying this objective was that nitrification inhibitors decrease
N2O emissions both directly, via slowing the nitrification rates, and indirectly, by
reducing the amount of NO3- available to denitrifying microorganisms. By reducing
N movements beyond the rooting zone, nitrification inhibitors can increase the
synchrony between fertiliser-derived NO3- and plant uptake, and therefore increase
yields compared to conventional urea.
Objective 2 – Evaluate whether the introduction of a legume phase in a cereal-
based crop rotation can reduce the reliance of cereal crops on synthetic N fertilisers
and minimise N2O emissions during the cereal cropping phase.
In this case, the hypotheses were: i) the N mineralised from legume residues can
substantially reduce the synthetic N input required by the following cereal crop and
therefore limit the “direct” N2O emissions due to mineral fertilisation, and ii) N2O
losses due to the mineralisation of legume residues can be minimised via
synchronising the release of N derived from the residues with the N demand of the
subsequent cereal crop.

32
Objective 3 – Assess the sustainability of the N management practices
investigated in Objectives 1 and 2 under a broader spectrum of fertiliser N rates and
environmental conditions.
This objective was identified by the fact that the data collected in this study were
influenced by the specific seasonal weather conditions encountered during the
monitored cropping seasons. Moreover, some of the abovementioned hypotheses
could not be completely verified using only field measurements. The hypothesis
underlying this objective were that a simulation approach can be used to i) assess the
validity and robustness of the hypotheses underlying the previous two objectives, and
ii) improve the understanding of the environmental factors driving N2O emissions
and crop productivity in subtropical cereal cropping systems.
This study was conducted at a research station managed by the Australian
Department of Agriculture, Fisheries and Forestry in South-East Queensland,
Australia, in consideration of three main factors. In the first instance, the
experimental site needed to be located in a region dominated by Oxisol-type soils.
Secondly, the necessity of replicating the farming practices adopted in cereal-based
agroecosystems required the experiments to be performed in close collaboration with
an organisation able to perform field operations. Lastly, the constant maintenance
needed by the instruments used in this study required the field study to be located in
close proximity to the Queensland University of Technology.
The study, funded by the Australian Grains Research and Development
Corporation, involved two years of field experiments carried out in close
collaboration with local research structures and agronomists. While conducted in a
subtropical region (Cfa, according to Köppen climate taxonomy (Peel et al., 2007)),
the insight into N fertiliser dynamics and N2O losses provided by this study is also
valid for tropical cereal production systems in Oxisols. This is because the mild, dry
winters and the warm, humid summers typical of Cfa-type climate are very similar to
the tropical Aw-type, the climate where the vast majority of tropical cereal
production is carried out globally (Chapter 2.2). Significantly, the two summer
seasons monitored in this study were characterised by exceptionally elevated rainfall

Introduction
33
events (Chapters 3.4.1 and 4.4.1), providing even greater similarity to tropical
summer cropping conditions and increasing the possibility of elevated N losses.
This is the first study on subtropical Oxisols to establish a comprehensive dataset
on N2O emissions and fertiliser N dynamics referring to multiple cropping seasons,
crop rotations and N fertilisation strategies. This research constitutes a unique
framework aimed at establishing agronomically viable and environmentally
sustainable N management strategies to support future intensification of subtropical
cereal production. The results of this study are largely transferable to similar
cropping systems in tropical regions and as such can contribute to define sustainable
N management practices valid for these environments.
1.4 Thesis outline
The investigation on N2O emissions and fertiliser N dynamics presented in this
thesis consists of seven chapters. Chapter 2 follows the introduction and sets the
context of this study, analysing the topics related to N2O emissions and sustainable
intensification of cereal production in the subtropics. The thesis is based on
publications, and following is a description of the four papers that together address
the overall objectives of the study.
The first paper (Chapter 3) addresses the first objective of the study and compares
the influence of conventional urea and urea coated with a nitrification inhibitor on
seasonal N2O emissions and grain yields. The efficacy of these fertilisation strategies
was tested under different environmental conditions by applying the two fertilisers to
a winter and a summer cereal crops. The outcomes of the study were threefold,
namely to:
1. Generate baseline information on environmental factors influencing N2O
emissions, to be used as a reference case to define operational details for the
design of the experiments addressing objective 2.
2. Quantify the magnitude of seasonal N2O emissions in these agroecosystems
using different synthetic N fertilisers.

34
3. Determine which cropping season presents the greatest scope for limiting
N2O emissions in these agroecosystems.
The results of this first study were published in:
De Antoni Migliorati M, Scheer C, Grace PR, Rowlings DW, Bell M, McGree J
(2014). Influence of different nitrogen rates and DMPP nitrification inhibitor on
annual N2O emissions from a subtropical wheat–maize cropping system. Agriculture,
Ecosystems & Environment, 186, 33-43.
The second paper (Chapter 4) addresses the second objective of the study and
evaluates the reintroduction of legumes in cereal cropping systems as a strategy to
reduce synthetic N inputs and diminish the N2O intensity of the cereal phase. The
results described in the first paper (Chapter 3) highlighted that N2O emissions during
the winter season were minimal. The second paper therefore focused exclusively on
evaluating alternative N management practices in a summer cereal crop. The cereal
crop was planted after a legume pasture, and N2O emissions and yields were
compared to those of the same cereal in rotation with a non-leguminous pasture. The
outcomes of this experiment were to:
1. Confirm the average magnitude of seasonal N2O intensities in these
agroecosystems when legumes are not included in the crop rotation.
2. Assess the environmental and agronomic advantages and limitations of using
legumes in the crop rotation to reduce the synthetic N requirements of the
cereal.
The results of this second study were published in:
De Antoni Migliorati M, Bell M, Grace PR, Scheer C, Rowlings DW, Liu S
(2015). Legume pastures can reduce N2O emissions intensity in subtropical cereal
cropping systems. Agriculture, Ecosystems & Environment, 204, 27-39.

Introduction
35
The third paper (Chapter 5) complements the previous two papers by assessing the
N recoveries of the N managements strategies investigated. This paper analyses the
results of a multi-season 15N tracer recovery experiment conducted on the same
cereal crops monitored in the investigations described in the first and second papers
(Chapter 4 and 5, respectively). The outcomes of the field study described in this
paper were to:
1. Compare the fertiliser N recoveries of the different fertilisation strategies
tested in this study.
2. Determine the main pathways of fertiliser N losses that limit N recovery in
subtropical Oxisols.
3. Identify the most effective strategies to reduce fertiliser N losses and increase
fertiliser N recovery in these agroecosystems.
The results of the third paper were published in:
De Antoni Migliorati M, Bell M, Grace PR, Rowlings DW, Scheer C,
Strazzabosco A (2014). Assessing the agronomic and environmental implications of
different N fertilisation strategies in subtropical grain cropping systems in Oxisols.
Nutrient Cycling in Agroecosystems, 100, 369-382.
The fourth paper (Chapter 6) addresses the third objective of the study. In this
paper, the entire dataset collected during this multi-season study was used to validate
the DAYCENT biogeochemical model and evaluate how variations in seasonal
weather conditions and fertiliser N rates can affect the agronomic and environmental
performances of these N management practices. The aim of the investigation was to
provide agronomists, researchers and policy-makers with an exhaustive evaluation of
the N management strategies assessed in this study.

36
The results of this study have been submitted to:
De Antoni Migliorati M, Parton WJ, Del Grosso SJ, Grace PR, Bell M, Rowlings
DW, Scheer C. Legumes or nitrification inhibitors to reduce N2O emissions in
subtropical cereal cropping systems? Agriculture, Ecosystems & Environment on 24
February 2015.
The thesis closes with Chapter 7, which synthesises the outcomes from all four
papers and discusses the overall study findings. The practical implications and
limitations of the study are analysed, discussing also the future research needs and
the main findings of this study.

37
Chapter 2: Background and Literature Review
The release of vast amounts of N2O in the atmosphere has significant
repercussions on the environment. The relevance of this molecule in terms of climate
change is analysed in section 2.1, with special focus on its impacts on global
warming (section 2.1.2) and the factors regulating its emissions in the atmosphere
(section 2.1.3). Specifically, N fertilisation plays a fundamental role in the increase
of N2O in the atmosphere, making agricultural soils the main contributor to
anthropogenic N2O emissions. Worldwide, the vast majority of fertiliser N is used to
grow cereals, which demand is predicted to escalate in tropical and subtropical
regions in response to future demographic growth. The challenges of enabling the
intensification of agricultural systems in the tropics and subtropics without
exacerbating N2O emissions from these agroecosystems are identified in section
section 2.2.
N2O emissions represent a loss of fertiliser N and indicate inefficiency in the
fertilisation process. Consequently, N management strategies aimed at minimising
N2O losses collimate with those aimed at maximising the recovery efficiency of
fertiliser N in the crop (REfN). Achieving elevated REfN is therefore paramount for
the sustainability and profitability of these strategies, a claim examined in section
2.3.
The use of nitrification inhibitors (section 2.3.1) and introduction of legumes in
the crop rotation (section 2.3.2) are among the most promising N management
strategies to maximise REfN. However, these strategies are highly dependent on local
climate and soil conditions, and little data are available for tropical and subtropical
regions. The accurate quantification of N2O losses and REfN in tropical and
subtropical cereal cropping systems is therefore crucial to assess the sustainability
and profitability of N management strategies. The different approaches for measuring
N2O emissions and REfN values at field scale are analysed in section 2.4, where the

38
potential of process-based models in testing the N management strategies at greater
temporal and spatial scales is also examined.
The key points of the review are summarised in section 2.5, focusing on the
implications of future intensification of cereal production in the subtropics and the
urgent need for research to develop sustainable and profitable N management
practices for these agroecosystems.
2.1 N2O and global warming
2.1.1 Global warming: trends and predicted impacts on agriculture
Tropospheric air temperatures over land and oceans have increased dramatically
over the last 100 years (Figure 2-1) and analyses of the Planet’s radiative budget
indicate a net positive energy imbalance resulting in an increased global heat content
of the Earth system. In its latest report (Hartmann et al., 2013), the International
Panel for Climate Change (IPCC) corrected the previous analysis, stating that the
total increase between the average temperature of the 1850–1900 period and the
2003–2012 period was 0.78 [0.72 to 0.85] °C. This was a further increment of
+0.04°C and +0.18°C compared to the estimates presented in the previous IPCC
reports for the period 1906-2005 (Forster et al., 2007) and 1901-2000 (Ehhalt et al.,
2001), respectively. Critically, these results highlight that the average tropospheric
temperature of the last three decades has been successively higher than that of any
preceding decade since 1850.

Background and Literature Review
39
Figure 2-1 - (a) Observed global mean temperature anomalies (relative to the mean of 1961−1990) calculated from 1850 to 2012 using three independents datasets. Top panel reports annual mean values, while in the bottom panel are depicted the 10-year average values including the estimates of uncertainty. (b) Map representing the observed surface temperature changes from 1901 to 2012. (Hartmann et al., 2013).

40
Importantly, IPCC projections indicate with a high confidence that the average
temperature of the troposphere will continue to increase in the 21st century.
Predictions of changes in the climate system are made using different climate models
that simulate changes based on a set of scenarios called Representative Concentration
Pathways (RCPs). For example, the tropospheric temperature increase for the period
2016–2035 is expected to be in the range of 0.3°C to 0.7°C relative to 1986–2005.
Compared to the same reference period, the surface temperature increase for the
interval 2081–2100 is projected to vary between 0.3°C and 4.8°C, depending on the
RCP employed for the simulation (Figure 2-2). Overall, almost all RCP scenarios
predict the global surface temperature of the end of the 21st century to exceed at least
1.5°C relative to the period 1850 to 1900. Importantly, all RCP scenarios except one
predict that global surface warming will continue beyond 2100.
Figure 2-2 - Predicted variations in global surface temperature for the rest of the 21st century relative to the period 1986–2005. (IPCC, 2013).
The variations in atmospheric average temperatures have caused a series of
modifications in various aspects of climate, a global phenomenon defined as Climate
Change. These alterations include changes in the hydrogeological cycle, the
occurrence of more frequent extreme meteorological events, or variations in
Background and Literature Review
41
atmospheric circulation patterns. For example, there is substantial evidence that on
the global scale the number of cold days and nights has decreased and the number of
warm days and nights has increased since the 1950s. Over the same period, the
incidence of heat waves and extended periods of drought have increased in large
parts of the European, Asian and Australian continents, while the extension of land
areas subject to heavy precipitation events has considerably expanded. Importantly,
many of these changes are projected to intensify in the next decades (Cubasch et al.,
2013).
In tropical and subtropical regions, significant variations are expected to occur in
the Monsoon, El Niño-Southern Oscillation and Tropical Cyclone systems. Global
monsoon precipitation is likely to strengthen in the 21st century, with sharp increases
in terms of area and intensity. Meteorological extremes, such as precipitation
intensity and consecutive dry days, are expected to augment while the overall
duration of the monsoon season will expand. Additionally, rainfall variability due to
El Niño-Southern Oscillation will intensify and the frequency of intense storms is
projected to substantially increase (Christensen et al., 2013).
Collectively, these changes will have a significant impact on agricultural systems.
Increases of surface temperature exceeding 2°C compared to those of the late 20th
century are predicted to have negative effects on yields for the three major world
crops (wheat, rice and maize) in both tropical and temperate regions (IPCC, 2014).
These effects will vary among regions and will include increased occurrence of pest
diseases, reduced water supplies and higher ozone concentration in the troposphere
(Hoffmann and UNCTAD secretariat, 2013). If mitigation strategies are not
implemented, significant negative impacts on average yields are considered likely to
occur from the 2030s. Median yield impacts up to -2% per decade will continue for
the rest of the century and after 2050 the risk of more severe impacts will intensify,
especially in the tropics and subtropics (Porter et al., 2014).
2.1.2 Causes of global warming and relevance of N2O
The Earth’s climate is determined by the energy radiated by the Sun and the
properties that influence the absorption, reflection and emission of this energy within
the Earth’s surface and atmosphere. Although changes in incoming solar energy, due
for example to variations of the Solar activity, can substantially affect the Earth’s

42
energy budget, the magnitude of these changes in the last two centuries has not been
sufficient to determine the tropospheric temperature increase described in section
2.1.1 (Cubasch et al., 2013). Changes in the properties of the Earth’s atmosphere and
surface have instead been dramatic in the last 200 years (Barker et al., 2007;
Cubasch et al., 2013). Variations in the composition of the atmosphere or alterations
of land, ocean, biosphere and cryosphere conditions can alter the Earth’s radiation
budget, producing a radiative forcing that affects climate. Radiative forcing is a
measure of the influence of a given factor in altering the balance of incoming and
outgoing energy in the Earth-atmosphere system. Positive forcing means a warming
effect, while negative a cooling effect.
Radiative forcing has increased more rapidly since the 1970s and the value
measured in 2011 was 2.29 W m-2 higher than in 1750, the year used to indicate the
beginning of the industrial revolution. It is now established with high confidence that
this increase has been caused primarily by the emission in the atmosphere of four
principal greenhouse gases (GHG): carbon dioxide (CO2), methane (CH4), nitrous
oxide (N2O), and hydrochlorofluorocarbons (HCFCs) (Solomon et al., 2007;
Cubasch et al., 2013). HCFCs emissions have however declined in the last two
decades due to their phase-out under the Montreal Protocol (1989), and their role in
the global warming will not be further examined in this study.
CO2, CH4 and N2O are defined as long-lived GHGs since their chemical stability
allows them to persist in the atmosphere over time scales of a decade to centuries.
These gases adsorb thermal radiation emitted from the Earth surface and re-radiate it
in multiple directions. The fraction of this re-radiation scattered downward conveys
heat to the lower layers of the atmosphere and to the Earth’s surface via the
mechanism called the greenhouse effect. The result is an elevation of the average
surface temperature above what it would be in the absence of the gases. The
concentration of CO2 CH4 and N2O has markedly increased in the terrestrial
atmosphere since the beginning of the industrial era (Figure 2-3), reaching levels that
substantially exceed the highest concentrations recorded in ice cores during the past
800,000 years (Trenberth et al., 2007).

Background and Literature Review
43
Figure 2-3 - Atmospheric concentrations of the three main long-lived greenhouse gases over the last 2000 years. Increases since about 1750 are attributed to human activities in the industrial era. (Cubasch et al., 2001).
The concept of Global Warming Potential (GWP) was first introduced in 1990 by
IPCC to compare the contribution of different gases to global warming. GWP is
calculated over a specific period, typically 20, 100 and 500 years, and relates the
radiative forcing of a mass of a specific gas to that of the same mass of CO2. The
relevance of N2O in terms of global warming resides both in its elevated GWP and
its increasing emission rates.
N2O has the highest GWP among long-lived GHGs, i.e. 298 times that of CO2 and
almost 14 times that of CH4 over a 100-year time horizon (Myhre et al., 2013). The
high GWP potential of N2O is due to the elevated chemical stability of this molecule,
which results in a lifetime of 114 years in the atmosphere (Montzka and Fraser,
2003), and to the high radiative forcing of N2O (Forster et al., 2007). As a result,
N2O presently contributes approximately 8.1% to the global warming effect caused
by GHGs (Myhre et al., 2013). Studies (Crutzen, 1981; Ravishankara et al., 2009)
have shown that N2O is also involved in the depletion of the stratospheric ozone

44
layer, which plays an essential role in protecting the terrestrial biosphere from the
mutagenic and carcinogenic effects of solar ultraviolet radiation.
N2O atmospheric concentration has exponentially increased in the last two
centuries (Figure 2-3): globally averaged atmospheric N2O concentration was 324.2
ppb in 2011 (Hartmann et al., 2013), a 20% increase over the value of 270 ± 7 ppb
estimated for pre-industrial levels (Prather et al., 2012). Importantly, projections
indicate that N2O concentrations will continue to rise linearly in the next decades,
unless mitigation strategies are implemented (Figure 2-4).
Figure 2-4 - Observed and predicted globally averaged N2O concentrations from 1950 to 2035. The shading shows the largest model projected range of global annual N2O concentrations from the first IPCC assessment report (FAR, 1990), second IPCC assessment report (SAR, 1996), third IPCC assessment report (TAR, 2001), and from three different emission scenarios presented in the fourth IPCC assessment report (AR4, 2007). (Cubasch et al., 2013).

Background and Literature Review
45
2.1.3 Factors controlling N2O production
N2O is produced both by anthropogenic and natural sources, the latter being
estimated to contribute between 60% and 64 % to the total N2O emissions worldwide
(Forster et al., 2007; US-EPA, 2010). Soils are the largest direct source of N2O
emissions, emitting approximately 60% of N2O produced by natural sources (US-
EPA, 2010).
In soils, N2O is produced as an obligate intermediate or a by-product of two
microbial-mediated mechanisms: nitrification and denitrification (Figure 2-5).
Nitrification occurs in aerobic conditions and consists of the oxidation of ammonium
(NH4+) to nitrate (NO3
-), while denitrification - the reduction of NO3- to nitrogen gas
(N2) - takes place in anaerobic environments. During nitrification, chemoautotrophic
bacteria oxidise N through a two-step aerobic process. In the first step bacteria of the
genera Nitrosomonas and Nitrospira oxidise NH4+ to nitrogen dioxide (NO2
-) by
using the enzyme ammonia-monooxygenase, then in the second step NO2- is
converted into NO3- by bacteria of the genus Nitrobacter (Conrad, 2001). Although
studies have shown that under certain conditions heterotrophic bacteria can be a
source of N2O, in most soils chemoautotrophic microorganisms are largely, if not
entirely, responsible for N2O losses due to nitrification (Hutchinson and Davidson,
1993; Bremner, 1997).
During denitrification, heterotrophic bacteria (such as Paracoccus denitrificans
and various species of Pseudomonas) use NO3- as a substitute of oxygen for terminal
electron acceptor, reducing NO3- to N2 (Bollmann and Conrad, 1998). N2O losses
due to denitrification can be significantly larger than those due to nitrification.
During nitrification, small amounts of N2O can be lost as a by-product of the first
step of the process, when the organisms use NO2- as an alternative electron acceptor.
During denitrification N2O is instead produced as an obligate intermediate, meaning
that if conditions are not favourable for the completion of the process, large amounts
of nitrified N can be lost as N2O and not as N2.
The nitrification and denitrification processes, and therefore the magnitude of
N2O emitted by soil, is affected by three levels of regulation (Firestone, 1989;
Bouwman, 1998a). The first level comprises the factors influencing the size of the
microbial pool, which are primarily soil N and carbon (C) availability, and soil

46
temperature. The second level includes the factors controlling the partitioning of soil
N into NO, N2O or N2, i.e. soil moisture and pH. The final level consists of those soil
properties that effect the diffusion of the gases produced in the previous steps.
Figure 2-5 - The processes of nitrification and denitrification. The numbers indicate enzyme reactions, i.e., 1: ammonium monooxygenase; 2: hydroxylamine oxidoreductase; 3: nitrite oxidoreductase; 4: nitrate reductase; 5: nitrite reductase; 6: NO reductase; 7: N2O reductase. (Conrad, 2001).
Among first-level controllers, soil N is usually the main factor limiting N2O
production. In these environments nitrification rates are in fact limited by the slow
mineralisation of N produced by the decomposition of plant and animal residues
(Dalal et al., 2003). This process is however substantially accelerated in agricultural
soils, where the addition of rapidly nitrifiable forms of N (especially NH4+-based
fertilisers such as urea) and the soil aeration caused by tillage increase the amounts
of N available to nitrifiers (Robertson and Groffman, 2007). N2O emissions due to
denitrification are instead mainly controlled by the size of the soil NO3- pool. Low
concentrations of NO3- prolong the reduction of N2O to N2 performed by denitrifying
microorganisms, decreasing therefore N2O:N2 ratio. Conversely, elevated
concentrations of NO3- almost completely inhibit this process, resulting in larger
amounts of N lost as N2O instead of N2. Denitrification rates are also affected by soil

Background and Literature Review
47
organic carbon, since denitrifying bacteria are heterotrophic and use C as a source of
energy. In anaerobic conditions therefore, the presence of high contents of soluble C
or readily decomposable organic matter can significantly increase denitrification
rates (Dalal et al., 2003; Li et al., 2005a). The effects of organic materials on
denitrification varies with their resistance to decomposition and easily decomposable
substrates such as glucose increase denitrification rates more than materials that
decompose with difficulty such as lignin (Bremner, 1997). As with other biological
processes, nitrification and denitrification are positively influenced by temperature.
Moreover the chemical processes conducted by nitrifying bacteria are slightly
modified at higher temperatures and enhanced N2O emissions have been observed at
temperatures exceeding 25°C (Dalal et al., 2003).
Amongst second-level controllers, the amount of water in the soil is the
predominant factor regulating the activity of nitrifying and denitrifying bacteria.
Nitrification is typically the main source of N2O emissions when water-filled pore
space (WFPS) is below 40% (Figure 2-6), while denitrification rates rapidly intensify
with increasing water content, becoming the predominant process over 70% WFPS
(Bouwman, 1998a; Kiese and Butterbach-Bahl, 2002; Werner et al., 2006). Above
65%-75% WFPS anaerobic conditions start to occur in the soil, promoting
denitrification and therefore the production of both N2O and N2 (Panek et al., 2000).
When soil water content exceeds 80%-90% WFPS, denitrifying bacteria can
complete the reduction of NO3-, emitting predominantly N2 as the end product of the
reaction. Consequently, the N2O:N2 ratio starts to decrease as the soil water content
exceeds 75% WFPS (Dalal et al., 2003).

48
Figure 2-6 - Relationship between water-filled pore space (WFPS) of soils and the relative fluxes of nitrogen gases from nitrification and denitrification. (Bouwman, 1998b).
The metabolic activity of both nitrification and denitrification bacteria is
negatively affected by acid soil conditions and generally highest N2O production
rates are observed at pH values between 7 and 8.5. The inhibitory effect of low pH
on the bacterial metabolic activity have been associated with the decreased
availability of organic C and mineral N under acid conditions (ŠImek and Cooper,
2002). Although the net N2O production tend to diminish at low soil pH values,
several studies (Dalal et al., 2003; Liu et al., 2010a) have reported increased N2O:N2
production ratios when soil pH was below 7. Acid soil conditions inhibit the
reduction of N2O to N2 more than the reduction of NO3- to N2O, favouring in this
way the emission of N2O over N2. Consequently, as pH increases, denitrification
products tend more or completely towards N2 production (Chapuis-Lardy et al.,
2007).
Among third-level controllers are those factors that determine the volume of soil
pores, such as texture, bulk density, aggregate stability and organic matter content.
These parameters are pivotal in regulating the soil water content and therefore soil
aeration, gas production and diffusion. For example, the higher amount of air present
in coarser soils (e.g. sandy soils) tends to favour nitrification, while the greater
quantity of water that can be stored in fine-textured soils (e.g. clay soils) promotes
denitrification (Bollmann and Conrad, 1998). The smaller pore size of fine-textured
soils also reduce the soils hydraulic conductivity, creating more persistent

Background and Literature Review
49
waterlogging conditions (Granli, 1995). Moreover, smaller pores rapidly fill with
water, creating anaerobic microsites that enable denitrification to occur at lower soil
water contents than coarse-textured soils (Parton et al., 2001).
2.2 N2O emissions from tropical and subtropical
cereal cropping systems
Agricultural soils play a fundamental role in the increase of N2O in the
atmosphere, contributing approximately 50% of global anthropogenic N2O emissions
(Smith et al., 2007). The reason for the importance of agricultural soils as a source of
N2O resides in the addition of N to support crop production. As described in section
2.1.3, the factor most commonly limiting nitrification and denitrification rates is soil
N availability. In agricultural fields, this limitation is substantially overcome when N
is supplied in the form of synthetic fertiliser, animal manure or N fixed by
leguminous crops, promoting therefore elevated N2O emission rates.
Many studies have shown a direct correlation between N2O emissions and
synthetic N fertilisation, measuring increasing N2O fluxes when agricultural soils are
fertilised with higher N rates (Bouwman et al., 2002a; Del Grosso, 2006; Shcherbak
et al., 2014). Synthetic fertiliser N can be lost from the soil-crop system also via soil
erosion, runoff and NO3- leaching, causing the hypertrophication of water bodies and
promoting indirect N2O emissions from these sources (Tilman et al., 2002; Crews
and Peoples, 2004; Jensen et al., 2012). Consequently, it is now established that the
augmented global N fertiliser use observed in the last decades played a central role in
the increase of N2O concentration the atmosphere (Penman et al., 2000; Smith et al.,
2007; Smith et al., 2014).
2.2.1 Intensification of tropical and subtropical cereal production
Worldwide consumption of synthetic N fertilisers has increased by 332% in the
last 40 years, expanding from 32 Mt yr-1 in 1970 to 106 Mt yr-1 in 2010 (FAOSTAT
website, accessed October 2014). Critically, almost 60% of worldwide N fertiliser is
used to crop cereals (Ladha et al., 2005), which are by far the world's most important

50
sources of food, via both direct human consumption and input for livestock
production (FAO, 2012). Specifically, cereals contribute on average 50% of daily
energy intake, reaching levels close to 70% in some developing countries (Kearney,
2010).
Global cereal demand is predicted to increase by 60% in the next 40 years (FAO,
2009). Nearly all of the increase in cereal consumption will come from the tropical
and subtropical regions of Africa, South America and Asia (Alexandratos and
Bruinsma, 2012), where the vast majority of future global demographic growth is
projected to take place (UNFPA, 2011). This increased demand translates into a need
to increase current tropical and subtropical cereal production by at least 60%
(Alexandratos and Bruinsma, 2012).
There is consensus that this target should be pursued though augmenting current
cereal yields to minimise the need for expanding cropland, a strategy that would
cause habitat loss and reduce biodiversity (Godfray et al., 2010; Foley et al., 2011;
Phalan et al., 2011). Average cereal yields are presently low in most tropical and
subtropical countries (Figure 2-7). This means that if future food security targets are
to be achieved, in the next decades the productivity of these cereals will need to
increase between 1.2% and 2.4% every year (Alexandratos and Bruinsma, 2012; Ray
et al., 2013).

Background and Literature Review
51
Figure 2-7 - Current maize (above), sorghum (centre) and wheat (below) yields in tropical and subtropical countries of Central and Latin America, Africa and Asia. Yields are expressed in Mt ha-1. (Ericksen et al., 2011).
Currently, tropical and subtropical cereal production occurs largely in Oxisols, the
most common soil type in these regions (Figure 2-8). Grain yields in Oxisol regions
are often limited by the constraints of these soils, namely low native N content,
reduced natural fertility, soil acidity and low levels of soil organic matter. However,
many of the chemical constraints of Oxisols can be amended with modern agronomic
technologies and since Oxisols are characterised by a favourable topography for
agriculture, suitable temperatures and sufficient moisture availability for crop growth
throughout the year, the potential productivity of these agroecosystems is among the
highest in the world (Figure 2-9).

52
Figure 2-8 - Global distribution of Oxisols. (USDA-NRCS).
Figure 2-9 - Cultivation potential for drier-climate cereal crops (e.g. maize, sorghum and wheat) in the tropics. Cultivation potential is calculated as the ‘‘agro-climatically attainable yield’’ for each rainfed crop as a percentage of the global maximum for that crop. (Phalan et al., 2013).
N fertilisation is a key factor to enable the intensification of cereal production in
Oxisols. Several studies have highlighted that N deficiency is usually the major
agricultural constraint limiting crop production in these agroecosystems (Sánchez
and Salinas, 1981), resulting in the inability of Oxisols to sustain continuous cereal
production without the provision of adequate amounts of N (Fageria and Baligar,
1995).

Background and Literature Review
53
Current N management strategies in Oxisols vary largely depending on the scale
of farming operations. For example, fertiliser N inputs are usually elevated in the
large commercial farms of central Brazil (Fageria and Baligar, 2001; Gitti et al.,
2012), North-Eastern Australia (Angus, 2001; Chen et al., 2008b) or, in some cases,
Central Africa (Cheru and Modi, 2013). On the contrary, N inputs are extremely
limited and usually insufficient in African and South American smallholder farms
due to the socioeconomic constraints that prevent smallholders to access synthetic N
fertiliser (Sánchez and Salinas, 1981; Crawford et al., 2003). Regardless of farm
scale however, in the absence of alternative N management strategies there will be
pressure to apply more synthetic N fertiliser in the attempt to boost cereal production
and meet a pressing grain demand (Denning et al., 2009; Alexandratos and
Bruinsma, 2012; Branca et al., 2013). This intensification of synthetic N fertiliser use
will result in increased N2O emissions from these agroecosystems, undermining
global efforts to limit global warming.
It is therefore critical to identify alternative N management strategies aimed at
supporting future intensification of tropical and subtropical cereal production without
causing an increase of N2O emissions from these agroecosystems. Although largely
valid also for tropical conditions, the N management strategies described in the
following sections have been selected among the most promising to support the
sustainable intensification of subtropical cereal cropping systems in Oxisols.
2.3 Alternative N management strategies to reduce
N2O emissions and sustain subtropical cereal
production
N2O emissions represent a loss of fertiliser N and indicate inefficiency in the
fertilisation process. Consequently, N management strategies aimed at minimising
N2O losses collimate with those aimed at maximising the efficiency of fertiliser N
recovery in the crop (REfN). The REfN is defined as the percentage of fertiliser N that
is taken by the crop (Ladha et al., 2005) and is intimately connected to the concept of
synchrony. Synchrony is a condition that occurs when the N released by the fertiliser
coincides with crop demand in terms of timing and amount (Figure 2-10a).

54
Asynchrony between fertiliser N supply and crop demand can result in temporary
N deficiency or in mineral N excess in the soil, resulting in conditions that can limit
crop growth or enhance N losses (Figure 2-10b). Nitrification, denitrification,
ammonia volatilisation and NO3- leaching are the major contributors to N losses
(Mosier et al., 2004a).
Figure 2-10 - Example of synchrony (a) and asynchrony (b) between crop N demand (grey line) and N supply (black line). Adapted from Crews and Peoples (2005).
Synchronising fertiliser N supply with crop uptake is therefore a key factor in
defining sustainable N management strategies to achieve the potential productivity of
subtropical cereal cropping systems. To enable their widespread adoption, these
strategies will have to be profitable for the farmer and transferable also to low-
income cropping systems, where investments and research have often been neglected
(Alexandratos, 2009; Branca et al., 2011). Urea is by far the dominant formulation
used in agriculture, due to its low costs of production, distribution, storage and
handling per unit of N (Figure 2-11). It is for this reason that this study focused on
assessing the environmental and agronomic performances of N management systems
based on the use of urea.

Background and Literature Review
55
Figure 2-11 - Global N fertiliser consumption by product. (IAEA, 2008).
2.3.1 Nitrification inhibitors
One method to synchronise fertiliser N release with the estimated plant N uptake
is the addition of nitrification inhibitors to NH4+-based fertilisers. Nitrification
inhibitors are antibiotics that slow the activity of the Nitrosomonas bacter, the genus
responsible for the oxidation of NH4+ to NO2
-. Maintaining fertiliser N in the NH4+
form reduces the chances of N to be lost via leaching or denitrification when soil
moisture conditions are elevated. Nitrification inhibitors have been reported by
several studies to substantially decrease N2O emissions and increase crop yields in
humid, high rainfall environments (Prasad and Power, 1995; Linzmeier et al., 2001a;
Pasda et al., 2001; Hatch et al., 2005). Importantly, these are the environmental
conditions that are prevalent during subtropical summers.
Among nitrification inhibitors, 3,4-dimethylpyrazole phosphate (DMPP) has been
reported as one of the most efficient in slowing nitrification and reducing N2O losses
(Weiske et al., 2001a; Weiske et al., 2001b; Liu et al., 2013). DMPP is the result of a
joint research project lead by BASF in the early 1990s to develop a new inhibitor
capable of effectively limit nitrification even when applied at low concentrations
(Zerulla et al., 2001). DMPP is usually applied at a rate of 6 g of DMPP per kg of
urea and, depending on environmental conditions, is effective in inhibiting
nitrification for a period of 4 to 10 weeks (Barth et al., 2001; Pasda et al., 2001).

56
Nitrification inhibitors though are expensive and, on average, increase fertilisation
costs by 10% (Weiske, 2006; Eagle et al., 2012). Moreover, their agronomic
efficiency is affected by soil properties and climatic conditions, and the effects on
yields have been contrasting. Positive yield responses to application of nitrification
inhibitors have been reported under conditions that favour high drainage rates (e.g.
cropping systems with intense rainfall patterns during the fertilisation period) or that
limit the synchronisation between fertiliser release and plant N uptake (e.g. when
high N fertiliser inputs are applied) (Majumdar et al., 2002; Di and Cameron, 2005;
Ma et al., 2013). Conversely, no significant yield increase with fertilisers coated with
nitrification inhibitors have been reported for fine-texture soils or low-rainfall
cropping systems even when high N fertiliser inputs were applied (Arregui and
Quemada, 2006; Díez López and Hernaiz, 2008; Liu et al., 2013).
In addition to the conflicting results on the agronomic efficiency of nitrification
inhibitors in cereal cropping systems, the vast majority of data on their effect on N2O
emissions refer to temperate regions (Linzmeier et al., 2001b; Weiske et al., 2001a)
or laboratory conditions (Khalil et al., 2009; Suter et al., 2010). As a result, the
efficacy of this fertilisation strategy in increasing cereal production and reducing
N2O emissions in subtropical environments is unclear.
2.3.2 Introducing legumes in cereal-based cropping systems
The reintroduction of legumes in cereal-based cropping systems has been
proposed as one possible strategy to reduce the environmental threats associated with
synthetic N fertiliser use and sustain cereal production (Crews and Peoples, 2004;
Jensen et al., 2012). Legume rotations have progressively become less common in
the last decades, as farmers in many regions of the world have increased their
reliance upon synthetic N fertilisers. Synthetic N fertilisers are crucial in supporting
high yields and reducing the uncertainties related to plant development by
empowering farmers with a high level of flexibility in terms of timing and amount of
N application. They also reduce the planning required by the farmer to manage the N
supplied to a given crop by enabling the elimination of the fertility-generating stage
of a rotation sequence.
Legumes however offer multiple agronomic and environmental advantages due to
their unique ability to fix atmospheric N2 in symbiosis with rhizobia bacteria. The
Background and Literature Review
57
incorporation of legume residues releases the nutrients accumulated during the
cropping phase and can therefore reduce the fertiliser N demand of the following
cereal crop, consequently decreasing N2O emissions associated with synthetic N
fertilisation. Overall, legumes are economically accessible and their use is
technically adoptable in both low- and high-income subtropical cropping systems.
An extensive review on the use of legumes to mitigate climate change (Jensen et
al., 2012) concluded that N2O emissions during the legume growing season did not
differ substantially from unplanted or non-fertilised soils. However, elevated N2O
losses were sometimes reported after the termination of legume-based ley pastures,
when crop residues were returned to the soil (Gomes et al., 2009; Pappa et al., 2011).
The low C:N ratio of legume tissues can lead to rapid mineralisation rates once
residues are incorporated into the soil. As a result, accumulation of mineral N can
occur in the soil and the readily mineralisable C from the legume residues becomes
available to support elevated denitrification rates (Jensen et al., 2012).
These N2O emissions were often measured when the field site had been left fallow
for long periods (Wagner-Riddle et al., 1997; Wagner-Riddle and Thurtell, 1998;
Pappa et al., 2011). The risk for low levels of synchronicity between N supply and
crop demand is highest when an extended fallow period follows a legume, as either
no plants are present to utilize the NO3- generated by the legumes or the demand for
N by newly sown crops is small. As a result, high amounts of mineral N can
accumulate in the soil, increasing the possibility of elevated denitrification losses.
The most viable strategy for reducing N2O emissions after the termination of
legume-based ley pastures is therefore to minimise the time that fields are left
uncropped. Typically, the highest N mineralisation rates from most legume residues
are reported to occur six weeks from incorporating the residues into the soil (Fox et
al., 1990; Becker and Ladha, 1997; Robertson, 1997; Park et al., 2010), a timeframe
that well matches the crop requirements of most subtropical cereal crops.
It must be highlighted however that the N mineralisation rates of legume residues
and the associated N2O losses are highly dependent on local climate and soil
conditions (Rochette et al., 2004), and while numerous studies have investigated
N2O emissions after the termination of legume ley pastures prior to a return to
cropping, the vast majority were conducted in temperate regions. Consequently,
scant data are available on the application of this N management strategy in Oxisols-

58
based cereal cropping systems (Wagner-Riddle and Thurtell, 1998; Baggs et al.,
2000; Robertson et al., 2000; Rochette et al., 2004; Schwenke et al., 2010).
2.4 Quantifying N2O emissions and REfN in
subtropical cereal agroecosystems
N2O fluxes and REfN are highly variable in croplands. N2O fluxes are a result of
soil microbial activity, which is influenced by site-specific soil properties, climatic
conditions and agricultural management, such as fertilisation, tillage and irrigation
practices. Significant emissions of N2O typically occur between 0 and 30 days after
applying N fertiliser and are often triggered by rain or irrigation events (Eagle et al.,
2012). Liu et al. (2010b) for example observed that almost 30% of annual N2O
emissions in cotton occurred in the one-month period following N fertilisation, while
in maize Parkin and Kaspar (2006) measured almost 50% of the cumulative annual
N2O flux during two emission pulses that followed rainfall. At a plot scale, the
spatial and temporal occurrence of N2O emissions is further complicated by the
method of fertiliser application (e.g. broadcasting vs. banding) and the type of
fertiliser used (e.g. ammonium- vs. nitrate-based, conventional vs. enhanced
efficiency fertilisers) (Eagle et al., 2012). The combination of different factors can
therefore have a considerably greater influence on N2O fluxes than the fertiliser N
rate itself, and predicting emissions merely on the basis of N input can lead to
significant errors.
As for N2O fluxes, the REfN of a given N management practice is influenced by
many factors. REfN can vary substantially among cereal cropping systems depending
on climate, crop, soil conditions as well as the rate, source, placement and timing of
fertiliser application (Ladha et al., 2005; Bruulsema et al., 2011). Obtaining accurate
measurements of N2O losses and REfN in subtropical cereal cropping systems in
Oxisols is therefore crucial to define profitable, agronomically viable and
environmentally sustainable N management strategies to support future
intensification of these agroecosystems.

Background and Literature Review
59
2.4.1 Measuring N2O emissions
N2O fluxes at a field scale can be measured using micrometeorological and
chamber-based techniques (FAO, 2001). Micrometeorological techniques allow for
great spatial integration, with fluxes typically measured for areas as large as 1-10
km2 (Dalal et al., 2003). On the other hand, these systems require large areas of a
uniformly treated crop, a feature that prevents their use for measuring emissions form
small-scale plots under different treatments. Moreover, micrometeorological
techniques are less sensitive that chamber-based techniques in measuring low fluxes
and their detection limit is affected by weather conditions.
Chamber-based techniques can be applied to fragmental landscapes and field
experiments with multiple small plots. Importantly, they are relatively inexpensive,
versatile and can measure fluxes under unstable meteorological conditions. For this
reason chambers have been the most commonly used method for measuring N2O
fluxes from agricultural soils (Denmead, 1979; Rochette et al., 1997; Breuer et al.,
2000; Kiese and Butterbach-Bahl, 2002). Chamber-based techniques can employ
either flow through or non-flow through designs, the latter being however the most
widespread (Bouwman et al., 2002a).
Non-flow through chambers, often referred to as “static chambers”, rely on the
accumulation of N2O within an open-bottomed chamber placed on the soil surface.
Gas samples are taken periodically and analysed using gas chromatographic
techniques to determine the variation of N2O concentration in time. Gas sample
collection can be conducted either manually, with samples analysed in the laboratory
(manual chamber systems), or automatically, with samples analysed directly in the
field (automated chamber systems).
Manual chamber systems have the disadvantage of being highly labour intense
and can cover relatively short measuring periods with low time resolution (at most
few daily measures per week). Automated chamber systems are capable of
measuring fluxes for an entire cropping season with sub-daily resolution. These
systems are also adaptable to a wide range of conditions and can analyse emission
rates ranging from the order of 1 μ g m-2 h-1 to more than 10 mg m-2 h-1 (Hensen et
al., 2013).

60
Briefly, automated chamber systems consist of multiple mechanically-operated
chambers linked to a sampling unit that collects and conveys the gas samples from
the chambers to an in-situ gas chromatograph (Figure 2-12). The functioning of the
automated chamber system employed in this study is detailed in Chapter 3.3.3.
Figure 2-12 - Automated closed static chamber during the sampling campaign in wheat (see Chapter 3). The automated sampling unit and the analytical equipment are both housed in the white trailer seen in the background. Photo credit: Massimiliano De Antoni Migliorati.
Automated chamber systems have the ability to capture diurnal variations in
emissions. Diurnal fluctuations in N2O emissions are affected by soil temperature
variations (Christensen, 1983; Maljanen et al., 2002) and lags of several hours
between maximum flux and maximum temperature have been reported in studies
using automated chambers. For example, Scheer et al. (2012) observed that the
diurnal variations of N2O fluxes from subtropical irrigated wheat was greater than
10-fold for some chambers. The high temporal variability of N2O emissions means
that the sampling frequency throughout a cropping season can have a profound effect
Background and Literature Review
61
on the calculation of cumulative emissions. Consequently, automated chamber
systems greatly improve the ability to measure the effects of different N management
practices.
2.4.2 Measuring REfN
The REfN of a given fertilisation strategy can be assessed using two procedures:
estimating the agronomic efficiency of fertiliser N use (AEfN) or using the 15N-tracer
technique. The AEfN procedure, also referred to as the difference method, is defined
as the extra grain yield obtained per kg of fertiliser N applied (Ladha et al., 2005).
The major limitaton of this method is the assumption that the N uptake patterns are
similar in fertilised and non-fertilised plants (IAEA, 2008), disregarding the
influence of N availability on root development (Olson and Swallow, 1984; Belford
et al., 1986). This technique also does not allow the discrimination between fractions
of the plant N originating from applied fertiliser, soil supply or irrigation water
(Smith et al., 1989).
Precise REfN measurements can be obtained using the 15N-tracer technique, also
known as 15N dilution method. This technique demands extreme accuracy during
sampling and computations, the collection of large numbers of samples, and the
availability of expensive laboratory equipment. Importantly, this method does not
need control plots and enables to distinguish between fertiliser- and soil-N taken by
the crop. In this approach, a fertiliser labelled with the 15N isotope (tracer) is added to
the soil and the percentage of fertiliser N recovered in the plant tissues or in the soil
is determined with mass spectrometry methods (IAEA, 2001). Fertiliser N losses are
calculated by subtracting the N recovered in the soil-plant system from the amount of 15N-labelled fertiliser originally applied. The amount of N that cannot be accounted
for in the monitored soil-plant system is assumed to be lost in the atmosphere (as N2,
N2O, NH3 or NOx) or via runoff and deep leaching (NO3-). It must be acknowledged
however that part of the unaccounted N can be due to errors associated with each of
the measured N sinks, resulting therefore in slight under- or overestimations of the N
losses.
When using the 15N-tracer technique, losses via NH3 volatilisation or runoff can
be minimised with the adoption of specific experimental set-ups. In this way the
amount of N lost via deep leaching can be estimated by interpolating soil water

62
content data with the fertiliser N amounts recovered in the lower layers of the soil
profile. Using these techniques, the bulk of unaccounted fertiliser N can be therefore
limited to N2O, N2 and NOx emissions, the latter being negligible from a N balance
perspective.
The adoption of the 15N-tracer technique in this study, together with the use of an
automated chamber system to determine N2O emissions, constituted a powerful
technique to calculate the overall fertiliser N budget and compare the REfN of
different N management strategies. Details on the methodology and calculations used
in this study are provided in 5.2.6.
2.4.3 Modelling N2O emissions and cereal production
Field experiments are crucial to deepen the understanding of factors regulating
N2O emissions and limiting crop production. Experiments are however conducted at
particular points in time and space and the results obtained can be generalised only to
a certain extent. Moreover, field experiments are time-consuming and expensive, and
can investigate only a limited number of treatments (Jones et al., 2003). Simulation
models have been developed to overcome these limitations so to predict nutrient
flows in the soil-plant-atmosphere system at temporal and spatial scales where it
would not be possible to implement the required measurement intensity.
Numerous approaches have been adopted for the development of models able to
predict nutrient dynamics in agroecosystems, and processed-based models are among
the most accurate. These models use a mechanistic approach to represent the
complex biophysical processes that influence greenhouse gas emissions and plant
growth, such as soil organic matter, soil water content, fertiliser N management and
plant N availability (Del Grosso et al., 2009). Processed-based models enable to
simulate N losses and assess the REfN of different fertilisation strategies, as well as to
quantify the gap between potential and actual yields (Boote et al., 1996; Ladha et al.,
2005). In this respect, models have become indispensable tools to investigate how
variations in N management practices and different environmental circumstances can
affect crop production and N2O emissions.
Few processed-based models can simulate crop yields and N2O emissions at the
field-scale (Chen et al., 2008a). Among these, only a limited number have been
tested under different environmental conditions around the globe and have potential

Background and Literature Review
63
relevance to Australian agroecosystems. For example, models such as WNMM (Li et
al., 2007; Li et al., 2008; Li et al., 2013) have been tested under Australian and
Chinese conditions but, to present, have not been extensively used in other
environments. This section examines the structure, strengths and limitations of the
three most extensively tested soil and plant simulation models currently used in the
Agricultural Model Intercomparison and Improvement Project (AgMIP website):
DNDC, APSIM and DAYCENT.
DNDC
The DeNitrification-DeComposition (DNDC) model was first developed by Li et
al. (1992) to model N2O emissions from agricultural soils in the United States (US-
EPA, 1995) and consists of two main components (Figure 2-13). The first comprises
soil climate, crop growth and decomposition submodels, and calculates soil
temperature, water content, pH fluctuations, redox potential (Eh), and nutrient
dynamics based on environmental drivers such as climate, soil properties, vegetation
and anthropogenic activity. The second component consists of the nitrification,
denitrification and fermentation submodels and simulates NO, N2O, and NH3 fluxes
based on soil variables (Chen et al., 2008a).

64
Figure 2-13 - Schematic diagram of DNDC model structure. (Giltrap et al., 2010).
The nitrification submodel controls the ratio of NH4+ nitrified to NO3
- and predicts
N losses via NO and N2O, or via plant uptake, leaching, transformation to NH3 (and
subsequent volatilisation) or adsorption onto soil clay minerals. The hourly-time-step
denitrification submodel of DNDC is activated by rain/irrigation events and
increments in soil temperatures, and simulates NO and N2O emissions based on soil
Eh, pH, dissolved organic carbon and soil NO3- (Chen et al., 2008a). Crop
development is modelled using crop-specific daily crop growth curves and is subject
to the modelled availability of water and N in the rooting zone (Li et al., 1994).
The default soil parameters in DNDC have been optimised for North-American
agroecosystems, and re-parameterisation of soil properties or even modification of
the model equations is frequently necessary when modelling cropping systems in
other regions of the world (Giltrap et al., 2010). These limitations forced many
research groups to create DNDC variants optimised for specific regions (i.e. NZ-
DNDC, UK-DNDC, China-DNDC, DNDC- Europe, BE-DNDC), cropping systems

Background and Literature Review
65
(i.e. Crop-DNDC, Rice-DNDC, Forest-DNDC) or fertiliser sources (Manure-
DNDC), resulting in 18 different versions of the same model (Global Research
Alliance Modeling Platform).
To date the DNDC model has been tested on several cropping systems in more
than 15 countries and the agreement between simulated and measured data has been
reported to vary significantly depending on climate, soil, and crop conditions (Giltrap
et al., 2010). For example, Frolking et al. (1998) observed that DNDC substantially
over- or under-predicted N2O emissions when the standard model parameterisation
was used in arid and temperate cropping systems, respectively. Overall, the main
shortcoming of the DNDC model is its high geographical specificity and the results
obtained with this model often cannot be transferred to similar cropping systems in
different climatic regions.
APSIM
The Agricultural Production Systems Simulator (APSIM) is a modelling
framework first started in 1991 with the aim of developing a farming systems
simulator able to accurately estimate crop yields and predict the long-term
consequences of farming practice on soil properties (Keating et al., 2003).
APSIM contains an array of modules for simulating crop development and yield
dynamics as well as their interactions with the soil. The APSIM‐SoilN and
SurfaceOM modules simulate the N and C dynamics at daily time-steps. N
mineralisation, N immobilisation, nitrification, denitrification, and NO3- and NH4
+
adsorption and movement are explicitly simulated in each soil layer. These N
processes are controlled by the soil water content and water movements through the
soil profile, which are simulated by the APSIM-SoilWat (Probert et al., 1998) or
APSWIM (Verburg et al., 1996) submodels (Figure 2-14).
Nitrification rates are calculated as a proportion of nitrified N by the APSIM‐
SoilN submodel and follow the Michaelis–Menten response to available soil
ammonium (Parton et al., 2001). Denitrification is modelled with the algorithm used
in the DAYCENT model (Del Grosso et al., 2000), which calculates N2O emissions
based on an N2 to N2O ratio (Thorburn et al., 2010).

66
The plant submodel simulates key physiological processes and operates on a daily
time step in response to daily weather data, soil characteristics and crop management
events. The physiological principles are the same among all plant species and only
differ in regard to the thresholds and shapes of their response functions to varying
environmental conditions (Wang et al., 2002).
Figure 2-14 - Visual representation of the APSIM simulation framework with individual crop and soil modules, module interfaces and the simulation engine. (Keating et al., 2003).
The comparison of APSIM simulations with observed crop production and soil
nutrient dynamics has been performed by many model users under a wide range of
conditions (Asseng et al., 1998; Hammer et al., 2010; Mohanty et al., 2012; Luo et
al., 2014). To date however, APSIM validation has focused mainly on the effects on
different farming practices on crop development and soil properties (Holzworth et
al., 2014). Little research has instead been conducted to test the nitrification and
denitrification components of the APSIM-SoilN model using field measurements
(Huth et al., 2010; Thorburn et al., 2010).

Background and Literature Review
67
DAYCENT
DAYCENT was first developed in 1998 as the daily time-step version of the
CENTURY biogeochemical model to explicitly represent the nitrification and
denitrification processes that lead to N2O, NOx, and N2 emissions (Parton et al.,
1998; Kelly et al., 2000; Del Grosso et al., 2001).
DAYCENT simulates exchanges of C, N and other nutrients among the
atmosphere, soil, and plants as well as farming management practices such as
cultivation, stubble management and fertiliser addition. DAYCENT includes
submodels for plant productivity, decomposition of dead plant material and soil
organic matter, soil water and temperature dynamics, and N gas fluxes (Figure 2-15).
The N gas submodel of DAYCENT simulates soil N2O and NOx gas emissions
from nitrification and denitrification as well as N2 emissions from denitrification. N
gas flux from nitrification is assumed to be a function of soil NH4+ concentration,
water content, temperature, and pH (Parton et al., 1996; Parton et al., 2001).
Nitrification increases exponentially with temperature and stabilises when soil
temperature exceeds the site-specific average high temperature for the warmest
month of the year. Nitrification rates increase linearly with soil NH4+ concentration
and a maximum of 10% of soil NH4+ can be nitrified in a day.

68
Figure 2-15 - Conceptual diagram of the DAYCENT ecosystem model. (Del Grosso et al., 2011).
Denitrification is a function of soil NO3- concentration, labile C availability,
WFPS, and soil physical properties related to texture that influence gas diffusivity
(Parton et al., 1996; Del Grosso et al., 2000). No denitrification is assumed to occur
until WFPS values exceed 50% to 60%, then denitrification increases exponentially
until WFPS reaches 70% to 80%, and stabilises as soil water content approaches
saturation. N2 and N2O emissions from denitrification are regulated by the parameter
(NO3-, labile C, WFPS) that is most limiting. Maximum daily denitrification rates
range from approximately 15% to almost 100% of soil NO3- depending on soil NO3
-
concentration. N2O emissions are calculated from total N losses due to denitrification
using a N2:N2O ratio function.
Crop growth and development are functions of nutrient availability, soil water and
temperature, shading, vegetation type, and plant phenology (Metherell et al., 1993).

Background and Literature Review
69
Net primary productivity is a function of soil water content and nutrient availability
and is divided among leafy, woody, and root compartments on the basis of plant type
and phenology.
DAYCENT was chosen for the purposes of this study because it is currently the
model that has been most extensively tested to simulate both crop production and
N2O emissions in cereal cropping systems (Del Grosso et al., 2002; Del Grosso et
al., 2005; Del Grosso et al., 2006; Del Grosso et al., 2008; Halvorson et al., 2008;
Scheer et al., 2013a) and it is currently used to estimate N2O emissions for the U.S.
National GHG Inventory (US-EPA, 2014) under the United Nations Framework
Convention on Climate Change (Del Grosso et al., 2006).
2.5 Summary and implications
Warming of the climate system is unequivocal and many of the changes observed
since the 1950s are unprecedented over decades to millennia (IPCC, 2013).
Paradoxically, agriculture is simultaneously a key driver and a major victim of global
warming. The increased average temperature of the atmosphere has already modified
various aspects of climate, such as precipitation patterns and frequency of extreme
weather events (Christensen et al., 2013). This trend is predicted to continue and
have particularly dramatic effects on tropical and subtropical agricultural systems
(Alexandratos and Bruinsma, 2012; Hoffmann and UNCTAD secretariat, 2013).
Global warming is caused by the increased concentration in the atmosphere of the
four principal greenhouse gases: CO2, CH4, N2O and CFCs. Among them, N2O has
the highest global warming potential and its emissions in the atmosphere are
constantly increasing. The application of N fertilisers is the main factor stimulating
nitrification and denitrification rates in agroecosystems (Robertson and Groffman,
2007), making agricultural soils the main anthropogenic source of N2O (Smith et al.,
2007). Worldwide consumption of synthetic N fertilisers has increased by 332% in
the last 40 years (Ladha et al., 2005) and is predicted to increase in the future, further
exacerbating N2O emissions and therefore global warming.
By 2050, global cereal demand is estimated to increase by 50% to meet the food
demand of a world population 30% larger that at present (Ray et al., 2013). Virtually

70
all the increment in cereal consumption will come from tropical and subtropical
countries (Alexandratos and Bruinsma, 2012), creating an urgent need to increase
productivity levels in these regions. This increase will be extensively sustained by
agricultural systems in Oxisols, which are the most common soil type in these
regions (von Uexküll and Mutert, 1995; Buol and Eswaran, 1999).
There is consensus that pursuing food security through a further increase in
synthetic N use would result in unacceptable levels of environmental damage (FAO,
2010; Foley et al., 2011; Tilman et al., 2011). It is therefore critical to identify
alternative N management strategies aimed at supporting future intensification of
tropical and subtropical agricultural systems without provoking an increase of N2O
emissions from these agroecosystems.
To be successful both environmentally and agronomically, these strategies will
have to maximise the recovery efficiency of fertiliser N in the crop (REfN) and,
ultimately, yield production. One proposed method to maximise REfN and minimise
N2O emissions from agricultural soils is the application of fertilisers coated with
nitrification inhibitors. Nitrification inhibitors reduce N losses both directly, via
slowing the nitrification rates and, indirectly, by reducing the amount of NO3-
available for denitrification. Among them, DMPP (3,4-dimethylpyrazole phosphate)
has often been reported to be one of the most efficient in slowing nitrification and
reducing N2O fluxes (Weiske et al., 2001a; Liu et al., 2013). Nitrification inhibitors
are however expensive and, on average, increase fertilisation costs by 10% (Weiske,
2006), while their agronomic efficiency is affected by environmental conditions and
N management practices. In fact, several authors have reported no significant yield
increase with fertilisers coated with nitrification inhibitors (Díez López and Hernaiz,
2008; Liu et al., 2013).
Alternatively, the reintroduction of legumes in cereal-based cropping systems has
been suggested as one possible strategy to reduce the amount of synthetic N required
and consequently decrease N use inefficiencies associated with elevated fertiliser N
rates (Jensen and Hauggaard-Nielsen, 2003; Emerich and Krishnan, 2009). However,
the efficacy of this strategy also depends on site-specific conditions and in some
cases elevated N2O emissions have been reported after the incorporation of legume
residues (Jensen et al., 2012).
Background and Literature Review
71
Research to date has primarily focused on assessing these N management
strategies in different soils under temperate climatic conditions. Data on REfN and
N2O emissions in tropical and subtropical cereal systems in Oxisols are therefore still
sparse and there is a urgent need for research to develop N management practices
that are environmentally sound and economically viable for the intensification of
cereal production in these agroecosystems (Fageria and Baligar, 2008).
The availability of precise N2O and N recovery field measurements, in
combination with the use of process-based biogeochemical models, is instrumental to
rigorously assess different N management strategies under varying seasonal
conditions. This study, through the use of state of the art technology, adopts a holistic
approach to investigate the environmental and agronomic implications of using
fertilisers coated with nitrification inhibitors and reintroducing legumes in crop
rotations to enable a sustainable intensification of cereal production in the subtropics.

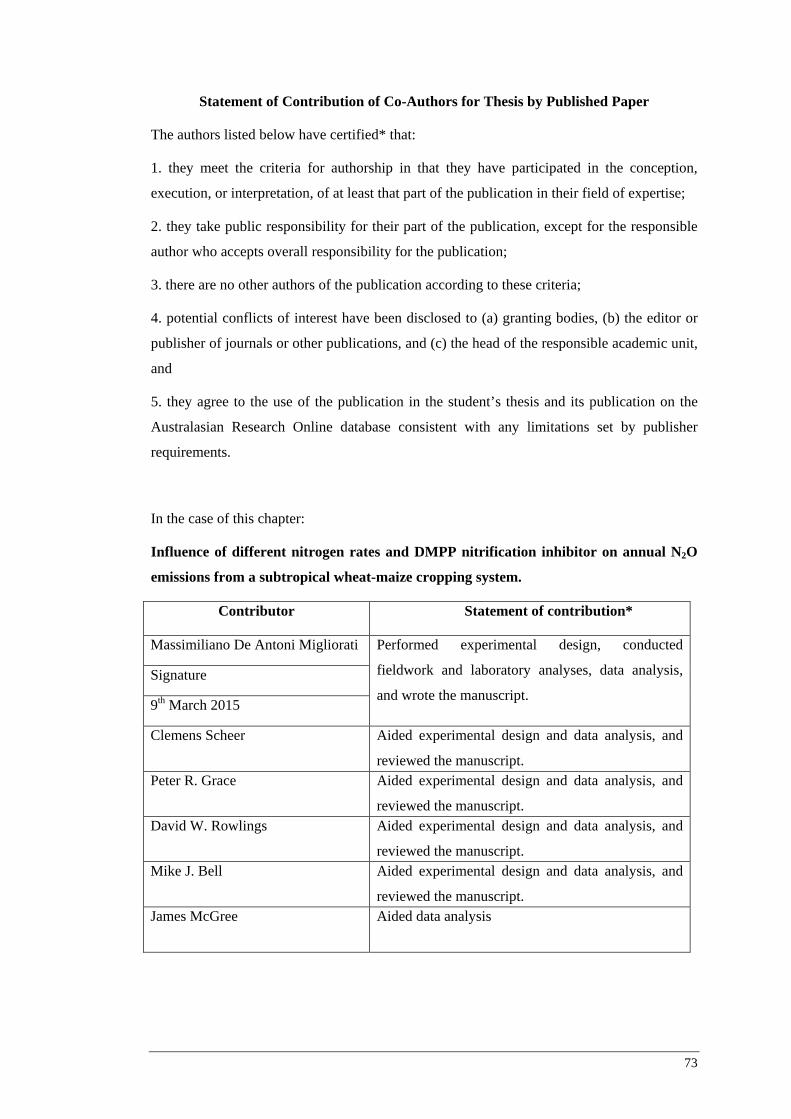
73
Statement of Contribution of Co-Authors for Thesis by Published Paper
The authors listed below have certified* that:
1. they meet the criteria for authorship in that they have participated in the conception,
execution, or interpretation, of at least that part of the publication in their field of expertise;
2. they take public responsibility for their part of the publication, except for the responsible
author who accepts overall responsibility for the publication;
3. there are no other authors of the publication according to these criteria;
4. potential conflicts of interest have been disclosed to (a) granting bodies, (b) the editor or
publisher of journals or other publications, and (c) the head of the responsible academic unit,
and
5. they agree to the use of the publication in the student’s thesis and its publication on the
Australasian Research Online database consistent with any limitations set by publisher
requirements.
In the case of this chapter:
Influence of different nitrogen rates and DMPP nitrification inhibitor on annual N2O
emissions from a subtropical wheat-maize cropping system.
Contributor Statement of contribution*
Massimiliano De Antoni Migliorati Performed experimental design, conducted
fieldwork and laboratory analyses, data analysis,
and wrote the manuscript. Signature
9th March 2015
Clemens Scheer Aided experimental design and data analysis, and
reviewed the manuscript. Peter R. Grace Aided experimental design and data analysis, and
reviewed the manuscript. David W. Rowlings Aided experimental design and data analysis, and
reviewed the manuscript. Mike J. Bell Aided experimental design and data analysis, and
reviewed the manuscript. James McGree Aided data analysis

74
Principal Supervisor Confirmation
I have sighted email or other correspondence from all Co-authors confirming their
certifying authorship.
Peter R. Grace 9th March 2015
Name Signature Date

75
Chapter 3: Influence of different nitrogen rates and DMPP nitrification inhibitor on annual N2O emissions from a subtropical wheat-maize cropping system (Paper 1)
3.1 Abstract
Global cereal production will need to increase by 50 to 70% to feed a world
population of about 9 billion by 2050. This intensification is forecast to occur mostly
in tropical and subtropical regions, where warm and humid conditions can promote
high N2O losses from cropped soils. New nitrogen (N) fertiliser management
strategies are necessary to secure high crop production without exacerbating N2O
emissions in these regions. This one-year study evaluated the efficacy of a
nitrification inhibitor (3,4-dimethylpyrazole phosphate - DMPP) and different N
fertiliser rates to reduce N2O emissions in a wheat-maize rotation in subtropical
Australia. N2O emissions were monitored for the entire duration of the experiment
using a fully automated greenhouse gas measuring system. Four treatments were
fertilised with different rates of urea, including a control (40 kg-N ha-1 year-1), a
conventional N fertiliser rate adjusted on estimated residual soil mineral N (120 kg-N
ha-1 year-1), a conventional N fertiliser rate (240 kg-N ha-1 year-1) and a conventional
N fertiliser rate (240 kg-N ha-1 year-1) with nitrification inhibitor (DMPP) applied to
both crops at top dressing. The maize season was by far the main contributor to
annual N2O emissions due to the high soil moisture and temperature conditions, as
well as the elevated N rates applied. Annual N2O emissions in the four treatments
amounted to 0.49, 0.84, 2.02 and 0.74 kg N2O-N ha-1 year-1 respectively, and
corresponded to emission factors of 0.29, 0.39, 0.69 and 0.16% of total N applied.
76
Halving the annual conventional N fertiliser rate in the adjusted N treatment led to
N2O emissions comparable to the DMPP treatment but extensively penalised maize
yield. The application of DMPP produced a significant reduction in N2O emissions
only in the maize season. The use of DMPP with urea at the conventional N rate
reduced annual N2O emissions by more than 60% but did not affect crop yields. The
results of this study indicate that: i) future strategies aimed at securing cereal
production while limiting N2O emissions in the subtropics should focus on the
fertilisation of the summer crop; ii) adjusting conventional N fertiliser rates on
estimated residual soil N is an effective practice to reduce N2O emissions but can
lead to substantial yield losses if the residual soil N is not assessed correctly; iii) the
application of DMPP is a feasible strategy to reduce annual N2O emissions from
subtropical wheat-maize rotations. However, at the N rates tested in this study DMPP
urea did not increase crop yields, making it impossible to recoup the additional costs
associated with this fertiliser. The findings of this study will support farmers and
policy makers to define effective fertilisation strategies to reduce N2O emissions
from subtropical cereal cropping systems while maintaining high crop productivity.
More research is needed to assess the use of DMPP urea in terms of reducing
conventional N fertiliser rates and subsequently enable a decrease of fertilisation
costs and a further abatement of fertiliser-induced N2O emissions.
3.2 Introduction
Agricultural soils play a fundamental role in the increase of nitrous oxide (N2O)
in the atmosphere, contributing approximately 50% of the global anthropogenic N2O
emissions (Ehhalt et al., 2001). The environmental relevance of increasing
concentrations of N2O in the atmosphere resides both in the elevated global warming
potential of N2O (298 CO2-eq over a 100 year time horizon) and its contribution to
the depletion of the ozone layer in the stratosphere (Ravishankara et al., 2009).
The increase of N2O emissions from agricultural soils is directly connected to
the increment in worldwide nitrogen (N) fertiliser use (Bouwman, 1990; Kroeze et
al., 1999). About 60% of worldwide N fertiliser is presently used to crop cereals
(Ladha et al., 2005). However, more fertiliser N is expected to be used in cereal
cropping systems to meet the cereal demand of 9 billion people in 2050 (Ladha et al.,

Influence of different nitrogen rates and DMPP nitrification inhibitor on annual N2O emissions from a subtropical wheat-maize cropping system (Paper 1)
77
2005; UNFPA, 2011). This intensification of cereal production is forecast to occur
mostly in tropical and subtropical regions (Smith et al., 2007), where warm and
humid climatic conditions can promote high N2O losses from fertilised soils
(Bouwman et al., 2002b). New fertiliser management strategies are necessary to
secure future cereal production in the tropics without increasing N fertiliser use and
therefore N2O emissions.
Conventional N fertiliser rates used in subtropical cereal systems are often
defined without taking into account the N left in the soil profile by the previous crop
(called residual soil N). Many studies have observed that the proportion of N2O
losses as a function of N fertiliser rates rise in nonlinear patterns when soil N
amounts exceed plant need (Van Groenigen et al., 2010; Grace et al., 2011). The
application of excessive amounts of fertiliser N rates can be avoided by taking into
account site-specific conditions affecting residual soil N, such as crop management
and crop rotations (Dobermann and Cassman, 2002; Pampolino et al., 2007). The
fertiliser N rates necessary to reach maximum yield potential can be therefore
calibrated taking into account the amount of N left by the previous crop.
As a result, our first hypothesis in this study was that by reducing conventional
N rates after accounting for residual soil N, N2O emissions can be abated without
significantly penalising yields. The second hypothesis of this research was that N2O
emissions generated by the application of conventional fertiliser rates can be
effectively reduced by nitrification inhibitors. The application of nitrification
inhibitors to urea-based fertilisers has been shown to decrease N2O emissions both
directly, via slowing the nitrification rates and, indirectly, by reducing the amount of
NO3- available to denitrifying microorganisms (Linzmeier et al., 2001a; Hatch et al.,
2005; Suter et al., 2010). Among nitrification inhibitors, 3,4-dimethylpyrazole
phosphate (DMPP) has been reported by many authors as the most efficient in
slowing nitrification and reducing N2O losses (Weiske et al., 2001a; Weiske et al.,
2001b; Liu et al., 2013).
However, the vast majority of data on N2O emissions from fertilised cereal
systems refer to temperate regions or laboratory conditions and the efficacy of these
fertilisation strategies in reducing N2O emissions in the subtropics still remains
unknown. The efficiency of DMPP in reducing N2O emissions from urea can be

78
strongly influenced by site-specific conditions such as soil temperature and soil water
content (Chen et al., 2010; Menéndez et al., 2012).
The overall aims of this study were therefore to: i) determine whether a
reduction in conventional N fertiliser rates according to local crop history can reduce
N2O emissions without affecting crop yields; ii) evaluate the effects of DMPP urea
applied at conventional rates on N2O emissions and crop yields; iii) improve the
understanding of environmental factors influencing N2O emissions from subtropical
cereal cropping systems.
In this study N2O emissions from a wheat-maize crop rotation in subtropical
Queensland (Australia) were monitored for one year using a fully automated
greenhouse gas measuring system. Both crops were fertilised with different rates of
urea, including a control, a conventional N fertiliser rate adjusted according to
estimated residual soil N, a conventional N fertiliser rate and the conventional rate
with DMPP urea.
This is the first study to report annual N2O emissions from a cereal cropping
system under subtropical conditions, the results of which will help to define
fertilisation strategies aimed at reducing N2O emissions from subtropical cereal
cropping systems while maintaining high crop productivity.
3.3 Materials and Methods
3.3.1 Study site
Annual N2O fluxes were measured from wheat (July to November 2011) in
rotation with maize (December 2011 to June 2012) at the J. Bjelke Petersen Research
Station of the Department of Agriculture, Fisheries and Forestry (DAFF). The
research site is located in Taabinga (26°34’54,3’’ Latitude South, 151°49’43.3’’
Longitude East, altitude 441 m a.s.l), near Kingaroy, in the southern inland Burnett
region of southeast Queensland, Australia. The climate is classified as subtropical
(Figure 3-1), with warm, humid summers and mild winters. Monthly mean maximum
and minimum temperatures are 18.9°C and 4.0°C in winter and 29.6°C and 16.5°C in
summer, respectively (Figure 3-2). Mean annual precipitation is 776.2 mm and varies

Influence of different nitrogen rates and DMPP nitrification inhibitor on annual N2O emissions from a subtropical wheat-maize cropping system (Paper 1)
79
from a minimum of 28.6 mm in August to a maximum of 114.1 mm in January
(Figure 3-3) (Australian Bureau of Meteorology website).

80
Figure 3-1 - Global distribution of humid subtropical climate zones. The red mark
indicates the location on the experiment. (Peel et al., 2007).
Figure 3-2 - Monthly mean maximum and minimum temperatures at Kingaroy research station. Values are calculated using observations from 1905 to present. (Australian Bureau of Meteorology website).
0
5
10
15
20
25
30
35
Jan Feb Mar Apr May Jun Jul Aug Sep Oct Nov Dec
Tem
pera
ture
[°C
]
Mean maximum temperature Mean minimum temperature

Influence of different nitrogen rates and DMPP nitrification inhibitor on annual N2O emissions from a subtropical wheat-maize cropping system (Paper 1)
81
Figure 3-3 - Mean monthly rainfall (mm) at Kingaroy research station. Values are calculated using observations from 1905 to present. (Australian Bureau of Meteorology website).
The soil is classified as Tropeptic Eutrustox Oxisol (USDA Soil Taxonomy,
USDA (1998)) or as a Brown Ferrosol (Australian Soil Classification, Isbell (2002)),
is moderately permeable, with a high clay content (50-65% clay) in 1.2 m of
effective rooting zone and a water holding capacity of 100 mm. Physical and
chemical soil properties are listed in Table 3-1.
Table 3-1 - Main soil physical and chemical properties of the experimental site at
Kingaroy research station, Queensland, Australia.
Soil Property 0-10 cm 10-20 cm 20-30 cm
Carbon (g kg-1) 14.67 ± 1.36 14.07 ± 0.55 10.82 ± 2.41
Total N (g kg-1) 0.92 ± 0.09 0.86 ±0.06 0.57 ± 0.04
pH (H2O) 5.50 ± 0.08 5.57 ± 0.03 5.66 ± 0.05
Texture (USDA) Clay Clay Clay
CEC (meq+/100g) 14.14 ± 0.10 14.71 ± 0.45 15.54 ± 2.29
Bulk density (g cm-3) 1.23 1.40 1.36
Clay (%) 50 55 60
Silt (%) 17 14 10
Sand (%) 33 31 30
0
20
40
60
80
100
120
Jan Feb Mar Apr May Jun Jul Aug Sep Oct Nov Dec
Rai
nfal
l [m
m]

82
3.3.2 Experimental design
The field study was a randomised complete block design with three replicates per
treatment. Each plot measured 13 m in length x 6 m in width, with crop rows
oriented NNW-SSE. To avoid edge effects, each plot was separated by a buffer of 6
m and 0.8 m along the width and length, respectively.
The field was cropped to wheat (Triticum aestivum L., cultivar Hartog) from 6
July to 29 November 2011 and to maize (Zea mays L., cultivar 32P55) from 21
December 2011 to 20 June 2012. Local farmer practice was followed and during the
early stages of crop development the entire field study was sprinkler irrigated with
surface stored dam water. All treatments received the same amount of water
simultaneously at each event. Irrigation was applied at a rate of 10 mm h-1 when
water filled pore space (WFPS) values approached 40%. This method avoided water
stress limiting the potential yields and prevented fertiliser N to be leached beyond the
rooting zone.
As reported in Table 3-2, throughout the duration of the experiment four
fertilisation treatments were tested:
• Control test (CNT): no N fertiliser applied to wheat, N fertiliser applied at rate of
40 kg N ha-1 to maize to guarantee a minimum crop establishment.
• Conventional N fertiliser rate adjusted according to estimated residual soil N
(CONV-ADJ): N applied at rates of 20 and 100 kg N ha-1 to wheat and maize,
respectively. Seasonal rates were defined to avoid the build-up of high levels of
soil N following fertilisation events and to obtain average crop yields. The annual
fertiliser rate was reduced to half of the conventional treatment.
• Conventional fertiliser rate (CONV): N applied at rates of 80 and 160 kg N ha-1 to
wheat and maize, respectively. Rates were similar to local farmer practice and
designed to achieve maximum yield potential.
• Conventional fertiliser rate using urea coated with DMPP nitrification inhibitor
(CONV-DMPP): N applied at rates of 80 and 160 kg N ha-1 to wheat and maize,
respectively. In each season DMPP urea was only applied at top dressing (60 kg N
ha-1 to wheat and 120 kg N ha-1 to maize), when higher amounts of seasonal N
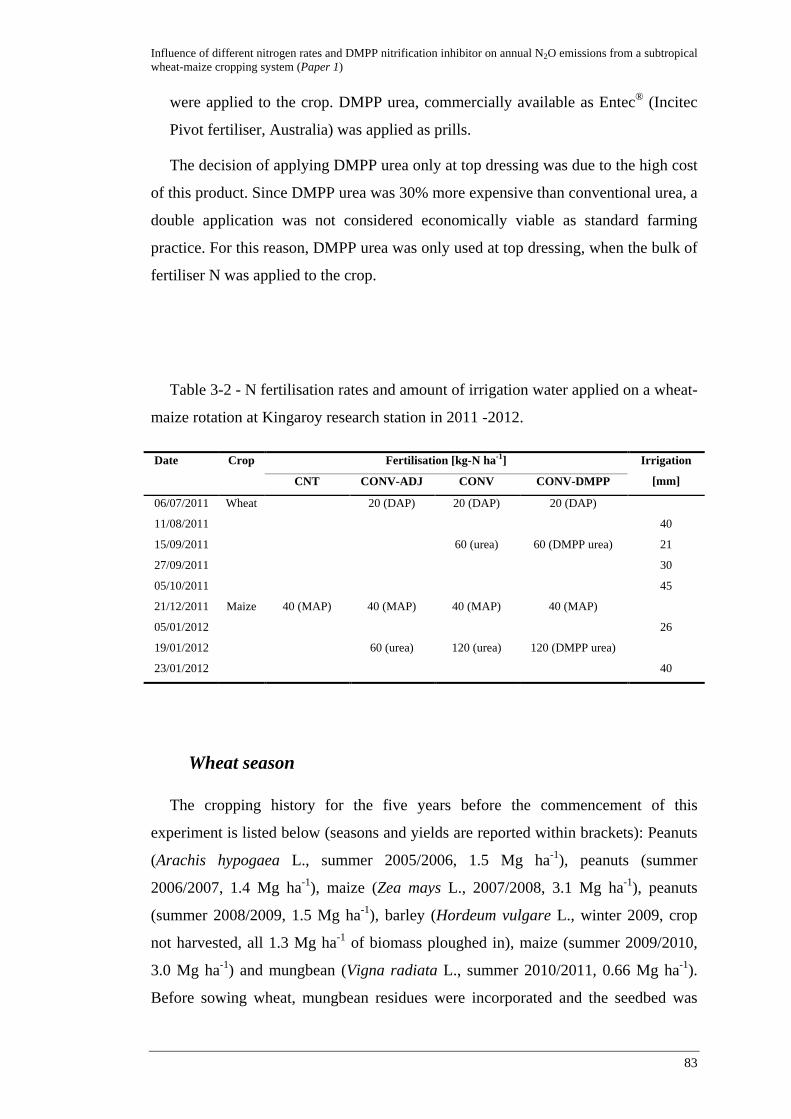
Influence of different nitrogen rates and DMPP nitrification inhibitor on annual N2O emissions from a subtropical wheat-maize cropping system (Paper 1)
83
were applied to the crop. DMPP urea, commercially available as Entec® (Incitec
Pivot fertiliser, Australia) was applied as prills.
The decision of applying DMPP urea only at top dressing was due to the high cost
of this product. Since DMPP urea was 30% more expensive than conventional urea, a
double application was not considered economically viable as standard farming
practice. For this reason, DMPP urea was only used at top dressing, when the bulk of
fertiliser N was applied to the crop.
Table 3-2 - N fertilisation rates and amount of irrigation water applied on a wheat-
maize rotation at Kingaroy research station in 2011 -2012.
Date Crop Fertilisation [kg-N ha-1] Irrigation
[mm] CNT CONV-ADJ CONV CONV-DMPP
06/07/2011 Wheat 20 (DAP) 20 (DAP) 20 (DAP)
11/08/2011 40
15/09/2011 60 (urea) 60 (DMPP urea) 21
27/09/2011 30
05/10/2011 45
21/12/2011 Maize 40 (MAP) 40 (MAP) 40 (MAP) 40 (MAP)
05/01/2012 26
19/01/2012 60 (urea) 120 (urea) 120 (DMPP urea)
23/01/2012 40
Wheat season
The cropping history for the five years before the commencement of this
experiment is listed below (seasons and yields are reported within brackets): Peanuts
(Arachis hypogaea L., summer 2005/2006, 1.5 Mg ha-1), peanuts (summer
2006/2007, 1.4 Mg ha-1), maize (Zea mays L., 2007/2008, 3.1 Mg ha-1), peanuts
(summer 2008/2009, 1.5 Mg ha-1), barley (Hordeum vulgare L., winter 2009, crop
not harvested, all 1.3 Mg ha-1 of biomass ploughed in), maize (summer 2009/2010,
3.0 Mg ha-1) and mungbean (Vigna radiata L., summer 2010/2011, 0.66 Mg ha-1).
Before sowing wheat, mungbean residues were incorporated and the seedbed was

84
prepared with three cultivations: chisel plough (20 cm), offset discs (20 cm) and
rotary hoe (15 cm).
Wheat was planted 6 July (inter-row 15 cm, intra-row plant space 9 cm, seed
planting density of 140 seeds m-2) and harvested 29 November 2011. Emergence was
observed 20 July 2011 with an average plant density of 125 plants m-2 while anthesis
started 6 October 2011. Average soil mineral N content prior to planting (0-30 cm)
was approximately 60 kg N ha-1 across the field study (Figure 3-4a and Figure 3-4b).
Taking into account an average N content of 1.5% in the stover (Bushby and Lawn,
1992; Thomas et al., 2004), it was estimated that the incorporation of 1.32 Mg ha-1 of
mungbean residues would have provided a further 20 kg N ha-1 to the soil. Although
it was estimated that a total of 80 kg N ha-1 would have been available to the crop
throughout the wheat season, a conservative approach was taken and the N fertiliser
rate in the CONV-ADJ treatment was reduced by 60 kg N ha-1 (75%) compared to
CONV. Over the season the plots were irrigated on four occasions: 40 mm on 11
August, 21 mm on 15 September, 30 mm on 27 September and 45 mm on 5 October.
At planting, treatments CONV-ADJ, CONV and CONV-DMPP received 20 kg N
ha-1 by banding 110 kg of diammonium phosphate (DAP, 18-20-0). The CNT
treatment was instead base dressed with 100 kg ha-1 of Triple Super Phosphate (TSP,
0-46-0) to supply a source of phosphorus without adding N. At booting stage the
CONV and CONV-DMPP treatments were manually top dressed with 60 kg N ha-1
to meet maximum yield potential. The two treatments were broadcasted with
conventional urea and DMPP urea, respectively. Since chambers were moved every
two weeks to a different frame (see section 3.3.3), at top dressing the exact
proportion of urea was weighed separately and then manually distributed within all
frames of the CONV and CONV-DMPP treatments. Fertilisation and irrigation
amounts and timing are shown in Table 3-2.

Influence of different nitrogen rates and DMPP nitrification inhibitor on annual N2O emissions from a subtropical wheat-maize cropping system (Paper 1)
85
Figure 3-4 - Soil ammonium and nitrate contents (0-30 cm) for four fertilisation
treatments during the wheat (a, b) and maize (c, d) seasons in Kingaroy (Queensland,
Australia) in 2011/12. Arrows indicate the timing of N fertiliser applications.
Soi
l NH
4+ [kg-
N h
a-1]
0
40
80
120
160
200
Jul Aug Sep Oct Nov Dec
Soi
l NO
3- [kg-
N h
a-1]
0
20
40
60
80
100
CNT RFR CONV CONV-DMPP
Soi
l NH
4+ [kg-
N h
a-1]
0
20
40
60
80
100
(b)
(a)
Dec Jan Feb Mar Apr May Jun Jul
Soi
l NO
3- [kg-
N h
a-1]
0
40
80
120
160
200
CNT CONV-ADJCONV CONV-DMPP
(c)
(d)

86
Maize season
After the wheat harvest all residue was slashed and mulched. The entire trial field
was broadcasted with lime (2500 kg ha-1) before being cultivated with chisel plough
(to 20 cm), offset discs (20 cm) and rotary hoe (15 cm). The seedbed was finally
prepared with offset discs (20 cm) and tyned harrows after being spread with muriate
of potash (120 kg ha-1). Maize was planted 21 December 2011 with an inter-row of
93 cm (intra-row plant space 23 cm, seed density: 6 seeds m-2) and irrigated on two
occasions: 26 mm on 5 January and 40 mm on 23 January (Table 3-2). Emergence
was first observed 28 December 2011 at a density of 5 plants m-2 while tasseling
started 13 February 2012.
Due to the high initial N requirement of maize, supplying no N to this crop during
the early stages of crop development could potentially have caused an uneven or
poor crop establishment. For this reason, a zero N treatment was not considered
possible and all treatments (including control) were base dressed by banding 40 kg N
ha-1 with monoammonium phosphate (MAP, 11-52-0, Incitec Pivot fertiliser). At the
end of the wheat season the average soil mineral N content (0-30 cm) in the CONV-
ADJ plots was approximately 35 kg N ha-1 (Figure 3-4a and Figure 3-4b) and the
wheat straw contained an average N content of 0.48%. It was estimated that the
mineralisation of the 5.3 Mg ha-1 of wheat residues incorporated in the soil before
planting maize would have provided an extra 25 kg N ha-1 throughout the maize
season. A total of 60 kg N ha-1 was therefore expected to become available to the
maize plants during the cropping season. During the maize season the N fertiliser
rate in the CONV-ADJ treatment was cut by 60 kg N ha-1 (40%) compared to CONV
to better evaluate the feasibility of reducing the fertiliser N rate in accordance with
estimated residual soil N.
At V10 physiological stage (beginning of tenth leaf) treatments CONV-ADJ,
CONV and CONV-DMPP were side dressed and inter-row cultivated to supply N
during the period of maximum crop demand (Miller et al., 1975; Binder et al., 2000):
CONV-ADJ received 60 kg N ha-1 using conventional urea while 120 kg N ha-1 was
applied to the CONV and CONV-DMPP treatments using conventional urea and urea
coated with DMPP, respectively. The crop was harvested 20 June 2012.

Influence of different nitrogen rates and DMPP nitrification inhibitor on annual N2O emissions from a subtropical wheat-maize cropping system (Paper 1)
87
3.3.3 Continuous N2O measurements
During each cropping season N2O measurements were automatically taken using
one acrylic sampling chamber per plot. During the wheat season the chambers were
located randomly inside each plot since the crop inter-row (15 cm) was smaller than
the chamber side (50 cm). This approach was not possible with maize, where the
crop inter-row was 90 cm, so to provide a good representation of the soil spatial
variability the chamber placement was based on the methodology established by
Kusa et al. (2006) and Parkin and Kaspar (2006). For each treatment two of the three
replicate chambers were positioned over the crop row and the third one in the inter
row. Chambers were positioned over the crop row to guarantee the banded fertiliser
(4 cm from the plant row) was included in the chamber area.
Each chamber measured 50 cm x 50 cm x 15 cm and was clipped via a rubber seal
to stainless steel frames inserted 10 cm into the ground. The chambers were equipped
with lids operated by pneumatic pistons and connected to a fully automated system
composed of a sampling unit and a gas chromatograph. During a normal
measurement cycle (60 min) one set of four chambers closed at one time and four gas
samples were taken from each chamber at 15 min intervals. The chambers were
reopened at the end of the cycle and the next replicate set of four chambers closed to
be sampled. A full measuring cycle of twelve chambers took 180 min to complete,
allowing up to 8 single fluxes to be determined per chamber per day. The air samples
taken from each chamber were automatically pumped through a 3 ml sample loop
and injected into a gas chromatograph (Model 8610C, SRI Instruments, USA)
equipped with a 63Ni electron capture detector (ECD) for N2O analysis. A column
filter containing sodium hydroxide-coated silica (Ascarite, Sigma-Aldrich, St. Louis,
MO, USA) was installed upstream of the ECD to adsorb CO2 and water vapour that
could interfere with N2O measurements. The system was automatically calibrated
twelve times every measurement cycle by a single point calibration using certified
gas standard of 500 ppb N2O (BOC –Munich, Germany- and Air Liquide –Dallas,
TX, USA). A multi-point calibration was performed using certified gas standards of
500, 980, 5030 ppb N2O (BOC –Munich, Germany) and the GC response over this
range was determined to be linear.
The detection limit of the system with and without chamber extensions, based on
the methodology described by Parkin et al. (2012), was approximately 2 and 0.5 g
88
N2O-N ha-1 day -1 for N2O. The design and operation details of the automated gas
measuring system can be found in Scheer et al. (2013b) and Rowlings et al. (2012).
The whole system was constantly checked for leaks throughout each season, making
the sample dilution due to leakage negligible.
Chambers were programmed to open if a rain event exceeded 5 mm or the internal
air temperature within the chamber exceeded a threshold value of 55 °C. During
irrigation events the system was stopped and all chamber lids were opened to allow
water to reach the soil surface covered by the chambers. The measuring system was
deployed immediately after planting at the beginning of each cropping season and
temporarily withdrawn to permit farming operations.
During the wheat season, the chamber height was increased to 75 cm using clear
acrylic extensions to accommodate the crop growth. This strategy was not applicable
during the maize season, when plant size exceeded the extension height. The plant
inside each chamber situated in the inter row was therefore cut over the brace roots at
V1 stage, as practiced in other studies (Drury et al., 2008; Halvorson et al., 2008; Hu
et al., 2013).
Chambers were relocated to another position within the plot every two weeks, a
practice recommended by several authors (Barton et al., 2011; Scheer et al., 2012;
Liu et al., 2013) to minimise the impact of the chamber on plant growth and soil
processes. To meet this requirement, two different strategies were adopted for the
two seasons. During the wheat season two frames were located in each plot and
chambers were shifted between the two frames every two weeks. During the maize
season cutting the plant inside the chamber over the crop row was considered to have
marginal impacts on soil C and N dynamics. The practice was limited to the plant
inside the chamber while plants adjacent the chambers were left undisturbed.
Nevertheless, to further reduce the possible side effects of this practice during the
entire maize season, chambers and frames were moved to a completely new position
every two weeks.
3.3.4 Ancillary measurements
Chamber air temperatures and soil temperatures (buried at 10 cm, 20 cm, 30 cm in
the proximities of three chambers) were measured every 5 minutes using resistance
temperature detectors (RTD, Temperature Controls Pty Ltd, Australia). The soil
Influence of different nitrogen rates and DMPP nitrification inhibitor on annual N2O emissions from a subtropical wheat-maize cropping system (Paper 1)
89
water content of the top 10 cm of soil was measured every 30 minutes with four time
domain reflectometers (TDR, MP406 probes, ICT International, Australia) buried
inside the measuring chambers. Four frequency domain reflectometers (FDR,
EnviroScan probes, Sentek Sensor Technologies, Australia) were installed at the
field site to assess the water dynamics throughout the soil profiles. After calibration,
the FDR were inserted in the ground to measure the volumetric soil water content at
three depths (0-10 cm, 10-20 cm, 20-30 cm) at 30 minute intervals. Water-filled pore
space (WFPS) was determined for each depth using a particle density of 2.79 g cm-3
and the bulk density was calculated by the arithmetic mean of four samples collected
at the beginning of each season.
At the beginning and end of each cropping season soil cores were collected from
every plot with a manual open-faced bucket auger (10 cm diameter) at three depths
(0-10, 10-20, 20-30 cm) and analysed for texture (hydrometer method as described
by Carter and Gregorich (2007)), total carbon (C%) and total nitrogen (N%) (TruMac
Series Macro Determinator, LECO Corporation, St Joseph, MI, USA), pH, Cation
Exchange Capacity (ICP, Varian Vista-MPX), NH4-N and NO3-N. NH4+ and NO3
-
were extracted from the soil samples by adding 100 mL of 1M KCl to 20g of soil and
shaking the solution for 1 hour. The solution was then filtered and stored in a freezer
until analysed colorimetrically for NH4-N and NO3-N using an AQ2+ discrete
analyser (SEAL Analytical WI, USA). Routine soil sampling was conducted every
two weeks during each season. Soil samples were taken at three depths (0-10, 10-20,
20-30 cm) and analysed for NH4-N and NO3-N. At harvest, grain yield was measured
in each plot by harvesting two strips 1.65 m wide for the plot length using a plot
combine. Total N content of grain, wheat straw and maize stover samples was
measured using a 20-22 isotope ratio mass spectrometer (Sercon Limited, UK).
3.3.5 Calculations and statistical analysis
N2O fluxes were calculated to determine the slope of the linear increase or
decrease in gas concentration during the 60 minutes of chamber closure period using
the method described by Barton et al. (2008) . The obtained data were corrected for
internal air temperature, atmospheric pressure and ratio of chamber volume and soil
area. Measurements were quality-checked using the Pearson correlation and fluxes
above the detection limit discarded if the regression coefficient (r2) was < 0.80. For

90
each treatment, mean daily N2O fluxes [g N2O-N ha-1 d-1] were calculated
performing a weighted average of the two chambers over the crop row and the
chamber placed in the inter row. Cumulative N2O fluxes [kg N2O-N ha-1] were
determined by summing the mean daily N2O fluxes for each season, and for the
entire study period.
Daily N2O fluxes missing due to occasional failures of the measuring system, and
between wheat harvest and maize planting, were simulated using the Amelia II
multiple imputation model (Honaker and King, 2010) using daily values of WFPS
(0-10 cm, 10-20 cm and 20-30 cm) and mineral N content (0-30 cm). Statistical
analyses were performed within the R 2.15 environment (R Development CoreTeam,
2008). The temporal patterns of daily N2O emissions were analysed with the
autoregressive integrated moving average (ARIMA) model to assess differences
between treatments (Box and Pierce, 1970). The Tukey post hoc test was used to
compare cumulative N2O emissions and N2O emissions occurred after top dressing,
while yields were compared with the Bonferroni test. Correlations between N2O
emissions and soil parameters were examined with the Pearson correlation analysis.
Emission factors, expressed as a percentage of N fertiliser lost as N2O, were
corrected for background emissions by subtracting the total amount of N2O-N lost in
the non-fertilised treatment from the total N2O-N emitted by each fertilised treatment
(Kroeze et al., 1997). For the maize season, where an non-fertilised treatment was
not present, seasonal background emissions were estimated using the methodology
described by Liu et al. (2010b). The cumulative emissions from a hypothetical non-
fertilised soil were estimated using the seasonal N2O fluxes of the CNT treatment
minus those emissions exceeding 1 g N2O-N ha-1 d-1 that were measured during the
16 days after 21 January 2012. Emissions during this time gap were simulated using
the Amelia II multiple imputation model fed with a dataset including soil
temperatures and WFPS values (0-10 cm, 10-20 cm and 20-30 cm) for the whole
season, plus N2O fluxes and mineral N contents (average 0-30 cm) measured prior to,
and 16 days after 21 January 2012. The model was calibrated for site-specific
conditions using measured annual N2O fluxes, Mineral N contents, soil temperatures
and WFPS values from all treatments. To validate the precision of the calibrated
model in predicting missing N2O emissions, 16 day gaps were simulated in the other
treatments. Simulated emissions in all treatments fell within the confidence interval

Influence of different nitrogen rates and DMPP nitrification inhibitor on annual N2O emissions from a subtropical wheat-maize cropping system (Paper 1)
91
calculated with the ARIMA model. The overall seasonal emissions from the non-
fertilised maize field, estimated to be 0.12 kg-N ha-1, are confirmed by similar
studies (Cai et al., 2002b; Pelster et al., 2011).
3.4 Results
3.4.1 Environmental and soil conditions
The weather conditions recorded during this study, characterised by cool dry
winters (June-August) and hot humid summers (December-February), were in line
with the historic subtropical climate. Soil conditions were substantially warmer and
moister during the summer season, especially at the beginning of the maize season
(Figure 3-5).
Figure 3-5 - Minimum and maximum daily air temperatures, soil temperatures (0-30 cm), rainfall and irrigation events at Kingaroy (Queensland, Australia) in 2011/12.
Jul Aug Sep Oct Nov Dec Jan Feb Mar Apr May Jun Jul
Rai
nfal
l/Irr
igat
ion
[mm
]
0
20
40
60
80
100
120
140
Tem
pera
ture
[°C
]
-10
0
10
20
30
40
50
Rainfall+Irrigation Minimum and maximum Air Temperature Soil Temperature

92
Throughout the wheat season soil NH4+ levels in the CNT and CONV-ADJ
treatments varied little (Figure 3-4a). Soil NH4+ levels in the CONV and CONV-
DMPP treatments were similar to those of the CNT and CONV-ADJ treatments until
top dressing, after which they increased to 64.6 and 82.1 kg N ha-1, respectively. Soil
NO3- contents in all treatments were relatively high at planting (average 35.6 kg N
ha-1) and did not vary substantially over the course of the wheat season (Figure 3-4b).
Soil NH4+ levels were similar across all treatments at the beginning of the maize
season. NH4+ levels in CONV-ADJ and CONV peaked within 10 days from side
dressing, while in CONV-DMPP culminated 20 days later (Figure 3-4c). Soil NO3-
levels varied little across treatments during the entire season, with the exception of
the CONV treatment, where NO3- concentrations reached the seasonal maximum 20
days after side dressing (Figure 3-4d).
3.4.2 N2O emissions
Throughout this one-year experiment an average of 5600 valid N2O fluxes for
each treatment were obtained. Patterns and magnitudes of N2O emissions varied
significantly over time in response to seasonal weather and soil conditions, N
fertilisation rates and fertiliser type.
During the wheat season N2O emissions varied little across treatments. Two
“emissions pulses” occurred in all treatments before top dressing in response to a
rainfall event (July 16, 12 mm) and an irrigation event (August 11, 40 mm). A third,
more sizeable emission pulse was measured in CONV and CONV-DMPP after
September 15, when the entire trial was irrigated with 21 mm and the two treatments
were top dressed with 60 kg N ha-1 (Figure 3-6a).
N2O emissions over the maize season showed a more pronounced increase
corresponding to increased N fertiliser rates (Figure 3-6b). Daily fluxes following
base dressing, when all treatments were fertilised with 40 kg N ha-1, remained
relatively low (<10 g N ha-1 day-1) and did not vary significantly between treatments.
In the ten days following side dressing a total of 172 mm of rain fell over the trial,
causing soil WFPS in the first 30 cm to stay over 80% for 5 consecutive days. N2O
emission dynamics differed significantly across treatments after this event. In the
CNT treatment a relatively minor peak (<17 g N ha-1) lasted for 16 days. The highest
N2O fluxes in CONV-DMPP were similar to those measured in CONV-ADJ. In the
Influence of different nitrogen rates and DMPP nitrification inhibitor on annual N2O emissions from a subtropical wheat-maize cropping system (Paper 1)
93
CONV-DMPP treatment high fluxes lasted for 9 days, whereas in CONV-ADJ
persisted for 21 days. In the CONV treatment N2O emissions continued to increase
until mid-February, to a maximum of 73.2g N ha-1 day-1. Emissions in the CONV
treatment returned to background levels by mid-March 2012. After that event, daily
N2O emissions in all treatments never exceeded 0.6 g N ha-1 day-1 despite several
rain events in April, May and June 2012. In the wheat season cumulative emissions
from the CONV treatment only were significantly higher than those measured in the
other treatments (Table 3-3).
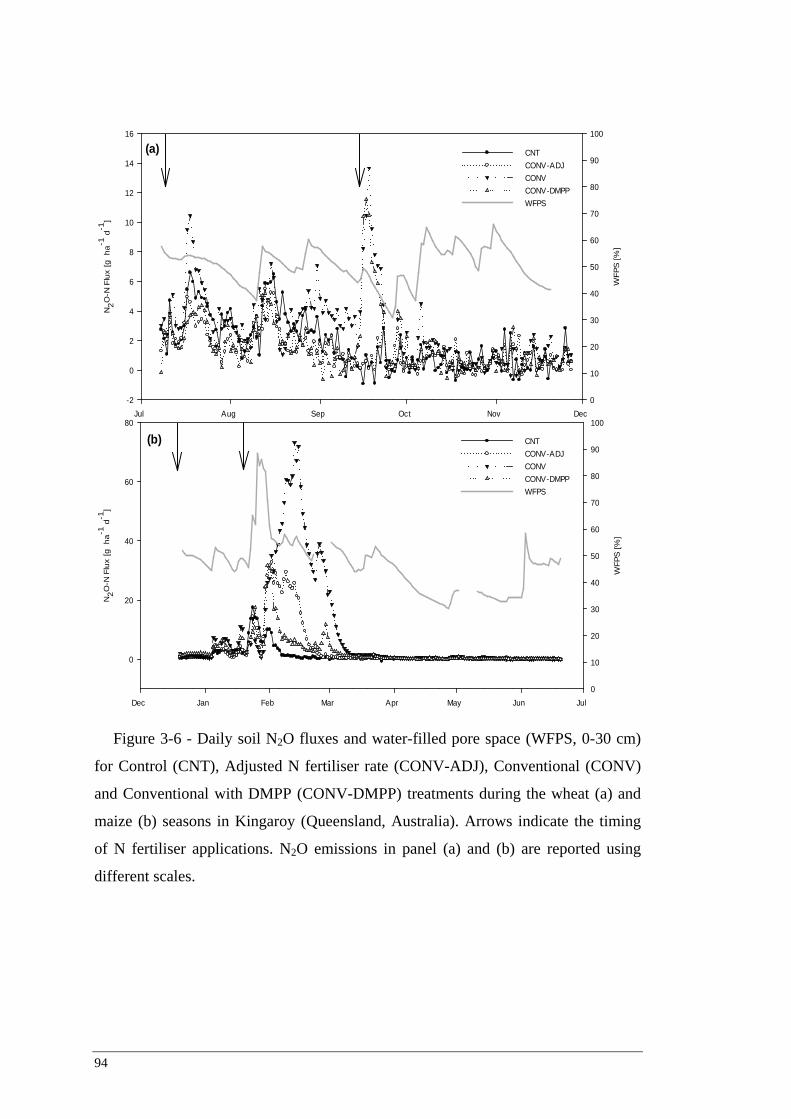
94
Jul Aug Sep Oct Nov Dec
N2O
-N F
lux
[g h
a-1 d
-1]
-2
0
2
4
6
8
10
12
14
16
WFP
S [%
]
0
10
20
30
40
50
60
70
80
90
100
CNT CONV-ADJCONV CONV-DMPP WFPS
Dec Jan Feb Mar Apr May Jun Jul
N2O
-N F
lux
[g h
a-1 d
-1]
0
20
40
60
80
WFP
S [%
]
0
10
20
30
40
50
60
70
80
90
100
CNT CONV-ADJCONV CONV-DMPP WFPS
(a)
(b)
Figure 3-6 - Daily soil N2O fluxes and water-filled pore space (WFPS, 0-30 cm)
for Control (CNT), Adjusted N fertiliser rate (CONV-ADJ), Conventional (CONV)
and Conventional with DMPP (CONV-DMPP) treatments during the wheat (a) and
maize (b) seasons in Kingaroy (Queensland, Australia). Arrows indicate the timing
of N fertiliser applications. N2O emissions in panel (a) and (b) are reported using
different scales.

Influence of different nitrogen rates and DMPP nitrification inhibitor on annual N2O emissions from a subtropical wheat-maize cropping system (Paper 1)
95
Table 3-3 - Seasonal and estimated annual N2O average fluxes, N2O cumulative fluxes, emission factors, plant N uptake, grain yield and N2O intensities (mean ± SE, n=3) as a function of the four fertilisation treatments. Means denoted by a different letter indicate significant differences between treatments (p<0.05).
Measurement Season Fertilisation Treatment
CNT CONV-ADJ CONV CONV-
DMPP
Average Flux [g N2O-N ha-1 d-1] Wheat 1.74 ± 0.59 a 1.34 ±0.41 a 2.83 ±0.84 b 1.71 ± 0.68 a
Cumulative Flux [kg N2O-N ha-1 season-1] 0.25 ± 0.04 a 0.19 ± 0.02 a 0.40 ± 0.02 b 0.25 ± 0.01 a
Emissions after top dressing [kg N2O-N ha-1]* - - 0.13 ± 0.01 a 0.12 ± 0.01 a
Emission Factor [%] - -0.29 0.19 -0.005
Grain Yield (12.5% moisture) [Mg ha-1] 4.4 ± 0.32 a 5.1 ± 0.10 a 5.8 ± 0.11 a 5.5 ± 0.09 a
Total plant N uptake [kg N ha-1] 134.2 ± 9.6 154.9 ± 3.1 173.8 ±3.3 165.6 ± 2.7
N2O Intensity [kg N2O-N t-yield-1] 0.06 0.04 0.07 0.04
Average Flux [g N2O-N ha-1 d-1] Maize 1.22 ± 0.91 a 3.51 ± 2.56 ac 8.77 ± 5.57 b 2.71 ± 1.69 c
Cumulative Flux [kg N2O-N ha-1 season-1] 0.22 ± 0.03 a 0.65 ± 0.15 ac 1.61 ± 0.49 b 0.50 ± 0.12 c
Emissions after top dressing [kg N2O-N ha-1]* - 0.52 a 1.42± 0.37 b 0.33± 0.10 a
Emission Factor [%] 0.26 0.53 0.93 0.24
Grain Yield (14% moisture) [Mg ha-1] 2.6 ± 0.11 a 6.1 ± 0.26 b 8.5 ± 0.12 c 8.4 ± 0.18 c
Total plant N uptake [kg N ha-1] 39.2 ± 1.7 92.3 ± 3.9 130.2 ± 1.8 128.1 ± 2.7
N2O Intensity [kg-N2O-N t-yield-1] 0.09 0.11 0.19 0.06
Average Flux [g N2O-N ha-1 d-1] Annual 1.40 ± 0.77 a 2.45 ± 1.91 ac 5.87 ± 4.21 b 2.22 ± 1.31 c
Cumulative Flux [kg N2O-N ha-1 season-1] 0.49 ± 0.04 a 0.84 ± 0.14 a 2.02 ± 0.48 b 0.74 ± 0.13 a
Emission Factor [%] 0.29 0.39 0.69 0.16
Grain Yield [Mg ha-1] 7.01 ± 0.40 a 11.18 ± 0.24a 14.29 ± 0.52 b 13.89 ± 0.55 b
N2O Intensity [kg-N2O-N t-yield-1] 0.07 0.07 0.14 0.05
*- sum of N2O emissions measured within 10 days after top dressing (wheat) and 40 days after side dressing
(maize)

96
The time series analysis showed that N2O emissions in the CONV and CONV-
DMPP treatments were significantly higher than those in CNT and CONV-ADJ only
during the 10 days following top dressing. No significant difference was detected
when comparing the CONV and CONV-DMPP treatments. The N2O losses from the
CONV treatment in maize were significantly higher than in the other treatments,
while N2O fluxes observed in the CONV-DMPP treatment did not differ significantly
from those in CONV-ADJ (Table 3-3). The temporal pattern of N2O emissions in the
CONV treatment differed significantly from the others only during the 40 day
emission pulse following side dressing. Compared to the CNT treatment, a
significant difference in N2O emissions from CONV-ADJ and CONV-DMPP was
limited to the first 20 days of emission pulse. Annual N2O emissions (inclusive of the
22 days between wheat harvest and maize planting) and emissions factors are also
reported in Table 3-3.
3.4.3 Plant yields and plant N contents
There was no distinct treatment effect on yields during the wheat season (Table
3-3). In contrast, the Bonferroni test revealed a significant (p < 0.01) linear response
of maize grain yield to increasing N fertiliser application. In both crops the addition
of DMPP to urea did not affect grain yields compared to the same rate with
conventional urea (Table 3-3). Annual grain yields in the CONV treatment were
similar to those in CONV-DMPP and both were significantly higher (p < 0.05) than
those in CNT and CONV-ADJ. N content in grain and plant tissues did not differ
significantly across treatments. Total plant N uptake values measured for the four
treatments during the two seasons are reported in Table 3-3.
3.5 Discussion
3.5.1 Factors influencing N2O emissions in wheat and maize
In this study N2O fluxes occurred during the maize season were the main
contributor to annual emissions in all treatments except CNT (Figure 3-7a),
accounting for 46, 77, 80 and 67% of total N2O losses in CNT, CONV-ADJ, CONV
and CONV-DMPP, respectively (Table 3-3). The higher N2O emission measured in

Influence of different nitrogen rates and DMPP nitrification inhibitor on annual N2O emissions from a subtropical wheat-maize cropping system (Paper 1)
97
maize can be explained considering the different soil physical conditions and N
fertiliser rates compared to the wheat season. That is, during the wheat season when
CONV and CONV-DMPP were top dressed with 60 kg N ha-1, soil temperature was
14.8 °C and WFPS was 40.3%, while in the maize season, when CONV and CONV-
DMPP were side dressed with 120 kg N ha-1, soil temperature was 25.8 °C and
WFPS was 64.9 % (Figure 3-7b).
Figure 3-7 - Cumulative N2O fluxes (a) and daily soil N2O fluxes, water-filled
pore space (WFPS, 0-30 cm), soil temperatures (0-30 cm) (b) for the four fertilisation
treatments in a wheat-maize rotation at Kingaroy (Queensland, Australia) in 2011/12.
Arrows indicate the of N fertiliser applications.
(b)
Jul Aug Sep Oct Nov Dec Jan Feb Mar Apr May Jun Jul
Cum
ulat
ive
N2O
-N e
mis
sion
s [g
ha-1
]
0
500
1000
1500
2000
2500
3000
CNT CONV-ADJCONV CONV-DMPP
(a)
(b)
Jul Aug Sep Oct Nov Dec Jan Feb Mar Apr May Jun Jul
N2O
-N F
lux
[g h
a-1 d
-1]
0
20
40
60
80
Tem
pera
ture
[°C
]
0
5
10
15
20
25
30
35
WFP
S [%
]
0
20
40
60
80
100CNT CONV-ADJCONV CONV-DMPP Soil TemperatureWFPS
(b)
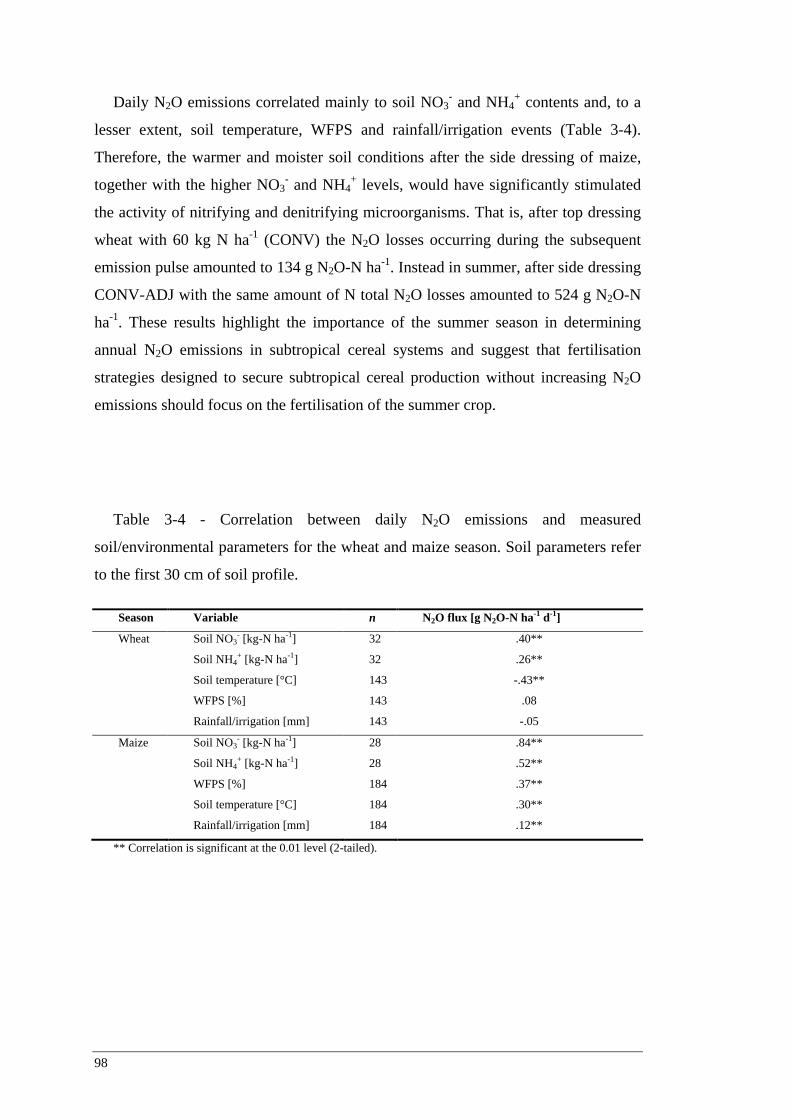
98
Daily N2O emissions correlated mainly to soil NO3- and NH4
+ contents and, to a
lesser extent, soil temperature, WFPS and rainfall/irrigation events (Table 3-4).
Therefore, the warmer and moister soil conditions after the side dressing of maize,
together with the higher NO3- and NH4
+ levels, would have significantly stimulated
the activity of nitrifying and denitrifying microorganisms. That is, after top dressing
wheat with 60 kg N ha-1 (CONV) the N2O losses occurring during the subsequent
emission pulse amounted to 134 g N2O-N ha-1. Instead in summer, after side dressing
CONV-ADJ with the same amount of N total N2O losses amounted to 524 g N2O-N
ha-1. These results highlight the importance of the summer season in determining
annual N2O emissions in subtropical cereal systems and suggest that fertilisation
strategies designed to secure subtropical cereal production without increasing N2O
emissions should focus on the fertilisation of the summer crop.
Table 3-4 - Correlation between daily N2O emissions and measured
soil/environmental parameters for the wheat and maize season. Soil parameters refer
to the first 30 cm of soil profile.
Season Variable n N2O flux [g N2O-N ha-1 d-1]
Wheat Soil NO3- [kg-N ha-1] 32 .40**
Soil NH4+ [kg-N ha-1] 32 .26**
Soil temperature [°C] 143 -.43**
WFPS [%] 143 .08
Rainfall/irrigation [mm] 143 -.05
Maize Soil NO3- [kg-N ha-1] 28 .84**
Soil NH4+ [kg-N ha-1] 28 .52**
WFPS [%] 184 .37**
Soil temperature [°C] 184 .30**
Rainfall/irrigation [mm] 184 .12**
** Correlation is significant at the 0.01 level (2-tailed).

Influence of different nitrogen rates and DMPP nitrification inhibitor on annual N2O emissions from a subtropical wheat-maize cropping system (Paper 1)
99
Average N2O emissions measured during this study were at the lower end of
reported emissions from wheat (Pathak et al., 2002; Bhatia et al., 2010; Scheer et al.,
2012; Hu et al., 2013; Liu et al., 2013) and maize (Van Groenigen et al., 2004; Ding
et al., 2007; Liu et al., 2011; Liu et al., 2013). Only Pathak et al. (2002); Bhatia et al.
(2010); Scheer et al. (2012) and Ding et al. (2007) however measured N2O emissions
under subtropical conditions. The low emissions can be attributed mainly to the
smaller N rates applied in this study and to the limited availability of soil organic
carbon at the experimental site. Nitrification and especially denitrification rates are
tightly connected to soil labile carbon content and numerous studies have identified
this parameter as a key factor regulating N2O production (Bouwman et al., 2002b;
De Wever et al., 2002; Khalil et al., 2002). Soil organic carbon levels are low in the
study region as a consequence of intensive conventional farming practices (Bell et
al., 1995) and elevated temperatures associated with high soil moisture levels during
the summer months, factors that can significantly accelerate SOC mineralisation
(Mann, 1986; West and Post, 2002; Lal, 2004). Accordingly, the soil N2O emissions
measured in maize during this experiment where in close agreement with those
reported for cotton by Sheer (2012) in an experiment conducted in Australia on a soil
with similar carbon contents.
3.5.2 Effects of reduced N fertiliser rates on N2O emissions and yields
Compared to the CONV treatment, the reduced N fertiliser application in the
CONV-ADJ treatment decreased N2O emissions by almost 60% both in wheat and
maize. On the other hand, the two crops reacted differently to the reduction of N
fertiliser. Despite a 75% reduction of applied N compared to the CONV treatment,
wheat grain yields in CONV-ADJ were comparable to those in CONV. In maize
instead, a reduction of 40% in N fertiliser corresponded to approximately a 30%
decrease in grain yield (Table 3-3).
At the experimental site mungbean residues were incorporated in the soil a few
weeks before the sowing of the wheat trial. Predictably, this increased the soil
organic N that would have been slowly mineralised, compensating for the N
deficiency observed in the CNT and CONV-ADJ treatments. This hypothesis would
also explain the high NO3- contents that were measured across all treatments in the

100
first two months of the wheat season (Figure 3-4b). The high crop productions
measured in CONV-ADJ during wheat can therefore be attributed mostly to the
mineralisation of plant residue of the previous legume crop.
Even though the percentage reduction of fertiliser N in the maize CONV-ADJ
treatment was smaller than in wheat, it ultimately proved excessive and the maize
yield was severely restricted. This was due to an overestimation of the availability of
the soil residual N during the first stages of the maize season. The high C:N ratio of
the wheat straw potentially caused a substantial microbial immobilisation of both soil
mineral N and applied N (Van Den Bossche et al., 2009), leaving the maize plants
without an adequate N supply during the early stages of crop growth. This is
supported by the lack of increase in soil NO3- and NH4
+ contents observed in all
treatments during the period following base dressing (Figure 3-4c and Figure 3-4d).
The reduction of N fertiliser tested in wheat was therefore well calibrated, but
excessive in maize. These results indicate that there can be substantial scope for
reducing conventional N fertiliser rates in cereals following a legume crop. However,
the possible immobilisation of substantial amounts of soil N has to be taken into
account when planting a cereal after a crop with high C:N residues. Further research
would be useful to investigate whether conventional N fertiliser rates in maize could
be reduced to a lesser extent to abate N2O losses without affecting yields.
3.5.3 Effects of DMPP application on soil mineral N and N2O emissions
The application of DMPP urea influenced the dynamics of mineral N in the soil
profile (0-30 cm). In both seasons the use of DMPP urea in the CONV-DMPP
treatment compared to CONV inhibited the oxidation of NH4+ to NO3
- and
consequently extended the longevity of N fertiliser in the NH4+ form (Figure 3-4a
and Figure 3-4c). However, soil NO3- contents in CONV-DMPP differed
substantially from those in the CONV treatment only in the maize season. The low
soil temperature and moisture conditions during the wheat season might have
retarded nitrification, leading to a gradual release of NO3- in the CONV treatment as
well. Taking into account also the small quantity of N applied, in both CONV and
CONV-DMPP treatments plants might have been able to efficiently uptake most of
the NO3- and thus prevent its accumulation in the soil profile. This hypothesis is

Influence of different nitrogen rates and DMPP nitrification inhibitor on annual N2O emissions from a subtropical wheat-maize cropping system (Paper 1)
101
supported by the N2O emissions measured in CONV and CONV-DMPP after top
dressing, which remained relatively low and did not differ significantly either in
terms of temporal pattern or magnitude (Figure 3-6a).
Table 3-3 highlights that the greater seasonal N2O emissions measured in the
CONV treatment compared to CONV-DMPP were not due to the emissions
measured after top dressing, but to higher N2O losses that occurred prior to the top
dressing event. Therefore, the higher emission factor of the CONV treatment for the
wheat season is not directly related to a treatment effect, but to spatial variability in
NH4+ and NO3
- contents prior to top dressing (Figure 3-4a and Figure 3-4b) or to
different soil physical conditions in the proximities of the chambers.
On the other hand, the warm and moist soil conditions measured after side
dressing maize are likely to have promoted a rapid nitrification of the high amount of
applied NH4+. At this physiological stage (V10) the maize plants were only able to
use a fraction of the NO3- present in the soil. Asynchrony between N supply and
plant N uptake resulted therefore in high soil NO3- levels and in the high N2O
emissions observed in the CONV treatment during this period (Figure 3-6b).
Conversely, the slower nitrification rate observed in the CONV-DMPP treatment
avoided the accumulation of high amounts of NO3- in the soil, resulting in
significantly lower N2O losses. As a result, the largest N2O fluxes after side dressing
the CONV treatment were double the magnitude and longer in duration compared to
those in CONV-DMPP (Figure 3-6b). The amount of N lost as N2O from CONV-
DMPP was reduced by 77% compared to CONV (Table 3-3) and is in close
agreement with several incubation studies (Chen et al., 2010; Suter et al., 2010) that
reported average abatement rates of DMPP ranging approximately from 60% to 90%
under warm and humid conditions (>25°, WFPS 60%). In line with the results of this
study, Liu et al. (2013) reported significantly higher N2O abatement rates of DMPP
urea in maize compared to wheat.
These findings indicate that under subtropical conditions applying DMPP urea has
substantial scope to abate N2O emissions mainly in the summer season, when the
warm and humid soil conditions can promote high nitrification and denitrification
rates.
102
3.5.4 N2O emission factors and N2O intensities
The emission factors reported in this study refer to a one year dataset and are
influenced by site-specific conditions. Even if the unpredictability of N2O emissions
is taken into account, general evaluations regarding emission factors for subtropical
cereal-based systems can be established.
Over the winter season (wheat) emission factors were remarkably low (Table 3-3),
suggesting relatively high background emissions. Indeed, N2O emissions measured
in the non-fertilised treatment (CNT) did not differ significantly from those in
CONV-ADJ and CONV-DMPP. The elevated background emissions were most
likely due to the mineralisation of the mungbean residues incorporated before sowing
wheat and are in line with the results reported for cereals following a legume crop by
Baggs et al. (2003); Barton et al. (2008) and Gomes et al. (2009). The high
background emissions measured in wheat resulted in negative emission factors
determined for the CONV-ADJ and CONV-DMPP treatments. These values cannot
be explained biologically but are due to the methodology used for the calculation of
emission factors. That is, the cumulative N2O emissions from CONV-ADJ and
CONV-DMPP did not differ significantly from the CNT treatment and therefore
emission factors for CONV-ADJ and CONV-DMPP should be considered as zero.
These results highlight the importance of taking into account local crop management
practices when calculating emission factors and confirm that relatively small
quantities of N are lost as N2O in subtropical cereal systems over winter.
During the maize season the highest emission factor (0.93%) was measured in the
CONV treatment, while the lowest (0.24%) was measured in CONV-DMPP (Table
3-3), suggesting that DMPP can effectively reduce N2O emissions when the soil
conditions are highly conducive for denitrification.
The annual emission factor measured in the CONV treatment (0.69%) was lower
than reported emission factors from Ding et al. (2007) (0.77%) and Cai et al. (2013)
(0.82%) for wheat-maize cropping systems fertilised with similar N rates. The
efficacy of DMPP in abating N2O emissions was confirmed by the annual emission
factor of 0.16% measured in the CONV-DMPP treatment. This represents one of the
lowest annual emission factors reported from fertilised subtropical cereal systems.

Influence of different nitrogen rates and DMPP nitrification inhibitor on annual N2O emissions from a subtropical wheat-maize cropping system (Paper 1)
103
Overall, annual emission factors in all treatments were lower than the default
values of 1% and 2.1% of applied N suggested by De Klein et al. (2006) and by the
Australian National Greenhouse Accounts (2010) for irrigated crops, respectively.
However, this comparison has to be treated with caution since the emission factors
reported in this study refer to only one year of data and are influenced by crop
management and site-specific conditions.
The efficacy of management strategies in maximising crop yield and reducing
N2O losses is assessed through “N2O intensities”, defined as the ratio of N2O emitted
and grain produced. Even though N2O intensities did not differ significantly across
treatments, compared to conventional urea DMPP urea significantly reduced annual
N2O emissions without negatively impacting cumulative yields (Table 3-3). This was
due primarily to the results observed in CONV-DMPP during the summer season,
when yields were comparable to CONV and total N2O emissions were lower than the
CONV-ADJ treatment. These findings indicate that the application of DMPP urea is
a feasible strategy to reduce absolute N2O emissions without compromising crop
production. The inhibitory effect of DMPP has been reported to last only for several
weeks (Pasda et al., 2001). Therefore, to achieve results similar to those reported in
this study, DMPP urea would have to be applied annually at least to the summer
crop.
Fertilising with DMPP urea added an extra cost of approximately USD 50 ha-1 but
did not provide an increase in yield compared to the same N rate with conventional
urea. This result was also observed by Díez López and Hernaiz (2008) and Weiske et
al. (2001a), while Liu et al. (2013) reported that the yield increase in the DMPP
treatment compared to the urea treatment was limited to 9.1%. However, it must be
considered that in the CONV-DMPP treatment and in the abovementioned studies
the crops were fertilised with high amounts of N. Most likely in these treatments N
was not a limiting factor for plant development and therefore there was no significant
scope for DMPP urea to better match plant N demand and thus increase crop yield.

104
3.6 Conclusions
Data gathered in this study indicate that in subtropical cereal systems the
summer crop is the main contributor to annual N2O emissions. The hot and humid
conditions, associated with the high N fertiliser rates usually applied in this season
can indeed promote emission rates up to fivefold those measured in winter. Future
strategies aimed at securing subtropical cereal production without increasing N2O
emissions should therefore focus on the fertilisation of the summer crop.
Adjusting conventional N fertiliser rates according to the estimation of residual
soil N can be an effective practice to reduce N2O emissions. On the other hand, this
strategy entails the substantial risk of yield loss if residual soil N availability is not
estimated correctly. This limitation can be overcome by taking into account possible
immobilisation of soil N following the incorporation of crop residues and therefore
allowing for a margin of uncertainty when defining the adjusted N rate.
The application of DMPP urea proved to be effective in abating N2O emissions
only in the summer season, when conditions are favourable for high nitrification and
denitrification rates. Critically, the additional cost of using this fertiliser was not
compensated by an increase in yields, meaning that for farmers the use of DMPP
urea cannot be regarded as a feasible fertilisation strategy unless governmental
incentive policies are established.
Further research is proposed to investigate whether the lower N2O losses
observed with DMPP urea are an indicator of an improved synchrony between crop
N demand and fertiliser supply compared to conventional urea. The enhanced
synchrony obtained with DMPP urea would enable to decrease the N rates tested in
this study, reducing therefore the costs associated with fertilisation and further
abating N2O emissions due to the lower soil N content.

Influence of different nitrogen rates and DMPP nitrification inhibitor on annual N2O emissions from a subtropical wheat-maize cropping system (Paper 1)
105


107
Statement of Contribution of Co-Authors for Thesis by Published Paper
The authors listed below have certified* that:
1. they meet the criteria for authorship in that they have participated in the conception,
execution, or interpretation, of at least that part of the publication in their field of expertise;
2. they take public responsibility for their part of the publication, except for the responsible
author who accepts overall responsibility for the publication;
3. there are no other authors of the publication according to these criteria;
4. potential conflicts of interest have been disclosed to (a) granting bodies, (b) the editor or
publisher of journals or other publications, and (c) the head of the responsible academic unit,
and
5. they agree to the use of the publication in the student’s thesis and its publication on the
Australasian Research Online database consistent with any limitations set by publisher
requirements.
In the case of this chapter:
Legume pastures can reduce N2O emissions intensity in subtropical cereal cropping
systems.
Contributor Statement of contribution*
Massimiliano De Antoni Migliorati Performed experimental design, conducted
fieldwork and laboratory analyses, data analysis,
and wrote the manuscript. Signature
9th March 2015
Mike J. Bell Aided experimental design and data analysis, and
reviewed the manuscript. Peter R. Grace Aided experimental design and data analysis, and
reviewed the manuscript. Clemens Scheer Aided experimental design and data analysis, and
reviewed the manuscript. David W. Rowlings Aided experimental design and data analysis, and
reviewed the manuscript. Shen Liu Aided data analysis

108
Principal Supervisor Confirmation
I have sighted email or other correspondence from all Co-authors confirming their
certifying authorship.
Peter R. Grace 9th March 2015
Name Signature Date

109
Chapter 4: Legume pastures can reduce N2O emissions intensity in subtropical cereal cropping systems (Paper 2)
4.1 Abstract
Alternative sources of N are required to bolster tropical and subtropical cereal
production without increasing N2O emissions from these agroecosystems. The
reintroduction of legumes in cereal cropping systems is a possible strategy to reduce
synthetic N inputs but elevated N2O losses have sometimes been observed after the
incorporation of legume residues. However, the magnitude of these losses is highly
dependent on local conditions and very scarce data are available for subtropical
regions. The aim of this study was to assess whether, under subtropical conditions,
the N mineralised from legume residues can substantially decrease the synthetic N
input required by the subsequent cereal crop and reduce overall N2O emissions
during the cereal cropping phase. Using a fully automated measuring system, N2O
emissions were monitored in a cereal crop (sorghum) following a legume pasture and
compared to the same crop in rotation with a grass pasture. Each crop rotation
included a nil and a fertilised treatment to assess the N availability of the residues.
The incorporation of legumes provided enough readily available N to effectively
support crop development but the low labile C left by these residues is likely to have
limited denitrification and therefore N2O emissions. As a result, N2O emissions
intensities (kg N2O-N yield-1 ha-1) were considerably lower in the legume histories
than in the grass. Overall, these findings indicate that the C supplied by the crop
residue can be more important than the soil NO3- content in stimulating
denitrification and that introducing a legume pasture in a subtropical cereal cropping
system is a sustainable practice from both environmental and agronomic
perspectives.

110
4.2 Introduction
Mitigating climate change and achieving food security are two of the key
challenges of the twenty-first century. Cereals are by far the world's most important
food source, contributing on average 50% of daily energy intake and up to 70% in
some developing countries (Kearney, 2010). By 2050 the world’s population is
forecast to be over a third larger than at present (UNFPA, 2011) and cereal demand
is predicted to increase by 60% (FAO, 2009). Pronounced intensification of cereal
production is expected to take place in tropical and subtropical regions (Smith et al.,
2007), identifying the need for more nitrogen (N) to be supplied to these
agroecosystems.
There is consensus (e.g. Tilman et al. (2002); Crews and Peoples (2004); Jensen
et al. (2012)) that both the manufacture and use of synthetic N fertilisers in crop
production generate substantial environmental threats, with the emission of
significant amounts of nitrous oxide (N2O) arguably one of the most important. N2O
is a potent greenhouse gas (298 CO2-eq over a 100 year time horizon (Myhre et al.,
2013)) associated also with the depletion of the ozone layer in the stratosphere
(Ravishankara et al., 2009). Together, these issues confirm that alternative means of
intensification must be implemented to avoid the increase of tropical and subtropical
cereal production through an overuse of synthetic N. If not, the result would be a net
increase in N2O emission rates from these agroecosystems.
The introduction, or in many cases, reintroduction, of legumes in crop rotations is
one possible strategy to reduce synthetic N inputs whilst sustaining grain yields
(Crews and Peoples, 2004; Jensen et al., 2012). Owing to their ability to fix
atmospheric N2 in symbiosis with rhizobia bacteria, legumes can reduce N demand
of the subsequent crop, and consequently decrease N2O emissions associated with
synthetic N fertilisers. In an extensive review on the use of legumes to mitigate
climate change, Jensen et al. (2012) concluded that N2O emissions during the legume
growing season did not differ substantially from unplanted or non-fertilised soils.
However, elevated N2O losses were sometimes reported after the termination of
legume-based ley pastures, when crop residues were returned to the soil (Gomes et
al., 2009; Pappa et al., 2011). The low C:N ratio of legume residues can indeed lead
to rapid tissue mineralisation once incorporated into the soil. As a result,
Legume pastures can reduce N2O emissions intensity in subtropical cereal cropping systems (Paper 2)
111
accumulation of mineral N can occur in the soil, increasing the potential for
substantial amounts of N to be lost as N2O via nitrification and denitrification
(Jensen et al., 2012).
The magnitude of N2O losses in response to legume residue incorporation is,
however, highly dependent on local climate and soil conditions (Rochette et al.,
2004). Subtropical cropping systems are characterised by intense and frequent
rainfall events during the summer months. The warm and moist soil conditions
during these periods can accelerate legume tissue mineralisation compared to
temperate environments, leading to ideal conditions for nitrifying and denitrifying
bacteria and therefore magnifying the risk of high N2O emissions (Granli and
Bøckman, 1995; Skiba et al., 1997).
However, little data are available for tropical and subtropical regions (Mosier et
al., 2004b), where warm, humid summer conditions could promote high N2O losses
from cropped soils (Bouwman et al., 2002b). Although numerous studies have
investigated N2O emissions after the termination of legume ley pastures prior to a
return to cropping, the vast majority were conducted in temperate regions (Wagner-
Riddle and Thurtell, 1998; Baggs et al., 2000; Robertson et al., 2000; Rochette et al.,
2004; Schwenke et al., 2010).
The overall aims of this study were therefore to assess whether, under subtropical
conditions: i) the N mineralised from legume residues can substantially reduce the
synthetic N input required by the subsequent cereal crop; ii) N2O losses occurring
after the incorporation of legume residues can be minimised via synchronising the
release of N derived from the residues with the N demand of the subsequent crop; iii)
reducing the synthetic N input applied to a cereal in rotation with a legume crop can
significantly decrease overall seasonal N2O during the cereal phase.
In this study seasonal N2O emissions and yields were monitored in a cereal crop
(sorghum) following a legume (legume-ley pasture) and compared to the same cereal
crop in rotation with a non-leguminous crop (grass ley pasture). Each rotation
included both a nil and a fertilised treatment. The N fertiliser applied to sorghum in
the legume-cereal rotation was reduced compared to the grass-cereal to assess the
availability of the N fixed by the legume ley pasture.

112
This study is the first to use a fully automated greenhouse gas measuring system
to precisely quantify N2O emissions in a subtropical cereal crop after the termination
of a legume ley pasture. The results of this study will contribute to define mitigation
strategies for the sustainable intensification of these agroecosystems.
4.3 Materials and Methods
4.3.1 Local climate and soil characteristics
This experiment was conducted in the subtropical region of Australia at the J.
Bjelke Petersen Research Station of the Department of Agriculture, Fisheries and
Forestry (DAFF). The research site is located in Kingaroy (26°34’54,3’’ S,
151°49’43.3’’ E, altitude 441 m a.s.l), in the southern Burnett region of southeast
Queensland, Australia. The subtropical climate (classified as Cfa, according to the
Köppen climate classification) has warm, humid summers and mild, dry winters.
Daily mean maximum and minimum temperatures range from 20.1°C to 4.0°C in
winter and from 29.6°C to 16.5°C in summer, respectively. Local mean annual
precipitation is 776.2 mm and varies from a minimum of 28.6 mm in August to a
maximum of 114.1 mm in January (Australian Bureau of Meteorology website). The
soil is a Tropeptic Eutrustox Oxisol (USDA Soil Taxonomy, USDA (1998)) - Orthic
Ferralsol (FAO, 1998), characterised by relatively slow permeability and high clay
content (50-65% clay). The effective rooting depth is 1.2 m and the plant available
water holding capacity is 100 mm. The main physical and chemical soil properties of
the field site are highlighted in Table 4-1.
4.3.2 Experimental set-up
The experiment was established in a slit plot design with two main plots (legume
and grass ley pastures) and two sub plots (N fertiliser rates) with three replicates.
Each main plot was 30 m x 10.8 m, with main plots split into two subplots (15 m x
and 10.8 m) during the sorghum cropping season. Allowing for buffer rows, the
effective subplot area was 12 m x 7.2 m, or 8 crop rows spaced 0.9 m apart.

Legume pastures can reduce N2O emissions intensity in subtropical cereal cropping systems (Paper 2)
113
Table 4-1 - Main soil physical and chemical properties of surface 30 cm of soil
profile for the two cropping histories (mean ± SE, n=3) at the beginning of the
sorghum season at Kingaroy research station, Queensland, Australia.
Soil Property (0-30 cm) Legume Grass
pH (H2O) 5.12 ± 0.03 5.30 ± 0.02
DOC (kg C ha-1)* 43.04 ± 11.98 56.05 ± 2.97
PMN (kg N ha-1)** 12.78 ± 1.33 9.25 ± 1.08
Bulk density 0-30 cm (g cm-3) 1.18 ± 0.08
Texture (USDA) Clay
Clay (%) 55
Silt (%) 14
Sand (%) 31
*Dissolved organic carbon. **Potentially mineralisable nitrogen.
4.3.3 Cropping histories
N2O emissions and yields were measured in plots planted with sorghum (Sorghum
bicolor L.) following two distinct cropping histories. One crop rotation (hereafter
called legume cropping history) included two seasons of alfalfa pasture (Medicago
sativa, L., summers 2009/2010 and 2010/2011), one season of maize (Zea mays, L.,
summer 2011/2012) and one season of sulla ley pasture (Hedysarum coronarium L.,
winter 2012) prior to sowing sorghum. The other crop rotation (hereafter called grass
cropping history) included two seasons of a mixed Rhodes grass (Chloris gayana,
K.) and alfalfa pasture (summers 2009/2010 and 2010/2011), one season of maize
(summer 2011/2012) and one season of wheat (Triticum aestivum L., winter 2012).
Although the mixed alfalfa pasture was sown in consociation with Rhodes grass, the
Rhodes grass became rapidly predominant and by the end of the first season the
pasture was composed almost completely by Rhodes grass. All crops in both
rotations were not fertilised. Sulla and wheat were direct drilled in August 2012 and
managed as forage crops. Both crops were terminated 28 November 2012 with all
residues returned to the soil as mulch before being incorporated with four shallow
cultivations (20 cm). The incorporation of sulla residues (2.3 Mg dry matter ha-1,
1.57% N) was estimated to supply the soil approximately 36 kg N ha-1, while wheat
residues (1.24 Mg dry matter ha-1, 0.75% N) about 9 kg N ha-1. The entire field study
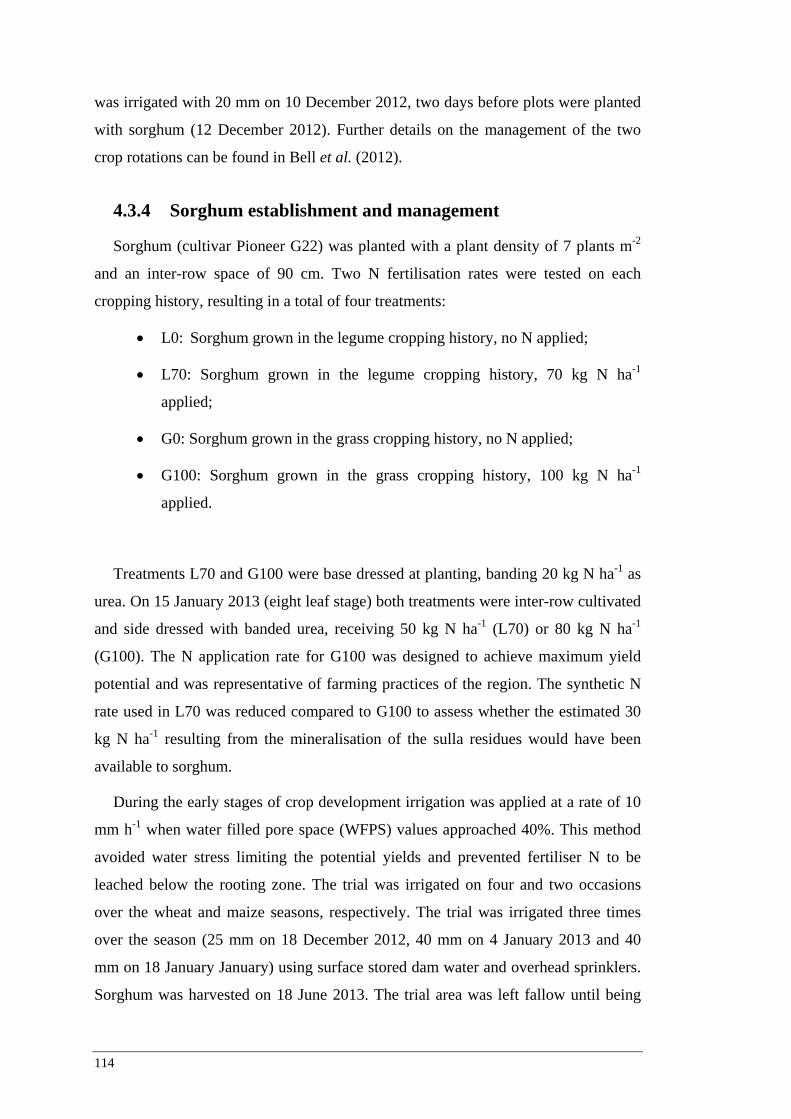
114
was irrigated with 20 mm on 10 December 2012, two days before plots were planted
with sorghum (12 December 2012). Further details on the management of the two
crop rotations can be found in Bell et al. (2012).
4.3.4 Sorghum establishment and management
Sorghum (cultivar Pioneer G22) was planted with a plant density of 7 plants m-2
and an inter-row space of 90 cm. Two N fertilisation rates were tested on each
cropping history, resulting in a total of four treatments:
• L0: Sorghum grown in the legume cropping history, no N applied;
• L70: Sorghum grown in the legume cropping history, 70 kg N ha-1
applied;
• G0: Sorghum grown in the grass cropping history, no N applied;
• G100: Sorghum grown in the grass cropping history, 100 kg N ha-1
applied.
Treatments L70 and G100 were base dressed at planting, banding 20 kg N ha-1 as
urea. On 15 January 2013 (eight leaf stage) both treatments were inter-row cultivated
and side dressed with banded urea, receiving 50 kg N ha-1 (L70) or 80 kg N ha-1
(G100). The N application rate for G100 was designed to achieve maximum yield
potential and was representative of farming practices of the region. The synthetic N
rate used in L70 was reduced compared to G100 to assess whether the estimated 30
kg N ha-1 resulting from the mineralisation of the sulla residues would have been
available to sorghum.
During the early stages of crop development irrigation was applied at a rate of 10
mm h-1 when water filled pore space (WFPS) values approached 40%. This method
avoided water stress limiting the potential yields and prevented fertiliser N to be
leached below the rooting zone. The trial was irrigated on four and two occasions
over the wheat and maize seasons, respectively. The trial was irrigated three times
over the season (25 mm on 18 December 2012, 40 mm on 4 January 2013 and 40
mm on 18 January January) using surface stored dam water and overhead sprinklers.
Sorghum was harvested on 18 June 2013. The trial area was left fallow until being

Legume pastures can reduce N2O emissions intensity in subtropical cereal cropping systems (Paper 2)
115
cultivated on 6 August 2013 (offset disc and chisel plough to a depth of 20 cm) and
on 19 September 2013 (offset disc to a depth of 20 cm) to prepare the seedbed for the
next crop. Irrigations were conducted on 27 and 29 August 2013 (30 and 40 mm,
respectively) to assess whether significant amounts of N were still available for
nitrification or denitrification after harvest. Details about crop rotations and farming
operations are displayed in Table 4-2.
Table 4-2 - Details of crop rotations and farming operations for the four
treatments at Kingaroy research station.
Date L0 L70 G0 G100
Summer 2009/2010 Alfalfa pasture Alfalfa pasture Rhodes grass + alfalfa
pasture
Rhodes grass + alfalfa
pasture
Summer 2010/2011 Alfalfa pasture Alfalfa pasture Rhodes grass + alfalfa
pasture
Rhodes grass + alfalfa
pasture
Summer 2011/2012 Maize Maize Maize Maize
Winter 2012 Sulla pasture Sulla pasture Wheat Wheat
28-30/11/2012 Pastures terminated and entire field trail cultivated four times with offset disc to 20 cm
10/12/2012 Entire field trail irrigated with 20 mm
12/12/2012 Sorghum planted Sorghum planted
Applied 20 kg N ha-1
Sorghum planted Sorghum planted
Applied 20 kg N ha-1
18/12/2012 Entire field trail irrigated with 25 mm
04/01/2013 Entire field trail irrigated with 40 mm
14/01/2013 Applied 50 kg N ha-1 Applied 80 kg N ha-1
18/01/2013 Entire field trail irrigated with 40 mm
18/06/2013 Entire field trail harvested
06/08/2013 Entire field trail cultivated twice with offset disc down to 20 cm
27/08/2013 Entire field trail irrigated with 30 mm
29/08/2013 Entire field trail irrigated with 40 mm
19/09/2013 Entire field trail cultivated with offset disc down to 20 cm

116
4.3.5 Measurement of N2O and CO2 emissions
The use of a fully automated greenhouse gas measuring system enabled a long-
term high temporal resolution dataset to be established. N2O fluxes were monitored
for nine months, from sorghum planting (12 December 2012) to the final preparation
of the seedbed for the subsequent crop (19 September 2013) to assess overall N2O
losses over the cropping season as well as the post-harvest period.
N2O emissions were captured using twelve automated sampling chambers (one
per plot). Chambers were made of transparent acrylic panels, measured 50 cm x 50
cm x 15 cm and were attached via a rubber seal to stainless steel frames inserted 10
cm into the ground. The chambers were closed airtight with lids operated by
pneumatic actuators and connected to a fully automated sampling and analysis
system as described in Chapter 3 and in Scheer et al. (2013b).
During a measurement cycle a set of four chambers closed for 60 min with each
chamber sampled 4 times for 3 min. A certified gas standard of 500 ppb N2O (BOC –
Munich, Germany- and Air Liquide –Dallas, TX, USA) was pumped into the gas
chromatograph every 15 min. At the end of the cycle the chambers reopened and the
next set of four chambers closed for sampling. One complete cycle of twelve
chambers lasted 3 hours, during which each chamber was sampled for 1 hour and
remained opened for 2 hours to restore ambient conditions. This method enabled the
determination of up to 8 single fluxes per chamber per day.
The air samples taken from each chamber headspace were automatically pumped
to the sampling unit at a flow rate of 200 ml min-1. During the 3 min sampling period
the air sample was continuously analysed for CO2 concentration using a single path
infra-red gas analyser (Licor, LI 820, St Joseph, MI, USA). N2O concentration was
analysed injecting 3 ml of gas sample into the carrier gas (N2) of a gas
chromatograph (Model 8610C, SRI Instruments, USA) equipped with a 63Ni electron
capture detector (ECD). A column filter containing sodium hydroxide-coated silica
(Ascarite, Sigma-Aldrich, St. Louis, MO, USA) was installed upstream of the ECD
to minimise the CO2 and water vapour interference on N2O measurements. The
column filter was replaced every two weeks.
During the three hours of a complete measuring cycle the system was
automatically calibrated twelve times by a single point calibration using the certified

Legume pastures can reduce N2O emissions intensity in subtropical cereal cropping systems (Paper 2)
117
gas standard of 500 ppb N2O. Greater accuracy was achieved with a multi-point
calibration during the measuring season using certified gas standards of 500, 980,
5030 ppb N2O (BOC –Munich, Germany). The GC response over this range was
determined to be linear so no correction was necessary to precisely determine high
fluxes. The detection limit of the system was calculated using the methodology
established by Parkin et al. (2012) and was approximately 0.5 g N2O-N ha-1 day-1 for
N2O and 1 kg CO2-C ha-1 day-1 for CO2, respectively. Throughout the season all
system components were constantly checked for leaks, making the sample dilution
due to leakage negligible. The system was programmed to open the chambers if rain
events exceeded 5 mm or the internal air temperature of the chamber exceeded 55°C.
During irrigation events the system was stopped and all chamber lids were opened to
allow water to enter inside the chambers.
The chamber placement strategy was based on the methodology established by
Kusa et al. (2006) and Parkin and Kaspar (2006) in order to measure N2O emissions
from both a diffused source (crop residues) and a localised source (banded fertiliser).
Two of the three replicate chambers of each treatment were positioned over the crop
row and the third in the inter-row. Chambers positioned over the crop row included
the banded fertiliser (10 cm from the plant row) in the chamber area. Sorghum plants
inside the chamber positioned over the crop row were cut when exceeding the
chamber headspace, a practice established by Drury et al. (2008); Halvorson et al.
(2008) and Hu et al. (2013). As recommended by Kusa et al. (2006) and Parkin and
Kaspar (2006), the impact of this practice on belowground C and N dynamics, and
therefore N2O emissions, was minimised by relocating all chambers placed over the
crop row to a new section of the crop row every fortnight. This strategy proved to be
effective as only marginal differences in daily N2O emissions were observed in the
control treatments between chambers placed in the inter-row and over the crop row
(Table 4-3, Figure 4-5).
The measuring system was deployed immediately after planting and temporarily
withdrawn to permit farming operations (side dressing, harvest, post-harvest
cultivations). During the nine months of this study an average of 2700 valid N2O and
CO2 fluxes were obtained for each treatment.

118
4.3.6 Calculation of N2O and CO2 emissions
Hourly N2O fluxes were calculated with the method described by Barton et al.
(2008), determining the slope of the linear increase or decrease of the four gas
concentrations measured during the 60 minutes of chamber closure period. In
contrast, hourly CO2 fluxes were computed using the linear increase of six
concentrations measured in the first two sampling intervals, a method used to avoid
possible saturation of CO2 partial pressure in the chamber. N2O and CO2 fluxes were
corrected for the three factors of air temperature inside the chamber, atmospheric
pressure and the ratio between chamber volume and soil area using:
9
6
101060
⋅⋅⋅⋅⋅⋅
=corrCH
CH
MVAMWVbF
Equation 1
where F is the emission rate (µg m-2 hour-1), b is the variation of gas concentration
inside the chamber (ppb min-1), VCH is the volume of the chamber (m3), MW is the
gas molar weight (28 for N2O-N and 12 for CO2-C), 60 is the conversion from
minutes to hours, 106 converts g to µg, ACH is the surface area of the chamber (m2),
MVcorr is the mole volume (m3 mol-1) corrected for pressure and temperature as
presented in Equation 2, 109 converts ppb to µL m-3.
×+
⋅=10
15.27315.27302241.0
ppTMVcorr
Equation 2
where 0.02241 m3 is 22.41 L molar volume, T is the temperature of the chamber
at the time of the measurement (Kelvin), p0 is the air pressure at sea level and p1 is
the air pressure at the study site. To provide greater accuracy, air pressure at the site
was determined using a barometric equation based on the local altitude.

Legume pastures can reduce N2O emissions intensity in subtropical cereal cropping systems (Paper 2)
119
The Pearson correlation was then used to quality-check flux measurements.
Fluxes above the detection limit were discarded if the regression coefficient (r2) was
< 0.80 for N2O and < 0.90 for CO2, respectively. Mean daily fluxes for each
treatment were calculated using weighted averages of hourly data from the three
replicates. That is, for each treatment, hourly fluxes from the two chambers over the
crop row (covering 50 cm around the crop row) were averaged. The obtained mean
flux was then averaged with the mean of hourly fluxes measured by the chamber in
the inter-row (covering 50 cm in the inter-row). This method made it possible to
accurately calculate the average N2O emissions of each treatment, accounting for the
spatial variability occurring between two crop rows (98 cm). Cumulative N2O fluxes
[kg N2O-N ha-1] were determined by summing daily N2O fluxes measured during the
study period.
Emission factors were corrected for background emissions (Kroeze et al., 1997)
using the following:
𝐸𝐸 % = 𝑁2𝑂 (𝐸𝐹𝐹𝐹) − 𝑁2𝑂 (𝑈𝑈𝑈𝐹𝐹𝐹)
𝑁 𝑈𝐹𝐹𝐹𝑓𝑓𝑓𝑓𝐹𝐹 𝑓𝑈𝑖𝑖𝐹 ∙ 100
Equation 3
where EF % is the emission factor reported as a percentage of N fertiliser input
(kg N ha-1 season-1) lost as N2O-N, N2O (Fert) and N2O (Unfert) (kg N ha-1 season-1)
are the cumulative N2O-N emissions measured in the fertilised and non-fertilised
treatments with the same cropping history, respectively.
Soil CO2 fluxes, considered a proxy data for estimating soil respiration rates
(inclusive of microbial and roots respiration), were calculated using only the
chambers placed in the inter-row. Missing daily N2O and CO2 fluxes (due to rare
occasional failures of the measuring system) were estimated with the Amelia II
multiple imputation model (Honaker and King, 2010) using daily values of soil
Water-Filled Pore Space (WFPS) (0-10 cm, 10-20 cm and 20-30 cm) and mineral N
content (0-30 cm).

120
4.3.7 Auxiliary measurements
Chamber air temperature and soil temperature were measured every 5 minutes
using RTD probes (Temperature Controls Pty Ltd, Australia) buried at 10 cm depth
near to a chamber. Four Frequency Domain Reflectometers (FDR, EnviroScan
probes, Sentek Technologies, Australia) measured water dynamics of the soil profile
throughout the field study. Before the beginning of the experiment all FDR probes
were calibrated for the local soil type following producer recommendations (Sentek
Technologies, 2011). The FDR probes were deployed at planting and programmed to
measure the volumetric soil water content at three depths (0-10 cm, 10-20 cm, 20-30
cm) at 30 minute intervals. Water filled pore space (WFPS) was calculated using a
particle density of 2.79 g cm-3.
Soil chemical properties at the site were determined at sorghum planting, with soil
samples collected from every plot with a manual open-faced bucket auger (10 cm
diameter). Each plot was sampled at three depths (0-10, 10-20, 20-30 cm) and then
analysed for texture (hydrometer method as described by Carter and Gregorich
(2007)), pH, NH4-N, NO3-N, dissolved organic C and potentially mineralisable N.
Routine soil sampling was then conducted at regular intervals during the growing
season and soil samples (0-10, 10-20, 20-30 cm) were analysed for NH4-N, NO3-N.
Each soil sample consisted of three subsamples taken at 10 cm intervals from the
crop row of then mixed in order to ensure it represented the banded and non-banded
areas of the plot.
Soil NH4-N and NO3-N were extracted by shaking 20 g soil in 100 mL 1 M KC1
solution at room temperature for 60 minutes (Carter and Gregorich, 2007). This
solution was then filtered and stored in a freezer until analysed colorimetrically for
NH4-N and NO3-N using an AQ2+ discrete analyser (SEAL Analytical WI, USA).
Dissolved organic C was extracted at room temperature by shaking 20 g soil in 100
mL of deionised water for 60 minutes. The suspension was then centrifuged for 15
minutes at 10000 rotations per minute and the supernatant filtered with a 0.45 µm
pore diameter cellulose membrane filter (based on Scaglia and Adani (2009)). The
samples were analysed using a supercritical water oxidation technique with the
Seivers InnoVox laboratory TOC analyser (General Electric, Boulder, CO, USA).

Legume pastures can reduce N2O emissions intensity in subtropical cereal cropping systems (Paper 2)
121
Potentially mineralisable N was determined by incubating soil samples at field
capacity at 30°C for 0, 7 and 14 days (Bremner, 1965). The samples were taken on
12 December 2012 sampling each plot at three depths (0-10, 10-20, 20-30 cm).
Mineral-N formed during the incubation was measured by 2M KCl extraction
followed by automated colorimetric determination. For each treatment, the amount of
potentially mineralisable N was calculated as the difference between the mineral N
determined at day 7 and 14 in order to avoid the Birch effect (Birch, 1958).
Total biomass was determined at physiological maturity by collecting duplicate
samples of 1m of crop row in each plot. Samples were oven dried at 60°C to
determine dry weight before being weighed and ground for total N content, which
was measured using a C-N analyser after Dumas combustion (LECO TruMac, LECO
Corporation, St. Joseph, MI, USA). Grain yield was measured in each plot by
harvesting duplicate 1.8 m wide strips for the plot length using a plot combine. Grain
samples were also dried at 60°C before quantification of yields on a dry weight basis,
while grain N was determined using a methodology similar to that in biomass
samples.
Fertiliser N recovery in the crop (REfN) was determined applying 15N-labelled
urea in micro-plots (0.9 m x 1.5 m) located next to the measuring chambers. The L70
and G100 treatments received 5% excess 15N enriched urea both at planting and at
side dressing. The 15N-labelled urea was dissolved in 1 L of deionised water and
applied as a liquid solution in a sub-surface band, minimising in this way N losses
via runoff and NH3 volatilisation. Plants in the micro-plots were sampled at crop
harvest by collecting above- and below-ground material. The 15N analysis was
performed using a 20-22 Isotope Ratio Mass Spectrometer (Sercon Limited, UK).
More detailed information on the methodology used to determine the REfN is
presented in Chapter 5.

122
4.3.8 Statistical analysis
Statistical analyses were performed within the MATLAB 2012a environment
(MathWorks Inc., Natick, MA, US), where the temporal patterns of daily N2O
emissions displayed by the four treatments were compared using the autoregressive
integrated moving average (ARIMA) model (Box and Pierce, 1970). This model was
fitted to each time series using the following formula:
∆𝑑𝑌𝑡 = 𝜙0 + 𝜙1∆𝑑𝑌𝑡−1 + ⋯+ 𝜙𝑝∆𝑑𝑌𝑡−𝑝 + 𝑎𝑡 + 𝜃1𝑎𝑡−1 + ⋯+ 𝜃𝑞𝑎𝑡−𝑞,
Equation 4
where Δ = (1 − 𝐵) and 𝐵 are the backshift operators. The roots of the AR and
MA polynomials satisfied the stationarity and invertibility conditions, respectively.
The values of p, d and q were determined by the Bayesian information criterion
(BIC), and the unknown parameters were estimated by least squares estimators. The
residuals 𝑎�𝑡 were computed by Φ�(𝐵)Θ�−1(𝐵)𝑌𝑡, where Φ�(𝐵) and Θ�(𝐵) denote the
estimates of the autoregressive and moving average parameters, respectively. The
bootstrap residual resampling method was used to evaluate the variation, while
prediction intervals were constructed using the percentile method. A mixed-design
analysis of variance (ANOVA) was performed to determine the influence of
fertilisation rate or cropping history on N2O emissions and grain yields. The
Bonferroni post hoc test was used to compare average and cumulative N2O
emissions, N2O intensities, grain yields, above ground biomass productions and
harvest indexes. As with the method used for the calculation of daily N2O fluxes,
standard errors of average and cumulative N2O emissions and N2O intensities were
calculated by assigning different weights to the chamber in the inter-row (0.5) and
over the rows (0.25).
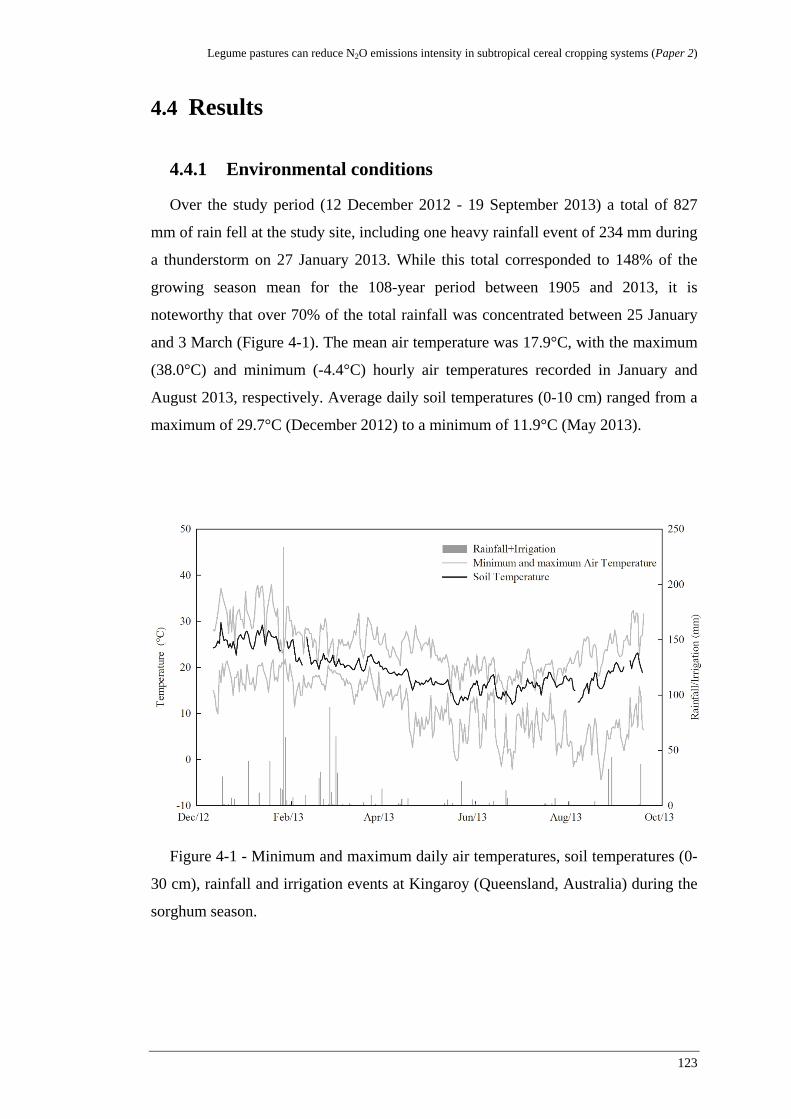
Legume pastures can reduce N2O emissions intensity in subtropical cereal cropping systems (Paper 2)
123
4.4 Results
4.4.1 Environmental conditions
Over the study period (12 December 2012 - 19 September 2013) a total of 827
mm of rain fell at the study site, including one heavy rainfall event of 234 mm during
a thunderstorm on 27 January 2013. While this total corresponded to 148% of the
growing season mean for the 108-year period between 1905 and 2013, it is
noteworthy that over 70% of the total rainfall was concentrated between 25 January
and 3 March (Figure 4-1). The mean air temperature was 17.9°C, with the maximum
(38.0°C) and minimum (-4.4°C) hourly air temperatures recorded in January and
August 2013, respectively. Average daily soil temperatures (0-10 cm) ranged from a
maximum of 29.7°C (December 2012) to a minimum of 11.9°C (May 2013).
Figure 4-1 - Minimum and maximum daily air temperatures, soil temperatures (0-
30 cm), rainfall and irrigation events at Kingaroy (Queensland, Australia) during the
sorghum season.

124
4.4.2 Seasonal variability of soil conditions
The WFPS of the topsoil (0-30 cm) varied in response to rainfall, irrigation events
and crop growth. At the beginning of the season WFPS values fluctuated between
36% and 47% due to the rapid crop development and irrigation events (Figure 4-2).
WFPS ranged from 30% to 50% during most of the study. Values up to 66% were
measured between late January and mid-March as a consequence of the intense
rainfall events that occurred during this period. After March average WFPS values
started gradually to decrease as a result of the declined rainfall regime.
Figure 4-2 - Daily soil N2O fluxes and water-filled pore space (WFPS, 0-30 cm)
for the four treatments during the sorghum season in Kingaroy (Queensland,
Australia). Arrows indicate the timing of N fertiliser applications.
In the 0-30 cm sampling zone, NH4+-N was the dominant form of soil mineral N.
With the possible exception of the sampling event at sowing, no consistent response
to history or fertiliser application was observed regarding NH4+-N dynamics (Figure
4-3a). At sorghum planting, NH4+-N contents in the top 30 cm averaged 40 kg N ha-1
and then stabilised between 16 and 33 kg N ha-1 for the remainder of the season.
Limited response to history or N fertiliser application was observed also in soil NO3--
N contents (Figure 4-3b), with the exception of the first month of the growing
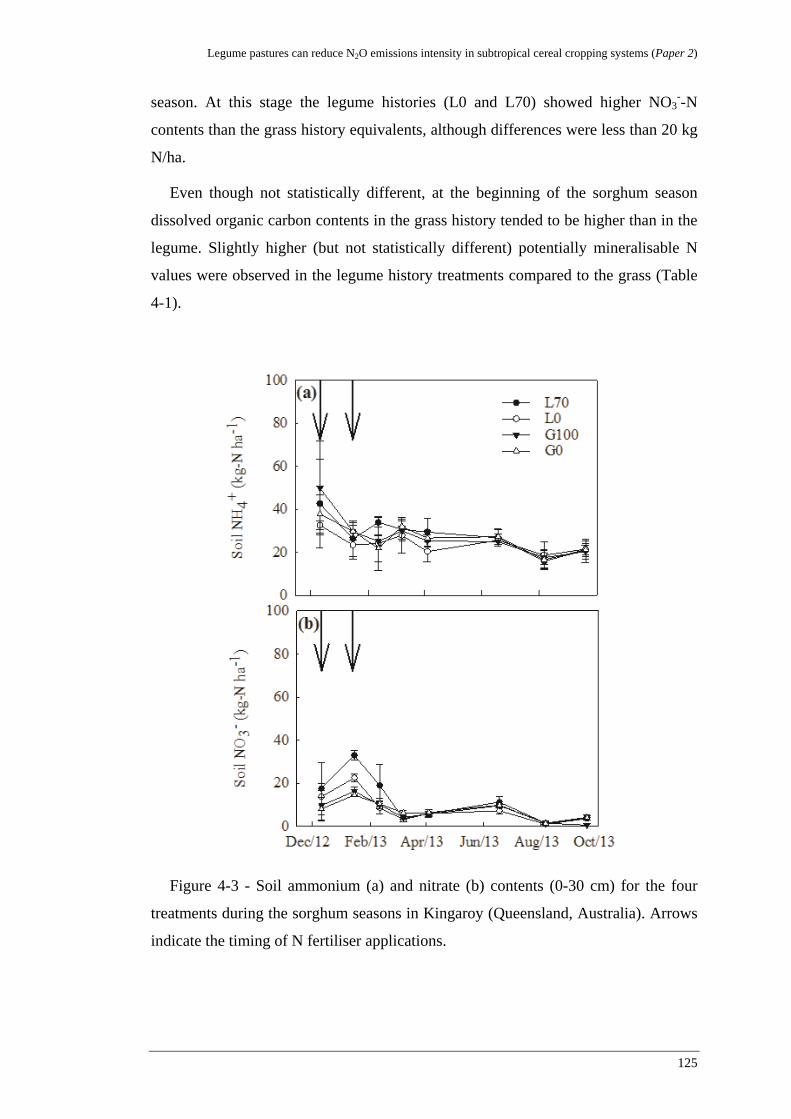
Legume pastures can reduce N2O emissions intensity in subtropical cereal cropping systems (Paper 2)
125
season. At this stage the legume histories (L0 and L70) showed higher NO3--N
contents than the grass history equivalents, although differences were less than 20 kg
N/ha.
Even though not statistically different, at the beginning of the sorghum season
dissolved organic carbon contents in the grass history tended to be higher than in the
legume. Slightly higher (but not statistically different) potentially mineralisable N
values were observed in the legume history treatments compared to the grass (Table
4-1).
Figure 4-3 - Soil ammonium (a) and nitrate (b) contents (0-30 cm) for the four
treatments during the sorghum seasons in Kingaroy (Queensland, Australia). Arrows
indicate the timing of N fertiliser applications.

126
4.4.3 N2O emissions
N2O emissions varied temporally and spatially in response to N fertilisation rate
and cropping history. In all treatments significant N2O losses occurred between mid-
December 2012 and mid-March 2013, when soil mineral N contents and WFPS
values were higher than in the remainder of the study period (Figure 4-2, Figure 4-3).
During this period N2O emissions increased shortly after rain or irrigation events.
This trend was particularly evident in the G0 and G100 treatments, where N2O
emission rates increased more abruptly than in L0 and L70 (Figure 4-2).
In all except G0 treatments, the highest emission pulse was observed after the
rainfall event on 27 January, when a total of 234 mm rainfall fell over 24 hours.
During this event N2O emissions in treatments L70 and G100 were up to 4 and 6 fold
those of the non-fertilised treatments, respectively. After this event, N2O emission in
all treatments progressively declined to background levels, with the only exception
being G100, where a substantial N2O emission pulse was measured after another 260
mm rainfall fell at the field site between 19 February and 3 March (Figure 4-2). After
mid-March daily N2O fluxes in all treatments never exceeded 1 g N ha-1 day-1 despite
several rain events. Emissions did not increase even after the two irrigation events on
27 and 29 August 2013 or the two cultivation events on 6 August and 19 September
2013.
During the period of highest emissions (December 2012 to March 2013) the
ARIMA model highlighted significant treatment effects on the temporal pattern of
N2O emissions. Before side dressing, the two N2O emission pulses measured in
G100 and G0 significantly exceeded those in L70 and L0, respectively (Figure 4-4a,
b). After side dressing the emission pulse in G100 was significantly higher than that
in L70, while no substantial differences were observed between G0 and L0 (Figure
4-4c, d).

Legume pastures can reduce N2O emissions intensity in subtropical cereal cropping systems (Paper 2)
127
Figure 4-4 - 95% confidence intervals of N2O fluxes in the different treatments
during the period of highest emissions (December 2012-March 2013) in Kingaroy
(Queensland, Australia). Confidence intervals are displayed using different scales.
Arrows indicate the timing of N fertiliser applications.

128
The chamber placement highlighted two different patterns in the spatial variability
of N2O flux rates during the period of high emissions. In the two non-fertilised
treatments and in G100, N2O fluxes from the crop row (inclusive of the banded
fertiliser) did not differ significantly from those from the inter-row (Figure 4-5b, c,
d). Whereas in the L70 treatment, average N2O emissions measured in the crop row
exceeded those in the inter-row by a factor of 6 (Figure 4-5a).
Only the N2O cumulative losses measured in G100 were significantly higher
(p<0.05) than those of the other treatments. Cumulative losses in L70 did not display
significant differences compared to the non-fertilised treatments (Table 4-3).
Table 4-3 - Seasonal N2O average fluxes, cumulative N2O fluxes, N2O intensities
(mean ± SE, n=3), emission factors and cumulative CO2 fluxes as a function of the
four treatments. Means denoted by a different letter indicate significant differences
between treatments (p<0.05).
Measurement Treatment
L0 L70 G0 G100
Average Flux [g N2O-N ha-1 d-1] 0.85 ± 0.08 a 2.41 ± 0.82 a 0.94 ± 0.18 a 5.07 ± 0.58 b
Cumulative N2O Flux [kg N2O-N ha-1 season-1] 0.24 ± 0.02 a 0.68 ± 0.23 a 0.27 ±0.05 a 1.43 ± 0.16 b
N2O Intensity [kg N2O-N t-yield-1 ha-1] 0.09 ± 0.01 a 0.13 ± 0.04 a 0.28 ± 0.05 b 0.28 ± 0.03 b
Emission Factor [%] - 0.63 - 1.17
Cumulative CO2 Flux [kg CO2-C ha-1 season-1] 33.4 ± 6.51 a 34.96 ± 5.21 a 29.22 ± 3.37 a 33.30 ± 4.92 a

Legume pastures can reduce N2O emissions intensity in subtropical cereal cropping systems (Paper 2)
129
Figure 4-5 - Daily soil N2O fluxes measured in the row (R) and inter-row (IR)
chambers for the L70 (a), L0 (b), G100 (c) and G0 (d) treatments during the period
of highest emissions (December 2012-March 2013) in Kingaroy (Queensland,
Australia). Arrows indicate the timing of N fertiliser applications. Graphs are in
different scales.

130
The mixed-design ANOVA analysis indicated that the main effect regulating N2O
emissions was the N fertiliser rate, while the cropping history per se had no
significant effect on measured N2O losses (Table 4-4).
Table 4-4 - Significance of treatment effect (applied fertiliser rate and cropping
history) on N2O emissions and grain yields during the sorghum season.
Measurement Factor p-Value F Statistics
N2O Fertiliser rate ** 17.37
Cropping history NS 2.68
Grain yield Fertiliser rate *** 255.79
Cropping history ** 14.41
*, **, ***: probability significant at 0.05, 0.01 and 0.001 level, respectively. NS: not significant.
4.4.4 CO2 emissions
Soil CO2 fluxes showed little variation between treatments and exhibited a
temporal pattern influenced by soil temperatures and WFPS (Figure 4-6). Average
soil CO2 emissions peaked during the warmest months (early January to late March
2013, average of 23 kg CO2-C ha-1 day-1) before decreasing to <10 kg CO2-C ha-1
day-1 during the colder and drier period from April to late August 2013.During the
fallow period CO2 fluxes remained below 5 kg CO2-C ha-1 day-1. Emissions in all
treatments did not increase after the tillage event of 6 August 2013 but rose to an
average of 17 kg CO2-C ha-1 day-1 after the two irrigation events of 27 and 29
August.
In contrast to N2O emissions, CO2 fluxes tended to not to rise until several days
after a rainfall/irrigation event. This was particularly evident with the rainstorm on
27 January, when CO2 emission did not start to increase until seven days after the
event. Overall, cumulative CO2 emissions measured in the inter-rows showed little
variations between treatments (Table 4-3) and no significant differences in the
pattern of daily CO2 emissions was detected by the ARIMA model.
Legume pastures can reduce N2O emissions intensity in subtropical cereal cropping systems (Paper 2)
131
Figure 4-6 - Daily soil CO2 fluxes and water-filled pore space (WFPS, 0-30 cm)
for the four treatments during the sorghum season in Kingaroy (Queensland,
Australia). Arrows indicate the timing of N fertiliser applications.
4.4.5 Crop biomass, grain production and N uptake
Sorghum biomass production and yield were substantially affected by cropping
history and N fertiliser rate. Both biomass and yield in the non-fertilised sorghum
following the legume ley pasture (L0) were significantly higher (p < 0.05) than those
in the corresponding treatment following the grass ley pasture (G0). Grain and
biomass production in L70 were comparable to those in G100 and both were
significantly higher than those in the non-fertilised treatments (Table 4-5). The
harvest index (kg grain ha-1 / kg total biomass ha-1) of L0 was significantly higher
than in G0, but comparable to that of both L70 and G100.
The mixed-design ANOVA analysis showed that both the N fertiliser rate and the
cropping history had significant effects on grain yield. However, the cropping history
F value was substantially lower than that of the fertiliser rate, indicating that the
fertiliser rate had greater influence on yields (Table 4-4).
Soil N availability in the legume cropping history was higher than in the grass one
and N uptake values measured in L0 and L70 exceeded those of G0 and G100,
respectively. Though the N fertiliser rate in G100 was 30 kg N ha-1 higher than in
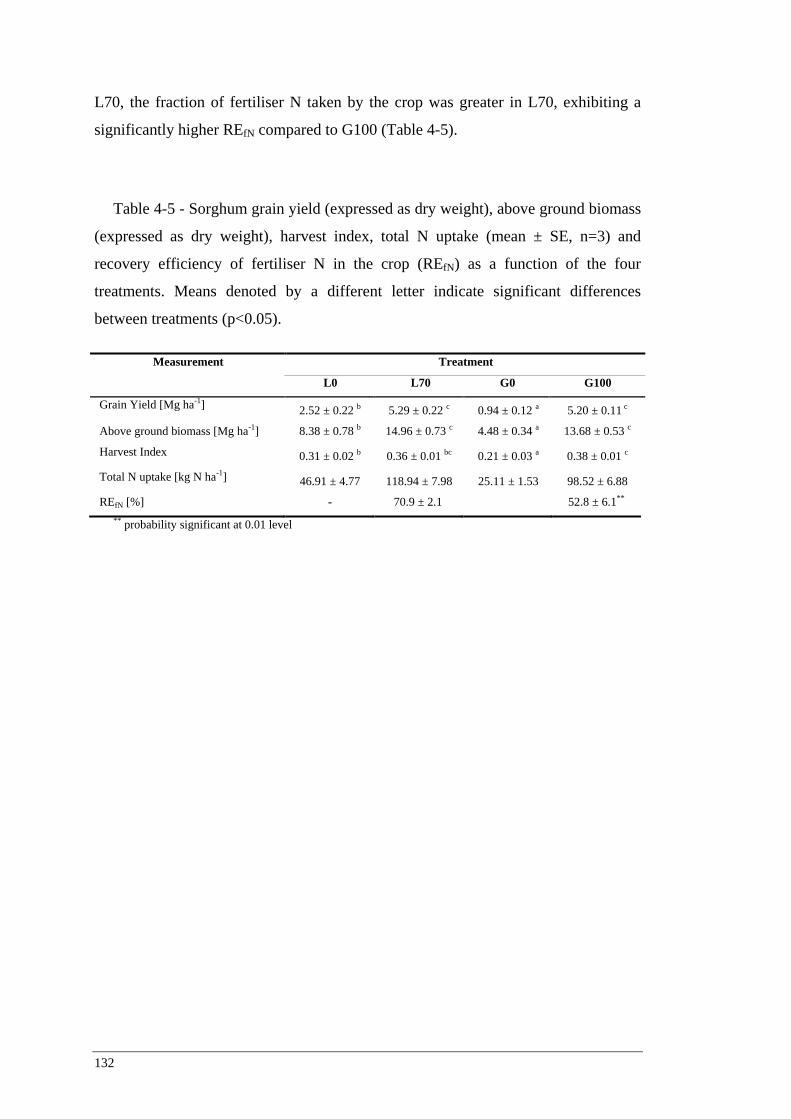
132
L70, the fraction of fertiliser N taken by the crop was greater in L70, exhibiting a
significantly higher REfN compared to G100 (Table 4-5).
Table 4-5 - Sorghum grain yield (expressed as dry weight), above ground biomass
(expressed as dry weight), harvest index, total N uptake (mean ± SE, n=3) and
recovery efficiency of fertiliser N in the crop (REfN) as a function of the four
treatments. Means denoted by a different letter indicate significant differences
between treatments (p<0.05).
Measurement Treatment
L0 L70 G0 G100
Grain Yield [Mg ha-1] 2.52 ± 0.22 b 5.29 ± 0.22 c 0.94 ± 0.12 a 5.20 ± 0.11 c
Above ground biomass [Mg ha-1] 8.38 ± 0.78 b 14.96 ± 0.73 c 4.48 ± 0.34 a 13.68 ± 0.53 c
Harvest Index 0.31 ± 0.02 b 0.36 ± 0.01 bc 0.21 ± 0.03 a 0.38 ± 0.01 c
Total N uptake [kg N ha-1] 46.91 ± 4.77 118.94 ± 7.98 25.11 ± 1.53 98.52 ± 6.88
REfN [%] - 70.9 ± 2.1 52.8 ± 6.1** ** probability significant at 0.01 level

Legume pastures can reduce N2O emissions intensity in subtropical cereal cropping systems (Paper 2)
133
4.5 Discussion
4.5.1 N2O emissions from cropped soils after termination of a pasture phase
To date little research has been undertaken on N2O emissions following the
termination of ley pastures, specifically in terms of how management, climatic
conditions and chemical composition of the residues influence N2O losses during
subsequent cropping seasons. This is the first study to investigate the role of these
factors in two subtropical ley pasture-cereal crop rotations using a fully automated
measuring system providing high temporal resolution data on N2O emissions.
Studies conducted on various cropping systems under different environmental
conditions indicate that the incorporation of legume residues per se is not sufficient
to trigger elevated N2O emissions. For example, extremely high N2O emissions
following the plough-down of legume pastures have often been measured in cold
climates during spring, when high levels of soil moisture coincide with increasing
soil temperatures (Wagner-Riddle et al., 1997; Wagner-Riddle and Thurtell, 1998;
Pappa et al., 2011). In contrast, limited N2O emissions following the incorporation of
legume pastures have been reported under relatively dry condition in temperate,
subtropical and mediterranean climates (Baggs et al., 2000; Gomes et al., 2009;
Brozyna et al., 2013; Sanz-Cobena et al., 2014).
The availability of the N released by the legume residues to the soil microbial
pool, and therefore the magnitude of N2O emissions, appears therefore to be the
product of several concurrent factors.
4.5.2 Factors influencing N2O emissions and yields
In this study cumulative N2O emissions were primarily a function of the N
fertiliser rate applied, while cropping history had no significant effect. On the other
hand, crop biomass and grain production showed a clear response to increased N
availability in the legume history, irrespective of the N fertiliser input. While
incorporation of legume residues provided an additional 20-22 kg N ha-1 to the
sorghum crop in both L0 and L70 compared to G0 and G100, this additional N
release did not significantly enhance the nitrification or denitrification processes

134
compared to the incorporation of grass residues. Moreover, the temporal pattern of
daily N2O emissions was substantially affected by the cropping history and in the
first 10 weeks after sorghum establishment N2O emissions pulses in G0 and G100
were significantly higher than in L0 and L70, respectively.
We propose that this apparent contradiction can be explained by considering three
interacting factors: the fertiliser N rate applied, the synchrony between soil N
availability and crop N uptake, and the cropping history.
4.5.3 N fertilisation rates
The application of synthetic N fertiliser was the main factor responsible for
enhanced N2O emissions and the highest cumulative N2O losses were measured in
the two fertilised treatments. In L70 and G100 the highest N2O emission rates were
observed after side dressing, when the majority of the N fertiliser was applied and
WFPS exceeded 60% (Figure 4-2). The abrupt emission pulses after fertilisation can
be explained by considering the release dynamics of synthetic fertilisers (Crews and
Peoples, 2005). Under humid soil conditions urea is rapidly hydrolysed, leading to a
fast release of high amounts of mineral N in the soil. At side dressing sorghum plants
were still at an early stage of physiological development and were able to take up
only a fraction of the mineral N applied. Therefore, significant amounts of mineral N
accumulated in the soil and became available to nitrifying and denitrifying
microorganisms. Indeed, sufficient surplus N must have still been present in the
highest N rate treatment (G100), where a secondary emission pulse was observed
between mid-February and mid-March, one month after side dressing.
Increased N2O emissions following the fertilisation events in this study did not
correspond to elevated soil mineral N contents in the first 30 cm, due probably to the
large rainfall event that fell over the trial shortly after side dressing. After this rain
event a large fraction of the applied N is likely to have leached deeper into the soil
profile, leaving little mineral N in the first 30 cm to be detected at the following
sampling events (Figure 4-3).
Overall, N2O emissions displayed a significant correlation with N fertilisation,
rising in nonlinear patterns at increasing N fertiliser rates (0, 70 and 100 kg N ha-1).
As observed by several authors (McSwiney and Robertson, 2005; Hoben et al., 2011;
Shcherbak et al., 2014), the fast release of mineral N after fertilisation can exceed the

Legume pastures can reduce N2O emissions intensity in subtropical cereal cropping systems (Paper 2)
135
plant uptake capability when N fertiliser is applied at high rates and the resulting
temporary surplus of mineral N can promote elevated nitrification and denitrification
rates if the appropriate soil water conditions are met. These findings indicate that the
best fertiliser management practices aimed at reducing N2O losses coincide with
those designed to achieve high levels of agronomic efficiency. N rates and
fertilisation techniques should therefore be aimed at maximising the crop uptake of
applied synthetic N.
4.5.4 Synchrony of N supply
Synchrony is a critical aspect in reducing N2O losses after the termination of a
legume pasture (Crews and Peoples, 2005; Jensen et al., 2012), which means
matching the N release resulting from the degradation of the legume residues with
the N uptake of the subsequent crop. The high emissions reported after the
termination of a legume pasture are often measured when the field site has been left
fallow for long periods (Wagner-Riddle et al., 1997; Wagner-Riddle and Thurtell,
1998; Pappa et al., 2011). Conditions can be highly conducive for elevated N2O
emissions when a soil is left fallow after the incorporation of fresh legume residues
since in the absence of a crop following the pasture, all the readily mineralisable C
from the legume residues becomes available to support the denitrification of large
amounts of NO3- accumulated in the soil.
In this study sorghum was planted 13 days after the termination of the pasture
phase. During the fallow prior to sorghum planting only 6 mm of rainfall fell,
limiting therefore the possibility of organic matter decomposition, mineral N
accumulation or generation of significant N2O emissions. Typically, the highest N
mineralisation rates from legume residues are reported to occur after about six weeks
from the termination of the pasture (Fox et al., 1990; Becker and Ladha, 1997;
Robertson, 1997; Park et al., 2010). In the present study this would have coincided
with the moment of maximum N uptake of sorghum, supplying in this way
approximately an extra 20-22 kg N ha-1 to the plants in L70 and L0. The good
synchrony between N release from the legume residues and N uptake of the sorghum
plant is confirmed by the high REfN measured in L70 (Table 4-5).
The potential of using legumes to support the growth of the following cereal crop
was highlighted by the significant enhancement of the soil N pool in the legume

136
cropping history. While the initial mineral N contents in the top 30 cm of the profile
were quantitatively similar between the legume and grass histories (Figure 4-3), there
was a higher proportion of that N in the form of NO3-N in the legume (33%) than the
grass (20%) histories. These data, combined with the increases in PMN (Table 4-1),
suggest greater mineralisable N reserves in the legume histories, which is also
reflected in sorghum growth, grain yield and N accumulation. Moreover, while the N
supply from the residue mineralisation was not substantial in G100 and G0, the
heavy rain events in January are likely to have promoted substantial N2 losses
(Schwenke et al., 2013), further reducing the N supply to the plants of these
treatments. The high N losses via leaching would have severely limited the efficiency
of the side dressing, resulting therefore in the lower REfN values measured in G100
compared to L70. Consequently, crop biomass and grain yields in L70 were
comparable to those of G100 despite a 30% reduction in fertiliser rate, while yields
in L0 were approximately double those in G0.
Overall, planting sorghum shortly after pasture termination proved an effective
strategy to reduce N2O losses due to the decomposition of legume residues. This
practice also resulted successful in supplying an extra source of N to sorghum,
increasing significantly the yields in both the fertilised (L70) and non-fertilised (L0)
treatments.
4.5.5 Cropping history
Although it did not have a statistically significant effect on cumulative N2O
emissions, the cropping history substantially influenced the temporal and spatial
patterns of N2O fluxes. In the first part of the season for example, daily N2O fluxes in
G100 and G0 tended to rise immediately after rain events and on these occasions
emissions were consistently higher than in L70 and L0, respectively (Figure 4-4a, b).
The grass cropping history treatments constituted also a more diffused source of N2O
emissions, with G100 and G0 displaying high N2O losses also from the inter-row,
while N2O fluxes from the inter-row in L70 and L0 never exceeded 12 g N ha-1 day-1
(Figure 4-5).
It is here hypothesised that the sharp increases of N2O emissions following
increments in WFPS, as well as the high fluxes measured across the whole field in
G100 and G0, are to be attributed to higher labile C in the soil of the grass cropping

Legume pastures can reduce N2O emissions intensity in subtropical cereal cropping systems (Paper 2)
137
history. Enhanced N2O emissions from soils with high DOC contents have been
reported by numerous studies (Elmi et al., 2003; Yao et al., 2009; Barton et al.,
2011). This positive correlation originates from the coupled biogeochemical cycles
of C and N. The degradation of plant material provides soil microbes with substantial
amounts of C, which under anaerobic conditions is oxidised by denitrifying
microorganisms via reducing NO3- to N2O (Conrad, 1996).
The DOC values observed at the beginning of the sorghum season tended to be
higher in the treatments following the termination of the grass pasture, where a
substantially higher amount of fine fibrous plant residues was present at sorghum
planting. Whilst not quantitatively documented, the presence of undecomposed roots
and crowns in the grass history would have continued to supplement the labile C
pool. This would have provided a uniformly distributed C source to support
microbial activity and therefore the potential for denitrification in both row and inter-
row areas (Figure 4-5). While this enhanced potential microbial activity in G0
became increasingly N-limited by the end of December, the provision of the N side
dressing in G100 allowed that activity to continue. When combined with the very
wet soil conditions, this high nutrient availability resulted in the significant N2O
emissions pulses observed in G100 from late January (Figure 4-5).
Conversely, the low C:N ratio of the sulla plants residues would likely have
contributed to a more rapid degradation of residues in the L0 and L70 treatments,
leaving less labile C to support continued microbial activity. This may have changed
during the season in the vicinity of the sorghum rows, where increasing root density
would have contributed to labile C stores. The marked contrast in N2O emissions
between the rows and inter-rows in both L0 and L70 (Figure 4-5) are consistent with
this hypothesis. Similar results to this study were reported by Sanz-Cobena et al.
(2014), who observed higher N2O emissions from maize after the incorporation of
barley compared to the same crop after the incorporation of a vetch pasture.
These findings highlight the potential role of the soil labile C pool in regulating
N2O losses. Specifically, denitrifying microorganisms can be more competitive than
plants in using even small amounts of NO3- when soil labile C content is sufficiently
high to sustain elevated microbial activity in anaerobic conditions. This was evident
in the non-fertilised treatments, where dry matter and grain yield in G0 were severely
limited by N availability but N2O emissions were almost identical. However, further

138
research is advocated to corroborate the results of this study. Specifically, future
studies should focus on the chemical availability of C supplied by crop residues and
its role in stimulating denitrification when the soil NO3- content is not a limiting
factor.
4.6 Implications for managing N2O emissions from a
cereal crop following a legume pasture
Introducing a legume ley pasture in a cereal-based cropping system enabled the
reduction of the synthetic N fertiliser applied to the following cereal crop and
significantly reduced the N2O emission factor for this crop compared to a grass ley
pasture. The emission factor of L70 (0.63%) was almost half of G100 (1.17%) and
was considerably lower than the 1% recommended by the IPCC methodology for
fertilised cropping systems (De Klein et al., 2006). Both Tier 1 and Tier 2
approaches consider an emission factor of 1% for N derived from the mineralisation
of crop residues. According to this method, in L70 the total N2O emissions resulting
from the mineralisation of approximately 30 kg N ha-1 contained in the legume
residues and combined with the application of 70 kg N ha-1 would have amounted to
about 1 kg N2O-N ha-1. Similarly, N2O losses from the two non-fertilised treatments
should have differed substantially, resulting in 0.3 and 0.1 kg N2O-N ha-1 from L0
and G0, respectively. However, the different dynamics observed in this study suggest
that the amount of N in the soil per se is not sufficient to correctly estimate N2O
emission factors, and that the quantity and availability of soil C should also be
considered.
The importance of soil labile C is reinforced when the N2O emissions intensity
(kg N2O-N yield-1 ha-1) of the legume and grass cropping histories are considered.
This measure effectively quantifies the efficiency of agronomic practices in
maximising grain yields while minimising N2O emissions. Despite the broad range
of grain yields, N2O emissions intensities were consistent among treatments with the
same cropping history, with intensities significantly lower in the legume compared to
the grass history (Table 4-3).

Legume pastures can reduce N2O emissions intensity in subtropical cereal cropping systems (Paper 2)
139
The introduction of a legume pasture phase in a cereal-based crop rotation seems
to offer multiple environmental and agronomic advantages. In the fertilised
treatments it resulted in a 50% reduction of the N2O-N emitted compared to
introducing a grass pasture, proving to be an effective mitigation strategy to reduce
the contribution of cereal cropping systems to greenhouse gas emissions. A pasture
phase can also contribute to increasing the soil organic matter, aggregate stability,
soil microbial pool and organic N content (Giller and Cadisch, 1995; Rochester et
al., 2001), benefiting the overall soil chemical and physical fertility. These results
overall indicate that introducing a legume pasture in a subtropical cereal cropping
system is a sustainable practice from both the environmental and agronomic
perspective.
The implications of managing N2O emissions from a cereal crop following a
legume pasture in terms of agronomy and crop productivity are further examined in
sections 6.4.2 and 7.1, while the profitability of this N management strategy is
analysed in section 7.2.

140
141
Statement of Contribution of Co-Authors for Thesis by Published Paper
The authors listed below have certified* that:
1. they meet the criteria for authorship in that they have participated in the conception,
execution, or interpretation, of at least that part of the publication in their field of expertise;
2. they take public responsibility for their part of the publication, except for the responsible
author who accepts overall responsibility for the publication;
3. there are no other authors of the publication according to these criteria;
4. potential conflicts of interest have been disclosed to (a) granting bodies, (b) the editor or
publisher of journals or other publications, and (c) the head of the responsible academic unit,
and
5. they agree to the use of the publication in the student’s thesis and its publication on the
Australasian Research Online database consistent with any limitations set by publisher
requirements.
In the case of this chapter:
Assessing agronomic and environmental implications of different N fertilisation
strategies in subtropical grain cropping systems in Oxisols.
Contributor Statement of contribution*
Massimiliano De Antoni Migliorati Performed experimental design, conducted
fieldwork and laboratory analyses, data analysis,
and wrote the manuscript. Signature
9th March 2015
Mike J. Bell Aided experimental design and data analysis, and
reviewed the manuscript. Peter R. Grace Aided experimental design and data analysis, and
reviewed the manuscript. David W. Rowlings Aided experimental design and data analysis, and
reviewed the manuscript. Clemens Scheer Aided experimental design and data analysis, and
reviewed the manuscript. Alice Strazzabosco Aided laboratory analysis and data analysis, and
reviewed the manuscript.

142
Principal Supervisor Confirmation
I have sighted email or other correspondence from all Co-authors confirming their
certifying authorship.
Peter R. Grace 9th March 2015
Name Signature Date

143
Chapter 5: Assessing agronomic and environmental implications of different N fertilisation strategies in subtropical grain cropping systems in Oxisols (Paper 3)
Abstract
A multi-season 15N tracer recovery experiment was conducted on an Oxisol
cropped with wheat, maize and sorghum to compare crop N recoveries of different
fertilisation strategies and determine the main pathways of N losses that limit N
recovery in these agroecosystems. In the wheat and maize seasons, 15N-labelled
fertiliser was applied as conventional urea (CONV) and urea coated with a
nitrification inhibitor (DMPP). In sorghum, the fate of 15N-labelled urea was
monitored in this crop following a legume ley pasture (L70) or a grass ley pasture
(G100). The fertiliser N applied to sorghum in the legume-cereal rotation was
reduced (70 kg N ha-1) compared to the grass-cereal (100 kg N ha-1) to assess the
availability of the N residual from the legume ley pasture. Average crop N recoveries
ranged from 73% (CONV) to 77% (DMPP) in wheat and from 50% (CONV) to 51%
(DMPP) in maize, while in sorghum varied between 71% (L70) and 53% (G100).
Data gathered in this study indicate that the intrinsic physical and chemical
conditions of these soils can be extremely effective in limiting N losses via deep
leaching or denitrification. Elevated crop 15N recoveries can therefore be obtained in
subtropical Oxisols using conventional urea while in these agroecosystems DMPP
urea has no significant scope to increase fertiliser N recovery in the crop. Overall,
introducing a legume phase to limit the fertiliser N requirements of the following
cereal crop proved to be the most effective strategy to reduce N losses and increase
fertiliser N recovery.
144
5.1 Introduction
Half the world’s population live in regions dominated by acid soils (Yang et al.,
2004), 18.4 % of which are classified as Oxisols (von Uexküll and Mutert, 1995).
Oxisols are the most common soil type in the tropics and subtropics, representing
approximately 46% and 23% of soil area in these regions, respectively (Buol and
Eswaran, 1999), and are mainly located in South America, Africa and Asia (von
Uexküll and Mutert, 1995).
More susceptible to degradation than most soils and characterised by low natural
fertility, Oxisols had been relegated to marginal agricultural practices until the Green
Revolution (Borlaug and Dowswell, 1997; Thomas and Ayarza, 1999). However,
with modern technologies many of the constraints of Oxisols can be amended and
these soils are now regarded as the most extensive agricultural frontier in the world.
Today, Oxisols are capable of high productivity levels and support sufficient food
production and economic returns to feed millions of peoples, particularly in tropical
and subtropical regions (Fageria and Baligar, 2008). For example in Brazil, the
country with the greatest extent of arable Oxisols in the world, the area of Oxisols
cultivated with grain crops increased from 10 million ha in 1970 to 48 million ha in
2011 (Thomas and Ayarza, 1999; Scheid Lopes et al., 2012) and alone contributes to
4.3% of the world’s current cereal production (Fischer, 2009; FAOSTAT website,
accessed October 2014).
However, there is growing concern about the environmental and agronomic
implications of intensive cropping of Oxisols. Nearly all future demographic growth
is projected to take place in tropical and subtropical countries (UNFPA, 2011),
meaning a greater pressure on Oxisols to meet future cereal demand (Fageria and
Baligar, 2008). There will be economic and environmental pressures for any increase
in grain production to occur without intensification of synthetic N fertiliser use, as
the manufacture and use of these products has major implications in terms of water
quality, energy consumption and greenhouse emissions (Crews and Peoples, 2004;
Jensen et al., 2012; Müller and Gattinger, 2013). There is therefore an urgent need to
develop N management strategies and farming systems that can reduce the need for
synthetic N fertiliser in Oxisols and improve fertiliser N recovery in cereal cropping
systems.

Assessing agronomic and environmental implications of different N fertilisation strategies in subtropical grain cropping systems in Oxisols (Paper 3)
145
Under certain conditions, the application of nitrification inhibitors to urea-based
fertilisers has been shown to improve yields through an increased crop N recovery
(Linzmeier et al., 2001b; Pasda et al., 2001; Kawakami et al., 2012). However, the
efficiency of nitrification inhibitors is highly dependent on soil and climatic
conditions and their use substantially increases fertilisation costs (Eagle et al., 2012).
Alternatively, many authors have proposed the reintroduction of legumes in cereal-
based cropping systems as one possible strategy to reduce synthetic N inputs whilst
sustaining crop yields (Crews and Peoples, 2004; Jensen et al., 2012). The dynamics
regulating the release of plant-available N from legume residues are however
complex and grain yields can be limited by any asynchrony between N supplied by
the legume residues and crop N uptake (Crews and Peoples, 2004).
Research to date has primarily focused on the efficacy of various N management
strategies on different soils under temperate climatic conditions or, in tropical and
subtropical climates, on the correction of the main constraints of Oxisols (soil
acidity, available phosphorus and soil organic matter).
As a result, very scarce data on efficient N fertilisation strategies are currently
available for subtropical cereal cropping systems in Oxisols. The overall aims of this
study were therefore to: i) compare the N recoveries of different N fertilisation
strategies on subtropical Oxisols, including the use of conventional urea or urea
coated with a nitrification inhibitor and the presence or absence of legumes in the
crop rotation; ii) determine the main pathways of N losses that limit N recovery in
these agroecosystems and iii) evaluate the agronomic and environmental
sustainability of the N supply practices examined.
Two investigations were carried out on an Oxisol supporting cereal cropping
systems as part of a multi-season 15N tracer recovery experiment. The first
investigation focused on the N recovery efficiency of urea coated with a nitrification
inhibitor and was performed on a crop rotation composed of wheat followed by
maize. The second investigation assessed the fate of 15N-labelled urea in sorghum
following a legume ley pasture and compared it to the same crop in rotation with a
grass ley pasture.
This study is the first to assess the agronomic and environmental performances of
these N management practices on cereal crops in Oxisols. The results will contribute

146
to define agronomically viable and environmentally sustainable N fertilisation
strategies to support future intensification of cereal production on these soils.
5.2 Materials and Methods
5.2.1 Study site
The study was conducted at the J. Bjelke Petersen Research Station of the
Department of Agriculture, Fisheries and Forestry (DAFF). The research site is
located in Taabinga (26°34’54,3’’ Latitude South, 151°49’43.3’’ Longitude East,
altitude 441 m a.s.l), near Kingaroy, in the southern inland Burnett region of
southeast Queensland, Australia. The climate is classified as subtropical, with warm,
humid summers and mild, dry winters. Daily mean maximum and minimum
temperatures are 20.1°C and 4.0°C in winter and 29.6°C and 16.5°C in summer,
respectively. Mean annual precipitation is 776.2 mm and varies from a minimum of
28.6 mm in August to a maximum of 114.1 mm in January (Australian Bureau of
Meteorology website). The soil is classified as a Tropeptic Eutrustox Oxisol (USDA
Soil Taxonomy, USDA (1998)) or as a Orthic Ferralsol (FAO Soil Taxonomy, FAO
(1998)) and has a moderately slow permeability. The soil profile is relatively
homogenous, characterised by a high clay content (50-65% clay), an effective
rooting zone of 1.2 m and a water holding capacity of 100 mm. Physical and
chemical soil properties are listed in Table 5-1.

Assessing agronomic and environmental implications of different N fertilisation strategies in subtropical grain cropping systems in Oxisols (Paper 3)
147
Table 5-1 - Main soil physical and chemical properties (0-30 cm) of the
experimental site at Kingaroy research station, Queensland, Australia
First investigation Second investigation
Soil Property (0-30 cm) - Legume * Grass *
pH (H2O) 5.58 ± 0.11 5.12 ± 0.03 5.30 ± 0.02
DOC (kg C ha-1) 39.56 ± 2.07 43.04 ± 11.98 56.05 ± 2.97
Bulk density 0-30 cm (g cm-3) 1.33± 0.09 1.18 ± 0.08 1.18 ± 0.08
Texture (USDA) Clay Clay Clay
Clay (%) 55 55 55
Silt (%) 14 14 14
Sand (%) 31 31 31
* Cropping history
5.2.2 First investigation (nitrification inhibitor trial)
The first investigation consisted of two cropping seasons: wheat (winter 2011)
and maize (summer 2011/2012). Wheat (Triticum aestivum L., cultivar Hartog) was
planted 6 July after the harvest of a summer mungbean (Vigna mungo L.) crop and
subsequently harvested 29 November 2011, while maize (Zea mays L., cultivar
32P55) was planted 21 December 2011 and harvested 20 June 2012. Two treatments
were tested:
• Conventional fertiliser (CONV): fertiliser N applied at rates of 80 and 160 kg N
ha-1 to wheat and maize, respectively. Rates were designed to achieve maximum
yield potential.
• Fertiliser coated with DMPP nitrification inhibitor (DMPP): fertiliser N applied
at same rates of CONV treatment. DMPP (3,4-dimethylpyrazole phosphate) was
chosen amongst other nitrification inhibitors for the high efficiency in slowing
nitrification and reducing N losses (Weiske et al., 2001a; Weiske et al., 2001b;
Liu et al., 2013).

148
During the wheat season both treatments were base dressed with 20 kg N ha-1 as
diammonium phosphate (DAP, banded at panting) and top dressed at booting stage
broadcasting 60 kg N ha-1 as conventional urea (CONV) or urea coated with the
DMPP nitrification inhibitor (DMPP). In maize the two treatments were base dressed
at planting by banding 40 kg N ha-1 as monoammonium phosphate (MAP) and side
dressed at V10 physiological stage (beginning of tenth leaf) with 120 kg N ha-1 as
conventional urea (CONV) or with DMPP urea (DMPP). Given the high cost of
DMPP, in each season DMPP urea was used only at top/side dressing, when 75% of
seasonal N was applied to the crop. During the early stages of crop development
irrigation was applied at a rate of 10 mm h-1 when water filled pore space (WFPS)
values approached 40%. This method avoided water stress limiting the potential
yields and prevented fertiliser N to be leached below the rooting zone. The trial was
irrigated on four and two occasions over the wheat and maize seasons, respectively.
Timings and amounts of fertiliser application are reported in Table 5-2, while further
information on the study site and crop management can be found in Chapter 3.
Table 5-2 - Times of application and N rates of labelled and unlabelled fertilisers
during the two investigations at Kingaroy research station, Queensland, Australia
Crop Time of fertiliser application Fertilisation [kg-N ha-1]
CONV DMPP
Wheat Planting 20 (DAP) 20 (DAP)
Top Dressing (broadcasted) 60 (urea) ** 60 (DMPP urea) **
Maize Planting 40 (MAP) 40 (MAP)
Side Dressing (banded) 120 (urea)** 120 (DMPP urea)**
L70 L100
Sorghum Planting 20 (urea) * 20 (urea) *
Side Dressing (banded) 50 (urea) * 80 (urea) *
** Fertiliser labelled with 10% 15N urea
* Fertiliser labelled with 5% 15N urea

Assessing agronomic and environmental implications of different N fertilisation strategies in subtropical grain cropping systems in Oxisols (Paper 3)
149
The trial layout was a randomised complete block design with three replicates per
treatment. For each treatment, three randomly placed 1 m2 micro-plots were
delimited by stainless steel frames inserted 15 cm into the ground. All micro-plots
were surrounded by a buffer of 1 m along each side of the frame. The micro-plots
were repositioned before planting maize to avoid 15N contamination across seasons.
The 15N-labelled fertiliser was only applied at top/side dressing to determine the N
recovery of DMPP urea and compare it with conventional urea. Each micro-plot
received 10% excess 15N enriched urea, which was dissolved in 1 L of deionised
water. The labelled fertiliser was applied uniformly with a dispenser over the entire
micro-plot area to replicate top dressing (in wheat) or along the band to replicate
banding (in maize). For the DMPP treatment the 15N enriched urea was added with
DMPP at a ratio of 6 g DMPP kg-1 urea to replicate the same ratio of commercial
DMPP urea (Incitec Pivot Fertilisers, personal communication).
5.2.3 Second investigation (legume N trial)
The second investigation consisted of one cropping season (sorghum, planted 12
December 2012 and harvested 18 June 2013) and took place in a field adjacent to the
one used for the first investigation. Plots were planted with sorghum (Sorghum
bicolor L.) following two distinct cropping histories. One crop rotation (hereafter
called legume cropping history) included two years of alfalfa pasture (Medicago
sativa, L.), one season of maize (summer crop) and one season of sulla ley pasture
(Hedysarum coronarium L., winter crop) prior to sowing sorghum. The other crop
rotation (hereafter called grass cropping history) included two years of a mixed
pasture predominantly composed by Rhodes grass (Chloris gayana, K.), one season
of maize (summer crop) and one season of wheat (winter crop). Sulla and wheat were
managed as green manure crops. The incorporation of sulla residues (2.3 Mg dry
matter ha-1, 1.57% N) was estimated to return approximately 36 kg N ha-1 to the soil,
while wheat residues (1.24 Mg dry matter ha-1, 0.75% N) about 9 kg N ha-1. During
the sorghum season two treatments were assessed:
• Sorghum grown in the grass cropping history, with 100 kg N ha-1 applied
(G100). The fertiliser N rate was designed to achieve maximum yield
potential.

150
• Sorghum grown in the legume cropping history, with 70 kg N ha-1 applied
(L70);
The two treatments were base dressed with 20 kg N ha-1 as urea banded at
planting, and side dressed at the eight leaf stage banding 50 kg N ha-1 (L70) or 80 kg
N ha-1 (G100) as urea (Table 5-2). The synthetic N rate used in L70 was reduced
compared to G100 to account for the expected increase in plant available N arising
from the legume inputs. As in the first investigation, irrigation was applied during the
early stages of crop development at a rate of 10 mm h-1 when WFPS values
approached 40%. All plots were irrigated three times over the cropping season; see
Chapter 4 and Bell et al. (2012) for further details on the experiment and the
management of the two crop rotations.
The experiment was established in a split plot design with two main plots (legume
and grass ley pastures). Lateral movement of N was considered negligible since urea
was banded both at side and base dressing. During this investigation micro-plots
(1.35 m2) were therefore sited in the main plots without stainless steel frames. To
account for 15N uptake by adjacent plants, micro-plots (0.9 m wide) included one
crop row fertilised with 15N enriched urea (1.5 m) and two non-fertilised crop rows
(1 m) located on either side of the row receiving the 15N-enriched fertiliser. A buffer
area of 0.25 m was established at either end of the fertilised crop row. The 5% excess 15N enriched urea was dissolved in 1 L of deionised water and applied in single
bands in each micro-plot during both application events.
5.2.4 Samples collection, preparation and analysis
At the beginning of each cropping season soil samples were collected prior to
planting to establish soil 15N background levels. At the end of each cropping season
plant and soil samples were taken at crop harvest. In wheat and maize all above
ground material in the micro-plots was cut near the soil surface using hand clippers.
In both seasons the extremely dry conditions of the soil prevented the collection of
representative samples of root material. Soil moisture at the end of the sorghum
season was higher and plants could be dug out of the ground to collect root material.
Sorghum plants from the fertilised and non-fertilised rows were collected with hand
clippers and stored separately.

Assessing agronomic and environmental implications of different N fertilisation strategies in subtropical grain cropping systems in Oxisols (Paper 3)
151
Soil sampling was conducted using a core sampler (10 cm diameter) and different
strategies were adopted in each season in consideration of fertiliser position. In
wheat, where 15N-labelled fertiliser was evenly applied, six cores were randomly
taken inside each micro-plot. In maize two transects of three cores each were
performed across the inter-row space of each micro-plot, with one core per transect
placed over the fertiliser band. In both seasons soil samples were collected at six
depths (0-10, 10-20, 20-30, 30-40, 40-50, 50-60 cm). Moist soil conditions at the end
of sorghum season enabled a deeper penetration of the core sampler and samples
were collected at six depths to a depth of 1 m (0-10, 10-20, 20-30, 30-50, 50-70, 70-
100 cm). Two transects of three cores each were performed in the inter-row space
between the fertilised and non-fertilised rows of each micro-plot, with one core per
transect placed over the fertiliser band. At the end of each season reference biomass
and soil samples were collected outside the micro-plots as controls for background 15N abundance.
Plant material was mechanically mulched and oven-dried at 60°C to constant
weight. Grain, stem and roots (in sorghum) were ground in a planetary cylinder mill
and analysed separately. Soil samples were oven-dried at 60°C and ground using the
planetary cylinder mill. Soil and plant samples were processed in ascending order of
fertiliser rate and all equipment washed with ethanol between treatments to prevent
possible cross contamination. The 15N analysis was performed using a 20-22 Isotope
Ratio Mass Spectrometer (Sercon Limited, UK).
5.2.5 Ancillary measurements
In addition to soil sampling for 15N analysis, routine soil sampling was conducted
at regular intervals to assess soil N dynamics during the growing seasons. Soil
samples were taken at three depths (0-10, 10-20, 20-30 cm) and analysed for NH4-N
and NO3-N. Each soil sample consisted of three subsamples taken at 10 cm intervals
from the crop row of then mixed in order to ensure it represented the banded and
non-banded areas of the plot. Soil NH4-N and NO3-N were extracted by shaking 20 g
soil in 100 mL 1 M KC1 solution at room temperature for 60 minutes (Carter and
Gregorich, 2007). The solution was then filtered and stored in a freezer until
analysed colorimetrically for NH4-N and NO3-N using an AQ2+ discrete analyser
(SEAL Analytical WI, USA).

152
N2O fluxes and soil mineral N content were also measured throughout the
investigations as part of a comprehensive project assessing N dynamics in cereal-
based cropping systems in Oxisols. N2O emissions from each treatment were
measured every three hours using a chamber-based automated greenhouse gas
measuring system installed next to the micro-plots. For more information about N2O-
N losses during the two investigation see Chapters 3 and 4.
Four frequency domain reflectometers (FDR, EnviroScan probes, Sentek Sensor
Technologies, Australia) were installed at the field site to continuously monitor the
water content at three depths (0-10 cm, 10-20 cm, 20-30 cm). Soil temperature was
measured every 5 minutes with resistance temperature detectors (RTD, Temperature
Controls Pty Ltd, Australia) buried at 10 cm, 20 cm and 30 cm in the proximities of
chambers. Rainfall data were obtained from a weather station located at the study
site.
5.2.6 Calculations and statistical analysis
All calculations were conducted on oven-dried basis. Total recovery of applied 15N-labelled fertiliser was determined by mass balance. The percentage of N derived
from the labelled fertiliser (Ndff) in each plant and soil pool was determined using
the following formula (IAEA, 2001):
𝑁𝑁𝑈𝑈 =(𝑎𝐹𝑎𝑎% 𝑁15
𝑠𝑠𝑠𝑝𝑠𝑠 − 𝑎𝐹𝑎𝑎% 𝑁15𝑐𝑐𝑐𝑡𝑐𝑐𝑠)
(𝑎𝐹𝑎𝑎% 𝑁15𝑠𝑠𝑙𝑠𝑠𝑠𝑠𝑑 𝑓𝑠𝑐𝑡𝑓𝑠𝑓𝑠𝑠𝑐 − 𝑎𝐹𝑎𝑎% 𝑁15
𝑢𝑐𝑠𝑠𝑙𝑠𝑠𝑠𝑠𝑑 𝑓𝑠𝑐𝑡𝑓𝑠𝑓𝑠𝑠𝑐) × 100
Equation 1
The percentage of 15N recovered in each pool was calculated as
𝑁15 𝐹𝐹𝑟𝑎𝑟𝐹𝐹𝑟 = 𝑁15 𝐹𝐹𝑟𝑎𝑟𝐹𝐹𝐹𝑁 (𝑘𝑘 𝑁 ℎ𝑎−1)𝑁15 𝑎𝑖𝑖𝑓𝑓𝐹𝑁 (𝑘𝑘 𝑁 ℎ𝑎−1)
× 100
Equation 2
Fertiliser N recovery in the root biomass of wheat and maize was calculated
assuming a N recovery similar to the one in straw and stalks, respectively (Anderson,
1988). Root biomass was estimated using a root:shoot ratio of 0.31 for wheat

Assessing agronomic and environmental implications of different N fertilisation strategies in subtropical grain cropping systems in Oxisols (Paper 3)
153
(Siddique et al., 1990; Manschadi et al., 2008) and 0.22 for maize (Anderson, 1988;
Demotes-Mainard and Pellerin, 1992).
Statistical analyses were performed within the SPSS 22 environment (IBM
Corporation, USA). Differences in 15N recoveries of different pools were assessed
with the ANOVA test using a confidence interval of 95%.
5.3 Results
5.3.1 First investigation
Throughout the first investigation the field study received a total of 919 mm
rainfall, the majority of which occurred during the summer season (520 mm) (Figure
5-1). Soil mineral N content was relatively high at planting of wheat and gradually
decreased during the two cropping seasons. Substantial increases in soil N were
observed in both seasons after top/side dressing (Figure 5-2). Soil conditions were
considerably warmer and wetter during the maize season, especially at the time of
side dressing.
Figure 5-1 - Water filled pore space (WFPS) measured at 0-30 cm, soil
temperature (0-30 cm) and rainfall and irrigation events during the wheat, maize and
sorghum seasons at Kingaroy research station, Queensland, Australia. Arrows
indicate the time of application of 15N-labelled fertiliser.

154
Figure 5-2 - Soil mineral N levels (NH4
+ + NO3-) in the top 30 cm for the four
treatments during the wheat, maize and sorghum seasons at Kingaroy research
station. Arrows indicate the time of application of 15N-labelled fertiliser.
In both seasons the use of DMPP urea did not significantly affect N recovery,
grain yield and biomass production (Table 5-3). Plant recovery of 15N-labelled
fertiliser was higher in wheat (CONV: 72.9%, DMPP: 76.2%) than in maize (CONV:
49.7%, DMPP: 50.9%). The residual 15N-labelled fertiliser recovered in the soil
ranged from 25.8% (CONV) to 23% (DMPP) in wheat and from 35.9% (CONV) to
32.6% (DMPP) in maize. Whilst at the end of the wheat season almost all residual 15N-labelled was confined to the upper 10 cm, a higher amount of N moved
throughout the soil profile in maize (Figure 5-3).
In wheat about 33.8% (CONV) and 35.7% (DMPP) of plant N derived from the
fertiliser N applied at top dressing, while in maize Ndff values varied between 51.9
(CONV) and 50.9 (DMPP). In both crops fertiliser N was primarily recovered in
grains and secondarily in the straw/stalks and root components. The estimated
proportion of 15N recovered in roots was consistent with results reported by Kumar
and Goh (2002) and Ichir et al. (2003) for wheat and by Mahmood et al. (2011) and
Vanlauwe et al. (2001) for maize.
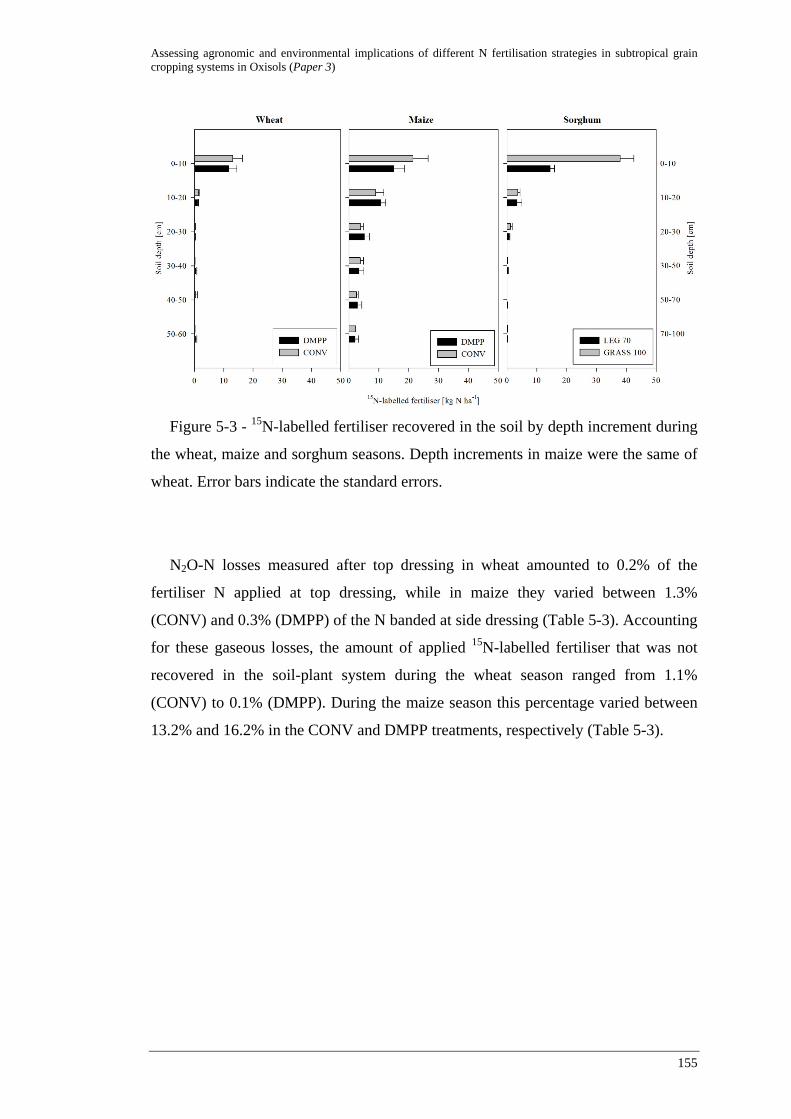
Assessing agronomic and environmental implications of different N fertilisation strategies in subtropical grain cropping systems in Oxisols (Paper 3)
155
Figure 5-3 - 15N-labelled fertiliser recovered in the soil by depth increment during
the wheat, maize and sorghum seasons. Depth increments in maize were the same of
wheat. Error bars indicate the standard errors.
N2O-N losses measured after top dressing in wheat amounted to 0.2% of the
fertiliser N applied at top dressing, while in maize they varied between 1.3%
(CONV) and 0.3% (DMPP) of the N banded at side dressing (Table 5-3). Accounting
for these gaseous losses, the amount of applied 15N-labelled fertiliser that was not
recovered in the soil-plant system during the wheat season ranged from 1.1%
(CONV) to 0.1% (DMPP). During the maize season this percentage varied between
13.2% and 16.2% in the CONV and DMPP treatments, respectively (Table 5-3).

156
Table 5-3 - Dry matter, plant N derived from 15N-labelled fertiliser (Ndff) and
recovery of added 15N measured at the end of the two investigations (mean ± SD,
n=3). Statistically significant differences are denoted
Crop Pool DM [Mg ha-1] Ndff [%] 15N recovered [%]
CONV DMPP CONV DMPP CONV DMPP
Wheat Grain 3.5 ± 0.5 3.6 ±0.8 24.8 ± 2.7 26.0 ± 2.4 53.3 ± 2.2 55.6 ± 7.5
Straw 7.7 ± 1.3 7.8 ±1.3 6.9 ± 0.9 7.4 ± 0.7 14.9 ± .2.2 16.1 ± 3.5
Roots ‡ 2.4 ± 0.4 2.4 ±0.4 2.1 ± 0.1 2.3 ± 0.2 4.7 ± 0.8 5.0 ± 0.8
Plant total 13.6 ± 2.2 13.9 ±2.5 33.8 ± 2.9 35.7 ± 2.4 72.9 ± 3.3 76.7 ± 11.3
Soil 25.8 ± 6.4 23.0 ± 5.3
N2O after top dressing 0.2 ± 0.02 0.2 ± 0.01
N accounted for 15N 98.9 ± 5.8 99.9 ± 8.8
N unaccounted for 15N 1.1 0.1
Maize Grain 8.2 ± 1.3 7.7 ± 0.3 42.2 ± 3.4 42.0 ±4.8 40.3 ± 6.7 40.3 ± 0.7
Stalks 4.7 ± 1.2 4.9 ± 0.7 8.0 ± 0.5 8.9 ±0.9 7.6 ± 1.4 8.6 ± 0.6
Roots ‡ 1.0 ± 0.3 1.1 ± 0.2 1.8 ± 0.04 2.0 ±0.1 1.7 ± 0.4 2.0 ± 0.3
Plant total 13.9 ± 2.7 13.7 ± 1.0 51.9 ± 3.8 52.9 ±5.4 49.7 ± 8.6 50.9 ± 0.6
Soil 35.9 ± 5.7 32.6 ± 9.3
N2O after side dressing 1.3 ± 0.6 0.3 ± 0.2
N accounted for 15N 86.8 ± 12.1 83.8 ± 9.6
N unaccounted for 15N 13.2 16.2
L70 G100 L70 † G100 † L70 † G100 †
Sorghum Grain 8.9 ± 1.5 7.0 ± 0.8 17.1 ± 4.5 27.7 ± 4.0 * 45.6 ± 4.3 32.4 ± 2.2 **
Stalks 11.9 ± 1.5 9.2 ± 1.8 8.3 ± 1.4 15.4 ± 3.0 * 22.7 ± 5.3 18.2 ± 4.6
Roots 2.4 ± 0.3 2.0 ± 0.3 1.0 ± 0.2 1.8 ± 0.5 2.6 ± 0.3 2.2 ± 0.7
Plant total 23.2 ± 3.2 18.1 ± 2.7 26.3 ± 5.1 44.9 ± 5.0 * 70.9 ± 2.1 52.8 ± 6.1 **
Soil 27.3 ± 2.8 43.3 ± 4.4 **
N2O 1.0 ± 0.3 1.4 ± 0.2
N accounted for 15N 99.1 ± 4.9 97.4 ± 2.6
N unaccounted for 15N 0.9 2.6 ‡ estimated values
† values are inclusive of N recovered by plants in non-fertilised row * p < 0.05 ** p < 0.01

Assessing agronomic and environmental implications of different N fertilisation strategies in subtropical grain cropping systems in Oxisols (Paper 3)
157
5.3.2 Second investigation
Over the study period a total of 827 mm of rain fell at the study site, including one
heavy rainfall event of 234 mm during a thunderstorm on 27 January 2013. Over
70% of the total rainfall was concentrated between 25 January and 3 March (Figure
5-1). A gradual decrease in soil mineral N was observed in both treatments during
the growing season. No consistent response to history or fertiliser application could
be measured in terms of soil mineral N (Figure 5-2). Similarly to the maize season,
average soil temperatures ranged from a maximum of 29.7°C (December 2012) to a
minimum of 11.9°C (May 2013).
Sorghum production was substantially affected by cropping history. Despite a
30% reduction in the amount of N fertiliser applied, the production of grain and
biomass in L70 was comparable to that in G100 (Table 5-3). This was reflected in
the percentage of plant N derived from fertiliser: in L70 only 26.3% of plant N
originated from the fertiliser, while in G70 the percentage was 44.9%. The recovery
of applied N fertiliser in L70 (70.9 ± 2.1) was significantly greater than in G100
(52.8 ± 6.1). In both treatments fertiliser N was mostly recovered in the grains, with
lesser quantities in stalks and roots. The amount of 15N-labelled fertiliser left in the
soil in the G100 treatment (43.3 ± 4.4 %) was significantly higher than in G70 (27.3
± 2.8) and was mainly concentrated in the top 10 cm of soil profile (Figure 5-3).
After taking into consideration the N2O-N losses, the amount of fertiliser N that
could not be accounted for ranged between 0.9 (L70) and 2.6% (G100).
In both investigations unaccounted 15N was assumed to be lost from the monitored
crop-soil system via deep leaching or through the nitrification/denitrification
processes. Losses via runoff and NH3 volatilisation were considered negligible since
in both investigations 15N-labelled urea was applied as a liquid solution in a sub-
surface band. On average, uncertainty due to cumulative errors associated with the
analyses amounted to 9.96% and 3.83% in the first and second investigations,
respectively.

158
5.4 Discussion
5.4.1 Fertiliser as source of crop N
As expected, the amount of plant N derived from labelled fertiliser varied widely
across crops and investigations. In the first investigation, the average percentage of
crop N derived from 15N-labelled fertiliser was 34.7 ± 1.3 in wheat and 52.4 ± 0.7 in
maize. The low reliance of wheat on N fertiliser can be attributed to the cropping
history of the field study, as the site had previously been cropped with mungbean.
This crop was harvested six weeks before planting wheat and mungbean residues
were incorporated in the soil at a rate of approximately 1.8 Mg DM ha-1. As
confirmed by the high soil N levels measured at wheat planting, the mineralisation of
mungbean residues supplied a substantial amount of N to the wheat plants, reducing
the dependence of wheat on the synthetic N source. Similar results were reported by
Dourado-Neto et al. (2010) for wheat in rotation with peanut cropped on an Entisol
under tropical conditions.
Synthetic fertiliser represented a more important source of N in the maize season
and two factors may have contributed to this. Firstly, maize was side dressed with
twice the amount of N when compared to wheat and therefore maize plants had a
greater pool of readily available mineral N in the soil profile (Figure 5-2, Figure 5-3).
Moreover, maize was planted three weeks after wheat harvest and native soil N was
lower than at the beginning of the wheat season (Figure 5-2). Continuous cereal
cropping has been reported to increase the crop reliance on synthetic fertiliser N
(Tilman et al., 2002) and significantly lower Ndff levels (25.3-40.8%) were reported
by Blesh and Drinkwater (2014) for fertilised maize (150 kg N ha-1) in rotation with
soybean.
A similar response to cropping history was observed during the second
investigation. Despite yields and biomass production in L70 and G100 being
comparable, a significantly higher reliance on fertiliser N was observed in sorghum
plants in G100 (44.9% ± 5) compared to that in L70 (26.3% ± 5.1). Sorghum was
planted two weeks after the incorporation of the pasture residues. Typically, the
highest N mineralisation rates from legume residues occur about six weeks from the
termination of the pasture (Fox et al., 1990; Park et al., 2010). In the present study

Assessing agronomic and environmental implications of different N fertilisation strategies in subtropical grain cropping systems in Oxisols (Paper 3)
159
this would have coincided with the moment of maximum N uptake of sorghum
(week four - eight leaf stage), although it was not possible to determine whether the
extra 25 kg N ha-1 available to the sorghum crop in L70 was derived from the recent
small input of sulla biomass, the previous alfalfa ley phase or, more likely, a
combination of both. As in the maize experiment, the greater reliance on fertiliser as
a source of N in G100 was consistent with the small amount of N provided by the
decomposition of grass/wheat residues and the high fertiliser N rate applied. No
direct comparisons with other studies could be made for sorghum as, to the
knowledge of the authors, no studies have been published on crop N derived from
fertiliser for this crop under similar conditions.
Collectively, these results illustrate the implications of including legumes in
cropping systems conducted in Oxisols. While Oxisols can contain large amounts of
organic matter and N under native vegetation, these reserves generally decline
rapidly under cultivation (Bell et al., 1995). Consequently, cropped Oxisols are
typically characterised by low levels of soil organic matter and native N, meaning
low inherent fertility and little resilience when used for intensive cropping
(Mulongoy and Kang, 1986; Vieira et al., 2010). Continuous cereal cropping in these
agroecosystems has the potential to rapidly erode native soil N supply and lead to a
greater reliance on fertiliser N to meet crop demand (Dalal and Mayer, 1986; Tilman
et al., 2002). Conversely, the presence of a legume phase in a cropping system has
been shown to have the potential to increase the soil organic matter and organic N
content (Giller and Cadisch, 1995; Rochester et al., 2001), substantially reducing
therefore the reliance of subsequent crops on synthetic fertiliser N.
5.4.2 Crop N recoveries and N losses
Crop recoveries of 15N fertiliser measured in the two investigations were at the
higher end of values reported for cereal cropping systems conducted under tropical
or subtropical climatic conditions (Ssali, 1990; Xu et al., 1992; Pilbeam, 1995;
Mubarak et al., 2003; Dourado-Neto et al., 2010). As emphasised by Dourado-Neto
et al. (2010), N recoveries of annual crops are highly variable and are influenced by
multiple factors. Amongst these, the most prominent are the synchronisation between
fertiliser N release and plant N uptake, the availability of native soil N and the
occurrence of environmental conditions that can stimulate N losses.

160
Effective synchronisation between crop N demand and fertiliser N supplied is
likely to have been achieved during both investigations. Wheat and maize were
top/side dressed at a stage when soil N reserves had been depleted during the early
stages of crop growth (Figure 5-2), enabling a fast recovery of applied fertiliser 15N.
In sorghum the 15N-labelled fertiliser was split between at-planting and in-season
applications, with differing N rates reflecting differences in the soil N supply. The
results of this study showed that crop recoveries of applied 15N varied substantially
across seasons and were influenced by environmental conditions and amounts of N
applied. Significantly higher crop recoveries (≥70%) were observed in both
treatments in wheat and in the L70 treatment in sorghum, where 15N-labelled
fertiliser rates were 60 and 70 kg N ha-1, respectively. Conversely, 15N recoveries did
not exceed 53% in maize and in the G100 treatment in sorghum, where 15N-labelled
fertiliser rates were 120 and 100 kg N ha-1 (Figure 5-4).
In winter (wheat season) the environmental conditions were not conducive for
excessive N losses. As indicated by the low N2O-N losses, the nitrification and
denitrification processes are likely to have been inhibited by the relatively low soil
temperatures (constantly below 20°C). Moreover, the low amount of rainfall that
occurred in the month following top dressing (154 mm) would not have triggered
denitrification or caused important leaching events in this soil type. Accordingly, the
vast majority of labelled fertiliser N not recovered in the crop was found in the top
10 cm of the soil profile (Table 5-3) and unaccounted N was limited to 1% of applied 15N.
In summer, conditions at side dressing were more favourable for stimulating N
losses (Figure 5-1). In both maize and sorghum seasons the high soil moisture
conditions occurring concurrently with elevated soil temperatures would have
stimulated the activity of nitrifying and denitrifying microorganisms. Moreover,
significant rainfall events occurred a few days after side dressing, resulting in higher
amounts of 15N leached down the soil profile (Figure 5-3) compared to the winter
season.
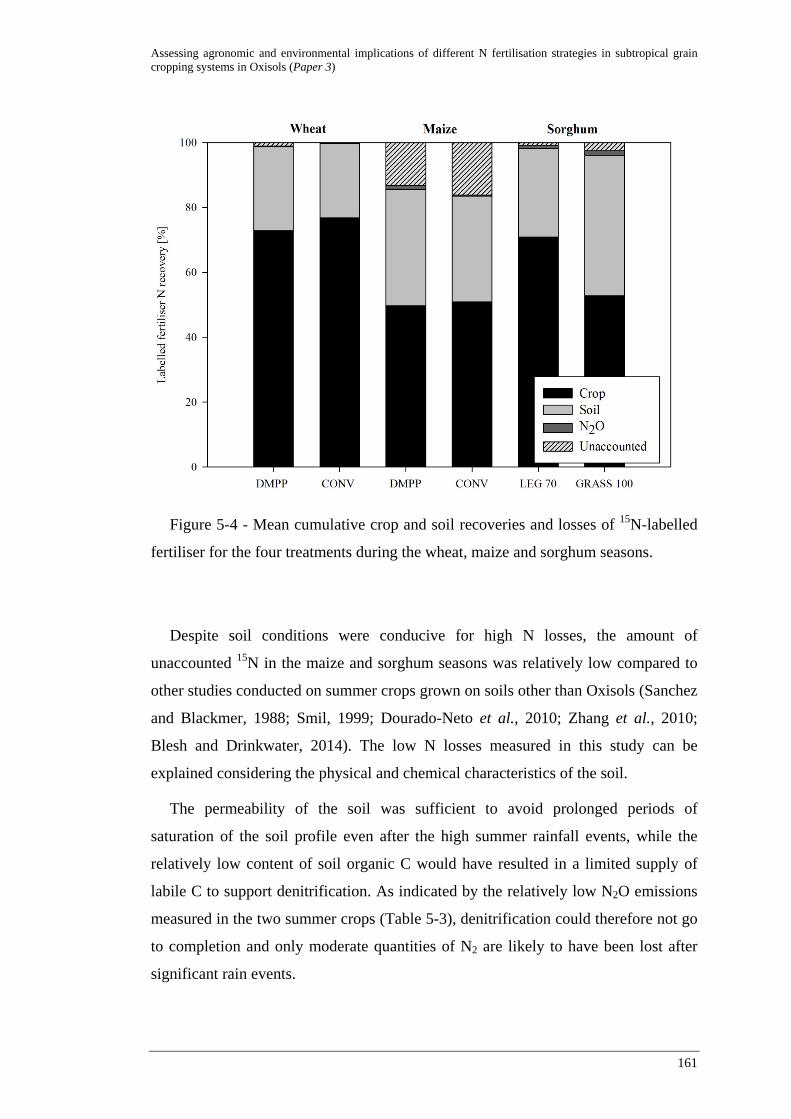
Assessing agronomic and environmental implications of different N fertilisation strategies in subtropical grain cropping systems in Oxisols (Paper 3)
161
Figure 5-4 - Mean cumulative crop and soil recoveries and losses of 15N-labelled
fertiliser for the four treatments during the wheat, maize and sorghum seasons.
Despite soil conditions were conducive for high N losses, the amount of
unaccounted 15N in the maize and sorghum seasons was relatively low compared to
other studies conducted on summer crops grown on soils other than Oxisols (Sanchez
and Blackmer, 1988; Smil, 1999; Dourado-Neto et al., 2010; Zhang et al., 2010;
Blesh and Drinkwater, 2014). The low N losses measured in this study can be
explained considering the physical and chemical characteristics of the soil.
The permeability of the soil was sufficient to avoid prolonged periods of
saturation of the soil profile even after the high summer rainfall events, while the
relatively low content of soil organic C would have resulted in a limited supply of
labile C to support denitrification. As indicated by the relatively low N2O emissions
measured in the two summer crops (Table 5-3), denitrification could therefore not go
to completion and only moderate quantities of N2 are likely to have been lost after
significant rain events.

162
On the other hand, the high clay content of the soil reduced the water infiltration
rates even during the intense rain events occurred during the two summer seasons
(Figure 5-1). The moderate soil permeability limited NO3- leaching and maintained
the majority of the N in the rooting zone, enabling in this way a wider window of
opportunity for the plants to adsorb the N supplied with fertilisation. As a result, the
unaccounted fertiliser N during the summer cropping seasons was limited to amounts
varying between 0.9% (L70) and 16.2% (DMPP) of applied N fertiliser.
In this study N losses via runoff and NH3 volatilisation were minimised by the
fertiliser application method, while NOx–N losses were considered negligible. Nitric
oxide in soil is a by-product of the nitrification and denitrification processes, and
several laboratory study have reported NO:N2O emissions ratios varying from 0.01
to 1 (Skiba et al., 1997). Consequently, fertiliser-induced NO emissions were
estimated to range from 0.3% to 1.4% of the applied N, a value in close agreement
with those suggested by Skiba et al. (1997) and Veldkamp and Keller (1997), and
similar to that measured by Fernandes Cruvinel et al. (2011) in a fertilised Oxisols
cropped with maize.
During the summer cropping seasons the majority of the unaccounted fertiliser N
is likely to have been lost in the deeper layers of the soil profile via leeching. In
maize, when the amounts of unaccounted fertiliser N were highest (13.2% and
16.2%), approximately 11% of fertiliser N was recovered in the monitored subsoil
(30 - 60cm). This aspect indicates a net N movement towards the lower soil layers
and suggests that a further 10% of fertiliser N could have been lost in the
unmonitored strata of the soil profile, i.e. deeper than 60 cm.
DMPP was not effective in increasing crop N recovery, although values tended to
be slightly higher than in the CONV treatment (Table 5-3). Several studies have
reported that nitrification inhibitors have the potential to significantly increase N
recoveries only when relatively large amounts of fertiliser N are lost via leaching or
denitrification (Walters and Malzer, 1990; Freney et al., 1993; Wolt, 2004; Chaves et
al., 2006; Abalos et al., 2014). The intrinsic characteristics of the Oxisol monitored
in this study limited the possibility of DMPP to significantly improve the fertiliser N
use efficiency since relatively low N losses were observed also when conventional
urea was applied.

Assessing agronomic and environmental implications of different N fertilisation strategies in subtropical grain cropping systems in Oxisols (Paper 3)
163
In fact, also in the CONV treatment the majority of the fertiliser N that was not
taken by the crop remained confined in the top soil. The high clay content of the
Oxisols limited the vertical movement of fertiliser N in the soil and the percentage of
soil 15N recovered in the top 10 cm at the end of the wheat and maize seasons
amounted to 84 and 50% of the total 15N recovered in the soil profile, respectively
(Figure 5-3). Similar results were observed in the second investigation, when after
fertilising sorghum with conventional urea the 15N recovered from the first 10 cm
constituted 76% (L70) and 88% (G100) of the total 15N recovered in the soil.
5.4.3 Implications
Overall, fertiliser N rates were the main factor limiting N recovery in the crops.
Highest fertiliser N recoveries were observed in the CONV and DMPP treatments in
wheat (>70%) and in the L70 treatment in sorghum (70%), which were fertilised
with 60 and 70 kg 15N ha-1, respectively. The low N rates applied in these treatments
enabled to synchronise the fertiliser N supply with plant N demand. Fertiliser N was
therefore used more efficiently by the crop and less (approximately 25%) was left in
the soil.
In contrast, significantly lower fertiliser N recoveries were measured in the
CONV and DMPP treatments in maize (approximately 50%) and in the G100
treatment in sorghum (53%), which received 120 and 100 kg 15N ha-1, respectively.
The amounts of 15N recovered in the soil of these three treatments were remarkably
similar (39.1 - 43.3 kg N ha-1), while the quantities of leached or otherwise
unaccounted 15N were greater in the CONV and DMPP treatments in maize, where
the rate of labelled N applied at side dressing (120 kg N ha-1) was substantially
higher than in G100 (80 kg N ha-1).
The introduction of a legume phase in the cereal-based cropping system proved to
be the most effective N strategy under both the agronomic and environmental
perspectives. The mineralisation of the legume residues provided a substantial N
supply to the following cereal crops and reduced the cereal reliance on synthetic
fertiliser compared to cereals planted after a non-leguminous crop. The decreased
reliance on synthetic N inputs allowed for reducing fertiliser N rates to the levels
necessary to reach maximum yield potential. In particular, this strategy enabled
lowering the amount of fertiliser N side dressed to the summer cereal crop, the
164
occasion when the highest quantities of annual synthetic N are applied. Build-up of
high amounts of NO3- in the soil following fertilisation was therefore limited and
N2O losses were caused mainly by temporary increases of NO3- levels due to
fertiliser application. Consequently, cumulative N2O emissions were primarily a
function of the N fertiliser rate applied, while cropping history had no significant
effect.
5.5 Conclusions
Collectively, the results of this study point to limiting the application rates of
synthetic fertiliser N as the most effective strategy to reduce N losses and increase
fertiliser N recovery in subtropical Oxisols. Future N management strategies in these
agroecosystems should focus on the introduction of legumes to reduce the reliance of
cereal crops on synthetic N fertilisers and minimise the agronomic inefficiencies due
to fertiliser N losses. A critical aspect for the success of these N management
strategies will be to achieve a good synchrony between the N released from the
degradation of legume residues and the N uptake of the subsequent crop.

Assessing agronomic and environmental implications of different N fertilisation strategies in subtropical grain cropping systems in Oxisols (Paper 3)
165


167
Statement of Contribution of Co-Authors for Thesis by Published Paper
The authors listed below have certified* that:
1. they meet the criteria for authorship in that they have participated in the conception,
execution, or interpretation, of at least that part of the publication in their field of expertise;
2. they take public responsibility for their part of the publication, except for the responsible
author who accepts overall responsibility for the publication;
3. there are no other authors of the publication according to these criteria;
4. potential conflicts of interest have been disclosed to (a) granting bodies, (b) the editor or
publisher of journals or other publications, and (c) the head of the responsible academic unit,
and
5. they agree to the use of the publication in the student’s thesis and its publication on the
Australasian Research Online database consistent with any limitations set by publisher
requirements.
In the case of this chapter:
Legumes or nitrification inhibitors to reduce N2O emissions in subtropical cereal
cropping systems?
Contributor Statement of contribution*
Massimiliano De Antoni Migliorati Performed experimental design, model calibration
and validation, simulations of different N
management scenarios, and wrote the manuscript. Signature
9th March 2015
William J. Parton Aided model calibration and validation, and
reviewed the manuscript. Stephen J. Del Grosso Aided model calibration and validation, and
reviewed the manuscript. Peter R. Grace Aided experimental design and data analysis, and
reviewed the manuscript. Mike J. Bell Aided experimental design and data analysis, and
reviewed the manuscript. David W. Rowlings Aided experimental design and data analysis, and
reviewed the manuscript. Clemens Scheer Aided experimental design and data analysis, and
reviewed the manuscript.

168
Principal Supervisor Confirmation
I have sighted email or other correspondence from all Co-authors confirming their
certifying authorship.
Peter R. Grace 9th March 2015
Name Signature Date

169
Chapter 6: Legumes or nitrification inhibitors to reduce N2O emissions in subtropical cereal cropping systems? (Paper 4)
Abstract
The DAYCENT biogeochemical model was used to investigate how the use of
fertilisers coated with nitrification inhibitors and the introduction of legumes in the
crop rotation can affect subtropical cereal production and N2O emissions. The model
was validated using comprehensive multi-seasonal, high-frequency dataset from two
field investigations conducted on an Oxisol, which is the most common soil type in
subtropical regions. Different N fertiliser rates were tested for each N management
strategy and simulated under varying weather conditions. DAYCENT was able to
reliably predict soil N dynamics, seasonal N2O emissions and crop production,
although some discrepancies were observed in the treatments with low or no added N
inputs and in the simulation of daily N2O fluxes.
Simulations were consistent with field observations and highlighted that the high
clay content and the relatively low C levels of the Oxisol analysed in this study limit
the chances for significant amounts of N to be lost via deep leaching or
denitrification. The application of urea coated with a nitrification inhibitor (DMPP)
was the most effective strategy in minimising N2O emissions. This strategy however
did not increase yields since the application of urea coated with a nitrification
inhibitor did not substantially decrease overall N losses compared to conventional
urea. Simulations indicated that replacing part of crop N requirements with N
mineralised by legume residues is the most effective strategy to reduce N2O
emissions and support cereal productivity. The results of this study show that
legumes have significant potential to enhance the sustainable and profitable
intensification of subtropical cereal cropping systems on Oxisols.

170
6.1 Introduction
By 2050, global cereal demand is predicted to increase by 50% to meet the
demands of a world population 30% larger and more affluent than at present (Ray et
al., 2013). Virtually all of the increase in cereal consumption will come from tropical
and subtropical countries (Alexandratos and Bruinsma, 2012), implying an urgent
need to increase productivity levels in these regions. This increase will be
extensively sustained by agricultural systems conducted in Oxisols, which are the
most common soil type in these regions (von Uexküll and Mutert, 1995; Buol and
Eswaran, 1999).
Since the beginning of the Green Revolution, intensification of agricultural
systems has been achieved through an increase in the use of synthetic N (Ladha et
al., 2005), resulting in sharp increases in greenhouse gas emissions, especially N2O
(van Beek et al., 2010). N2O is a potent greenhouse gas with a global warming
potential 298 times greater than CO2 and is also the major contributor to the
depletion of the ozone layer in the stratosphere (Ravishankara et al., 2009). There is
consensus that pursuing food security through a further increase in synthetic N use
will result in unacceptable levels of environmental damage (FAO, 2010; Foley et al.,
2011; Tilman et al., 2011). It is therefore critical to identify alternative N
management strategies aimed at supporting future intensification of tropical and
subtropical agricultural systems without provoking an increase of N2O emissions
from these agroecosystems.
The use of fertilisers coated with nitrification inhibitors and the (re)introduction of
legumes in cereal-based crop rotation are among the most promising strategies for
this purpose. Nitrification inhibitors decrease N2O losses both directly, via slowing
the nitrification rates and, indirectly, by reducing the amount of NO3- available to
denitrifying microorganisms (Linzmeier et al., 2001b; Hatch et al., 2005; Suter et al.,
2010). The presence of legumes in the cereal-based crop rotation instead reduces the
amount of synthetic N required by the following cereal crop and consequently
decrease N2O emissions associated with synthetic N fertilisers (Jensen and
Hauggaard-Nielsen, 2003; Emerich and Krishnan, 2009; De Antoni Migliorati et al.,
2015).

Legumes or nitrification inhibitors to reduce N2O emissions in subtropical cereal cropping systems? (Paper 4)
171
However, the efficacy of these two N management strategies has never been
compared under subtropical conditions. To date, studies have extensively evaluated
the effects of nitrification inhibitors and legumes on N2O emissions and cereal yields
under temperate climatic conditions, while scant data is available for subtropical
Oxisols (Fageria and Baligar, 2008). Moreover, field studies are influenced by the
specific seasonal weather conditions encountered during the monitoring period and
several authors have reported contradicting results on the efficacy of the two N
management strategies (Díez López and Hernaiz, 2008; Jensen et al., 2012; Liu et
al., 2013; De Antoni Migliorati et al., 2014).
Process-based models can overcome these limitations as they enable to assess
how different N management strategies can affect crop production and greenhouse
gas emissions under varying seasonal climate conditions. Several simulation studies
have demonstrated that models, when calibrated and validated with appropriate input
data, lead to the same results of field studies (Staggenborg and Vanderlip, 2005;
Basso et al., 2010; Huth et al., 2010), giving researcher a useful tool for thoroughly
evaluating different N management strategies
The objectives of this study were therefore to use a process-based model to: i)
compare the influence of applying urea coated with nitrification inhibitors or
introducing a legume phase in the cereal-based crop rotation on N2O losses and
yields in various cereal crops grown in a subtropical Oxisol; ii) determine best
agronomical and environmentally sound strategies to support future intensification of
cereal cropping systems in subtropical Oxisols.
The DAYCENT biogeochemical model was chosen for the purposes of this study
because it is currently the model that has been most extensively tested to simulate
both crop production and N2O emissions in cereal cropping systems (Del Grosso et
al., 2002; Del Grosso et al., 2005; Del Grosso et al., 2006; Del Grosso et al., 2008;
Halvorson et al., 2008; Scheer et al., 2013a) and it is currently used to estimate N2O
emissions for the U.S. National GHG Inventory (US-EPA, 2014) under the United
Nations Framework Convention on Climate Change (Del Grosso et al., 2006).
The model was calibrated and validated using high temporal frequency N2O
measurements, 15N recovery observations and yield data collected during two field
investigations. The whole dataset included multiple cropping seasons, crop rotations,
172
the use of fertilisers coated with a nitrification inhibitor and the introduction of a
legume phase in cereal-based crop rotation. A series of scenarios embracing a range
of N fertiliser rates was tested for both N management strategies. Each scenario was
simulated using 15 years of local climate data.
This is the first study to employ a model validated using such an extensive dataset
to assess the use of nitrification inhibitors and legumes as alternative N management
strategies in subtropical cereal cropping systems on Oxisols. The results will
contribute to identify agronomically viable and environmentally sustainable N
fertilisation strategies to support future intensification of grain production on these
agroecosystems.
6.2 Materials and Methods
6.2.1 Study site and experimental design
The two field investigations were conducted at the J. Bjelke Petersen Research
Station of the Department of Agriculture, Fisheries and Forestry (DAFF). The station
is located in Taabinga (26°34’54,3’’ Latitude South, 151°49’43.3’’ Longitude East,
altitude 441 m a.s.l), in southeast Queensland, Australia. The climate is classified as
subtropical (Cfa) according to Köppen climate taxonomy, with a mean annual
precipitation of 776.2 mm. Daily mean maximum and minimum temperatures are
20.1 °C and 4.0 °C in winter and 29.6 °C and 16.5 °C in summer, respectively
(Australian Bureau of Meteorology website). The soil is classified as a Tropeptic
Eutrustox Oxisol (USDA, 1998) or as a Orthic Ferralsol (FAO, 1998), and is
characterised by a high clay content (55%), a moderately slow permeability and an
effective rooting zone of 1.2 m.
The first experiment consisted of two cropping seasons: wheat (winter 2011) and
maize (summer 2011/2012). Wheat (Triticum aestivum L., cultivar Hartog) was
planted 6 July and harvested 29 November 2011, while maize (Zea mays L., cultivar
32P55) was planted 21 December 2011 and harvested 20 June 2012. Four treatments
were tested:
• CNT: Control test; no N fertiliser applied to wheat, urea applied at rate of 40 kg
N ha-1 to maize to guarantee a minimum crop establishment.

Legumes or nitrification inhibitors to reduce N2O emissions in subtropical cereal cropping systems? (Paper 4)
173
• ADJ: Conventional N fertiliser rate adjusted according to estimated residual soil
N; urea applied at rates of 20 and 100 kg N ha-1 to wheat and maize,
respectively.
• CONV: Conventional N fertiliser rate; fertiliser N applied at rates of 80 and 160
kg N ha-1 to wheat and maize, respectively. N rates were similar to farmer
practice and designed to achieve maximum yield potential.
• DMPP: Fertiliser coated with DMPP nitrification inhibitor; fertiliser N applied at
same rates of CONV treatment. Given the high cost of DMPP, in both seasons
DMPP urea was only used at top/side dressing, when 75% of seasonal N was
applied to the crop.
The second experiment was conducted on sorghum (Sorghum bicolor L., planted
12 December 2012 and harvested 18 June 2013) following two distinct cropping
histories. One, hereafter called legume cropping history, included two seasons of
alfalfa pasture (Medicago sativa, L.), one season of maize and one season of sulla ley
pasture (Hedysarum coronarium L.) prior to sowing sorghum. The other, hereafter
called grass cropping history, included two seasons of a mixed pasture
predominantly composed by Rhodes grass (Chloris gayana, K.), one season of maize
and one season of wheat. Both sulla and wheat were managed as green manure crops
and plant residues incorporated before sowing sorghum. During the sorghum season
the following treatments were assessed:
• L0: Sorghum grown in the legume cropping history, no N applied;
• L70: Sorghum grown in the legume cropping history, 70 kg N ha-1 applied
as urea;
• G0: Sorghum grown in the grass cropping history, no N applied;
• G100: Sorghum grown in the grass cropping history, 100 kg N ha-1 applied
as urea.
The fertiliser N applied in G100 was similar to farmer practice and was designed
to achieve maximum yield potential. The synthetic N rate used in L70 was reduced
compared to G100 to account for the expected increase in plant available N arising
from the legume residues. During both investigations all treatment were irrigated to
prevent water stress limiting the potential yields. Details of crop management and
fertilisation events are highlighted in Table 6-1. See Chapters 3 and 4 for further

174
information on the experimental set-up and crop management adopted during the two
investigations.
Table 6-1 - Times of application and N rates of isotopically labelled and
unlabelled fertilisers during the two investigations at Kingaroy research station,
Queensland, Australia.
Crop Time of fertiliser application Date Fertilisation [kg-N ha-1]
CONV DMPP
Wheat Planting 06/07/2011 20 (DAP) † 20 (DAP) †
Top Dressing (broadcasted) 15/09/2011 60 (urea)* 60 (DMPP urea)*
Maize Planting 21/12/2011 40 (MAP) † 40 (MAP) †
Side Dressing (banded) 19/01/2012 120 (urea)* 120 (DMPP urea)*
L70 L100
Sorghum Planting 12/12/2012 20 (urea)** 20 (urea)**
Side Dressing (banded) 14/01/2013 50 (urea)** 80 (urea)**
* Fertiliser labelled with 10% 15N urea
** Fertiliser labelled with 5% 15N urea
† DAP: diammonium phosphate; MAP: monoammonium phosphate
Legumes or nitrification inhibitors to reduce N2O emissions in subtropical cereal cropping systems? (Paper 4)
175
6.2.2 Crop development and fertiliser N recovery
Crop development was monitored in all treatments by collecting plant samples at
booting stage, flowering and physiological maturity. On every occasion, three
samples were collected in each treatment by cutting the plants over one meter of crop
row and subsequently oven-dried for 24 hours at 60°C. At harvest, average grain
yield was measured in each treatment by harvesting six strips at least 1.65 m wide for
the plot length using a plot combine.
Additionally, fertiliser N recoveries in the soil-plant system were assessed in the
treatments where high N fertiliser rates were applied, that is CONV and DMPP in the
first investigation and L70 and G100 in the second. In the CONV and DMPP
treatments 15N-labelled fertiliser was only applied as a side dressing to determine the
N recovery of DMPP urea and compare it with conventional urea (Table 6-1). Each
treatment received 10% excess 15N enriched urea; in the DMPP treatment the 15N
enriched urea was added with DMPP at a ratio of 6 g DMPP kg-1 urea to replicate the
same ratio of commercial DMPP urea. In the second investigation the L70 and G100
treatments received 5% excess 15N enriched urea both at planting and at side dressing
(Table 6-1). In both investigations 15N-labelled urea was applied as a liquid solution
in a sub-surface band, minimising in this way N losses via runoff and NH3
volatilisation.
In the treatments fertilised with 15N enriched urea, plant and soil samples were
taken exclusively at crop harvest. In wheat and maize only above-ground material
was collected, while moister soil conditions at the end of the sorghum season enabled
the collection of both above- and below-ground material. Wheat root biomass was
estimated using a root:shoot ratio of 0.31 (Siddique et al., 1990; Manschadi et al.,
2008) while a root : shoot ratio of 0.22 was used for maize (Anderson, 1988;
Demotes-Mainard and Pellerin, 1992). Soil sampling was performed using a core
sampler; samples were collected to a depth of 60 cm in wheat and maize, and to 1m
in sorghum. The 15N analysis was performed using a 20-22 Isotope Ratio Mass
Spectrometer (Sercon Limited, UK). For further information on experimental settings
and main findings see Chapter 5.

176
6.2.3 N2O emissions and ancillary measurements
The use of a fully automated, chamber-based greenhouse gas measuring system
ensured N2O emissions were monitored at a high temporal frequency throughout
each cropping season. The twelve chambers were closed airtight with lids operated
by pneumatic actuators and connected to a fully automated sampling and in-field
analysis system as described in Chapter 3 and Scheer et al. (2013a). One complete
sampling cycle (of twelve chambers) lasted 3 hours, with each chamber sampled for
1 hour and open for 2 hours to restore ambient conditions. This method provided
eight single fluxes per chamber per day. Hourly N2O fluxes were calculated by
defining the slope of the linear increase or decrease of the four gas concentrations
measured during the 60 minutes of chamber closure period (Chapter 4.3.6). Fluxes
above the detection limit were discarded if the regression coefficient (r2) was < 0.80.
Daily N2O emissions were determined by calculating the mean of the sub-daily
fluxes.
Routine soil sampling was conducted at regular intervals during the growing
seasons by collecting samples at three depths (0-10, 10-20, 20-30 cm). Samples were
added with 100 mL of 1M KCl and analysed colorimetrically for NH4-N and NO3-N
using an AQ2+ discrete analyser (SEAL Analytical WI, USA). Four frequency
domain reflectometers (FDR, EnviroScan probes, Sentek Sensor Technologies,
Australia) were installed at the field site to assess the water dynamics content at three
depth intervals (0-10 cm, 10-20 cm, 20-30 cm). Rainfall data were obtained from a
weather station located at the study site.
6.2.4 DAYCENT biogeochemical model
Developed as the daily time-step version of the CENTURY biogeochemical
model, DAYCENT simulates C and nutrients (N, P, S) dynamics between the
atmosphere, vegetation, and soil pools (Parton et al., 1998; Kelly et al., 2000; Del
Grosso et al., 2001). Main model inputs consist of data on daily maximum/minimum
air temperature and precipitation, site-specific soil properties, and current and
historical land management. Key submodels include crop development, soil water
dynamics by layer, mineralisation of nutrients and N gaseous emissions (N2O, N2,
NOx).

Legumes or nitrification inhibitors to reduce N2O emissions in subtropical cereal cropping systems? (Paper 4)
177
Crop development is controlled by genetic potential, phenology, nutrient
availability, water/temperature stress, and solar radiation (Metherell et al., 1993).
The allocation of net primary production is regulated by vegetation type, phenology
and water/nutrient stress. Nutrient mineralisation is a function of the lignin content
and C:N ratio of the substrate, substrate availability and water/temperature stress. No
vertical movement is assumed for soil NH4+, which is simulated only for the top 15
cm of soil profile. NO3- movement is instead simulated throughout the entire soil
profile and NO3--N can be leached below the rooting zone (Del Grosso et al., 2011).
The model simulates daily soil N2O and NOx fluxes due to nitrification and
denitrification, as well as daily N2 fluxes from denitrification (Parton et al., 1996;
Del Grosso et al., 2000; Parton et al., 2001). Nitrification rates rise linearly with soil
NH4+ concentration and increase exponentially with temperature until stabilising
when soil temperature reaches the highest monthly value recorded for the site. The
effect of soil moisture on biological activity is simulated by limiting nitrification
when soil water-filled pore space (WFPS) is below 40% or above 80%. Nitrification
is not limited when soil pH is above 7 but diminishes exponentially at pH levels
lower than neutral. If optimal conditions are met, maximum daily nitrification rates
can reach up to 10% of soil NH4+.
Denitrification is regulated by soil NO3- content, labile C availability, water
content and texture (Del Grosso et al., 2000). Denitrification starts to occur when
water-filled pore space (WFPS) values exceed 50-60% and increases exponentially
until soil water content approaches saturation (70-80% WFPS). Daily N fluxes from
denitrification are calculated taking into consideration the input that is most limiting.
N2O emissions are determined as a factor of total daily denitrification using an
N2:N2O ratio function. Depending on soil NO3- concentrations, maximum daily
denitrification rates can vary from less than 15% to almost 100% of soil NO3-.
6.2.5 Model initialisation, calibration and validation
The first step of the simulation entailed the site characterization process,
providing the model with information on site latitude, weather statistics and soil
horizonation. Initial values of soil organic matter and nutrient pools were generated
running a spin-up simulation reproducing historical land use (Del Grosso et al.,
2011). The spin-up simulation was run for almost 2000 years (ending in 1970),

178
assuming a 15-year burn cycle and a mixed ecotype formed by subtropical grass,
shrubs and eucalyptus trees. Running the spin-up simulation with the default model
parameters resulted in a significant overestimation of soil C content. The decay rate
of the passive soil organic matter pool was therefore increased by a factor of 2.5 to
meet the total soil C content measured at the beginning of the two field
investigations.
The base simulation was started in 1970, when the native vegetation was
eliminated via controlled burning and the soil ploughed for the first time. A crop
rotation including sorghum, peanuts, maize and wheat was implemented from 1970
to 2011 according to recorded local farming practices. Both spin-up and base
simulations were implemented using a 15-year weather file obtained combining data
from two meteorological stations located within 3 km from the study site (Australian
Bureau of Meteorology website).
The model was calibrated against measurements of soil water content, soil NH4+
and NO3- levels, daily N2O emissions, in-season biomass production, grain yield and
aboveground plant N uptake in the 0N, CONV, DMPP, L0 and G0 treatments. The
obtained parametrisation was validated against measurements in the ADJ, L70 and
G100 treatments.
Since the current version of DAYCENT does not include a 15N tracer submodel,
simulated plant N uptake in the aboveground biomass was calculated detracting the
plant N due to indigenous soil N pool from the total plant N. Plant N due to
indigenous soil N, defined as the N present in the soil before fertilisation, was
determined using the values from the CNT treatment in wheat and from L0 and G0 in
sorghum. For the maize season, plant N due to indigenous soil N was calculated by
simulating a treatment with no fertiliser N inputs. Fertiliser N losses measured in the
field were almost entirely due to deep leaching (leaching of NO3- beyond the rooting
zone) and gaseous emissions (N2O and N2) (Chapter 5). Simulated NO3- leaching,
N2O and N2 emissions due to fertiliser N were corrected for background values and
their sum was compared to the unaccounted N calculated with 15N-tracer techniques
(Chapter 5).
Data collected during the first investigation indicated that the efficiency of DMPP
in inhibiting N2O emissions was substantially higher in the maize season compared

Legumes or nitrification inhibitors to reduce N2O emissions in subtropical cereal cropping systems? (Paper 4)
179
to wheat (Chapter 3). The factor regulating the reduction in nitrification rates of
fertilizer N with DMPP was therefore reduced to 0.25 during the maize season and to
0.60 during wheat. In both seasons the duration of the nitrification inhibitor was set
to 6 weeks (Pasda et al., 2001).
6.2.6 N management scenarios
The fertiliser N rates that supported the highest yields in the two field
investigations (CONV, DMPP, L70 and G100) were varied by 20% to assess and
compare the robustness of each N management practice in terms of abating N2O
emissions and supporting high yields. Scenarios replicating the first investigation
included three N fertiliser rates in wheat (65, 80, 95 kg N ha-1) and in maize (130,
160, 190 kg N ha-1) using conventional or DMPP urea. For the second investigation
fertiliser N rates were 55, 70 and 85 kg N ha-1 in sorghum after the legume pasture
and 80, 100 and 120 kg N ha-1 in sorghum after the grass pasture.
N application methods, crop rotations and management were left unvaried
compared to those used for model calibration. Irrigation events were scheduled to
occur during the initial stages of crop development when volumetric water content
declined to levels lower than 20%. Sowing dates were adjusted according to weather
conditions year by year. The efficiency of each N management strategy was tested
under varying weather conditions running every scenario with 15 years of local
climate data (1999-2013). Initial soil conditions were re-initialised at the beginning
of every simulation.
6.2.7 Calculations and Statistical analysis
N2O emission factors, expressed as the percentage of N fertiliser lost as N2O,
were corrected for background emissions using values from the CNT treatment in
wheat and from L0 and G0 in sorghum. For the maize season, background emissions
were calculated simulating a treatment with no fertiliser N inputs. N2O emission
intensities were calculated as the ratio of N2O emitted (kg N2O-N ha-1) to grain
produced (Mg grain ha-1). Cumulative N losses were calculated for each treatment
summing seasonal losses via deep NO3- leaching and N2O and N2 emissions.
Discrepancies between measured and simulated values were assessed using the
root mean square error (RMSE) and the Pearson correlation (r2). Differences in

180
cumulative N2O emissions and grain yields were assessed with the ANOVA test
using a confidence interval of 95%. The Tukey post hoc test was used to compare
cumulative N2O emissions. Statistical analyses were performed within the SPSS 22
environment (IBM Corporation, USA).

Legumes or nitrification inhibitors to reduce N2O emissions in subtropical cereal cropping systems? (Paper 4)
181
6.3 Results
6.3.1 Model validation
The temporal pattern and magnitudes of modelled volumetric water content were
in reasonable agreement with observed values, especially in the top 10 cm (Figure
6-1). Values of r2 and RMSE for volumetric water content in the top 10 cm were
0.49 (F 292.28) and 5.06 in the first investigation and 0.43 (F 191.55) and 0.04 in the
second investigation, respectively. The precision of simulated soil water content was
inferior for the lower soil layers and r2 and RMSE values averaged for the top 30 cm
amounted to 0.28 (F 119.88) and 5.14 in the first investigation and 0.40 (F 287.64)
and 0.5 in the second investigation, respectively.
Figure 6-1 - Measured and simulated volumetric soil water content for three layers
(0–10 cm, 10–20 cm, 20–30 cm) and rainfall/irrigation events during the wheat-
maize (a, b, c) and sorghum (d, e, f) seasons at the Kingaroy research station,
Australia.

182
The model was able to represent properly the magnitude of soil NH4+ and NO3
-
variations following fertilisation events but a slight asynchrony between simulated
and observed values was often observed (Figure 6-2).
Figure 6-2 - Measured and simulated soil ammonium and nitrate contents (0-10
cm) for the eight fertilisation treatments during the wheat-maize (a, b, c, d) and
sorghum (e, f, g, h) seasons in Kingaroy, Australia. Arrows indicate the timing of N
fertiliser applications.

Legumes or nitrification inhibitors to reduce N2O emissions in subtropical cereal cropping systems? (Paper 4)
183
As a result, in the first investigation average r2 and RMSE values across
treatments were 0.39 (F 1.98) and 29.06 kg N ha-1 for NH4+ (top 30 cm) and 0.26 (F
4.65) and 15.04 kg N ha-1 for NO3- (top 30 cm). In the second investigation the
respective values were 0.29 (F 2.81) and 5.31 kg N ha-1 for NH4+ (top 30 cm) and
0.51 (F 6.37) and 1.78 kg N ha-1 for NO3- (top 30 cm). In both investigations
simulated leaching of NO3- below the rooting zone was minimal (< 2 kg NO3
--N ha-
1), which is consistent with data reported in Chapter 5.
The model provided reliable simulations of biomass production and crop response
to increasing fertiliser N rates (Table 6-2, Table 6-3 and Figure 6-3). The simulated
course of crop growth was close to field observations for wheat and sorghum, while
for maize tended to be slower compared to field observations. r2 and RMSE values
averaged across treatments were 0.93 (F 64.20) and 2.68 Mg ha-1 in the first
investigation and 0.96 (F 77.42) and 1.08 Mg ha-1 in the second, respectively.
Figure 6-3 - Measured (mean ± SD) and simulated aboveground biomass
(expressed as dry matter) for the eight fertilisation treatments during the wheat-maize
(a, b, c, d) and sorghum (e, f, g, h) seasons in Kingaroy, Australia.
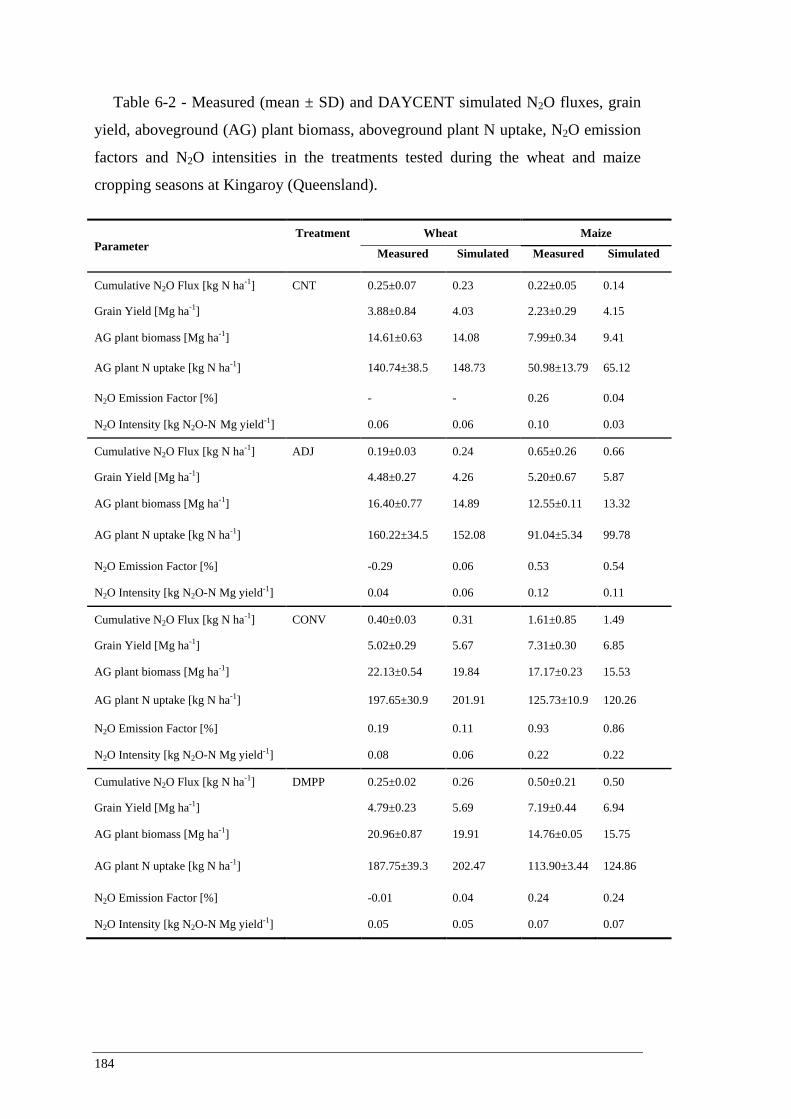
184
Table 6-2 - Measured (mean ± SD) and DAYCENT simulated N2O fluxes, grain
yield, aboveground (AG) plant biomass, aboveground plant N uptake, N2O emission
factors and N2O intensities in the treatments tested during the wheat and maize
cropping seasons at Kingaroy (Queensland).
Parameter Treatment Wheat Maize
Measured Simulated Measured Simulated
Cumulative N2O Flux [kg N ha-1] CNT 0.25±0.07 0.23 0.22±0.05 0.14
Grain Yield [Mg ha-1] 3.88±0.84 4.03 2.23±0.29 4.15
AG plant biomass [Mg ha-1] 14.61±0.63 14.08 7.99±0.34 9.41
AG plant N uptake [kg N ha-1] 140.74±38.5 148.73 50.98±13.79 65.12
N2O Emission Factor [%] - - 0.26 0.04
N2O Intensity [kg N2O-N Mg yield-1] 0.06 0.06 0.10 0.03
Cumulative N2O Flux [kg N ha-1] ADJ 0.19±0.03 0.24 0.65±0.26 0.66
Grain Yield [Mg ha-1] 4.48±0.27 4.26 5.20±0.67 5.87
AG plant biomass [Mg ha-1] 16.40±0.77 14.89 12.55±0.11 13.32
AG plant N uptake [kg N ha-1] 160.22±34.5 152.08 91.04±5.34 99.78
N2O Emission Factor [%] -0.29 0.06 0.53 0.54
N2O Intensity [kg N2O-N Mg yield-1] 0.04 0.06 0.12 0.11
Cumulative N2O Flux [kg N ha-1] CONV 0.40±0.03 0.31 1.61±0.85 1.49
Grain Yield [Mg ha-1] 5.02±0.29 5.67 7.31±0.30 6.85
AG plant biomass [Mg ha-1] 22.13±0.54 19.84 17.17±0.23 15.53
AG plant N uptake [kg N ha-1] 197.65±30.9 201.91 125.73±10.9 120.26
N2O Emission Factor [%] 0.19 0.11 0.93 0.86
N2O Intensity [kg N2O-N Mg yield-1] 0.08 0.06 0.22 0.22
Cumulative N2O Flux [kg N ha-1] DMPP 0.25±0.02 0.26 0.50±0.21 0.50
Grain Yield [Mg ha-1] 4.79±0.23 5.69 7.19±0.44 6.94
AG plant biomass [Mg ha-1] 20.96±0.87 19.91 14.76±0.05 15.75
AG plant N uptake [kg N ha-1] 187.75±39.3 202.47 113.90±3.44 124.86
N2O Emission Factor [%] -0.01 0.04 0.24 0.24
N2O Intensity [kg N2O-N Mg yield-1] 0.05 0.05 0.07 0.07
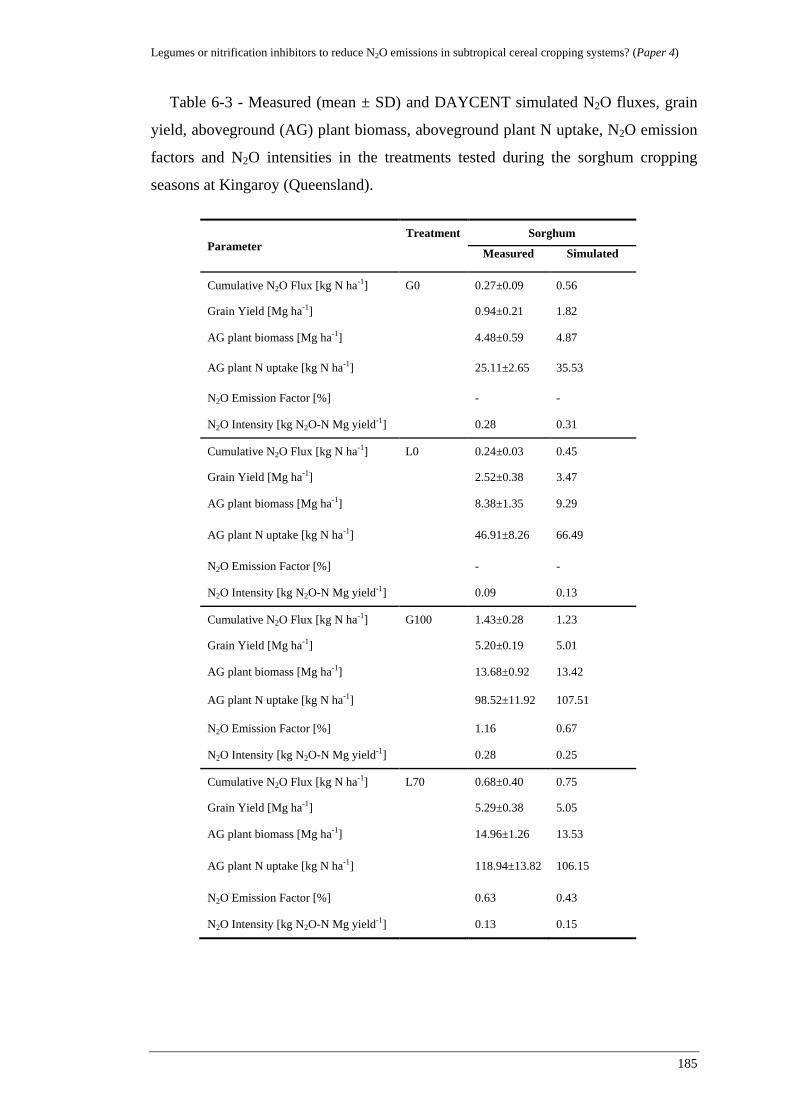
Legumes or nitrification inhibitors to reduce N2O emissions in subtropical cereal cropping systems? (Paper 4)
185
Table 6-3 - Measured (mean ± SD) and DAYCENT simulated N2O fluxes, grain
yield, aboveground (AG) plant biomass, aboveground plant N uptake, N2O emission
factors and N2O intensities in the treatments tested during the sorghum cropping
seasons at Kingaroy (Queensland).
Parameter Treatment Sorghum
Measured Simulated
Cumulative N2O Flux [kg N ha-1] G0 0.27±0.09 0.56
Grain Yield [Mg ha-1] 0.94±0.21 1.82
AG plant biomass [Mg ha-1] 4.48±0.59 4.87
AG plant N uptake [kg N ha-1] 25.11±2.65 35.53
N2O Emission Factor [%] - -
N2O Intensity [kg N2O-N Mg yield-1] 0.28 0.31
Cumulative N2O Flux [kg N ha-1] L0 0.24±0.03 0.45
Grain Yield [Mg ha-1] 2.52±0.38 3.47
AG plant biomass [Mg ha-1] 8.38±1.35 9.29
AG plant N uptake [kg N ha-1] 46.91±8.26 66.49
N2O Emission Factor [%] - -
N2O Intensity [kg N2O-N Mg yield-1] 0.09 0.13
Cumulative N2O Flux [kg N ha-1] G100 1.43±0.28 1.23
Grain Yield [Mg ha-1] 5.20±0.19 5.01
AG plant biomass [Mg ha-1] 13.68±0.92 13.42
AG plant N uptake [kg N ha-1] 98.52±11.92 107.51
N2O Emission Factor [%] 1.16 0.67
N2O Intensity [kg N2O-N Mg yield-1] 0.28 0.25
Cumulative N2O Flux [kg N ha-1] L70 0.68±0.40 0.75
Grain Yield [Mg ha-1] 5.29±0.38 5.05
AG plant biomass [Mg ha-1] 14.96±1.26 13.53
AG plant N uptake [kg N ha-1] 118.94±13.82 106.15
N2O Emission Factor [%] 0.63 0.43
N2O Intensity [kg N2O-N Mg yield-1] 0.13 0.15
186
Simulated grain production was in good accordance with observed values, but in
the treatments with nil of low N inputs (CNT, L0, G0) yields tended to be
overestimated, especially in the two summer crops (maize and sorghum). Overall,
simulated aboveground plant N uptake well matched observations obtained with the 15N tracer technique, suggesting that the model generally captured the N dynamics of
the soil-plant system.
The model was able to represent the magnitude and temporal variation of
measured N2O emissions (Table 6-2, Table 6-3 and Figure 6-4). However, the model
tended to overestimate emissions in the non-fertilised treatments (L0, G0 and CNT in
wheat) and no increase in N2O emissions was simulated in the CNT treatment in
maize after the rain event of 24 January 2012. In the two summer crops (maize and
sorghum) DAYCENT anticipated the occurrence of emission pulses following side
dressing (L70, G100 and ADJ and CONV in maize) but correctly simulated the
attenuated N2O emissions in the DMPP treatment. As a result, average r2 and RMSE
values across treatments were 0.37 (F 141.90) and 6.55 g N2O-N ha-1 d-1 in the first
investigation and 0.42 (F 211.76) and 4.16 g N2O-N ha-1 d-1 in the second
investigation.

Legumes or nitrification inhibitors to reduce N2O emissions in subtropical cereal cropping systems? (Paper 4)
187
Figure 6-4 - Daily N2O fluxes for the eight treatments during the wheat-maize (a,
b, c, d) and sorghum (e, f, g, h) seasons in Kingaroy, Australia. Arrows indicate the
timing of N fertiliser applications.
The discrepancies between measured and simulated N2O emission factors varied
among cropping seasons and treatments (Table 6-2 and Table 6-3). In wheat,
simulated emission factors for the ADJ and DMPP treatments were higher than those
calculated using field data. This was due to the high background emissions observed
in the field and that led to a negative emission factor for the ADJ treatment (Chapter
3). Emission factors were accurately simulated in the maize season, with the only
exception of the CNT treatment, where the high simulated yield caused an
underestimation of the emission factor. Emission factors in G100 and L70 were
lower than the observed values due to an overestimation of background emissions in
G0 and L0, respectively. On the other hand, N2O emission intensities were similar to
those calculated with field observations (Table 6-2 and Table 6-3). The only
exceptions where the non-fertilised treatments (L0, G0 and CNT in wheat), where
the yield overestimation resulted in emission intensities lower than the observed.

188
6.3.2 N management scenarios
In the first investigation (wheat and maize) N2O emissions increased
exponentially with increasing fertiliser N rates, while in the second investigation
(sorghum) the increase was linear (Table 6-4). In both investigations the correlation
between fertiliser N rate and grain yield tended to be linear, even though the yield
response started to plateau at the higher N rates. Significant differences in sorghum
yields were only observed in the grass cropping history between the -20% and +20%
treatment.
N2O emission factors and intensities of the CONV treatments consistently
exceeded those of DMPP in wheat and maize, while in sorghum they were higher in
the grass compared to the legume cropping history. N2O emission factors and
intensities varied substantially with increasing fertiliser N rates only in the maize
season, while in wheat and sorghum variations across N rates were minimal (Table
6-4).
The application of DMPP urea reduced cumulative N emissions compared to
conventional urea, but significant difference were only observed in DMPP-20% and
DMPP 160N compared to CONV+20%. Yields in the DMPP treatments were not
statistically different compared to the same N rate with conventional urea (Table
6-4). Even though cumulative N losses in the legume cropping history tended to be
lower than in the grass treatments, variability across seasons led to no significant
differences between the two cropping histories (Table 6-4).

Legumes or nitrification inhibitors to reduce N2O emissions in subtropical cereal cropping systems? (Paper 4)
189
Table 6-4 - DAYCENT simulated grain yields, N2O fluxes, cumulative N losses, aboveground (AG) plant N uptake, N2O emission factors
and N2O intensities for twelve N management scenarios at Kingaroy (Queensland) using daily weather data from 1999 to 2013 (mean ± SD).
Means denoted by a different letter indicate significant differences between treatments (p<0.05). Parameter Crop Fertiliser N rate applied
CONV-20% CONV 80N CONV+20% DMPP-20% DMPP 80N DMPP+20%
Grain Yield [Mg ha-1] Wheat 4.90±1.46 a 5.18±1.50 a 5.47±1.55 a 4.91±1.47 a 5.19±1.51 a 5.48±1.55 a
Cumulative N2O Flux [kg N ha-1] 0.35±0.14 a 0.37±0.14 a 0.39±0.14 a 0.30±0.14 a 0.32±0.13 a 0.34±0.13 a
Cumulative N2 Flux [kg N2-N ha-1] 2.89±2.65 a 2.99±2.65 a 3.12±2.66 a 2.72±2.62 a 2.79±2.61 a 2.89±2.61 a
Cumulative N losses [kg N ha-1] † 3.97±3.71 a 4.09±3.73 a 4.25±3.76 a 3.75±3.57 a 3.84±3.58 a 3.95±3.60 a
N2O Emission Factor [%] * 0.15 0.15 0.15 0.08 0.08 0.09
N2O Intensity [kg N2O-N t yield-1] 0.07 0.07 0.07 0.06 0.06 0.06
CONV-20% CONV 160N CONV+20% DMPP-20% DMPP 160N DMPP+20%
Grain Yield [Mg ha-1] Maize 6.30±1.01 a 7.00±0.90 ab 7.68±0.78 b 6.25±1.07 a 6.96±0.94 ab 7.62±0.82 b
Cumulative N2O Flux [kg N ha-1] 0.87±0.40 a 1.22±0.59 ab 1.61±0.83 b 0.31±0.16 a 0.41±0.21 a 0.54±0.28 a
Cumulative N2 Flux [kg N2-N ha-1] 5.84±4.52 ab 7.83±6.05 ab 9.81±7.62 b 2.18±1.84 a 3.22±2.62 a 4.53±3.69 ab
Cumulative N losses [kg N ha-1] † 7.65±5.59 ab 9.95±7.19 ab 12.30±8.97 b 3.20±2.63 a 4.31±3.32 a 5.73±4.37 ab
N2O Emission Factor [%] * 0.58 0.69 0.78 0.15 0.18 0.22
N2O Intensity [kg N2O-N t yield-1] 0.14 0.17 0.21 0.05 0.06 0.07
G -20% G 100N G +20% L -20% L70 L +20%
Grain Yield [Mg ha-1] Sorghum 3.32±0.81 a 3.76±0.90 ab 4.36±1.00 b 3.52±0.86 ab 3.78±0.91 ab 4.12±0.99 ab
Cumulative N2O Flux [kg N ha-1] 0.69±0.28 ab 0.80±0.32 ab 0.89±0.35 b 0.45±0.17 a 0.52±0.20 a 0.58±0.22 ab
Cumulative N2 Flux [kg N2-N ha-1] 9.03±4.73 b 9.13±4.69 b 9.26±4.64 b 3.99±2.15 a 4.16±2.23 a 4.33±2.29 a
Cumulative N losses [kg N ha-1] † 12.23±7.40 a 12.40±7.43 a 12.61±7.41 a 7.36±6.47 a 7.55±6.55 a 7.78±6.58 a
N2O Emission Factor [%] * 0.47 0.53 0.53 0.39 0.40 0.40
N2O Intensity [kg N2O-N t yield-1] 0.21 0.21 0.21 0.13 0.14 0.14
*Corrected for background emissions † Sum of deep NO3- leaching and N2O and N2 emissions

190
6.4 Discussion
6.4.1 Model performance
Process-based models represent fundamental tools to assess diverse agricultural
practices under varying climatic conditions to identify the most productive and
sustainable N management strategies. However, models have to be accurately
validated with field data to ensure that the obtained predictions are reliable and to
date DAYCENT has never been used in subtropical Oxisols.
Typically, models are validated with datasets referring to laboratory conditions,
single-season field experiments or reporting N2O measurements taken, at the most,
several times per week (Jarecki et al., 2008; Scheer et al., 2013a). Model validations
based on such relatively small datasets entail significant uncertainties and often result
in large errors (Kroon et al., 2010). The simultaneous availability of high-frequency
observations and N recovery data referring to multiple cropping seasons, crop
rotations and N fertiliser strategies constitutes therefore a unique framework able to
provide a rigorous validation of the DAYCENT model for a subtropical Oxisol.
The importance of testing the DAYCENT model for these environments was
confirmed by the initial overestimation of the soil C content obtained using the
default model parameters. The algorithms regulating C dynamics in DAYENT have
been largely developed using datasets referring to temperate conditions, where
mineralisation rates can be lower than in subtropical environments (Del Grosso et al.,
2011; Pu et al., 2012). Soil C levels in the study region are low as a result of
intensive conventional farming practices and the simultaneous occurrence of elevated
temperatures and high soil moisture levels during the summer months (Bell et al.,
1995), factors that can significantly accelerate soil C mineralization (Mann, 1986;
West and Post, 2002; Lal, 2004).
The necessity of increasing the decay rate of the passive soil organic matter pool
has already been reported in studies testing DAYCENT under subtropical conditions.
For example, Scheer et al. (2013a) employed a decay rate similar to that used in this
study after observing that, under warm and humid conditions, the DAYCENT
Legumes or nitrification inhibitors to reduce N2O emissions in subtropical cereal cropping systems? (Paper 4)
191
decomposition sub-model tends to overestimate the portion of organic C that is
stabilized in finer textured soils.
Increasing the decomposition rate of the passive soil organic matter pool
significantly improved model performance in predicting N dynamics in the soil-plant
system. Model validation provided a strong correspondence between simulated and
measured cumulative N2O emissions across investigations, although some deviations
were observed in the treatments that received low N inputs. Cumulative N2O
emissions were underestimated in the CNT treatment in maize and overestimated in
L0 and G0 in sorghum. It is likely that the low N2O fluxes simulated in CNT were
due to the overestimation of total biomass, which led to an excessive plant N uptake
and reduced the soil N available to nitrification and denitrification. Accordingly, no
N2O emission pulse was simulated in the CNT treatment after the rain event of 25
January 2012 (Figure 6-4a). In L0 and G0, where simulated biomass production
closely matched observations, the simulated seasonal N2O fluxes exceeded
measurements (Table 6-2, Table 6-3, Figure 6-4d and Figure 6-4e). This was also
observed by Del Grosso et al. (2008), who reported consistent overestimations of
N2O fluxes from non-fertilised treatments due to excessive background nitrification
rates. On the other hand, the model correctly simulated higher N2O fluxes in G0
compared to L0. The higher background N2O emissions simulated in the grass
cropping history were supported by a greater active soil C pool derived from the
decomposition of grass residues. Conversely, the simulated levels of active soil C in
the legume cropping history remained relatively low after the incorporation of the
pasture residues, limiting denitrification despite the higher content of organic N (data
not shown). These nutrient dynamics were consistent with field observations
(Chapter 4).
DAYCENT was able to reproduce soil water and mineral N dynamics on a day-
to-day basis (Figure 6-1 and Figure 6-2). The average correlation of measured vs.
simulated daily N2O emissions yielded r2 values of 0.23 for the first investigation
and 0.42 for the second, which are consistent with some of the best results (0.32-
0.52) obtained with DAYCENT for various cropping systems worldwide (Li et al.,
2005b; Abdalla et al., 2010; Scheer et al., 2013a). However, in the summer crops the
model tended to anticipate the N2O emission pulses following side dressing (Figure
6-4), lowering the overall annual r2 and RSME values.

192
Observed data indicated that when soil mineral N levels were elevated due to the
recent fertilisations events, N2O emission rates started to increase approximately
three days after a substantial rainfall/irrigation event (> 20 mm). This time lag was
probably due to a combination of reduced gas diffusivity caused by the high clay
content of the soil (Smith et al., 1998) and time required to the microbial pool to
initiate enzyme production when nutrient and water levels reached a threshold level
(Dendooven and Anderson, 1994).
These two processes are currently not simulated in DAYCENT. However, the
data analysed in this study highlight that algorithms regulating microbial activity and
gas diffusivity of N2O produced at different depths should be incorporated in the
model to improve DAYCENT capability of simulating the temporal patterns of daily
N2O emissions. An enhanced representation of how different soil conditions
influence microbial dynamics would also allow the model to reproduce the decline in
the DMPP inhibitory efficiency observed during the winter season, so to avoid the
use of different inhibition factors for fertilizers applied to winter and summer crops.
The model precisely predicted the response of the three crops to the different N
management strategies. Grain yields, simulated aboveground biomass productions
and fertiliser N recoveries closely matched field observations (Table 6-2 and Table
6-3). DAYCENT however tended to overestimate grain production in the low-N
input treatments of the two summer crops, i.e. CNT in maize and L0 and G0 in
sorghum. Field observations showed that the elevated N requirements of these two
crops led to a heavier reliance on fertiliser N to achieve maximum yield potential
(Chapter 5). As a result, observed maize and sorghum crop productions were
severely affected by below-optimal N inputs. The decline of maize and sorghum
harvest indexes at decreasing fertiliser N rates was however not reproduced by the
model, which simulated constant harvest indexes regardless of the N stress of the
crop. These results indicate that simulated crop physiology is not optimal in
DAYCENT and that improvements are needed to correctly predict plant growth
dynamics under varying N stress conditions.
Overall, the model validation highlighted some shortcomings in DAYCENT
ability to simulate the timing of N2O emissions pulses and reproduce crop response
to elevated N stress. However, cumulative N2O losses, crop N uptake and yields
were predicted correctly when fertiliser N rates did not cause excessive N stress to

Legumes or nitrification inhibitors to reduce N2O emissions in subtropical cereal cropping systems? (Paper 4)
193
the crop. The parameterisation obtained could therefore be used to accurately
evaluate different N management strategies aimed at supplying optimal N levels to
subtropical cereal cropping systems.
6.4.2 Scenarios and best N management practices
Simulations highlighted that N losses during the three cropping seasons tended to
be lower compared to cereal systems conducted under different environmental
conditions (Van Groenigen et al., 2010; Liu et al., 2011; Hu et al., 2013). This was
essentially due to the physical and chemical properties of the Oxisol used in this
study. The high clay content of the soil, constant through the entire profile, reduced
the water infiltration rates also during the intense rain events occurred during the two
summer seasons (Figure 6-1). The moderate soil permeability limited NO3- leaching
and maintained the majority of the N in the rooting zone, enabling in this way a
wider window of opportunity for the plants to adsorb the N supplied with
fertilisation. This dynamic was observed in the field using 15N tracer techniques and
was correctly replicated by the model.
On the other hand, the permeability of the soil was sufficient to avoid prolonged
periods of saturation of the soil profile following high rainfall events. Denitrification
could therefore not go to completion and only moderate quantities of N2 were lost
after significant rain events (Table 6-4). Moreover, denitrification was limited by the
relatively low amounts of soil C, a feature typical of intensively cropped Oxisols
(Bell et al., 1995). As a result, the 15-year mean N2O emission factors (corrected for
background emissions) ranged from a minimum of 0.08% (DMPP -20% in wheat) to
a maximum of 0.78% (CONV +20% in maize, Table 6-4), and on average were
substantially lower than the default values of 1% of applied N suggested by De Klein
et al. (2006).
DMPP urea
The simulation of different N management scenarios indicated however that there
is significant scope for limiting N2O losses in these agroecosystems, especially in
summer. The warm and humid soil conditions of this season, associated with the
higher N fertiliser rates applied to summer crops, were conducive for substantially

194
greater nitrification and denitrification rates compared to winter. Among the N
management strategies tested, the application of DMPP urea was the most effective
in minimising N2O emission factors during a summer crop (Table 6-4).
On average, side dressing maize with high amounts of conventional urea led to
short periods of asynchrony between plant N uptake and N supply in the top soil.
During the investigated period soil conditions at side dressing were typically warm
and moist, resulting in rapid nitrification of the NH4+-N applied. At this stage of crop
development the crop root systems were however not sufficiently developed to
effectively acquire all available NO3-, leading to temporary build-ups of NO3
- levels
in the top soil (i.e. where urea was banded). The increased concentrations of soil
NO3- usually coincided with elevated soil moisture levels caused by intense rainfall
events, and resulted in conditions highly conducive for denitrification and therefore
for elevated N2O emissions.
Compared to conventional urea, the slower nitrification rates of DMPP urea
enabled to better match the NO3- released by the fertiliser with plant N uptake,
resulting in almost no accumulation of NO3- in the top soil and therefore limiting
denitrification. Consequently, the N2O emissions factors and N2O emission
intensities of the DMPP treatments in maize were less than a third compared to those
in CONV (Table 6-4).
However, the reduction of cumulative N losses simulated for DMPP urea was not
sufficient to increase yields compared to conventional urea, even in the +20%
treatment. Augmenting the application rate of urea by 20% (total N rate: 190 kg N
ha-1) was likely to result in substantial N losses that would have prevented to achieve
maximum yield potential. Cumulative N losses in the CONV treatment were instead
limited by soil properties and grain yields in CONV+20% were similar to
DMPP+20% (Table 6-4).
In fact, the enhanced synchronicity of DMPP urea compared to conventional urea
was only temporary and limited to the top soil. Deep NO3- leaching events after top
dressing with conventional urea were prevented by the high clay content of the
Oxisol, while the soil C content and the short-lived periods of soil saturation after the
summer rainfall events were not sufficient for denitrification to go to completion and
result in elevated N2 losses (Table 6-4). As a result, applying N as conventional urea

Legumes or nitrification inhibitors to reduce N2O emissions in subtropical cereal cropping systems? (Paper 4)
195
led to temporary accumulations of NO3- in the top soil (and therefore to higher N2O
emissions), but on average the majority of fertiliser N remained in the rooting zone.
These observations support the results obtained by Abalos et al. (2014), whose
extensive meta-analysis across cropping systems evaluated the effectiveness of
different nitrification inhibitors - including DMPP - in increasing crop N uptake and
productivity. After examining a total of 27 studies and 160 observations on crop
productivity and 21 studies with 94 observations on crop N uptake, the analysis
found little or no effects on crop yields when nitrification inhibitors were applied on
fine-textured soils. The reason for this inefficiency was identified in the limited
susceptibility of these soils to NO3- leaching and N2 losses, confirming that
nitrification inhibitors have little scope to improve productivity in Oxisols.
Legume phase in a cereal-based crop rotation
The introduction of a legume pasture phase in a cereal-based crop rotation showed
multiple environmental and agronomic advantages. Planting sorghum shortly after
incorporating the legume pasture ensured the synchronicity between the N uptake of
the cereal crop and the mineral N progressively released by the decomposition of the
legume residues. This practice avoided the accumulation of relevant amounts of N in
the soil that would have been available to nitrifying and denitrifying microorganisms,
and simulated N2O emissions were primarily a function of the N fertiliser rate
applied. Decreasing the synthetic N rates applied to sorghum in the legume cropping
history led therefore to substantial reductions of N2O losses and emission factors
were abated on average by 20% compared to the grass cropping history (Table 6-4).
These results are consistent with what reported for subtropical cropping systems by
Schwenke et al. (2015), who observed that the slow release of legume-derived N can
increase the synchronicity with the demand of the following crop, leading to
substantial reductions of N2O emissions compared to synthetic N.
In particular, this strategy enabled lowering the amount of fertiliser N side dressed
to the summer crop, the occasion when the highest quantities of annual synthetic N
are applied. Build-up of high amounts of NO3- in the soil following fertilisation was
therefore limited and fertiliser N was used more efficiently by the plants. These
results confirm what reported in a simulation study by Huth et al. (2010), who
196
reported that split application of smaller amounts of synthetic N can decrease
average N2O emissions by at least 15%.
Although not sufficient to fully meet the crop N demand, the incorporation of
legume residues provided enough readily available N to support sorghum growth.
The cereal crop responded positively to the N supplied by the legume residues and
the higher soil N reserve in the legume cropping history decreased the reliance of the
cereal crop on synthetic N fertiliser. Reducing the fertiliser N rate by 20% in the
legume cropping history led to a 7% decline in sorghum yield, while the same N
reduction in the a grass cropping history caused a 12% yield decrement. As a result,
even when the fertiliser N rate was reduced by 20%, yields in the legume cropping
history were comparable to those in the G100 and G+20% treatments (Table 6-4).
Conversely, sorghum in the grass cropping history was highly reliant on synthetic N
fertiliser and yields in G-20% were significantly lower than in G+20%. Similar
results were obtained by Huth et al. (2010), who reported a 34% reduction in the
amount of fertiliser N required by cereal crops when grown in rotation with legumes.
The results of this study also indicate that the presence of a legume phase in a
cereal-based crop rotation reduces the risk of failing to achieve maximum yield
potential due to an insufficient application of synthetic N. This strategy provides
more flexibility to the farmer in terms of timing and rate of fertiliser application,
especially in rainfed cropping systems. The mineralisation of legume residues can in
fact supply enough N during the initial stages of crop growth, enabling the famer to
modulate the synthetic N input applied at side dressing depending on seasonal
weather conditions and therefore the potential yield achievable. Collectively, model
simulations suggest that introducing legumes in subtropical grain-based cropping
systems reduces the N2O emission intensity of the cereal phase by 30% while
sustaining the maximum yield potential of the cereal crop.

Legumes or nitrification inhibitors to reduce N2O emissions in subtropical cereal cropping systems? (Paper 4)
197
6.5 Conclusions
Even though these results are influenced by the soil and climatic conditions of the
site used for the validation of the model, they provide an insight on N fertiliser
dynamics and N2O losses that could be valid for other subtropical cereal-based
cropping systems on Oxisols.
Overall, simulations indicated that nitrification inhibitors can be more effective
than legumes to reduce N2O emissions during the cereal cropping phase. The use
nitrification inhibitors however increases the fertilisation costs compared to
conventional urea and in this study the higher costs of this practice were not
compensated through increases in grain yield. The results of this study indicate
therefore that in these agroecosystems the use of nitrification inhibitors to reduce
N2O emissions cannot be regarded as an economically viable standard farming
practice unless governmental incentive policies are established.
On the other hand, the chances of significant N losses in these agroecosystems are
limited by the moderate permeability and relatively low C content of the Oxisols.
Consequently, synchronicity between fertiliser N supply and plant uptake can be
achieved with conventional urea when applied at low rates. Limiting the application
rates of synthetic fertiliser N is therefore the most feasible strategy to reduce N2O
losses in Oxisols.
Introducing legumes in cereal-based crop rotations reduced the reliance on
fertiliser N of the cereal crop and therefore limited synthetic N rates. The
mineralisation of legume residues provided sufficient N to support crop development
during the early phenological stages, limiting fertiliser N requirement to the amounts
necessary to attain maximum yield potential. This strategy reduced the chances of
high amounts of mineral N accumulating in the top soil and therefore diminished
N2O emissions due to fertilisation. This simulation study therefore indicates that
introducing legumes in cereal-based cropping systems is the most agronomically
viable and environmentally sustainable N management strategy to support future
intensification of subtropical cereal production in Oxisols. Further research is
however advocated to confirm the efficacy of this N management strategy on
different types of Oxisols under different subtropical conditions.

198
This study also highlighted some shortcomings in the crop and soil submodels of
DAYCENT. The correction of these limitations would significantly improve the
potential of the model in assessing the environmental and agronomic implications of
different N management practices.
199
Chapter 7: Discussion and Conclusions
7.1 Overall study findings
Mitigating climate change and achieving food security are two of the key
challenges of the twenty-first century. By 2050 the world’s population is forecast to
be over a third larger than at present (UNFPA, 2011) and cereal demand is predicted
to increase by 60% (FAO, 2009). Pronounced intensification of cereal production is
expected to take place in Oxisol-dominated tropical and subtropical regions (Smith et
al., 2007), identifying the need for more N to be supplied to these agroecosystems
(Fageria and Baligar, 2008). Boosting food production though an increased use of
synthetic N fertilisers will however result in sharp increases in greenhouse gas
emissions, especially N2O (FAO, 2010; Foley et al., 2011; Tilman et al., 2011). It is
therefore critical to identify alternative N management strategies aimed at supporting
future intensification of tropical and subtropical agricultural systems without
promoting an increase of N2O emissions from these agroecosystems.
A unique dataset of high temporal-frequency N2O observations and N recovery
data from multiple cropping seasons, crop rotations and N fertiliser strategies was
gathered in the subtropics using a fully automated greenhouse gas measuring system, 15N-tracer techniques and a process-based biogeochemical model. The aim was to
define profitable, agronomically viable and environmentally sustainable N
management strategies to support future intensification of cereal production on
subtropical Oxisols. This study also aimed to improve the current understanding of
environmental factors influencing N2O emissions in fertilised Oxisols and to assess
the magnitude and main pathways of fertiliser N losses that limit crop yields in these
agroecosystems.
The major findings and conclusions from this study are presented in this section
against each of the research objectives. An analysis of the environmental, agronomic

200
and economic implications resulting from this study follows along with the
recommendations for further research. The concluding statement of this research is
thus presented.
Objective 1
Research objective: Evaluate the use of urea coated with a nitrification inhibitor to
limit N2O emissions and increase grain yields compared to conventional urea.
Hypotheses: i) nitrification inhibitors decrease N2O emissions both directly, via
slowing the nitrification rates, and indirectly, by reducing the amount of NO3-
available to denitrifying microorganisms; ii) by reducing N movements beyond the
rooting zone, nitrification inhibitors can improve the synchrony between fertiliser-
derived NO3- and plant uptake, and therefore increase yields compared to
conventional urea.
Applying urea coated with the DMPP nitrification inhibitor was successful in
reducing N2O emissions only in the summer crop (maize), when conditions were
conducive to high N2O emissions, while no differences with conventional urea were
observed in the winter crop (wheat). In winter, the activity of nitrifying and
denitrifying microorganisms was limited by the relatively low soil temperature and
water content. These conditions are particularly adverse for denitrification, the
process that can be the main pathway for large N2O losses (Robertson and Groffman,
2007). As a result, N2O emission rates in winter were naturally inhibited by the soil
conditions and there was no scope for DMPP to reduce the emissions any further.
In contrast, the warm and humid soil conditions of the summer season were more
conducive for nitrification and denitrification. As a result, N2O emissions following
the application of 130 kg of conventional urea (60 kg N ha-1) in the summer crop
were fivefold those measured after applying the same rate of conventional urea in the
winter crop (Paper 1).
N2O emissions in summer were also higher due to the asynchrony between the N
released by conventional urea and the plant N uptake, particularly at the highest N
rate (120 kg N ha-1). When maize was side dressed with conventional urea, the

Discussion and Conclusions
201
summer soil conditions promoted rapid nitrification of the applied NH4+-N, but at
this physiological stage (V10) the crop root system was not sufficiently developed to
acquire all N present in the soil. As measured in the field (Paper 1) and confirmed by
model simulations (Paper 4), this asynchrony resulted in a build-up of NO3- levels in
the top soil (i.e. where urea was banded). This increase in the concentration of soil
NO3- coincided with elevated soil moisture levels caused by intense rainfall events,
and resulted in conditions highly conducive for denitrification.
The occurrence of significant summer rainfall events shortly after the side
dressing of N fertiliser is typical in subtropical regions and was frequently observed
during the fifteen years (1999-2013) of local climate data used for the simulation of
N management scenarios (Paper 4). This pattern indicates that the conditions
observed in the field experiment were representative of those usually occurring at
these latitudes.
Slower nitrification rates achieved with DMPP urea enabled a better synchrony
between the plant uptake and the NO3- derived from the fertiliser (Paper 3), and
enabled a reduction of NO3- in the top soil during summer cropping. With less NO3
-
available for denitrification in the top soil, N2O emissions in maize were abated (on
average) by 65% compared to the same N rate with conventional urea (Paper 1 and
Paper 4).
The enhanced synchrony between N availability and plant uptake afforded by
DMPP urea compared to conventional urea was however confined to the top soil -
where the fertiliser was banded- and did not influence the overall crop N uptake. As
established in Paper 3 and Paper 4, the losses of NO3- via leaching were minimal in
the heavy clay soil. In addition, the periods of soil saturation after the summer
rainfall events were not prolonged, limiting N2 losses from both conventional and
DMPP urea. Applying N as conventional urea led therefore to a temporary
accumulation of NO3- in the top soil, but the majority of fertiliser N remained in the
rooting zone. This resulted in plants fertilised with conventional urea having an
adequate window of opportunity to take-up the fertiliser N and, as reported in Paper
3, limited amounts of fertiliser N were lost from the soil-plant system. DMPP had
therefore no significant scope to increase the overall ability of the plant to acquire the
applied N, and no gain in yields was observed at any applied N rate (Paper 1 and
Paper 4).

202
These observations support the results obtained by Abalos et al. (2014), whose
extensive meta-analysis across cropping systems evaluated the effectiveness of
different nitrification inhibitors - including DMPP - in increasing REfN and crop
productivity. After examining a total of 27 studies and 160 observations on crop
productivity and 21 studies with 94 observations on REfN, the analysis found little or
no effects on crop yields when nitrification inhibitors were applied on fine-textured
soils. As in the present study (Paper 1 and 4), Abalos et al. (2014) identified the
reason for this inefficiency in the limited susceptibility of these soils to NO3-
leaching, concluding that nitrification inhibitors have little scope to improve REfN in
clay soils.
Objective 2
Research objective: Evaluate whether the introduction of a legume in a cereal-
based crop rotation can reduce the reliance of cereal crops on synthetic N fertilisers
and minimise N2O emissions during the cereal cropping phase.
Hypotheses: i) the N mineralised from legume residues can substantially reduce
the synthetic N input required by the following cereal crop and therefore limit the
“direct” N2O emissions due to mineral fertilisation, and ii) N2O losses due to the
mineralisation of legume residues can be minimised via synchronising the release of
N derived from the residues with the N demand of the subsequent cereal crop.
Introducing a legume in a cereal-based crop rotation offered the double advantage
of supplying substantial amounts of N to the following cereal crop while reducing
overall N2O emissions during the cereal season. This condition was attained because
in this study the N supplied by both sources -legume residues and synthetic fertiliser-
was synchronised with crop demand.
Synchronising N supply with N demand can be technically challenging when, as
with the mineralisation of legume residues, N release is mediated by microbial
processes. In fact, low levels of synchrony have often been reported in legume-cereal
cropping systems (Wagner-Riddle et al., 1997; Wagner-Riddle and Thurtell, 1998;
Fillery, 2001; Pappa et al., 2011), when the field was left fallow for long periods

Discussion and Conclusions
203
after the end of the legume phase, allowing for the accumulation of large amounts of
mineral N in the soil at a time when there was no crop to use it (Jensen et al., 2012).
In this study the accumulation of mineral N in the top soil was avoided by
minimising the period between the incorporation of the legume residues and the
planting of the cereal crop (approximately three weeks). A key factor in limiting
mineral N accumulation during this time was the relatively dry soil conditions, which
slowed the decomposition of the legume residues. Wetter soil conditions during the
fallow period would have in fact accelerated the mineralisation of the legume
residues and created optimal circumstances for nitrifying and denitrifying bacteria,
resulting therefore in higher N2O losses.
In both wheat and sorghum the gradual N release from the mineralisation of
legume residues (mungbean and sulla, respectively) provided a consistent flow of N
that was within the uptake capability of the crop. Importantly, high levels of
synchrony between the N released from legume residues and the uptake of the
following crop were achieved during both the winter (wheat) and summer (sorghum)
crops.
Environmental factors such soil moisture and soil temperature play pivotal roles
in influencing the decomposition of the residues and different patterns of
mineralisation can be expected during winter and summer. However, the
environmental factors that regulate the decomposition of the residues are the same
that influence the plant nutrient demand of the following crop, enabling therefore to
attain high levels of synchrony under different soil moisture and temperature
conditions (Myers et al., 1994; Crews and Peoples, 2005).
Although not sufficient to fully meet the crop N demand (Paper 1 and Paper 2),
the N released by the legume residues provided a substantial N supply to the cereal
crops and reduced the crop reliance on synthetic fertiliser compared to crops planted
after a non-leguminous crop (Paper 3). The diminished reliance on synthetic N inputs
was confirmed by model simulations (Paper 4), which established that grain yields in
legume-cereal cropping systems declined less rapidly than in cereal-cereal or grass-
cereal systems when fertiliser N rates were reduced.
The decreased reliance on synthetic N inputs allowed for reducing fertiliser N
rates to the levels necessary to reach maximum yield potential. In particular, this

204
strategy enabled lowering the amount of fertiliser N side dressed to the summer crop,
the occasion when the highest quantities of annual synthetic N are applied. Build-up
of high amounts of NO3- in the soil following fertilisation was therefore limited and
fertiliser N was used more efficiently by the plants. As highlighted in Paper 3, the
recovery of fertiliser N in the plant was significantly higher in crops that had been
fertilised with lower rates of synthetic N. Accordingly, in these treatments the
amount of synthetic N left in the soil after the cereal cropping cycle was substantially
lower than where crops were fertilised with elevated N rates.
Overall, the gradual mineralisation of legume residues promoted the fertiliser N
recovery in the crop and N2O losses were mainly caused by temporary increases in
soil NO3- levels due to fertiliser application (Paper 2). Cumulative N2O emissions
increased in direct response to the rate of N fertiliser applied, with cropping history
having no significant effect as confirmed by model simulations (Paper 4).
A reduction in N2O emissions from the legume-cereal cropping systems was also
due to the chemical composition of the legume residues. The low C:N ratio of the
legume tissues enhanced the degradation of the residues, leaving little labile C in the
soil during the cereal cropping season and reducing the potential activity of
heterotrophic microorganisms, such as those responsible for denitrification (Elmi et
al., 2003; Yao et al., 2009). As a result, although soil N concentrations after the
termination of a legume phase were higher than after a non-leguminous crop, N2O
emission pulses following rainfall events were significantly lower in the legume
cropping history (Paper 3). These findings support the results reported by Sanz-
Cobena et al. (2014), who observed higher N2O emissions from maize after the
incorporation of barley, compared to the same crop after the incorporation of a vetch
pasture.
Overall, the results of this study show that when legume residues are managed
correctly they can play a pivotal role in improving the N synchrony and reducing
N2O emissions in high-yielding cereal-based agroecosystems.

Discussion and Conclusions
205
Objective 3
Research objective: Assess the sustainability of the N management practices
investigated in Objectives 1 and 2 under a broader spectrum of fertiliser N rates and
environmental conditions.
Hypotheses: A simulation approach can be used to i) assess the validity and
robustness of the hypotheses underlying the previous two objectives, and ii) improve
the understanding of the environmental factors driving N2O emissions and crop
productivity in subtropical cereal cropping systems.
Models are useful tools for evaluating the hypotheses advanced in this study as
well as to explain the N2O emissions and crop growth patterns observed during the
field experiments. Simulating the application of conventional and DMPP urea at
different N rates and under diverse seasonal conditions enabled to establish that the
chemo-physical characteristics of the Oxisol, and not the fertiliser type, were the
main factor influencing synchronicity between N demand and fertiliser supply.
Models simulation confirmed that applying DMPP urea to inhibit nitrification in
these soils is effective in reducing N2O emissions, which however represented only a
fraction of the overall N losses (inclusive of N2O and N2 emissions, and NO3-
leaching). Critically, DMPP urea did not substantially decrease N2 emissions and
NO3- leaching compared to conventional urea and therefore did not increase yields
(Paper 4).
Substituting a proportion of the N requirements of the crop with N mineralised
from the legume residues proved to be the most effective strategy to reduce N2O
emissions and support cereal productivity. Legume residues supplied substantial
amounts of N to crops but did not lead to sharp increases in soil N levels that would
have stimulated nitrification and denitrification (Paper 4). Seasonal N2O emissions
were directly related to the amount of fertiliser N applied, not of the crop rotation.
Consequently, proportional reductions in N2O emissions were obtained when
fertiliser N rates could be decreased as a result of the N supplied by the legumes.
The use of model simulations also increased the overall understanding of N
dynamics in subtropical Oxisols. The large dataset established in this study enabled
the DAYCENT model to be calibrated for N2O losses, plant N uptake and mineral N
kinetics for the top 30 cm of these soils. Additionally, it was possible to define N

206
losses via deep leaching by reconciling soil water content data and the recovery of
fertiliser N in the lower layers of the soil profile. This technique enabled to perform a
N mass balance and therefore to accurately estimate N2 emissions from these
agroecosystems.
The magnitude of N2 losses from soils and the related N2:N2O ratio are largely
unknown due to difficulties in measuring N2 against a high atmospheric background
(Dannenmann et al., 2008; Mulvaney, 2008). N2 losses differ greatly across
agroecosystems depending on soil chemo-physical properties, fertilisation and
rainfall regime (Weier et al., 1993). As a result, studies on cereal cropping systems
have reported N2 emissions varying from 1% to 15% of applied N depending on
environmental conditions (Weier, 1994; Bronson and Fillery, 1998; Smil, 1999; Cai
et al., 2002a; Janzen et al., 2003). In addition to the difficulties of obtaining N2
measurements, the uncertainty of estimating N2 losses with DAYCENT is due to
limited dataset used for developing the denitrification submodel. The denitrification
equations in the DAYCENT model were defined using a series of intact core
incubations (Weier et al., 1993) and field measurements (Mosier et al., 1996) that
related C, NO3- and WFPS dynamics to N2O and N2 fluxes (Parton et al., 1996).
Critically, none of these experiments was conducted in Oxisols or under subtropical
conditions, and no studies so far have assessed N2 emissions from these agro-
environments using DAYCENT.
The dataset gathered in this study allowed for a rigorous calibration of the
DAYCENT model for subtropical cereal cropping systems in Oxisols, and therefore
for the estimation of N losses due to denitrification. Even though not supported by
direct N2 measurements, model simulations enabled to estimate fertiliser-derived N2
losses during the three cropping seasons. N2 losses estimated in this study for
conventional urea varied between averages of 1.3% of applied synthetic N for the
winter season (wheat) and 4.6% for the summer seasons (maize and sorghum). In
line with the results reported in Paper 3, simulation showed that N2 losses tend to be
limited in Oxisols and highlighted that average N2:N2O ratios of 8.5 could be
adopted for estimating denitrification losses in subtropical Oxisols. These results
confirmed the analysis conducted by Xu et al. (2013), who in an extensive review
indicated that denitrification rates in acidic tropical and subtropical soils can be
lower than those in their temperate counterparts. In fact, N2 losses tend to be limited
Discussion and Conclusions
207
in Oxisols due to the relatively low C content of these soils, which may not be
enough to support denitrification (Xu and Cai, 2007; Wang and Cai, 2008). The low
soil pH of these soils is also likely to negatively affect the growth and activity of
most denitrifiers, which optimal pH ranges from 6 to 8 (Aulakh et al., 2001).
Moreover, the permeability of Oxisols is usually sufficient to avoid prolonged
periods of saturation of the soil profile following high rainfall events, resulting in
low gas emission due to denitrification (Pu et al., 2002; Xu et al., 2013).
Overall, the use of model simulations provided a unique insight of gaseous N
emissions in Oxisols, establishing that fertiliser N losses in subtropical Oxisols are
limited by their intrinsic chemo-physical properties. This approach was also pivotal
for determining that the introduction of legumes in these cropping systems is the best
strategy to support crop production while reducing overall N2O emissions during the
cereal season. The simulation of N2 emissions obtained in this study was however
performed without the possibility of comparing modelled results with field
measurements. Further research measuring N2 losses from cropped Oxisols is
therefore advocated to validate the estimates presented in this study.
7.2 Economic implications
Identifying environmentally and agronomically sound N management strategies is
essential when promoting the sustainable intensification of future subtropical cereal
cropping systems. Guaranteeing their widespread adoption means these strategies
need to be profitable for the farmer and adoptable both in low- and high-income
cropping systems. The key economic implications of the two N management
strategies assessed in this study are examined here, with a clear focus on their
profitability at farm-scale level.
Evaluating the specific economic implications of these N management strategies
in every country with cereal cropping systems in Oxisols is extremely complex and
beyond the scope of this study. The commodity prices used for this analysis refer
therefore to Australian conditions, and have been calculated averaging the values
obtained from the FAOSTAT database for the period 2008-2012.

208
DMPP urea
The application of DMPP urea in this study was the most effective strategy to
abate N2O emissions during the summer cereal crop but proved to be uneconomical
at farm-scale. Urea coated with DMPP is 30% more expensive than conventional
urea (Chapter 3.3.2) and the first investigation showed that top dressing the summer
cereal crop (maize) with DMPP urea increases the fertilisation costs by
approximately USD 50 ha-1. The additional cost of using DMPP urea however was
not compensated through increases in grain yield, meaning that in these
agroecosystems the use of nitrification inhibitors cannot be regarded as an
economically viable N management from the farmer’s perspective.
Governments or political institutions aiming to reduce N2O emissions from cereal
cropping systems could foster the use of N fertilisers coated with nitrification
inhibitors by establishing subsidies covering the additional cost of these fertilisers or
introducing emission trading schemes. In this study, top dressing the summer crop
with DMPP urea reduced N2O emissions by 1.1 kg N2O-N ha-1 compared to
conventional urea (Table 3-3), equivalent to approximately 0.33 Mg CO2 ha-1. The
hypothetical carbon price necessary to refund farmers applying DMPP urea would
therefore correspond to 150 USD Mg CO2-1, a value largely exceeding the 8 USD
Mg CO2-1 currently adopted by the European Union Emission Trading System
(London Stock Exchange, accessed November 2014).
Even though in this specific study the use of DMPP urea increased fertilisation
costs by 30%, a detailed study assessing various nitrification inhibitors (Weiske,
2006) suggested 10% as the average cost increase for nitrification inhibitors.
Assuming a 10% cost increase however, the use of the nitrification inhibitor at top
dressing would increase fertilisation costs by approximately 16 USD ha-1, requiring a
carbon price of 47 USD Mg CO2-1. These results indicate that the use of nitrification
inhibitors to decrease N2O emissions in subtropical Oxisols is not a profitable
practice unless heavily subsidised and therefore cannot be regarded as a feasible
strategy to support a sustainable intensification of these cropping systems.

Discussion and Conclusions
209
Legume phase in a cereal-based crop rotation
The introduction of legume crops in a cereal-based crop rotation offered the dual
advantage of reducing overall N2O emissions while reducing fertilisation inputs, and
therefore costs. The economic implications of introducing legumes in cereal cropping
systems can differ substantially and depend on the characteristics of the cropping
system (Bohlool et al., 1992; Campbell et al., 1992; Bell et al., 2012; Sadeghpour et
al., 2013; Kirkegaard et al., 2014). For example, the gross annual income of cereal
cropping systems incorporating a legume phase can be increased or decreased
compared to cereal monocultures depending on the legume crop (grain, forage or
tree), the length of the legume phase (mono- or multi-seasonal), the original cereal-
based cropping systems (mono- or double cereal cropping) and whether the legume
replaces a cereal crop, a fallow phase or is intercropped with the cereal.
Generalising the profitability of introducing a legume phase in a cereal cropping
system is not feasible given the large number of variables and the analysis presented
in this section focuses on the N management tested in this study. This economic
analysis assesses the introduction of a forage legume crop in a cereal-based crop
rotation and does not consider the implications of using more profitable legumes
crops, such as grain legumes. Importantly, this analysis does not cover the indirect
economic benefits provided by the presence of legumes in the crop rotation, such as
increased native soil fertility and disruption of pest and disease lifecycles, two factors
that significantly influence the long-term productivity of a cropping system (Giller
and Cadisch, 1995; Rochester et al., 2001).
In this study the winter legume ley pasture was green-manured and the
decomposition of the legume residues provided approximately 36 kg N ha-1 to the
subsequent summer cereal (Chapter 4.3.3). This N supply lowered the fertiliser N
requirements of the cereal crop to the levels necessary to reach maximum yield
potential. Specifically, this practice enabled a reduction in the applied fertiliser rate
by almost 80 kg urea ha-1 compared to a summer cereal not in rotation with a legume
pasture.
In a crop rotation where the summer cereal is preceded by a fallow phase (cereal
mono-cropping system), replacing the fallow phase with a legume pasture for green-
manuring would reduce the annual N fertilisation costs by 47 USD ha-1 and therefore

210
increase the annual net income. In the case where the legume pasture was harvested
for hay, the legume phase would generate a gross income of approximately 400 USD
ha-1 (assuming a legume hay price of 200 USD Mg-1 and an average hay yield of 2
Mg grain ha-1). Additionally, the incorporation of below ground biomass would
provide approximately 15 kg N ha-1, resulting in a fertiliser cost reduction of 20 USD
ha-1 during the following cereal crop. This practice would therefore increase the
annual net income by 390 USD ha-1 compared to a cereal mono-cropping system,
even while accounting for the additional costs due to the purchase of legume seeds,
machinery use and labour,
On the other hand, compared to a double cropping system (winter cereal-summer
cereal crop rotation), growing a legume pasture for green-manuring would preclude
the possibility of growing a winter cereal. Assuming a grain price of 230 USD Mg-1
(FAOSTAT website, accessed October 2014) for an average winter cereal yielding 5
Mg grain ha-1 (Table 3-3), replacing the winter cereal with a legume crop for green
manuring would lead to a net income reduction of circa 1150 USD ha-1 per annum.
In the case the legume pasture was harvested for hay, replacing the winter cereal with
a legume pasture would result in an overall income reduction of circa 730 USD ha-1,
indicating that under no hay management scenario replacing a cereal crop with a
forage legume can be a profitable option.
Introducing a legume crops in cereal crop rotations could potentially entitle
farmers to greenhouse gas emission credits since an extensive review by Jensen et al.
(2012) highlighted that N2O emissions during the legume growing season do not
differ substantially from unplanted or non-fertilised soils and are significantly lower
than during a fertilised winter cereal. The economic implications of this aspect in
terms of emissions trading are however not included here since no N2O
measurements were conducted during the legume pasture phase in this study.
Overall, this analysis highlights that the use of nitrification inhibitors cannot be
considered an economically feasible strategy to support cereal production while
limiting N2O emissions in subtropical Oxisols. Introducing a legume pasture phase in
a cereal crop rotation instead can be a profitable N management practice, but only
when adopted in a cereal mono-cropping system. This result is significant since

Discussion and Conclusions
211
cereal mono-cropping is a common practice in many subtropical regions, especially
in rainfed cropping systems (Peter and Runge-Metzger, 1994; Herrmann et al., 2014;
Wratten et al., 2014).
7.3 Recommendations for future research
This study showed that reducing nitrification rates in subtropical Oxisols does not
improve the agronomic efficiency of applied N fertiliser. On the other hand, the
introduction of a legume phase in a cereal-based crop rotation exhibited multiple
environmental and agronomic advantages, highlighting the importance of achieving
synchrony between soil N supply and the N demand of the following crop via the
incorporation of legume residues in a cereal-based crop rotation.
Conducted on one single Oxisol subclass and having tested only one type of
legume, a forage pasture, this research lays the foundation for further research to
investigate how synchrony with the subsequent cereal crop can be achieved in
different sub-classes of Oxisols. Importantly, such research needs to assess the
agronomic, economic and environmental implication of using diverse leguminous
corps (forages and grains) and cropping practices (crop rotations and intercropping)
to maximise food production and limit N2O emissions. In particular, efforts should
aim to identify which constituents of the legume tissues (e.g. lignin, polyphenols,
soluble C and N compounds) affect residue mineralisation, and therefore the N
release and its availability to plants and the soil microbial pool (Palm et al., 2001;
Bolger et al., 2003; Crews and Peoples, 2005). Research studies should
simultaneously investigate how mineralisation patterns during the post-harvest
period can be manipulated by choosing specific legume species or combining
different legume crops.
However, mineralisation patterns could be affected by site-specific environmental
conditions, while some crop varieties might not be fit for cultivation in certain
regions. Research will therefore need to address these constraints by developing
profitable grain or forage legume species optimised for different seasons, cropping
regions and climates. Such results will reduce the uncertainties involved in the use of
legumes as a source of N and provide subtropical farmers with a reliable N

212
management strategy to bolster cereal production while limiting N2O emission rates
from these agroecosystems.
Additionally, the economic analysis showed that in double cereal cropping
systems replacing a cereal with a non-edible legume crop (e.g. forage) can reduce the
overall food production and profit. Research is necessary therefore to address this
problem by investigating how grain legumes or legume management practices (crop
rotations and intercropping) can maximise food production while limiting N2O
emissions in these agroecosystems.
The model simulations conducted within this study suggested that N2 emissions in
subtropical Oxisols can be up to nine times higher than those of N2O. Future field
research should therefore aim to corroborate these findings by combining automated
greenhouse gas measuring systems and mass spectrometry techniques to precisely
measure N2 losses in these agroecosystems. Such results will further increase the
current understanding of N dynamics in subtropical Oxisols and determine the
influence of N2 emissions on the agronomic efficiency of the tested N management
strategies.
Finally, this study highlighted that simulated crop physiology is not optimal in
DAYCENT and that improvements are needed to correctly predict plant growth
dynamics under varying N stress conditions. Moreover, the data analysed in this
study suggest that algorithms regulating microbial activity and gas diffusivity of N2O
produced at different depths should be incorporated in the model. An enhanced
representation of soil microbial activity would also allow DAYCENT to reproduce
the decline in the DMPP inhibitory efficiency observed under winter conditions, so
to avoid the use of different inhibition factors for fertilizers applied to winter and
summer crops. Overall, the correction of these limitations would significantly
improve the potential of the model in assessing the environmental and agronomic
implications of different N management practices.

Discussion and Conclusions
213
7.4 Conclusions
This is the first study integrating high temporal frequency N2O measurements,
fertiliser N recovery observations, and model simulations to assess the environmental
and agronomic implications of using urea coated with the DMPP nitrification
inhibitor and reintroducing legumes in crop rotations. The results indicate that the
chances of significant N losses in subtropical agroecosystems in Oxisols are limited
by the moderate permeability and relatively low C content of these soils.
Significantly, there is scope to improve the REfN and reduce N2O emissions from
these cropping systems, especially in summer. The high N fertiliser rates usually
applied to summer crops, associated with the hot and humid conditions of this
season, can indeed lead to periods of temporary asynchrony between fertiliser N
supply and crop capacity to use it. As a result, nitrification and denitrification rates in
summer can be up to fivefold those occurring in winter. Strategies to secure
subtropical cereal production without increasing N2O emissions should therefore
focus on N fertiliser management strategies for summer crops.
DMPP was effective in delaying nitrification in the top soil, reducing N2O losses
via nitrification and denitrification. Given the chemo-physical characteristics of the
soil however, DMPP had no scope for improving the fertiliser N recovery in the crop
and therefore did not increase grain yields. The lack of yield increase and the higher
cost of urea coated with nitrification inhibitors reduce the profitability of this
fertilisation practice, highlighting that the use of nitrification inhibitors cannot be
regarded as an economically viable N management strategy for the sustainable
intensification of subtropical cereal cropping systems.
Soil properties and fertiliser N rates were the main factors influencing fertiliser N
recovery in the soil-plant system. The lower N recoveries observed in crops when
elevated amounts of synthetic N were applied indicate that limiting N rates in
Oxisols is the most efficient strategy to increase the recovery efficiency of fertiliser
N in the crop (REfN) and therefore reduce the amount of soil N available to nitrifying
and denitrifying microorganisms.
Introducing legumes in cereal-based crop rotations decreases the reliance of the
cereal crop phase on N fertiliser. When synchronisation with the cereal N demand is

214
achieved, the mineralisation of legume residues can provide sufficient N to support
crop development during the early stages of crop development, limiting fertiliser N
requirement to the amounts necessary to attain maximum yield potential. This
strategy reduces the chances of high amounts of mineral N to accumulate in the top
soil and therefore lowers N2O emissions due to fertiliser application. Conditions can
however be highly conducive for elevated N2O emissions when a soil is left fallow
after the incorporation of fresh legume residues. The most viable strategy for
reducing N2O emissions after the termination of the legume phase and maximising
the synchronicity between residue mineralisation and the cereal N demand is
therefore to minimise the amount of time between incorporating the residue and
planting the subsequent crop.
Reducing the fertiliser N input required by cereals in rotation with legumes
provides greater flexibility for the farmers in terms of timing and rate of fertiliser
application, especially in rainfed cropping systems. This strategy enables the famer
to modulate the synthetic N input depending on seasonal weather conditions and
reduces investment in fertiliser N at the beginning of the cropping season. This
aspect is particularly significant since during the early stages of the cropping season
it is not possible to predict the in-season rainfall patterns, resulting in the
impossibility to determine the chances for the crop to efficiently adsorb the synthetic
N applied. Critically, replacing part of the N requirements of the cereal crop with the
N supplied by legume residues decreases overall fertiliser costs and can increase
annual profits when adopted in a cereal mono-cropping system.
Introducing legumes in cereal-based cropping systems is the most agronomically
viable and environmentally sustainable N management strategy to support future
intensification of subtropical cereal production in Oxisols. Importantly, this strategy
can be widely adopted in subtropical regions since it is economically accessible,
requires little know-how transfer and technology investment, and can be profitable in
both low- and high-input cropping systems.

215
Bibliography
Abalos, D., Jeffery, S., Sanz-Cobena, A., Guardia, G., Vallejo, A., 2014. Meta-analysis of the effect of urease and nitrification inhibitors on crop productivity and nitrogen use efficiency. Agriculture, Ecosystems & Environment 189, 136-144.
Abdalla, M., Jones, M., Yeluripati, J., Smith, P., Burke, J., Williams, M., 2010. Testing DayCent and DNDC model simulations of N2O fluxes and assessing the impacts of climate change on the gas flux and biomass production from a humid pasture. Atmospheric Environment 44, 2961-2970.
AgMIP website, Available at: http://www.agmip.org/.
Alexandratos, N., 2009. World food and agriculture to 2030/50: Highlights and views from mid-2009. Proceedings of the Expert Meeting on How to Feed the World in 2050 24-26 June 2009, FAO Headquarters, Rome
Alexandratos, N., Bruinsma, J., 2012. World agriculture towards 2030/2050: The 2012 revision. ESA Working paper Rome, FAO.
Anderson, E.L., 1988. Tillage and N fertilization effects on maize root growth and root:shoot ratio. Plant and Soil 108, 245-251.
Angus, J.F., 2001. Nitrogen supply and demand in Australian agriculture. Australian Journal of Experimental Agriculture 41, 277-288.
Arregui, L.M., Quemada, M., 2006. Drainage and nitrate leaching in a crop rotation under different N-fertilizer strategies: Application of capacitance probes. Plant and Soil 288, 57-69.
Asseng, S., Keating, B.A., Fillery, I.R.P., Gregory, P.J., Bowden, J.W., Turner, N.C., Palta, J.A., Abrecht, D.G., 1998. Performance of the APSIM-wheat model in Western Australia. Field Crops Research 57, 163-179.
Aulakh, M.S., Khera, T.S., Doran, J.W., Bronson, K.F., 2001. Managing crop residue with green manure, urea, and tillage in a rice–wheat rotation. Soil Sci. Soc. Am. J. 65, 820-827.
Australian Bureau of Meteorology website, Available at: http://www.bom.gov.au/climate/dwo/IDCJDW4069.latest.shtml
Australian National Greenhouse Accounts, 2010. National inventory report 2010. Department of Climate Change and Energy Efficiency 1.

216
Baggs, E.M., Rees, R.M., Smith, K.A., Vinten, A.J.A., 2000. Nitrous oxide emission from soils after incorporating crop residues. Soil Use and Management 16, 82-87.
Baggs, E.M., Stevenson, M., Pihlatie, M., Regar, A., Cook, H., Cadisch, G., 2003. Nitrous oxide emissions following application of residues and fertiliser under zero and conventional tillage. Plant and Soil 254, 361-370.
Barker, T., Bashmakov, I., Bernstein, L., Bogner, J.E., Bosch, P.R., Dave, R., Davidson, O.R., Fisher, B.S., Gupta, S., Halsnæs, K., Heij, G.J., Kahn Ribeiro, S., Kobayashi, S., Levine, M.D., Martino, D.L., Masera, O., Metz, B., Meyer, L.A., Nabuurs, G.-J., Najam, A., Nakicenovic, N., Rogner, H.-H., Roy, J., Sathaye, J., Schock, R., Shukla, P., Sims, R.E.H., Smith, P., Tirpak, D.A., Urge-Vorsatz, D., Zhou, D., 2007. Technical Summary. Climate Change 2007: Mitigation. Contribution of Working Group III to the Fourth Assessment Report of the Intergovernmental Panel on Climate Change [B. Metz, O. R. Davidson, P. R. Bosch, R. Dave, L. A. Meyer (eds)], Cambridge University Press, Cambridge, United Kingdom and New York, NY, USA.
Barth, G., von Tucher, S., Schmidhalter, U., 2001. Influence of soil parameters on the effect of 3,4-dimethylpyrazole-phosphate as a nitrification inhibitor. Biol Fertil Soils 34, 98-102.
Barton, L., Butterbach-Bahl, K., Kiese, R., Murphy, D.V., 2011. Nitrous oxide fluxes from a grain–legume crop (narrow-leafed lupin) grown in a semiarid climate. Global Change Biology 17, 1153-1166.
Barton, L., Kiese, R., Gatter, D., Butterbach-Bahl, Klaus, B., Renee Hinz, C., Murphy, D.V., 2008. Nitrous oxide emissions from a cropped soil in a semi-arid climate. Global Change Biology 14, 177-192.
Basso, B., Cammarano, D., Troccoli, A., Chen, D., Ritchie, J.T., 2010. Long-term wheat response to nitrogen in a rainfed Mediterranean environment: Field data and simulation analysis. European Journal of Agronomy 33, 132-138.
Becker, M., Ladha, J., 1997. Synchronizing residue N mineralization with rice N demand in flooded conditions. Driven by nature: plant litter quality and decomposition 1997.
Belford, R.K., Klepper, B., Rickman, R.W., 1986. Studies of intact shoot-root systems of field-grown winter wheat. 2. Root and shoot developemnt pattern as related to nitrogen-fertilizer. Agronomy journal. 79 310-319.
Bell, M., Harch, G., Moody, P., 2012. Diversification from cropping into mixed crop-livestock systems–the sustainability risks posed by hay removal from pasture or forage blocks. Proceedings of 16th Agronomy Conference 2012 18, 75.
Bell, M.J., Harch, G.R., Bridge, B.J., 1995. Effects of continuous cultivation on Ferrosols in subtropical southeast Queensland. I. Site characterization, crop yields and soil chemical status. Australian Journal of Agricultural Research 46, 237-253.

Appendices
217
Bhatia, A., Sasmal, S., Jain, N., Pathak, H., Kumar, R., Singh, A., 2010. Mitigating nitrous oxide emission from soil under conventional and no-tillage in wheat using nitrification inhibitors. Agriculture, Ecosystems & Environment 136, 247-253.
Binder, D.L., Sander, D.H., Walters, D.T., 2000. Maize response to time of nitrogen application as affected by level of nitrogen deficiency. Agron. J. 92, 1228-1236.
Birch, H.F., 1958. The effect of soil drying on humus decomposition and nitrogen availability. Plant and Soil 10, 9-31.
Blesh, J., Drinkwater, L.E., 2014. Retention of 15N-labeled fertilizer in an Illinois prairie soil with winter rye. Soil Sci. Soc. Am. J. 78, 496-508.
Bohlool, B.B., Ladha, J.K., Garrity, D.P., George, T., 1992. Biological nitrogen fixation for sustainable agriculture: A perspective. In: Ladha, J.K., George, T., Bohlool, B.B. (Eds.), Biological Nitrogen Fixation for Sustainable Agriculture. Springer Netherlands, pp. 1-11.
Bolger, T.P., Angus, J.F., Peoples, M.B., 2003. Comparison of nitrogen mineralisation patterns from root residues of Trifolium subterraneum and Medicago sativa. Biol Fertil Soils 38, 296-300.
Bollmann, A., Conrad, R., 1998. Influence of O2 availability on NO and N2O release by nitrification and denitrification in soils. Global Change Biology 4, 387-396.
Boote, K.J., Jones, J.W., Pickering, N.B., 1996. Potential uses and limitations of crop models. Agronomy Journal 88, 704-716.
Borlaug, N.E., Dowswell, C.R., 1997. The acid lands: One of agriculture’s last frontiers. Plant-Soil Interactions at Low pH. Brazil: Brazilian Soil Science Society, 5-15.
Bouwman, A.F., 1990. Exchange of greenhouse gases between terrestrial ecosystems and the atmosphere. Soils and the greenhouse effect, 61-127.
Bouwman, A.F., 1998a. Environmental science: Nitrogen oxides and tropical agriculture. NATURE 392, 866-867.
Bouwman, A.F., 1998b. Nitrogen oxides and tropical agriculture. Nature 392, 866-867.
Bouwman, A.F., Boumans, L.J.M., Batjes, N.H., 2002a. Emissions of N2O and NO from fertilized fields: Summary of available measurement data. Global Biogeochemical Cycles 16, 1058.
Bouwman, A.F., Boumans, L.J.M., Batjes, N.H., 2002b. Modeling global annual N2O and NO emissions from fertilized fields. Global Biogeochemical Cycles 16, 1080.

218
Box, G.E.P., Pierce, D.A., 1970. Distribution of residual autocorrelations in autoregressive-integrated moving average time series models. Journal of the American Statistical Association 65, 1509-1526.
Branca, G., Lipper, L., McCarthy, N., Jolejole, M., 2013. Food security, climate change, and sustainable land management. A review. Agron. Sustain. Dev. 33, 635-650.
Branca, G., McCarthy, N., Lipper, L., Jolejole, M.C., 2011. Climate smart agriculture: A synthesis of empirical evidence of food security and mitigation benefits from improved cropland management. Mitigation of Climate Change in Agriculture Series 3.
Bremner, J., 1997. Sources of nitrous oxide in soils. Nutrient Cycling in Agroecosystems 49, 7-16.
Bremner, J.M., 1965. Nitrogen Availability Indexes. In: Norman, A.G. (Ed.), Methods of Soil Analysis. Part 2. Chemical and Microbiological Properties. American Society of Agronomy, Soil Science Society of America, pp. 1324-1345.
Breuer, L., Papen, H., Butterbach-Bahl, K., 2000. N2O emission from tropical forest soils of Australia. J. Geophys. Res. 105, 26353-26367.
Bronson, K.F., Fillery, I.R.P., 1998. Fate of nitrogen-15-labelled urea applied to wheat on a waterlogged texture-contrast soil. Nutrient Cycling in Agroecosystems 51, 175-183.
Brozyna, M.A., Petersen, S.O., Chirinda, N., Olesen, J.E., 2013. Effects of grass-clover management and cover crops on nitrogen cycling and nitrous oxide emissions in a stockless organic crop rotation. Agriculture, Ecosystems & Environment 181, 115-126.
Bruulsema, T.W., Witt, C., García, F., Li, S., Rao, T.N., Chen, F., Ivanova, S., 2011. A global framework for fertilizer BMPs. Icon.
Buol, S.W., Eswaran, H., 1999. Oxisols. Advances in Agronomy 68, 151-195.
Bushby, H.V.A., Lawn, R.J., 1992. Accumulation and partitioning of nitrogen and dry matter by contrasting genotypes of mungbean (Vigna radiata (L.) Wilczek). Australian Journal of Agricultural Research 43, 1609-1628.
Butterbach-Bahl, K., Baggs, E.M., Dannenmann, M., Kiese, R., Zechmeister-Boltenstern, S., 2013. Nitrous oxide emissions from soils: How well do we understand the processes and their controls? Philosophical Transactions of the Royal Society B: Biological Sciences 368.
Cai, G.X., Chen, D.L., Ding, H., Pacholski, A., Fan, X.H., Zhu, Z.L., 2002a. Nitrogen losses from fertilizers applied to maize, wheat and rice in the North China Plain. Nutrient Cycling in Agroecosystems 63, 187-195.
Appendices
219
Cai, G.X., White, R.E., Chen, D., Fan, X.H., Pacholski, A., Zhu, Z.L., Ding, H., 2002b. Gaseous nitrogen losses from urea applied to maize on a calcareous fluvo-aquic soil in the North China Plain. Soil Research 40, 737-748.
Cai, Y., Ding, W., Luo, J., 2013. Nitrous oxide emissions from Chinese maize–wheat rotation systems: A 3-year field measurement. Atmospheric Environment 65, 112-122.
Calegari, A., Hargrove, W., Rheinheimer, D.D.S., Ralisch, R., Tessier, D., de Tourdonnet, S., de Fatima Guimarães, M., 2008. Impact of long-term no-tillage and cropping system management on soil organic carbon in an Oxisol: A model for sustainability. Agronomy Journal 100, 1013-1019.
Campbell, C.A., Zentner, R.P., Selles, F., Biederbeck, V.O., Leyshon, A.J., 1992. Comparative effects of grain lentil–wheat and monoculture wheat on crop production, N economy and N fertility in a Brown Chernozem. Canadian Journal of Plant Science 72, 1091-1107.
Carter, M.R., Gregorich, E.G., 2007. Soil sampling and methods of analysis, Second edition. CRC Press.
Chapuis-Lardy, L., Wrage, N., Metay, A., Chotte, J.-L., Bernoux, M., 2007. Soils, a sink for N2O? A review. Global Change Biology 13, 1-17.
Chaves, B., Opoku, A., De Neve, S., Boeckx, P., Van Cleemput, O., Hofman, G., 2006. Influence of DCD and DMPP on soil N dynamics after incorporation of vegetable crop residues. Biol Fertil Soils 43, 62-68.
Chen, D., Li, Y., Grace, P.R., Mosier, A.R., 2008a. N2O emissions from agricultural lands: a synthesis of simulation approaches. Plant and Soil 309, 169-189.
Chen, D., Suter, H., Islam, A., Edis, R., Freney, J.R., Walker, C.N., 2008b. Prospects of improving efficiency of fertiliser nitrogen in Australian agriculture: A review of enhanced efficiency fertilisers. Soil Research 46, 289-301.
Chen, D., Suter, H.C., Islam, A., Edis, R., 2010. Influence of nitrification inhibitors on nitrification and nitrous oxide (N2O) emission from a clay loam soil fertilized with urea. Soil Biology and Biochemistry 42, 660-664.
Cheru, F., Modi, R., 2013. Agricultural development and food security in Africa: The impact of Chinese, Indian and Brazilian investments. Zed Books, London.
Christensen, J.H., Krishna Kumar, K., Aldrian, E., An, S.-I., Cavalcanti, I.F.A., de Castro, M., Dong, W., Goswami, P., Hall, A., Kanyanga, J.K., Kitoh, A., Kossin, J., Lau, N.-C., Renwick, J., Stephenson, D.B., Xie, S.-P., Zhou, T., 2013. Climate phenomena and their relevance for future regional climate change. Climate Change 2013: The Physical Science Basis. Contribution of Working Group I to the Fifth Assessment Report of the Intergovernmental Panel on Climate Change [Stocker, T.F., D. Qin, G.-K. Plattner, M. Tignor, S.K. Allen, J. Boschung, A. Nauels, Y. Xia, V. Bex and P.M. Midgley (eds.)]. Cambridge University Press, Cambridge, United Kingdom and New York, NY, USA.
220
Christensen, S., 1983. Nitrous oxide emission from a soil under permanent grass: seasonal and diurnal fluctuations as influenced by manuring and fertilization. Soil Biology and Biochemistry 15, 531-536.
Conrad, R., 1996. Soil microorganisms as controllers of atmospheric trace gases (H2, CO, CH4, OCS, N2O, and NO). Microbiological reviews 60, 609-640.
Conrad, R., 2001. Evaluation of data on the turnover of NO and N2O by oxidative versus reductive microbial processes in different soils. PHYTON-HORN- 41, 61-72.
Crawford, E., Kelly, V., Jayne, T.S., Howard, J., 2003. Input use and market development in Sub-Saharan Africa: An overview. Food Policy 28, 277-292.
Crews, T.E., Peoples, M.B., 2004. Legume versus fertilizer sources of nitrogen: Ecological tradeoffs and human needs. Agriculture, Ecosystems & Environment 102, 279-297.
Crews, T.E., Peoples, M.B., 2005. Can the synchrony of nitrogen supply and crop demand be improved in legume and fertilizer-based agroecosystems? A Review. Nutrient Cycling in Agroecosystems 72, 101-120.
Crutzen, P.J., 1981. Atmospheric chemical processes of theoxides of nitrogen including nitrous oxide. Denitrification, Nitrification and Atmospheric Nitrous Oxide. Delwiche, C.C. (Ed.), Wiley, New York, 17-44.
Cubasch, U., Dai, X., Ding, Y., Griggs, D.J., Hewitson, B., Houghton, J.T., Isaksen, I., Karl, T., McFarland, M., Meleshko, V.P., Mitchell, J.F.B., Noguer, M., Nyenzi, B.S., Oppenheimer, M., Penner, J.E., Pollonais, S., Stocker, T., Trenberth, K.E., 2001. Technical summary. Climate Change 2001: The Scientific Basis. Contribution of Working Group I to the Third Assessment Report of the Intergovernmental Panel on Climate Change [Houghton, J.T.,Y. Ding, D.J. Griggs, M. Noguer, P.J. van der Linden, X. Dai, K. Maskell, and C.A. Johnson (eds.)]. Cambridge University Press, Cambridge, United Kingdom and New York, NY, USA.
Cubasch, U., Wuebbles, D., Chen, D., Facchini, M.C., Frame, D., Mahowald, N., J.-G., W., 2013. Introduction. Climate Change 2013: The Physical Science Basis. Contribution of Working Group I to the Fifth Assessment Report of the Intergovernmental Panel on Climate Change [Stocker, T.F., D. Qin, G.-K. Plattner, M. Tignor, S.K. Allen, J. Boschung, A. Nauels, Y. Xia, V. Bex and P.M. Midgley (eds.)]. Cambridge University Press, Cambridge, United Kingdom and New York, NY, USA.
Dalal, R.C., Mayer, R.J., 1986. Long term trends in fertility of soils under continuous cultivation and cereal cropping in southern Queensland .V. Rate of loss of total nitrogen from the soil profile and changes in carbon : nitrogen ratios. Soil Research 24, 493-504.
Dalal, R.C., Wang, W., Robertson, G.P., Parton, W.J., 2003. Nitrous oxide emission from Australian agricultural lands and mitigation options: A review. Soil Research 41, 165-195.

Appendices
221
Dannenmann, M., Butterbach-Bahl, K., Gasche, R., Willibald, G., Papen, H., 2008. Dinitrogen emissions and the N2:N2O emission ratio of a Rendzic Leptosol as influenced by pH and forest thinning. Soil Biology and Biochemistry 40, 2317-2323.
De Antoni Migliorati, M., Bell, M., Grace, P.R., Scheer, C., Rowlings, D.W., Liu, S., 2015. Legume pastures can reduce N2O emissions intensity in subtropical cereal cropping systems. Agriculture, Ecosystems & Environment 204, 27-39.
De Antoni Migliorati, M., Scheer, C., Grace, P.R., Rowlings, D.W., Bell, M., McGree, J., 2014. Influence of different nitrogen rates and DMPP nitrification inhibitor on annual N2O emissions from a subtropical wheat–maize cropping system. Agriculture, Ecosystems & Environment 186, 33-43.
De Klein, C., Novoa, R.S.A., Ogle, S., Smith, K.A., Rochette, P., Wirth, T.W., 2006. N2O emissions from managed soils, and CO2 emissions from lime and urea application. 2006 IPCC Guidelines for National Greenhouse Gas Inventories, Volume 4, Agriculture, Forestry and Other Land Use [Eggleston H.S., Buendia L., Miwa K., Ngara T. and Tanabe K. (eds.)]. IGES, Japan.
De Wever, H., Mussen, S., Merckx, R., 2002. Dynamics of trace gas production following compost and NO3
− amendments to soil at different initial TOC/NO3−
ratios. Soil Biology and Biochemistry 34, 1583-1591.
Del Grosso, S.J., Halvorson, A.D., Parton, W.J., 2008. Testing DAYCENT model simulations of corn yields and nitrous oxide emissions in irrigated tillage systems in Colorado. Journal of Environmental Quality 37, 1383-1389.
Del Grosso, S.J., Mosier, A.R., Parton, W.J., Ojima, D.S., 2005. DAYCENT model analysis of past and contemporary soil N2O and net greenhouse gas flux for major crops in the USA. Soil and Tillage Research 83, 9-24.
Del Grosso, S.J., Ojima, D., Parton, W., Mosier, A.R., Peterson, G., Schimel, D., 2002. Simulated effects of dryland cropping intensification on soil organic matter and greenhouse gas exchanges using the DAYCENT ecosystem model. Environmental Pollution 116, S75-S83.
Del Grosso, S.J., Ojima, D.S., Parton, W.J., Stehfest, E., Heistemann, M., DeAngelo, B., Rose, S., 2009. Global scale DAYCENT model analysis of greenhouse gas emissions and mitigation strategies for cropped soils. Global and Planetary Change 67, 44-50.
Del Grosso, S.J., Parton, W.J., Keough, C.A., Reyes-Fox, M., 2011. Special features of the DayCent modeling package and additional procedures for parameterization, calibration, validation, and applications. In: Ahuja, L.R., Ma, L. (Eds.), Methods of Introducing System Models into Agricultural Research. American Society of Agronomy, Crop Science Society of America, Soil Science Society of America, pp. 155-176.
Del Grosso, S.J., Parton, W.J., Mosier, A.R., Hartman, M.D., Brenner, J., Ojima, D.S., Schimel, D.S., 2001. Simulated interaction of carbon dynamics and

222
nitrogen trace gas fluxes using the DAYCENT model. Modeling carbon and nitrogen dynamics for soil management, 303-332.
Del Grosso, S.J., Parton, W.J., Mosier, A.R., Ojima, D.S., Kulmala, A.E., Phongpan, S., 2000. General model for N2O and N2 gas emissions from soils due to dentrification. Global Biogeochemical Cycles 14, 1045-1060.
Del Grosso, S.J., Parton, W.J., Mosier, A.R., Walsh, M., Ojirna, D., Thornton, P., 2006. DAYCENT national-scale simulations of nitrous oxide emissions from cropped soils in the United States. Journal of Environmental Quality 35, 1451-1460.
Del Grosso, S.J., Parton, W. J., Mosier, A. R., Walsh, M. K., & et al., 2006. DAYCENT National-Scale Simulations of Nitrous Oxide Emissions from Cropped Soils in the United States. Journal of Environmental Quality 35, 1451-1461.
Demotes-Mainard, S., Pellerin, S., 1992. Effect of mutual shading on the emergence of nodal roots and the root/shoot ratio of maize. Plant and Soil 147, 87-93.
Dendooven, L., Anderson, J.M., 1994. Dynamics of reduction enzymes involved in the denitrification process in pasture soil. Soil Biology and Biochemistry 26, 1501-1506.
Denmead, O.T., 1979. Chamber systems for measuring nitrous oxide emission from soils in the field. Soil Sci. Soc. Am. J. 43, 89-95.
Denning, G., Kabambe, P., Sanchez, P., Malik, A., Flor, R., Harawa, R., Nkhoma, P., Zamba, C., Banda, C., Magombo, C., Keating, M., Wangila, J., Sachs, J., 2009. Input subsidies to improve smallholder maize productivity in Malawi: Toward an African Green Revolution. PLoS Biol 7, e1000023.
Di, H.J., Cameron, K.C., 2005. Reducing environmental impacts of agriculture by using a fine particle suspension nitrification inhibitor to decrease nitrate leaching from grazed pastures. Agriculture, Ecosystems & Environment 109, 202-212.
Díez López, J.A., Hernaiz, P., 2008. Effect of a nitrification inhibitor (DMPP)[3, 4-dimethylpyrazole phosphate] on nitrate leaching and maize yield during two growing seasons. Spanish Journal of Agricultural Research 6, 294-303.
Ding, W., Cai, Y., Cai, Z., Yagi, K., Zheng, X., 2007. Nitrous oxide emissions from an intensively cultivated maize–wheat rotation soil in the North China Plain. Science of The Total Environment 373, 501-511.
Dobermann, A., Cassman, K.G., 2002. Plant nutrient management for enhanced productivity in intensive grain production systems of the United States and Asia. Plant and Soil 247, 153-175.
Dourado-Neto, D., Powlson, D., Bakar, R.A., Bacchi, O.O.S., Basanta, M.V., Cong, P.t., Keerthisinghe, G., Ismaili, M., Rahman, S.M., Reichardt, K., Safwat, M.S.A., Sangakkara, R., Timm, L.C., Wang, J.Y., Zagal, E., van Kessel, C.,

Appendices
223
2010. Multiseason recoveries of organic and inorganic nitrogen-15 in tropical cropping systems. Soil Sci. Soc. Am. J. 74, 139-152.
Drury, C.F., Yang, X.M., Reynolds, W.D., McLaughlin, N.B., 2008. Nitrous oxide and carbon dioxide emissions from monoculture and rotational cropping of corn, soybean and winter wheat. Canadian Journal of Soil Science 88, 163-174.
Eagle, A.J., Olander, L.P., Henry, L.R., Haugen-Kozyra, K., Millar, N., Robertson, G.P., 2012. Greenhouse gas mitigation potential of agricultural land management in the United States: A synthesis of the literature (Third Edition). Durham, NC: Nicholas Institute for Environmental Policy Solutions, Duke University.
Ehhalt, D., Prather, M., Dentener, F., Derwent, R., Dlugokencky, E., Holland, E., Isaksen, I., Katima, J., Kirchhoff, V., Matson, P., Midgley, P., Wang, M., 2001. Atmospheric chemistry and greenhouse gases. Climate Change 2001: The Scientific Basis. Contribution of Working Group I to the Third Assessment Report of the Intergovernmental Panel on Climate Change [Houghton, J.T.,Y. Ding, D.J. Griggs, M. Noguer, P.J. van der Linden, X. Dai, K. Maskell, and C.A. Johnson (eds.)]. Cambridge University Press, Cambridge, United Kingdom and New York, NY, USA, pp. 239–287.
Elmi, A.A., Madramootoo, C., Hamel, C., Liu, A., 2003. Denitrification and nitrous oxide to nitrous oxide plus dinitrogen ratios in the soil profile under three tillage systems. Biol Fertil Soils 38, 340-348.
Emerich, D.W., Krishnan, H., 2009. The potential environmental benefits and risks derived from legumes in rotations. Oceania 4, 1.
Ericksen, P., Thornton, P., Notenbaert, A., Cramer, L., Jones, P., Herrero, M., 2011. Mapping hotspots of climate change and food insecurity in the global tropics.
Fageria, N.K., Baligar, V.C., 1995. Response of lowland rice and common bean grown in rotation to soil fertility levels on a Varzea soil. Fertilizer Research 45, 13-20.
Fageria, N.K., Baligar, V.C., 2001. Improving nutrient use efficiency of annual crops in Brazilian acid soils for sustainable crop production. Communications in Soil Science and Plant Analysis 32, 1303-1319.
Fageria, N.K., Baligar, V.C., 2008. Ameliorating soil acidity of tropical Oxisols by liming for sustainable crop production. Advances in agronomy 99, 345-399.
FAO, 1998. World reference base for soil resources. World soil resources reports 84, 21-22.
FAO, 2001. Global estimates of gaseous emissions of NH3, NO and N2O from agricultural land. International Fertilizer Industry Association (IFA), Paris, France, Food and Agriculture Organization of the United Nations.
FAO, 2009. How to feed the World in 2050. Proceedings of the Expert Meeting on How to Feed the World in 2050, 24-26 June 2009, FAO Headquarters, Rome

224
FAO, 2010. Sustainable crop production intensification through an ecosystem approach and an enabling environment: Capturing efficiency through ecosystem services and management. FAO Committee on Agriculture, June 16-19 2010.
FAO, 2012. Fao statistical yearbook 2012. Food and Agriculture Organization of the United Nations, Rome
FAOSTAT website, accessed October 2014. FAOSTAT database, Food and Agriculture Organization of the United Nations. Available at: http://faostat.fao.org/.
Fernandes Cruvinel, Ê.B., Bustamante, M.M.d.C., Kozovits, A.R., Zepp, R.G., 2011. Soil emissions of NO, N2O and CO2 from croplands in the savanna region of central Brazil. Agriculture, Ecosystems & Environment 144, 29-40.
Fillery, I.R.P., 2001. The fate of biologically fixed nitrogen in legume-based dryland farming systems: a review. Animal Production Science 41, 361-381.
Firestone, M.K., and E.A. Davidson., 1989. Microbiological basis of NO and N2O production and consumption in soils. Exchanges of Trace Gases Between Terrestrial Ecosystems and the Atmosphere (Eds M.O. Andreae and D.S. Schimel). New York: John Wiley & Sons.
Fischer, T., 2009. Brazilian Cerrado: current status and prospects as a food bowl for the world. Agricultural Science 21, 32.
Foley, J.A., Ramankutty, N., Brauman, K.A., Cassidy, E.S., Gerber, J.S., Johnston, M., Mueller, N.D., O’Connell, C., Ray, D.K., West, P.C., 2011. Solutions for a cultivated planet. Nature 478, 337-342.
Forster, P., Ramaswamy, V., Artaxo, P., Berntsen, T., Betts, R., Fahey, D.W., Haywood, J., Lean, J., Lowe, D.C., Myhre, G., Nganga, J., Prinn, R., Raga, G., Schulz, M., Van Dorland, R., 2007. Changes in atmospheric constituents and in radiative forcing. In: Climate Change 2007: The Physical Science Basis. Contribution of Working Group I to the Fourth Assessment Report of the Intergovernmental Panel on Climate Change [Solomon, S., D. Qin, M. Manning, Z. Chen, M. Marquis, K.B. Averyt, M.Tignor and H.L. Miller (eds.)]. Cambridge University Press, Cambridge, United Kingdom and New York, NY, USA.
Fox, R.H., Myers, R.J.K., Vallis, I., 1990. The nitrogen mineralization rate of legume residues in soil as influenced by their polyphenol, lignin, and nitrogen contents. Plant and Soil 129, 251-259.
Freney, J.R., Chen, D.L., Mosier, A.R., Rochester, I.J., Constable, G.A., Chalk, P.M., 1993. Use of nitrification inhibitors to increase fertilizer nitrogen recovery and lint yield in irrigated cotton. Fertilizer Research 34, 37-44.
Frolking, S.E., Mosier, A.R., Ojima, D.S., Li, C., Parton, W.J., Potter, C.S., Priesack, E., Stenger, R., Haberbosch, C., Dörsch, P., Flessa, H., Smith, K.A., 1998. Comparison of N2O emissions from soils at three temperate agricultural sites:

Appendices
225
Simulations of year-round measurements by four models. Nutrient Cycling in Agroecosystems 52, 77-105.
Giller, K.E., Cadisch, G., 1995. Future benefits from biological nitrogen fixation: An ecological approach to agriculture. Plant and Soil 174, 255-277.
Giltrap, D.L., Li, C., Saggar, S., 2010. DNDC: A process-based model of greenhouse gas fluxes from agricultural soils. Agriculture, Ecosystems & Environment 136, 292-300.
Gitti, D.d.C., Arf, O., Melero, M., Rodrigues, R.A.F., Tarsitano, M.A.A., 2012. Influence of nitrogen fertilization and green manure on the economic feasibility of no-tilled wheat in the Cerrado. Revista Ceres 59, 246-253.
Global Research Alliance Modeling Platform, Available at: http://gramp.org.uk/models/.
Godfray, H.C.J., Beddington, J.R., Crute, I.R., Haddad, L., Lawrence, D., Muir, J.F., Pretty, J., Robinson, S., Thomas, S.M., Toulmin, C., 2010. Food security: The challenge of feeding 9 billion people. science 327, 812-818.
Gomes, J., Bayer, C., de Souza Costa, F., de Cássia Piccolo, M., Zanatta, J.A., Vieira, F.C.B., Six, J., 2009. Soil nitrous oxide emissions in long-term cover crops-based rotations under subtropical climate. Soil and Tillage Research 106, 36-44.
Goulding, K., 2004. Pathways and losses of fertilizer nitrogen at different scales. Agriculture and the Nitrogen Cycle, 209-219.
Grace, P.R., Robertson, G.P., Millar, N., Colunga-Garcia, M., Basso, B., Gage, S.H., Hoben, J., 2011. The contribution of maize cropping in the Midwest USA to global warming: A regional estimate. Agricultural Systems 104, 292-296.
Granli, T., Bøckman, O.C., 1995. Nitrous oxide (N2O) emissions from soils in warm climates. Nutrient Cycling in Agroecosystems 42, 159-163.
Granli, T., BØckman, O.C., 1995. Nitrous oxide emissions from soils in warm climates. Fertilizer Research 42, 159-163.
Halvorson, A.D., Del Grosso, S.J., Reule, C.A., 2008. Nitrogen, tillage, and crop rotation effects on nitrous oxide emissions from irrigated cropping systems. Journal of Environmental Quality 37, 1337-1344.
Hammer, G.L., van Oosterom, E., McLean, G., Chapman, S.C., Broad, I., Harland, P., Muchow, R.C., 2010. Adapting APSIM to model the physiology and genetics of complex adaptive traits in field crops. Journal of Experimental Botany.
Hartmann, D.L., Klein Tank, A.M.G., Rusticucci, M., Alexander, L.V., Brönnimann, S., Charabi, Y., Dentener, F.J., Dlugokencky, E.J., Easterling, D.R., Kaplan, A., Soden, B.J., M., W., M., Z.P., 2013. Observations: Atmosphere and Surface. Climate Change 2013: The Physical Science Basis. Contribution of

226
Working Group I to the Fifth Assessment Report of the Intergovernmental Panel on Climate Change [Stocker, T.F., D. Qin, G.-K. Plattner, M. Tignor, S.K. Allen, J. Boschung, A. Nauels, Y. Xia, V. Bex and P.M. Midgley (eds.)]. Cambridge University Press, Cambridge, United Kingdom and New York, NY, USA.
Hatch, D., Trindade, H., Cardenas, L., Carneiro, J., Hawkins, J., Scholefield, D., Chadwick, D., 2005. Laboratory study of the effects of two nitrification inhibitors on greenhouse gas emissions from a slurry-treated arable soil: impact of diurnal temperature cycle. Biol Fertil Soils 41, 225-232.
Hensen, A., Skiba, U., Famulari, D., 2013. Low cost and state of the art methods to measure nitrous oxide emissions. Environmental Research Letters 8, 025022.
Herrmann, L., Chotte, J.L., Thuita, M., Lesueur, D., 2014. Effects of cropping systems, maize residues application and N fertilization on promiscuous soybean yields and diversity of native rhizobia in Central Kenya. Pedobiologia 57, 75-85.
Hoben, J.P., Gehl, R.J., Millar, N., Grace, P.R., Robertson, G.P., 2011. Nonlinear nitrous oxide (N2O) response to nitrogen fertilizer in on-farm corn crops of the US Midwest. Global Change Biology 17, 1140-1152.
Hoffmann, U., UNCTAD secretariat, 2013. Agriculture at the crossroads: Assuring food security in developing countries under the challenge of global warming. Trade and Environment Review 2013 - Wake up before it is too late: Make agriculture truly sustainable now for food security in a changing climate (UNCTAD/DITC/TED/2012/3).
Holzworth, D.P., Huth, N.I., deVoil, P.G., Zurcher, E.J., Herrmann, N.I., McLean, G., Chenu, K., van Oosterom, E.J., Snow, V., Murphy, C., Moore, A.D., Brown, H., Whish, J.P.M., Verrall, S., Fainges, J., Bell, L.W., Peake, A.S., Poulton, P.L., Hochman, Z., Thorburn, P.J., Gaydon, D.S., Dalgliesh, N.P., Rodriguez, D., Cox, H., Chapman, S., Doherty, A., Teixeira, E., Sharp, J., Cichota, R., Vogeler, I., Li, F.Y., Wang, E., Hammer, G.L., Robertson, M.J., Dimes, J.P., Whitbread, A.M., Hunt, J., van Rees, H., McClelland, T., Carberry, P.S., Hargreaves, J.N.G., MacLeod, N., McDonald, C., Harsdorf, J., Wedgwood, S., Keating, B.A., 2014. APSIM – Evolution towards a new generation of agricultural systems simulation. Environmental Modelling & Software.
Honaker, J., King, G., 2010. What to do about missing values in time‐series cross‐section data. American Journal of Political Science 54, 561-581.
Hu, X.-K., Su, F., Ju, X.-T., Gao, B., Oenema, O., Christie, P., Huang, B.-X., Jiang, R.-F., Zhang, F.-S., 2013. Greenhouse gas emissions from a wheat–maize double cropping system with different nitrogen fertilization regimes. Environmental Pollution 176, 198-207.
Hutchinson, G.L., Davidson, E.A., 1993. Processes for production and consumption of gaseous nitrogen oxides in soil. Agricultural ecosystem effects on trace

Appendices
227
gases and global climate change (Ed. GAB Peterson, P.S. Luxmoore, R.J.). (American society of agronomy: Madison, Winconsin, USA)
Huth, N.I., Thorburn, P.J., Radford, B.J., Thornton, C.M., 2010. Impacts of fertilisers and legumes on N2O and CO2 emissions from soils in subtropical agricultural systems: A simulation study. Agriculture, Ecosystems & Environment 136, 351-357.
IAEA, 2001. Use of Isotope and Radiation Methods in Soil and Water Management and Crop Nutrition. Training Course Series 14 0205-Soil fertility and irrigation.
IAEA, 2008. Guidelines on nitrogen management in agricultural systems. Soil Science Unit, International Atomic Energy Agency Agency’s Laboratories, Seibersdorf, A-2444 Seibersdorf, Austria
Ichir, L.L., Ismaili, M., Hofman, G., 2003. Recovery of 15N labeled wheat residue and residual effects of N fertilization in a wheat–wheat cropping system under Mediterranean conditions. Nutrient Cycling in Agroecosystems 66, 201-207.
IPCC, 2013. Summary for Policymakers. Climate Change 2013: The Physical Science Basis. Contribution of Working Group I to the Fifth Assessment Report of the Intergovernmental Panel on Climate Change [Stocker, T.F., D. Qin, G.-K. Plattner, M. Tignor, S. K. Allen, J. Boschung, A. Nauels, Y. Xia, V. Bex and P.M. Midgley (eds.)]. Cambridge University Press, Cambridge, United Kingdom and New York, NY, USA.
IPCC, 2014. Summary for policymakers. Climate Change 2014: Impacts, Adaptation, and Vulnerability. Part A: Global and Sectoral Aspects. Contribution of Working Group II to the Fifth Assessment Report of the Intergovernmental Panel on Climate Change [Field, C.B., V.R. Barros, D.J. Dokken, K.J. Mach, M.D. Mastrandrea, T.E. Bilir, M. Chatterjee, K.L. Ebi, Y.O. Estrada, R.C. Genova, B. Girma, E.S. Kissel, A.N. Levy, S. MacCracken, P.R. Mastrandrea, and L.L. White (eds.)]. Cambridge University Press, Cambridge, United Kingdom and New York, NY, USA, pp. 1-32.
Isbell, R., 2002. The Australian soil classification. CSIRO publishing.
Janzen, H.H., Beauchemin, K.A., Bruinsma, Y., Campbell, C.A., Desjardins, R.L., Ellert, B.H., Smith, E.G., 2003. The fate of nitrogen in agroecosystems: An illustration using Canadian estimates. Nutrient Cycling in Agroecosystems 67, 85-102.
Jarecki, M.K., Parkin, T.B., Chan, A.S.K., Hatfield, J.L., Jones, R., 2008. Comparison of DAYCENT-Simulated and Measured Nitrous Oxide Emissions from a Corn Field. J. Environ. Qual. 37, 1685-1690.
Jensen, E.S., Hauggaard-Nielsen, H., 2003. How can increased use of biological N2 fixation in agriculture benefit the environment? Plant and Soil 252, 177-186.
Jensen, E.S., Peoples, M.B., Boddey, R.M., Gresshoff, P.M., Hauggaard-Nielsen, H., Alves, B., Morrison, M.J., 2012. Legumes for mitigation of climate change and

228
the provision of feedstock for biofuels and biorefineries. A review. Agron. Sustain. Dev. 32, 329-364.
Jones, J.W., Hoogenboom, G., Porter, C.H., Boote, K.J., Batchelor, W.D., Hunt, L., Wilkens, P.W., Singh, U., Gijsman, A.J., Ritchie, J.T., 2003. The DSSAT cropping system model. European journal of agronomy 18, 235-265.
Kawakami, E.M., Oosterhuis, D.M., Snider, J.L., Mozaffari, M., 2012. Physiological and yield responses of field-grown cotton to application of urea with the urease inhibitor NBPT and the nitrification inhibitor DCD. European Journal of Agronomy 43, 147-154.
Kearney, J., 2010. Food consumption trends and drivers. Philosophical transactions of the royal society B: biological sciences 365, 2793-2807.
Keating, B.A., Carberry, P.S., Hammer, G.L., Probert, M.E., Robertson, M.J., Holzworth, D., Huth, N.I., Hargreaves, J.N.G., Meinke, H., Hochman, Z., McLean, G., Verburg, K., Snow, V., Dimes, J.P., Silburn, M., Wang, E., Brown, S., Bristow, K.L., Asseng, S., Chapman, S., McCown, R.L., Freebairn, D.M., Smith, C.J., 2003. An overview of APSIM, a model designed for farming systems simulation. European Journal of Agronomy 18, 267-288.
Kelly, R.H., Parton, W.J., Hartman, M.D., Stretch, L.K., Ojima, D.S., Schimel, D.S., 2000. Intra-annual and interannual variability of ecosystem processes in shortgrass steppe. Journal of Geophysical Research: Atmospheres 105, 20093-20100.
Khalil, M.I., Gutser, R., Schmidhalter, U., 2009. Effects of urease and nitrification inhibitors added to urea on nitrous oxide emissions from a loess soil. Journal of Plant Nutrition and Soil Science 172, 651-660.
Khalil, M.I., Rosenani, A.B., Van Cleemput, O., Fauziah, C.I., Shamshuddin, J., 2002. Nitrous oxide emissions from an ultisol of the humid tropics under maize–groundnut rotation. Journal of environmental quality 31, 1071-1078.
Kiese, R., Butterbach-Bahl, K., 2002. N2O and CO2 emissions from three different tropical forest sites in the wet tropics of Queensland, Australia. Soil Biology and Biochemistry 34, 975-987.
Kirkegaard, J.A., Conyers, M.K., Hunt, J.R., Kirkby, C.A., Watt, M., Rebetzke, G.J., 2014. Sense and nonsense in conservation agriculture: Principles, pragmatism and productivity in Australian mixed farming systems. Agriculture, Ecosystems & Environment 187, 133-145.
Kroeze, C., Mosier, A.R., Bouwman, L., 1999. Closing the global N2O budget: A retrospective analysis 1500–1994. Global Biogeochemical Cycles 13, 1-8.
Kroeze, C., Mosier, A.R., Nevison, C., Oenema, O., Seitzinger, S., van Cleemput, O., 1997. Agriculture.
Kroon, P.S., Hensen, A., Jonker, H.J.J., Ouwersloot, H.G., Vermeulen, A.T., Bosveld, F.C., 2010. Uncertainties in eddy covariance flux measurements

Appendices
229
assessed from CH4 and N2O observations. Agricultural and Forest Meteorology 150, 806-816.
Kumar, K., Goh, K.M., 2002. Recovery of 15N-labelled fertilizer applied to winter wheat and perennial ryegrass crops and residual 15N recovery by succeeding wheat crops under different crop residue management practices. Nutrient Cycling in Agroecosystems 62, 123-130.
Kusa, K., Hu, R., Sawamoto, T., Hatano, R., 2006. Three years of nitrous oxide and nitric oxide emissions from silandic andosols cultivated with maize in Hokkaido, Japan. Soil Science and Plant Nutrition 52, 103-113.
Ladha, J.K., Pathak, H., J Krupnik, T., Six, J., van Kessel, C., 2005. Efficiency of fertilizer nitrogen in cereal production: retrospects and prospects. Advances in Agronomy 87, 85-156.
Lal, R., 2004. Soil carbon sequestration to mitigate climate change. Geoderma 123, 1-22.
Li, C., Frolking, S., Butterbach-Bahl, K., 2005a. Carbon sequestration in arable soils is likely to increase nitrous oxide emissions, offsetting reductions in climate radiative forcing. Climatic Change 72, 321-338.
Li, C., Frolking, S., Frolking, T.A., 1992. A model of nitrous oxide evolution from soil driven by rainfall events: 1. Model structure and sensitivity. Journal of Geophysical Research: Atmospheres 97, 9759-9776.
Li, C., Frolking, S., Harriss, R., 1994. Modeling carbon biogeochemistry in agricultural soils. Global Biogeochemical Cycles 8, 237-254.
Li, Y., Chen, D., Barker-Reid, F., Eckard, R., 2008. Simulation of N2O emissions from rain-fed wheat and the impact of climate variation in southeastern Australia. Plant and Soil 309, 239-251.
Li, Y., Chen, D., Zhang, Y., Edis, R., Ding, H., 2005b. Comparison of three modeling approaches for simulating denitrification and nitrous oxide emissions from loam-textured arable soils. Global Biogeochemical Cycles 19, GB3002.
Li, Y., Wang, W., Reeves, S., Dalal, R.C., 2013. Simulation of N2O emissions and mitigation options for rainfed wheat cropping on a Vertosol in the subtropics. Soil Research 51, 152-166.
Li, Y., White, R., Chen, D., Zhang, J., Li, B., Zhang, Y., Huang, Y., Edis, R., 2007. A spatially referenced water and nitrogen management model (WNMM) for (irrigated) intensive cropping systems in the North China Plain. Ecological Modelling 203, 395-423.
Linzmeier, W., Gutser, R., Schmidhalter, U., 2001a. Nitrous oxide emission from soil and from a nitrogen-15-labelled fertilizer with the new nitrification inhibitor 3,4-dimethylpyrazole phosphate (DMPP). Biol Fertil Soils 34, 103-108.

230
Linzmeier, W., Schmidhalter, U., Gutser, R., 2001b. Effect of DMPP on nitrification and N losses (nitrate, NH3, N2O) from fertilizer nitrogen in comparison to DCD. VDLUFA-Institution Series Congress 52, 485–488.
Liu, B., Mørkved, P.T., Frostegård, Å., Bakken, L.R., 2010a. Denitrification gene pools, transcription and kinetics of NO, N2O and N2 production as affected by soil pH. FEMS Microbiology Ecology 72, 407-417.
Liu, C., Wang, K., Meng, S., Zheng, X., Zhou, Z., Han, S., Chen, D., Yang, Z., 2011. Effects of irrigation, fertilization and crop straw management on nitrous oxide and nitric oxide emissions from a wheat–maize rotation field in northern China. Agriculture, Ecosystems & Environment 140, 226-233.
Liu, C., Wang, K., Zheng, X., 2013. Effects of nitrification inhibitors (DCD and DMPP) on nitrous oxide emission, crop yield and nitrogen uptake in a wheat–maize cropping system. Biogeosciences 10, 2427-2437.
Liu, C., Zheng, X., Zhou, Z., Han, S., Wang, Y., Wang, K., Liang, W., Li, M., Chen, D., Yang, Z., 2010b. Nitrous oxide and nitric oxide emissions from an irrigated cotton field in Northern China. Plant and Soil 332, 123-134.
London Stock Exchange, accessed November 2014. London Stock Exchange database. Available at: http://www.londonstockexchange.com/home/homepage.htm.
Luo, Z., Wang, E., Fillery, I.R.P., Macdonald, L.M., Huth, N., Baldock, J., 2014. Modelling soil carbon and nitrogen dynamics using measurable and conceptual soil organic matter pools in APSIM. Agriculture, Ecosystems & Environment 186, 94-104.
Ma, Y., Sun, L., Zhang, X., Yang, B., Wang, J., Yin, B., Yan, X., Xiong, Z., 2013. Mitigation of nitrous oxide emissions from paddy soil under conventional and no-till practices using nitrification inhibitors during the winter wheat-growing season. Biol Fertil Soils 49, 627-635.
Mahmood, T., Ali, R., Latif, Z., Ishaque, W., 2011. Dicyandiamide increases the fertilizer N loss from an alkaline calcareous soil treated with 15N-labelled urea under warm climate and under different crops. Biol Fertil Soils 47, 619-631.
Majumdar, D., Pathak, H., Kumar, S., Jain, M.C., 2002. Nitrous oxide emission from a sandy loam Inceptisol under irrigated wheat in India as influenced by different nitrification inhibitors. Agriculture, Ecosystems & Environment 91, 283-293.
Maljanen, M., Martikainen, P.J., Aaltonen, H., Silvola, J., 2002. Short-term variation in fluxes of carbon dioxide, nitrous oxide and methane in cultivated and forested organic boreal soils. Soil Biology and Biochemistry 34, 577-584.
Mann, L.K., 1986. Changes in soil carbon storage after cultivation. Soil Science 142, 279-288.

Appendices
231
Manschadi, A.M., Hammer, G.L., Christopher, J.T., deVoil, P., 2008. Genotypic variation in seedling root architectural traits and implications for drought adaptation in wheat (Triticum aestivum L.). Plant and Soil 303, 115-129.
Matthews, E., 1994. Nitrogenous fertilizers: Global distribution of consumption and associated emissions of nitrous oxide and ammonia. Global Biogeochem. Cycles 8, 411-439.
McSwiney, C.P., Robertson, G.P., 2005. Nonlinear response of N2O flux to incremental fertilizer addition in a continuous maize (Zea mays L.) cropping system. Global Change Biology 11, 1712-1719.
Menéndez, S., Barrena, I., Setien, I., González-Murua, C., Estavillo, J.M., 2012. Efficiency of nitrification inhibitor DMPP to reduce nitrous oxide emissions under different temperature and moisture conditions. Soil Biology and Biochemistry 53, 82-89.
Metherell, A.K., Harding, L.A., Cole, C.V., Parton, W.J., 1993. CENTURY soil organic matter model environment, Technical documentation, Agroecosystem version 4.0. Great Plains System Research Unit Technical Rep. 4. USDA-ARS, Fort Collins, CO.
Miller, J.F., Kavanaugh, J., Thomas, G.W., 1975. Time of N application and yields of corn in wet, alluvial soils. Agronomy Journal 67, 401-404.
Mohanty, M., Probert, M.E., Reddy, K.S., Dalal, R.C., Mishra, A.K., Subba Rao, A., Singh, M., Menzies, N.W., 2012. Simulating soybean–wheat cropping system: APSIM model parameterization and validation. Agriculture, Ecosystems & Environment 152, 68-78.
Montzka, S.A., Fraser, P.J., 2003. Controlled substances and other source gases. Scientific Assessment of Ozone Depletion: 2002, World Meteorological Organization, Geneva 47, 1.1 – 1.83.
Mosier, A.R., Parton, W.J., Valentine, D.W., Ojima, D.S., Schimel, D.S., Delgado, J.A., 1996. CH4 and N2O fluxes in the Colorado shortgrass steppe: 1. Impact of landscape and nitrogen addition. Global Biogeochemical Cycles 10, 387-399.
Mosier, A.R., Syers, J.K., Freney, J.R., 2004a. Nitrogen fertilizer: an essential component of increased food, feed, and fiber production. Island Press. Scientific Committee on Problems of the Environment (SCOPE) Series.
Mosier, A.R., Wassmann, R., Verchot, L., King, J., Palm, C., 2004b. Methane and nitrogen oxide fluxes in tropical agricultural soils: sources, sinks and mechanisms. Environment, Development and Sustainability 6, 11-49.
Mubarak, A.R., Rosenani, A.B., Anuar, A.R., Siti Zauyah, D., 2003. Recovery of nitrogen from maize residue and inorganic fertilizer in a maize‐groundnut rotation system in humid tropics of Malaysia. Communications in Soil Science and Plant Analysis 34, 2375-2394.

232
Müller, A., Gattinger, A., 2013. Conceptual and practical aspects of climate change mitigation through agriculture: reducing greenhouse gas emissions and increasing soil carbon sequestration. Trade and Environment Review 2013 - Wake up before it is too late: Make agriculture truly sustainable now for food security in a changing climate (UNCTAD/DITC/TED/2012/3).
Mulongoy, K., Kang, B., 1986. The role and potential of forage legumes in alley cropping, live mulch and rotation systems in humid and subhumid tropical Africa. Potentials of Forage Legumes in Farming Systems of Sub-Saharan Africa, ILCA, Addis Ababa, Ethiopia, 212-231.
Mulvaney, R.L., 2008. Advances in methodology for research on nitrogen transformations in soils. In: Schepers, J.S., Raun, W.R. (Eds.), Nitrogen in Agricultural Systems. American Society of Agronomy, Crop Science Society of America, Soil Science Society of America, pp. 437-504.
Myers, R.J.K., Palm, C.A., Cuevas, E., Gunatilleke, I.U.N., Brossard, M., 1994. The synchronisation of nutrient mineralisation and plant nutrient demand.
Myhre, G., Shindell, D., Bréon, F.-M., Collins, W., Fuglestvedt, J., Huang, J., Koch, D., Lamarque, J.-F., Lee, D., Mendoza, B., Nakajima, T., Robock, A., Stephens, G., T., T., Zhang, H., 2013. Anthropogenic and natural radiative forcing. Climate Change 2013: The Physical Science Basis. Contribution of Working Group I to the Fifth Assessment Report of the Intergovernmental Panel on Climate Change [Stocker, T.F., D. Qin, G.-K. Plattner, M. Tignor, S.K. Allen, J. Boschung, A. Nauels, Y. Xia, V. Bex and P.M. Midgley (eds.)]. Cambridge University Press, Cambridge, United Kingdom and New York, NY, USA.
Olson, R.V., Swallow, C.W., 1984. Fate of labeled nitrogen fertilizer applied to winter wheat for five years. Soil Science Society of America Journal 48, 583-586.
Palm, C.A., Gachengo, C.N., Delve, R.J., Cadisch, G., Giller, K.E., 2001. Organic inputs for soil fertility management in tropical agroecosystems: application of an organic resource database. Agriculture, Ecosystems & Environment 83, 27-42.
Pampolino, M.F., Manguiat, I.J., Ramanathan, S., Gines, H.C., Tan, P.S., Chi, T.T.N., Rajendran, R., Buresh, R.J., 2007. Environmental impact and economic benefits of site-specific nutrient management (SSNM) in irrigated rice systems. Agricultural Systems 93, 1-24.
Panek, J.A., Matson, P.A., Ortiz-Monasterio, I., Brooks, P., 2000. Distinguishing nitrification and denitrification sources of N2O in a Mexican wheat system using 15N. Ecological Applications 10, 506-514.
Pappa, V.A., Rees, R.M., Walker, R.L., Baddeley, J.A., Watson, C.A., 2011. Nitrous oxide emissions and nitrate leaching in an arable rotation resulting from the presence of an intercrop. Agriculture, Ecosystems & Environment 141, 153-161.

Appendices
233
Park, S.E., Webster, T.J., Horan, H.L., James, A.T., Thorburn, P.J., 2010. A legume rotation crop lessens the need for nitrogen fertiliser throughout the sugarcane cropping cycle. Field Crops Research 119, 331-341.
Parkin, T.B., Kaspar, T.C., 2006. Nitrous oxide emissions from corn–soybean systems in the Midwest. J. Environ. Qual. 35, 1496-1506.
Parkin, T.B., Venterea, R.T., Hargreaves, S.K., 2012. Calculating the detection limits of chamber-based soil greenhouse gas flux measurements. J. Environ. Qual. 41, 705-715.
Parton, W.J., Hartman, M., Ojima, D., Schimel, D., 1998. DAYCENT and its land surface submodel: Description and testing. Global and Planetary Change 19, 35-48.
Parton, W.J., Holland, E.A., Grosso, S.J.D., Hartman, M.D., Martin, R.E., Mosier, A.R., Ojima, D.S., Schimel, D.S., 2001. Generalized model for NOx and N2O emissions from soils. J. Geophys. Res. 106, 17403-17419.
Parton, W.J., Mosier, A.R., Ojima, D.S., Valentine, D.W., Schimel, D.S., Weier, K., Kulmala, A.E., 1996. Generalized model for N2 and N2O production from nitrification and denitrification. Global Biogeochemical Cycles 10, 401-412.
Pasda, G., Hähndel, R., Zerulla, W., 2001. Effect of fertilizers with the new nitrification inhibitor DMPP (3,4-dimethylpyrazole phosphate) on yield and quality of agricultural and horticultural crops. Biol Fertil Soils 34, 85-97.
Pathak, H., Bhatia, A., Prasad, S., Singh, S., Kumar, S., Jain, M.C., Kumar, U., 2002. Emission of nitrous oxide from rice-wheat systems of Indo-Gangetic plains of India. Environ Monit Assess 77, 163-178.
Peel, M.C., Finlayson, B.L., McMahon, T.A., 2007. Updated world map of the Köppen-Geiger climate classification. Hydrology and earth system sciences discussions 4, 439-473.
Pelster, D.E., Larouche, F., Rochette, P., Chantigny, M.H., Allaire, S., Angers, D.A., 2011. Nitrogen fertilization but not soil tillage affects nitrous oxide emissions from a clay loam soil under a maize–soybean rotation. Soil and Tillage Research 115–116, 16-26.
Penman, J., Kruger, D., Galbally, I., Hiraishi, T., Nyenzi, B., Emmanuel, S., Buendia, L., Hoppaus, R., Martinsen, T., Meijer, J., Miwa, K., Tanabe, K., 2000. N2O: Direct emissions from agricultural soils. IPCC Good Practice Guidance and Uncertainty Management in National Greenhouse Gas Inventories. IGES, Japan.
Peter, G., Runge-Metzger, A., 1994. Monocropping, intercropping or crop rotation? An economic case study from the West African Guinea savannah with special reference to risk. Agricultural Systems 45, 123-143.

234
Phalan, B., Balmford, A., Green, R.E., Scharlemann, J.P.W., 2011. Minimising the harm to biodiversity of producing more food globally. Food Policy 36, Supplement 1, S62-S71.
Phalan, B., Bertzky, M., Butchart, S.H.M., Donald, P.F., Scharlemann, J.P.W., Stattersfield, A.J., Balmford, A., 2013. Crop expansion and conservation priorities in tropical countries. PLoS ONE 8, e51759.
Pilbeam, C.J., 1995. Effect of climate on the recovery in crop and soil of 15N -labelled fertilizer applied to wheat. Fertilizer Research 45, 209-215.
Porter, J.R., Liyong, X., Challinor, A.J., Cochrane, K., Howden, M., Iqbal, M.M., Lobell, D., Travasso, M., 2014. Food security and food production systems. Climate Change 2014: impacts, adaptation, and vulnerability. Part A: global and sectoral aspects. Contribution of Working Group II to the Fifth Assessment Report of the Intergovernmental Panel on Climate Change [Field, C.B., V.R. Barros, D.J. Dokken, K.J. Mach, M.D. Mastrandrea, T.E. Bilir, M. Chatterjee, K.L. Ebi, Y.O. Estrada, R.C. Genova, B. Girma, E.S. Kissel, A.N. Levy, S. MacCracken, P.R. Mastrandrea, and L.L. White (eds.)]. Cambridge University Press, Cambridge, United Kingdom and New York, NY, USA, pp. 1-32.
Prasad, R., Power, J., 1995. Nitrification inhibitors for agriculture, health, and the environment. Advances in agronomy (USA).
Prather, M.J., Holmes, C.D., Hsu, J., 2012. Reactive greenhouse gas scenarios: Systematic exploration of uncertainties and the role of atmospheric chemistry. Geophysical Research Letters 39.
Probert, M.E., Dimes, J.P., Keating, B.A., Dalal, R.C., Strong, W.M., 1998. APSIM's water and nitrogen modules and simulation of the dynamics of water and nitrogen in fallow systems. Agricultural Systems 56, 1-28.
Pu, G., Bell, M., Barry, G., Want, P., 2012. Estimating mineralisation of organic nitrogen from biosolids and other organic wastes applied to soils in subtropical Australia. Soil Research 50, 91-104.
Pu, G., Xu, Z., Saffigna, P.G., 2002. Fate of 15N-labelled nitrate in a wet summer under different residue management regimes in young hoop pine plantations. Forest Ecology and Management 170, 285-298.
R Development CoreTeam, 2008. R: a language and environment for statistical computing. R Foundation Statistical Computing.
Ravishankara, A., Daniel, J.S., Portmann, R.W., 2009. Nitrous oxide (N2O): The dominant ozone-depleting substance emitted in the 21st century. Science 326, 123-125.
Ray, D.K., Mueller, N.D., West, P.C., Foley, J.A., 2013. Yield trends are insufficient to double global crop production by 2050. PLoS One 8, e66428.
Robertson, G.P., 1997. Nitrogen use efficiency in row-crop agriculture: Crop nitrogen use and soil nitrogen loss. Ecology in Agriculture, 347-365.

Appendices
235
Robertson, G.P., Groffman, P.M., 2007. Nitrogen transformations. Soil microbiology, ecology, and biochemistry, 341-364.
Robertson, G.P., Paul, E.A., Harwood, R.R., 2000. Greenhouse gases in intensive agriculture: Contributions of individual gases to the radiative forcing of the atmosphere. Science 289, 1922-1925.
Rochester, I.J., Peoples, M.B., Hulugalle, N.R., Gault, R.R., Constable, G.A., 2001. Using legumes to enhance nitrogen fertility and improve soil condition in cotton cropping systems. Field Crops Research 70, 27-41.
Rochette, P., Angers, D.A., Bélanger, G., Chantigny, M.H., Prévost, D., Lévesque, G., 2004. Emissions of N2O from alfalfa and soybean crops in Eastern Canada. Soil Sci. Soc. Am. J. 68, 493-506.
Rochette, P., Ellert, B.H., Gregorich, E.G., Desjardins, R.L., Pattey, E., Lessard, R., Johnson, B.G., 1997. Description of a dynamic closed chamber for measuring soil respiration and its comparison with other techniques Canadian Journal of Soil Science 2, 195-203.
Rowlings, D.W., Grace, P.R., Kiese, R., Weier, K.L., 2012. Environmental factors controlling temporal and spatial variability in the soil‐atmosphere exchange of CO2, CH4 and N2O from an Australian subtropical rainforest. Global Change Biology 18, 726-738.
Sadeghpour, A., Jahanzad, E., Esmaeili, A., Hosseini, M.B., Hashemi, M., 2013. Forage yield, quality and economic benefit of intercropped barley and annual medic in semi-arid conditions: Additive series. Field Crops Research 148, 43-48.
Sanchez, C.A., Blackmer, A.M., 1988. Recovery of anhydrous ammonia-derived nitrogen-15 during three years of corn production in Iowa. Agron. J. 80, 102-108.
Sánchez, P.A., Salinas, J.G., 1981. Low-input technology for managing oxisols and Ultisols in tropical America. In: Brady, N.C. (Ed.), Advances in Agronomy. Academic Press, pp. 279-406.
Sanz-Cobena, A., García-Marco, S., Quemada, M., Gabriel, J.L., Almendros, P., Vallejo, A., 2014. Do cover crops enhance N2O, CO2 or CH4 emissions from soil in Mediterranean arable systems? Science of The Total Environment 466–467, 164-174.
Scaglia, B., Adani, F., 2009. Biodegradability of soil water soluble organic carbon extracted from seven different soils. Journal of Environmental Sciences 21, 641-646.
Scheer, C., Del Grosso, S.J., Parton, W.J., Rowlings, D.W., Grace, P.R., 2013a. Modeling nitrous oxide emissions from irrigated agriculture: Testing DayCent with high-frequency measurements. Ecological Applications 24, 528-538.

236
Scheer, C., Grace, P.R., Rowlings, D.W., Payero, J., 2012. Nitrous oxide emissions from irrigated wheat in Australia: Impact of irrigation management. Plant and Soil, 1-12.
Scheer, C., Grace, P.R., Rowlings, D.W., Payero, J., 2013b. Soil N2O and CO2 emissions from cotton in Australia under varying irrigation management. Nutrient Cycling in Agroecosystems 95, 43-56.
Scheid Lopes, A., Guilherme, L.G., Ramos, S., 2012. The saga of the agricultural development of the Brazilian Cerrado. International Potash Institute.
Schwenke, G., Grace, P.R., Bell, M.J., 2013. Nitrogen use efficiency. Timing and application method to minimise loss and optimise N use efficiency. New research on nitrous oxide emissions, volatilisation and denitrification. Australian Grains Research & Development Corporation, Grower Grains Research Update.
Schwenke, G., Haigh, B., McMullen, G., Herridge, D.F., 2010. Soil nitrous oxide emissions under dryland N-fertilised canola and N2-fixing chickpea in the northern grains region, Australia. Proc. 19th World Congress of Soil Science, Soil Solutions for a Changing World, Brisbane, Australia, pp. 228-231.
Schwenke, G.D., Herridge, D.F., Scheer, C., Rowlings, D.W., Haigh, B.M., McMullen, K.G., 2015. Soil N2O emissions under N2-fixing legumes and N-fertilised canola: A reappraisal of emissions factor calculations. Agriculture, Ecosystems & Environment 202, 232-242.
Sentek Technologies, 2011. Calibration manual for Sentek soil moisture sensors Version 2.0.
Shcherbak, I., Millar, N., Robertson, G.P., 2014. Global metaanalysis of the nonlinear response of soil nitrous oxide (N2O) emissions to fertilizer nitrogen. PNAS.
Siddique, K.H.M., Belford, R.K., Tennant, D., 1990. Root:shoot ratios of old and modern, tall and semi-dwarf wheats in a mediterranean environment. Plant and Soil 121, 89-98.
ŠImek, M., Cooper, J.E., 2002. The influence of soil pH on denitrification: Progress towards the understanding of this interaction over the last 50 years. European Journal of Soil Science 53, 345-354.
Skiba, U., Fowler, D., Smith, K.A., 1997. Nitric oxide emissions from agricultural soils in temperate and tropical climates: Sources, controls and mitigation options. Nutrient Cycling in Agroecosystems 48, 139-153.
Smil, V., 1999. Nitrogen in crop production: An account of global flows. Global Biogeochemical Cycles 13, 647-662.
Smith, C.J., Whitfield, D.M., Gyles, O.A., Wright, G.C., 1989. Nitrogen fertilizer balance of irrigated wheat grown on a red-brown earth in Southeastern Australia. Field Crops Research 21, 265-275.
Appendices
237
Smith, K.A., Mosier, A.R., Crutzen, P.J., Winiwarter, W., 2012. The role of N2O derived from crop-based biofuels, and from agriculture in general, in Earth's climate. Philosophical Transactions of the Royal Society B: Biological Sciences 367, 1169-1174.
Smith, K.A., Thomson, P.E., Clayton, H., McTaggart, I.P., Conen, F., 1998. Effects of temperature, water content and nitrogen fertilisation on emissions of nitrous oxide by soils. Atmospheric Environment 32, 3301-3309.
Smith, P., Martino, D., Cai, Z., Gwary, D., Janzen, H., Kumar, P., McCarl, B., Ogle, S., O’Mara, F., Rice, C., Scholes, B., Sirotenko, O., 2007. Agriculture. Climate Change 2007: Mitigation. Contribution of Working Group III to the Fourth Assessment Report of the Intergovernmental Panel on Climate Change [B. Metz, O.R. Davidson, P.R. Bosch, R. Dave, L.A. Meyer (eds)], Cambridge University Press, Cambridge, United Kingdom and New York, NY, USA.
Smith, P., Mercedes, B., Ahammad, H., Clark, H., Dong, H., Elsiddig, E.A., Haberl, H., Harper, R., House, J., Jafari, M., Masera, O., Mbow, C., Ravindranath, N.H., Rice, C.W., Abad, C.R., Romanovskaya, A., Sperling, F., F.N., T., 2014. Agriculture, Forestry and Other Land Use (AFOLU). Climate Change 2014: Impacts, Adaptation, and Vulnerability. Part A: Global and Sectoral Aspects. Contribution of Working Group II to the Fifth Assessment Report of the Intergovernmental Panel on Climate Change [Field, C.B., V.R. Barros, D.J. Dokken, K.J. Mach, M.D. Mastrandrea, T.E. Bilir, M. Chatterjee, K.L. Ebi, Y.O. Estrada, R.C. Genova, B. Girma, E.S. Kissel, A.N. Levy, S. MacCracken, P.R. Mastrandrea, and L.L. White (eds.)]. Cambridge University Press, Cambridge, United Kingdom and New York, NY, USA, pp. 1-32.
Solomon, S., Qin, D., Manning, M., Alley, R.B., Berntsen, T., Bindoff, N.L., Chen, Z., Chidthaisong, A., Gregory, J.M., Hegerl, G.C., Heimann, M., Hewitson, B., Hoskins, B.J., Joos, F., Jouzel, J., Kattsov, V., Lohmann, U., Matsuno, T., Molina, M., Nicholls, N., Overpeck, J., Raga, G., Ramaswamy, V., Ren, J., Rusticucci, M., Somerville, R., Stocker, T.F., Whetton, P., Wood, R.A., Wratt, D., 2007. Technical Summary. Climate Change 2007: The physical science basis. Contribution of Working Group I to the Fourth Assessment Report of the Intergovernmental Panel on Climate Change [Solomon, S., D. Qin, M. Manning, Z. Chen, M. Marquis, K.B. Averyt, M. Tignor and H.L. Miller (eds.)]. Cambridge University Press, Cambridge, United Kingdom and New York, NY, USA.
Ssali, H., 1990. Initial and residual effects of nitrogen fertilizers on grain yield of a maize/bean intercrop grown on a Humic Nitosol and the fate and efficiency of the applied nitrogen. Fertilizer Research 23, 63-72.
Staggenborg, S.A., Vanderlip, R.L., 2005. Crop Simulation Models Can be Used as Dryland Cropping Systems Research Tools. Agron. J. 97, 378-384.
Stehfest, E., Bouwman, L., 2006. N2O and NO emission from agricultural fields and soils under natural vegetation: summarizing available measurement data and modeling of global annual emissions. Nutrient Cycling in Agroecosystems 74, 207-228.

238
Suter, H., Chen, D., Li, H., Edis, R., Walker, C., 2010. Reducing N2O emissions from nitrogen fertilisers with the nitrification inhibitor DMPP. 19th World Congress of Soil Science, Soil Solutions for a Changing World. Published on DVD.
Syakila, A., Kroeze, C., 2011. The global nitrous oxide budget revisited. Greenhouse Gas Measurement and Management 1, 17-26.
Thomas, R.J., Ayarza, M.A., 1999. Sustainable land management for the Oxisols of the Latin American savannas: dynamics of soil organic matter and indicators of soil quality. CIAT.
Thomas, S.M., Robertson, M.J., Fukai, S., Peoples, M.B., 2004. The effect of timing and severity of water deficit on growth, development, yield accumulation and nitrogen fixation of mungbean. Field Crops Research 86, 67-80.
Thorburn, P.J., Biggs, J.S., Collins, K., Probert, M.E., 2010. Using the APSIM model to estimate nitrous oxide emissions from diverse Australian sugarcane production systems. Agriculture, Ecosystems & Environment 136, 343-350.
Tilman, D., Balzer, C., Hill, J., Befort, B.L., 2011. Global food demand and the sustainable intensification of agriculture. Proceedings of the National Academy of Sciences 108, 20260-20264.
Tilman, D., Cassman, K.G., Matson, P.A., Naylor, R., Polasky, S., 2002. Agricultural sustainability and intensive production practices. Nature 418, 671-677.
Trenberth, K.E., Jones, P.D., Ambenje, P., Bojariu, R., Easterling, D., Klein Tank, A., Parker, D., Rahimzadeh, F., Renwick, J.A., Rusticucci, M., Soden, B.J., Zhai, P., 2007. Observations: Surface and atmospheric climate change. Climate Change 2007: The Physical Science Basis. Contribution of Working Group I to the Fourth Assessment Report of the Intergovernmental Panel on Climate Change [Solomon, S., D. Qin, M. Manning, Z. Chen, M. Marquis, K.B. Averyt, M. Tignor and H.L. Miller (eds.)]. Cambridge University Press, Cambridge, United Kingdom and New York, NY, USA.
UNFPA, 2011. State of the world population 2011. United Nations Population Fund, New York, New York, USA.
US-EPA, 1995. Inventory of U.S. greenhouse gas emissions and sinks: 1990-1994. United States, Environmental Protection Agency EPA-230-R-96-006, 66–69.
US-EPA, 2010. Methane and nitrous oxide emissions from natural sources. Officeof Atmospheric Programs, Washington, DC.
US-EPA, 2014. Inventory of US greenhouse gas emissions and sinks: 1990-2012. EPA 430-R-11-005.
USDA, N., 1998. Keys to soil taxonomy. Washington DC, USDA.
van Beek, C.L., Meerburg, B.G., Schils, R.L.M., Verhagen, J., Kuikman, P.J., 2010. Feeding the world's increasing population while limiting climate change

Appendices
239
impacts: Linking N2O and CH4 emissions from agriculture to population growth. Environmental Science & Policy 13, 89-96.
Van Den Bossche, A., De Bolle, S., De Neve, S., Hofman, G., 2009. Effect of tillage intensity on N mineralization of different crop residues in a temperate climate. Soil and Tillage Research 103, 316-324.
Van Groenigen, J.W., Kasper, G.J., Velthof, G.L., van den Pol-van Dasselaar, A., Kuikman, P.J., 2004. Nitrous oxide emissions from silage maize fields under different mineral nitrogen fertilizer and slurry applications. Plant and Soil 263, 101-111.
Van Groenigen, J.W., Velthof, G.L., Oenema, O., Van Groenigen, K.J., Van Kessel, C., 2010. Towards an agronomic assessment of N2O emissions: A case study for arable crops. European Journal of Soil Science 61, 903-913.
Vanlauwe, B., Sanginga, N., Merckx, R., 2001. Alley cropping with Senna siamea in South-western Nigeria: II. Dry matter, total N, and urea-derived N dynamics of the Senna and maize roots. Plant and Soil 231, 201-210.
Veldkamp, E., Keller, M., 1997. Fertilizer-induced nitric oxide emissions from agricultural soils. Nutrient Cycling in Agroecosystems 48, 69-77.
Verburg, K., Ross, P.J., Bristow, K.L., 1996. SWIMv2. 1 user manual. Divisional Report No 130, CSIRO Division of Soils, Canberra, Australia.
Vieira, R.F., Mendes, I.C., Reis-Junior, F.B., Hungria, M., 2010. Symbiotic nitrogen fixation in tropical food grain legumes: Current status. Springer.
von Uexküll, H.R., Mutert, E., 1995. Global extent, development and economic impact of acid soils. Plant and Soil 171, 1-15.
Wagner-Riddle, C., Thurtell, G.W., 1998. Nitrous oxide emissions from agricultural fields during winter and spring thaw as affected by management practices. Nutrient Cycling in Agroecosystems 52, 151-163.
Wagner-Riddle, C., Thurtell, G.W., Kidd, G.K., Beauchamp, E.G., Sweetman, R., 1997. Estimates of nitrous oxide emissions from agricultural fields over 28 months. Canadian Journal of Soil Science 77, 135-144.
Walters, D.T., Malzer, G.L., 1990. Nitrogen management and nitrification inhibitor effects on nitrogen-15 urea: II. Nitrogen leaching and balance. Soil Sci. Soc. Am. J. 54, 122-130.
Wang, E., Robertson, M.J., Hammer, G.L., Carberry, P.S., Holzworth, D., Meinke, H., Chapman, S.C., Hargreaves, J.N.G., Huth, N.I., McLean, G., 2002. Development of a generic crop model template in the cropping system model APSIM. European Journal of Agronomy 18, 121-140.
Wang, L., Cai, Z., 2008. Nitrous oxide production at different soil moisture contents in an arable soil in China. Soil Science and Plant Nutrition 54, 786-793.

240
Weier, K.L., 1994. Nitrogen use and losses in agriculture in subtropical Australia. Fertilizer Research 39, 245-257.
Weier, K.L., Doran, J.W., Power, J.F., Walters, D.T., 1993. Denitrification and the dinitrogen/nitrous oxide ratio as affected by soil water, available carbon, and nitrate. Soil Science Society of America journal Jan/Feb 57 (1).
Weiske, A., 2006. Selection and specification of technical and management-based greenhouse gas mitigation measures in agricultural production for modelling. MEACAP WP3 D10a 71.
Weiske, A., Benckiser, G., Herbert, T., Ottow, J., 2001a. Influence of the nitrification inhibitor 3,4-dimethylpyrazole phosphate (DMPP) in comparison to dicyandiamide (DCD) on nitrous oxide emissions, carbon dioxide fluxes and methane oxidation during 3 years of repeated application in field experiments. Biol Fertil Soils 34, 109-117.
Weiske, A., Benckiser, G., Ottow, J.G., 2001b. Effect of the new nitrification inhibitor DMPP in comparison to DCD on nitrous oxide (N2O) emissions and methane (CH4) oxidation during 3 years of repeated applications in field experiments. Nutrient Cycling in Agroecosystems 60, 57-64.
Werner, C., Zheng, X., Tang, J., Xie, B., Liu, C., Kiese, R., Butterbach-Bahl, K., 2006. N2O, CH4 and CO2 emissions from seasonal tropical rainforests and a rubber plantation in Southwest China. Plant and Soil 289, 335-353.
West, T.O., Post, W.M., 2002. Soil organic carbon sequestration rates by tillage and crop rotation. Soil Sci. Soc. Am. J. 66, 1930-1946.
Wolt, J.D., 2004. A meta-evaluation of nitrapyrin agronomic and environmental effectiveness with emphasis on corn production in the Midwestern USA. Nutrient Cycling in Agroecosystems 69, 23-41.
Wratten, S.D., Tomasetto, F., Dinnis, D.M., 2014. Land use: Management for biodiversity and conservation. In: Alfen, N.K.V. (Ed.), Encyclopedia of Agriculture and Food Systems. Academic Press, Oxford, pp. 134-138.
Xu, Y., Xu, Z., Cai, Z., Reverchon, F., 2013. Review of denitrification in tropical and subtropical soils of terrestrial ecosystems. J Soils Sediments 13, 699-710.
Xu, Y.B., Cai, Z.C., 2007. Denitrification characteristics of subtropical soils in China affected by soil parent material and land use. European Journal of Soil Science 58, 1293-1303.
Xu, Z.H., Saffigna, P.G., Myers, R.J.K., Chapman, A.L., 1992. Nitrogen fertilizer in leucaena alley cropping. I. Maize response to nitrogen fertilizer and fate of fertilizer-15N. Fertilizer Research 33, 219-227.
Yang, X., Wang, W., Ye, Z., He, Z., Baligar, V., 2004. Physiological and genetic aspects of crop plant adaptation to elemental stresses in acid soils. In: Wilson, M.J., He, Z., Yang, X. (Eds.), The Red Soils of China. Springer Netherlands, pp. 171-218.

Appendices
241
Yao, Z., Zheng, X., Xie, B., Mei, B., Wang, R., Butterbach-Bahl, K., Zhu, J., Yin, R., 2009. Tillage and crop residue management significantly affects N-trace gas emissions during the non-rice season of a subtropical rice-wheat rotation. Soil Biology and Biochemistry 41, 2131-2140.
Zerulla, W., Barth, T., Dressel, J., Erhardt, K., Horchler von Locquenghien, K., Pasda, G., Rädle, M., Wissemeier, A., 2001. 3,4-Dimethylpyrazole phosphate (DMPP) – a new nitrification inhibitor for agriculture and horticulture. Biol Fertil Soils 34, 79-84.
Zhang, L., Wu, Z., Jiang, Y., Chen, L., Song, Y., Wang, L., Xie, J., Ma, X., 2010. Fate of applied urea 15N in a soil-maize system as affected by urease inhibitor and nitrification inhibitor. Plant Soil and Environment 56, 8-15.