reducing greenhouse gas emissions by advancing industrial ... ghg... · document number:...
TRANSCRIPT
Document Number: 430-R-15-006
REDUCING GREENHOUSE GAS EMISSIONS BY
ADVANCING INDUSTRIAL ENERGY EFFICIENCY
2000—2015
ENERGY STAR: The simple choice for energy efficiency

REDUCING GREENHOUSE GAS EMISSIONS BY
ADVANCING INDUSTRIAL ENERGY EFFICIENCY
2000—2015
FORWARD
The industrial sector is a vital part of the United States economy. Sales of manufacturing goods are val-
ued at just over $5.8 trillion, contribute over 12 percent to the U.S. GDP, and provide more than 11.08
million jobs paying an average of $54,400 annually.1 This sector also contributes more than a quarter of
the nation’s annual greenhouse gas (GHG) emissions. Through ENERGY STAR®, U.S. Environmental Protection Agency (EPA) enables the industrial sector to reduce GHG emissions and improve energy
efficiency by removing barriers to energy management.
The EPA expanded the ENERGY STAR program to address industrial energy efficiency in 2000. Since then, the program has helped manufacturers strengthen their energy management practices and has
engaged entire manufacturing sectors in focused energy efficiency efforts. The results demonstrate that
energy efficiency is a cost-effective strategy for reducing GHG emissions in the manufacturing sector.
This report discusses the origin of the ENERGY STAR program, its expansion into the industrial sector,
the strategies used promote industrial energy efficiency and results.
2

REDUCING GREENHOUSE GAS EMISSIONS BY
ADVANCING INDUSTRIAL ENERGY EFFICIENCY
2000—2015
CONTENTS
FORWARD 2
ORIGINS OF ENERGY STAR 4
A Move Beyond Lighting 5
Debut of Energy Performance Benchmarking 6
Expansion into the Industrial Sector 6
ENERGY STAR FOR INDUSTRY 6
The Industrial Sector Focus 7
Energy Performance Indicators 8
Energy Guides 9
Guidelines for Energy Management 10
Recognition of Performance 11
Results 12
Future Direction 14
APPENDIX
ENERGY STAR Industrial Sector Focuses 15
Industrial Energy Management Tools & Resources 16
References 17
3

REDUCING GREENHOUSE GAS EMISSIONS BY
ADVANCING INDUSTRIAL ENERGY EFFICIENCY
2000—2015
ORIGINS OF ENERGY STAR
The early 1990’s began a new focus on environmental protec-
tion oriented towards preventing pollution before it could occur.
The U.S. Environmental Protection Agency (EPA) launched
new initiatives using voluntary, market-based strategies to pre-
vent pollution. Among these were the Green Lights and ENER-
GY STAR programs, which were designed to reduce green-
house gas (GHG) emissions
from fossil fuel use by promot-
ing energy efficiency.
In 1991 EPA launched Green
Lights to build the market for
more efficient lighting. At the
time, lighting was estimated to
account for 20 to 25 percent of
the electricity sold in the U.S.2
New energy-efficient lighting
technology was available but
not yet widely adopted.
Through Green Lights, EPA
asked businesses, govern-
ments, and other organiza-
tions to make a voluntary com-
mitment to upgrade their facilities’ lighting where it could be
done profitability. Businesses and other organizations respond-
ed, and at Green Lights’ peak in 1995, over a thousand organi-
zations had committed to installing energy-efficient lighting.
Green Lights proved to be a successful framework for driving
action. A year later, EPA launched ENERGY STAR to help
businesses and consumers make informed selections of per-
sonal computers (PC), based on energy performance. Growth
projections for PC use in businesses and households were
enormous, with corresponding increases in electricity use and
associated carbon dioxide
emissions. Although technol-
ogies existed to make PCs
more energy-efficient, they
were not being used.3
EPA faced a challenge in
motivating and mobilizing
the U.S. marketplace to offer
energy-efficient PCs. Work-
ing with computer manufac-
turers, EPA helped build the
business case for producing
and purchasing an energy-
efficient product, identified
an energy performance
specification for the PC, de-
signed the recognizable ENERGY STAR label, and informed
the market of the availability of an environmentally friendly
product.
The market responded again as businesses and consumers
made the decision to purchase energy-efficient products.
Source: ENERGY STAR® Products: 20 Years of Helping Americans Save Energy Save Money And Protect the Environment, US EPA
1991 1992
EPA introduces Green Lights, a
partnership program designed to
promote efficient lighting systems.
EPA in t roduces the f i rs t
ENERGY STA R la be l ed
products for personal comput-
ers and monitors.
1993 1994
EPA pilots the ENERGY STAR
Buildings program with 23 build-
ing owners to showcase an
ENERGY STAR approach.
4

5
REDUCING GREENHOUSE GAS EMISSIONS BY
ADVANCING INDUSTRIAL ENERGY EFFICIENCY
2000—2015
Since this early beginning, EPA has leveraged the ENERGY
STAR program and transformed it into a national symbol of
energy efficiency. The ENERGY STAR logo is now recognized
by nearly 90 percent of the U.S. public.4 EPA continues to apply
the ENERGY STAR to more than 70 product categories that
meet strict energy performance specifications and continues to
add new product categories.5
A MOVE BEYOND LIGHTING
The momentum established by Green Lights enabled EPA to
move beyond lighting to capture substantial additional savings
by improving the energy efficiency of a whole building. Through
its work with Green Lights participants, EPA learned that real
savings lay not just in technologies but in the interaction of the
various building systems and the effectiveness of energy man-
agement.
In 1993 EPA conducted a study to investigate best practices
and strategies for promoting whole-building energy perfor-
mance. Through the study, EPA identified several areas where
ENERGY STAR could make a difference. These included the
need for an energy performance benchmarking system to en-
sure objective measurement and a partnership program to help
organizations build stronger energy management programs.6
Two years later, EPA launched ENERGY STAR Buildings, as a
logical step to encourage Green Lights partners to focus on the
continuous improvement of their facilities’ energy performance
beyond lighting upgrades.
This step marked an evolution in the design of energy efficien-
cy programs by moving from a technology-oriented approach
to a systems approach focused on the whole facility. It also
heralded a new era of strategically managing energy by adopt-
ing an organizational-wide energy management approach.
DEBUT OF ENERGY PERFORMANCE BENCHMARKING
EPA needed an objective measure by which all buildings could
be evaluated. It was obvious that saving energy was good, but
there was no way to objectively compare—or benchmark—the
performance of one building to another. EPA turned to an ex-
isting inventory of commercial building energy use available
from the Department of Energy to develop comparative metrics
for evaluating performance.
In 1999 EPA released the first ENERGY STAR score for office
buildings.7 To recognize and motivate top performance, EPA
extended the ENERGY STAR label to office buildings that
scored in the top 25% nationally on the ENERGY STAR scale.
To make it easy for users to benchmark their facilities, an on-
line energy data management tool called Portfolio Manager
was released in 2000.8
The release of these new tools would mark a fundamental shift
in how the market came to define energy-efficient buildings.
Until this time, no system had existed. Now, EPA enabled or-
ganizations to gauge the performance of their buildings easily
and at low cost, prioritize investment opportunities, learn from
the best performing, and verify the savings of their actions.
1995 1999
F i r s t E N E R G Y
STAR ra t ing for
office buildings is
released.
Green Lights merges with
ENERGY STAR to help
businesses improve their
energy performance organi-
zation-wide.
First ENERGY STAR
label is awarded to a
commercial o f f ice
buildings.
EPA launches ENERGY
S T A R B u i l d i n g s t o
promote whole building
energy efficiency.
1997 1998
EPA establishes the ENERGY
STAR Partner o f the Year
Award for excellence in energy
management.

REDUCING GREENHOUSE GAS EMISSIONS BY
ADVANCING INDUSTRIAL ENERGY EFFICIENCY
2000—2015
The ENERGY STAR scores have since been expanded to
nearly twenty commercial and institutional building types, with
more in development.
EXPANSION INTO THE INDUSTRIAL SECTOR
Both Green Lights and ENERGY STAR had engaged compa-
nies from the industrial sectors in energy efficiency of their
buildings. Many of these partners requested EPA to offer more
ENERGY STAR tools and resources to address the energy use
of their manufacturing plants. At the same time, another EPA
voluntary program, Climate Wise, was working with industrial
companies to reduce GHG emissions by focusing on energy
efficiency.
Given the growth in consumer awareness of ENERGY STAR ,
industry interest in an ENERGY STAR program, and the im-
portance of energy efficiency for GHG management, EPA
merged Climate Wise and ENERGY STAR to offer expanded
resources for the industrial sector.9
EPA expanded ENERGY STAR in the industrial sector in
2000.10 Having operated voluntary partnership programs for
nearly ten years, EPA identified three key areas where the
new industrial program could work to reduce barriers to energy
efficiency:
Increase access to information on industrial energy effi-
ciency upgrades and strategies;
Provide energy performance measurement tools that rate
a plant’s energy efficiency; and,
Offer tools and resources that support strong corporate
energy management systems and programs.
Early on, EPA understood that industrial energy management
must move beyond occasional energy audits and projects if
significant energy savings were to be captured. EPA observed
among its partners that greater improvements in energy effi-
ciency occurred when companies applied a strategic and pro-
grammatic approach based on continuous improvement of
energy performance.
The objective for the new industrial program would be to pro-
mote strategic energy management and to work with manufac-
turers to build strong corporate-wide programs. To shine a
spotlight on organizations that were succeeding at creating
strong corporate-wide energy management programs that
achieved significant energy savings, EPA extended the ENER-
GY STAR Partner of the Year Award to industrial partners.
Today, the award is highly coveted by industrial partners.
ENERGY STAR FOR INDUSTRY
First ENERGY STAR certified building:
Ridgehaven Green Building,
San Diego, CA
1999
2000
E P A e x p a n d s
E N E R G Y S T A R t o
p r o m o t e i n d u s t r i a l
energy-efficiency.
First National Awareness
Survey reveals that 40% of
Americans recognize the
ENERGY STAR.
2001
EPA kicks off first ENERGY
STAR Industrial Focus with
t h e M o t o r V e h i c l e
manufacturing sector.
Portfolio Manager,
an on-line energy
tracking tool for
buildings, goes live.
6
REDUCING GREENHOUSE GAS EMISSIONS BY
ADVANCING INDUSTRIAL ENERGY EFFICIENCY
2000—2015
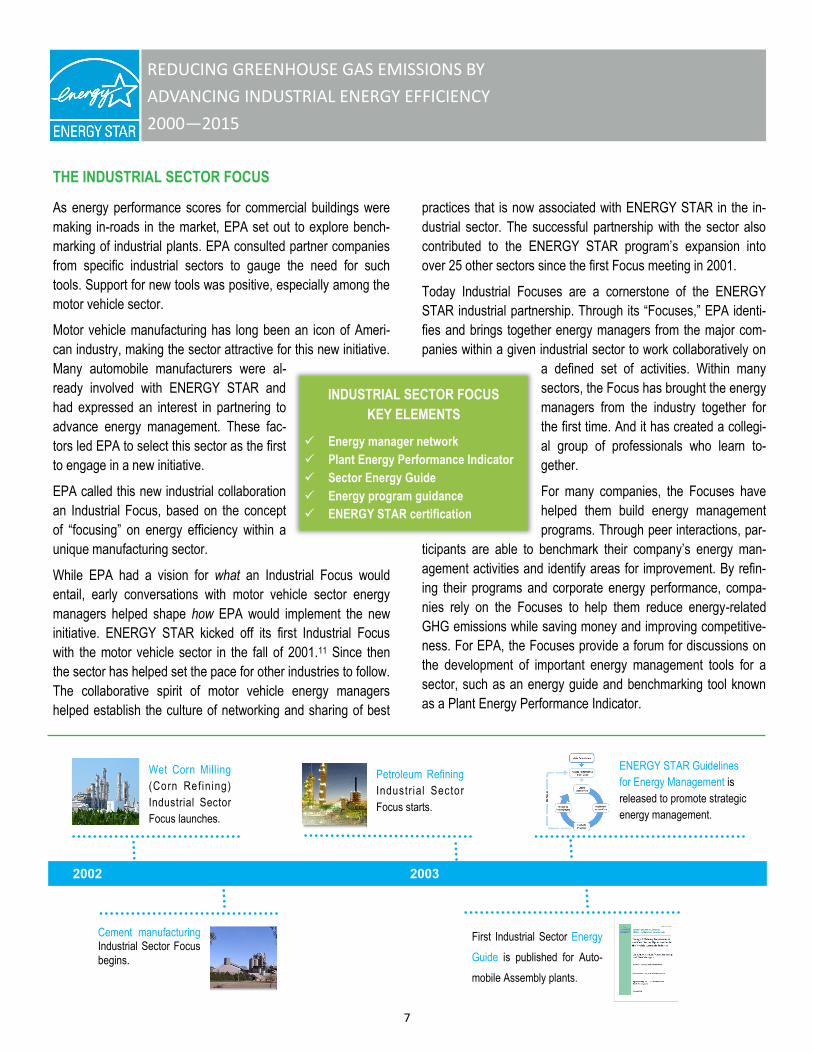
THE INDUSTRIAL SECTOR FOCUS
As energy performance scores for commercial buildings were
making in-roads in the market, EPA set out to explore bench-
marking of industrial plants. EPA consulted partner companies
from specific industrial sectors to gauge the need for such
tools. Support for new tools was positive, especially among the
motor vehicle sector.
Motor vehicle manufacturing has long been an icon of Ameri-
can industry, making the sector attractive for this new initiative.
Many automobile manufacturers were al-
ready involved with ENERGY STAR and
had expressed an interest in partnering to
advance energy management. These fac-
tors led EPA to select this sector as the first
to engage in a new initiative.
EPA called this new industrial collaboration
an Industrial Focus, based on the concept
of “focusing” on energy efficiency within a
unique manufacturing sector.
While EPA had a vision for what an Industrial Focus would
entail, early conversations with motor vehicle sector energy
managers helped shape how EPA would implement the new
initiative. ENERGY STAR kicked off its first Industrial Focus
with the motor vehicle sector in the fall of 2001.11 Since then
the sector has helped set the pace for other industries to follow.
The collaborative spirit of motor vehicle energy managers
helped establish the culture of networking and sharing of best
practices that is now associated with ENERGY STAR in the in-
dustrial sector. The successful partnership with the sector also
contributed to the ENERGY STAR program’s expansion into
over 25 other sectors since the first Focus meeting in 2001.
Today Industrial Focuses are a cornerstone of the ENERGY
STAR industrial partnership. Through its “Focuses,” EPA identi-
fies and brings together energy managers from the major com-
panies within a given industrial sector to work collaboratively on
a defined set of activities. Within many
sectors, the Focus has brought the energy
managers from the industry together for
the first time. And it has created a collegi-
al group of professionals who learn to-
gether.
For many companies, the Focuses have
helped them build energy management
programs. Through peer interactions, par-
ticipants are able to benchmark their company’s energy man-
agement activities and identify areas for improvement. By refin-
ing their programs and corporate energy performance, compa-
nies rely on the Focuses to help them reduce energy-related
GHG emissions while saving money and improving competitive-
ness. For EPA, the Focuses provide a forum for discussions on
the development of important energy management tools for a
sector, such as an energy guide and benchmarking tool known
as a Plant Energy Performance Indicator.
INDUSTRIAL SECTOR FOCUS
KEY ELEMENTS
Energy manager network
Plant Energy Performance Indicator
Sector Energy Guide
Energy program guidance
ENERGY STAR certification
2002
Cement manufacturing Industrial Sector Focus
begins.
Wet Corn Milling
(Corn Refining)
Industrial Sector
Focus launches.
First Industrial Sector Energy
Guide is published for Auto-
mobile Assembly plants.
Petroleum Refining
Industr ial Sector
Focus starts.
2003
ENERGY STAR Guidelines
for Energy Management is
released to promote strategic
energy management.
7

REDUCING GREENHOUSE GAS EMISSIONS BY
ADVANCING INDUSTRIAL ENERGY EFFICIENCY
2000—2015
PLANT ENERGY PERFORMANCE INDICATORS
Benchmarking energy performance is a critical best practice for
driving energy efficiency. Industrial energy managers generally
understand the concept of benchmarking; however, access to
industry-wide energy performance benchmarks are usually
unavailable. Consequently, most energy managers do not know
if their most efficient plants are actually efficient when com-
pared to the entire industry and whether better performance
could be expected of a plant.
EPA developed ENERGY STAR Plant Energy Performance
Indicators (EPIs) with the goal to overcoming this barrier to
better energy management by enabling comparison of energy
performance between similar facilities within a manufacturing
sector.
The first challenge in creating energy performance benchmarks
is having a good dataset. EPA overcame this issue by securing
a way to access industrial energy and production data collected
by the US Census Bureau through the Annual Survey of Manu-
facturers and the Manufacturers Energy Consumption Survey
(MECS) which cover all plants in the United States.12
To ensure fair comparisons between plants within a sector, the
ENERGY STAR approach to benchmarking draws on statistical
methods to define the most important drivers for energy use
within an industry and to normalize for a meaningful compari-
son. Working closely with energy managers from the sectors
helps EPA to identify these key drivers and provides industry
the opportunity to the review the draft EPIs.13
EPA began work on the first ENERGY STAR EPI in 2001 with
the motor vehicle sector, which selected automobile assembly
plants for benchmarking. Benchmarking wet corn mills followed
in 2002 and cement plants in 2003. In 2005 EPA finalized and
released for industry use the first industrial EPI for auto assem-
bly plants.14
ENERGY STAR EPIs rate plant energy performance on a scale
of 1 to 100. A score of a 50 is considered average performance,
while a score of 75 is the benchmark for an ENERGY STAR
plant. Determining a plant’s energy performance enables com-
panies to set strong goals for improvement and gauge change.
EPIs also provide the basis for industrial plants to earn EPA’s
ENERGY STAR certification which requires that plant must
score a 75 or higher (within the top quartile) and meet the tech-
nical requirements of the EPI.
EPA has since published eleven additional EPIs and has more
in development (See Appendix for list of EPIs). Additionally,
EPA worked with Solomons Associates, a private company with
a long standing benchmarking system for petroleum refineries,
to recognize the results of the Solomon-EII® system in deter-
mining top quartile of energy performance for US refineries.15
Today ENERGY STAR EPIs play an important role in many
companies’ energy management programs. They provide an
objective metric for driving and rewarding plant energy perfor-
mance.
2005
F i r s t P l a n t E n e r g y Performance Indicator (EPIs) is released for Au tomob i l e assembly
plants.
2004
EPA publishes Teaming Up
to Save Energy guidebook to
share best pract ices on
forming energy teams.
G l a s s m a k i n g Industrial Sector
Focus launches.
Pharmaceutical
manufacturing
Industrial Sector
Focus begins.
8
REDUCING GREENHOUSE GAS EMISSIONS BY
ADVANCING INDUSTRIAL ENERGY EFFICIENCY
2000—2015
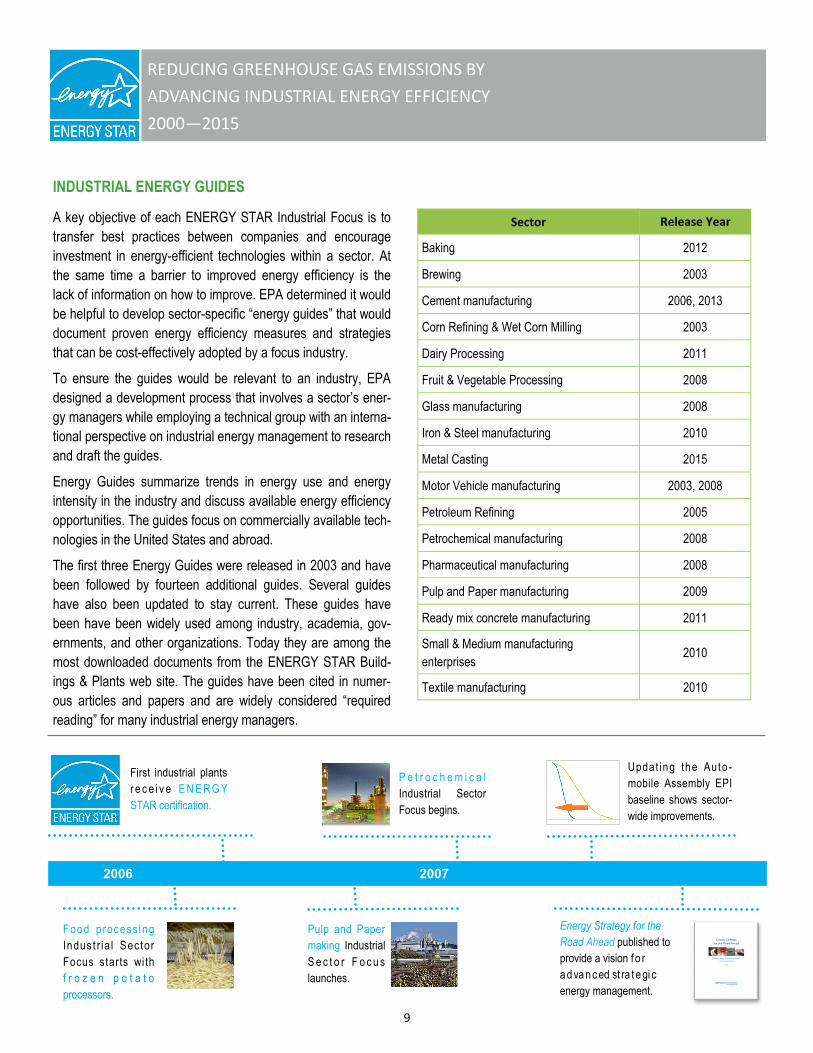
A key objective of each ENERGY STAR Industrial Focus is to
transfer best practices between companies and encourage
investment in energy-efficient technologies within a sector. At
the same time a barrier to improved energy efficiency is the
lack of information on how to improve. EPA determined it would
be helpful to develop sector-specific “energy guides” that would
document proven energy efficiency measures and strategies
that can be cost-effectively adopted by a focus industry.
To ensure the guides would be relevant to an industry, EPA
designed a development process that involves a sector’s ener-
gy managers while employing a technical group with an interna-
tional perspective on industrial energy management to research
and draft the guides.
Energy Guides summarize trends in energy use and energy
intensity in the industry and discuss available energy efficiency
opportunities. The guides focus on commercially available tech-
nologies in the United States and abroad.
The first three Energy Guides were released in 2003 and have
been followed by fourteen additional guides. Several guides
have also been updated to stay current. These guides have
been have been widely used among industry, academia, gov-
ernments, and other organizations. Today they are among the
most downloaded documents from the ENERGY STAR Build-
ings & Plants web site. The guides have been cited in numer-
ous articles and papers and are widely considered “required
reading” for many industrial energy managers.
INDUSTRIAL ENERGY GUIDES
Sector Release Year
Baking 2012
Brewing 2003
Cement manufacturing 2006, 2013
Corn Refining & Wet Corn Milling 2003
Dairy Processing 2011
Fruit & Vegetable Processing 2008
Glass manufacturing 2008
Iron & Steel manufacturing 2010
Metal Casting 2015
Motor Vehicle manufacturing 2003, 2008
Petroleum Refining 2005
Petrochemical manufacturing 2008
Pharmaceutical manufacturing 2008
Pulp and Paper manufacturing 2009
Ready mix concrete manufacturing 2011
Small & Medium manufacturing
enterprises 2010
Textile manufacturing 2010
2006 2007
Energy Strategy for the
Road Ahead published to provide a vision f o r a d va n c ed st ra t e gi c
energy management.
P e t r o c h e m i c a l
Industrial Sector
Focus begins.
Updat ing the Auto -
mobile Assembly EPI
baseline shows sector-
wide improvements.
First industrial plants
r e c e i v e E N E RG Y
STAR certification.
Food p rocess ing
Indus t r ia l Sector
Focus starts wi th
f r o z e n p o t a t o
processors.
Pulp and Paper
making Industrial
S e c t o r F o c u s
launches.
9

REDUCING GREENHOUSE GAS EMISSIONS BY
ADVANCING INDUSTRIAL ENERGY EFFICIENCY
2000—2015
GUIDELINES FOR ENERGY MANAGEMENT
Through the Green Lights program, EPA observed that organi-
zations with structured energy programs supported by senior
management were more likely to implement lighting and other
efficiency upgrades than other companies. Additionally, these
organizations had a greater likelihood of finding energy savings
tied to better operating and maintenance practices, and saved
more energy.
EPA also observed that most organiza-
tions did not have formal energy pro-
grams and “energy management” was
largely viewed as implementing energy
projects. Consequently, many organiza-
tions were missing large opportunities to
improve their energy performance and
maintain that improvement.16
EPA took the first steps toward address-
ing this issue by focusing on whole-
facility improvement and by providing
benchmarking tools to support develop-
ing energy management programs.
These steps gave EPA a clearer under-
standing of the best practices and suc-
cessful energy management strategies
that organizations with leading energy
programs were employing.
By observing specific programmatic traits and practices, EPA
developed the ENERGY STAR Guidelines for Energy Manage-
ment (Guidelines) as a road map for developing and operating a
basic energy management program.
The Guidelines were published on the ENERGY STAR web site
in 2003 and have become the foundation of the thousands of
commercial and industrial programs.17
Recently they informed the design of
the International Standard Organiza-
tion’s Energy Management Standard
(ISO 50001) and the concept of
“strategic energy management” now
being explored by some utility pro-
grams.18
EPA has built on the foundation of the
Guidelines, by developing numerous
tools and resources that support action
under each step of the Guidelines.
Many of these tools have drawn from
the best practices of ENERGY STAR
industrial partners.
ENERGY STAR
Guidelines for Energy Management Steps
2008 2009
Meta l cas t i ng
Industrial Sector
Focus starts.
Updating the Wet Corn
Milling EPI baseline reveals
sector efficiency gains.
Printing Industrial
S e c t o r F o c u s
begins.
S t e e l m a k i n g Industrial Sector
Focus launches.
Food Processing Sector
Focus adds Cookie &
Cracker Baking and Juice
production.
Updating the Cement
Making EPI basel ine
shows improvement in
sector efficiency.
10

REDUCING GREENHOUSE GAS EMISSIONS BY
ADVANCING INDUSTRIAL ENERGY EFFICIENCY
2000—2015
RECOGNITION OF PERFORMANCE
Recognizing and celebrating success in energy efficiency is
important for raising awareness of the value of energy manage-
ment. It is also an effective energy management tool that cre-
ates motivation for good performance and validates effective
programs. In the Industrial sector, ENERGY STAR recognition
began with the Partner of the Year award and has expanded as
the program has grown.
Partner of the Year Award
To distinguish world-class corporate
energy management programs, EPA
created the ENERGY STAR Partner
of the Year Award for Excellence in Energy Management.
Awarded annually, it is the highest level of recognition awarded
by EPA’s ENERGY STAR program. Partners must demonstrate
they have:
A well-established corporate energy management program aligned with the Guidelines for Energy Management;
Organization-wide energy savings; Active participation in ENERGY STAR and communication
of its benefits.
The award is pursued by industrial companies as it denotes the
energy program as one the best in the U.S. For companies that
achieve the award, EPA challenges them to do more the next
year. Those that continue to demonstrate growth and partner-
ship are awarded the Sustained Excellence designation.
Plant Certification
ENERGY STAR Plant Energy Perfor-
mance Indicators (EPI) provide an
objective rating of a manufacturing
facility’s energy performance and are the basis for EPA to
award ENERGY STAR certification. To be eligible for certifica-
tion, the facility must verify a score of 75 or higher using its
sector’s EPI and be in good standing with federal Clean Air Act
regulations.
ENERGY STAR plant certification is awarded annually and
distinguishes a plant as being among the most efficient in the
U.S. EPA awarded the first industrial plant certifications in
2006. The extension of ENERGY STAR certification to industri-
al facilities was a major milestone for both the program and the
field of energy management.
Challenge for Industry Achiever
EPA issued the ENERGY STAR Chal-
lenge for Industry (the Challenge) in
2010 to inspire industrial plants and
sectors without an EPI to set goals and improve their perfor-
mance by 10% or more. Recognition is offered to plants that
achieve this goal within five years or less from a baseline regis-
tered with EPA. Since its launch, the Challenge for Industry
has seen participation grow quickly with many companies and
industry associations challenging their plants to take action.
2010
Motor Vehicle Industrial
Sector Focus expands
to cover engine and
transmission plants.
2011 2012
Baking Industrial
Sector Focus
begins.
E P A c h a l l e n g e s
industry to reduce
energy intensity by
10% or more.
R e a d y - m i x
concrete Industrial
S e c t o r F o c u s
launches.
Dairy Processing
Industrial Sector
Focus launches.
11

REDUCING GREENHOUSE GAS EMISSIONS BY
ADVANCING INDUSTRIAL ENERGY EFFICIENCY
2000—2015
The goal of EPA’s ENERGY STAR industrial partnership is to
reduce GHG emissions by offering manufacturers tools and
resources that improve energy efficiency. In the years since
2000, EPA through ENERGY STAR has partnered with over
750 industrial companies that operate thousands of plants
across the U.S., launched over 20 industrial focuses, and de-
veloped a vast suite of energy management resources. These
efforts have yielded significant benefits for both the environ-
ment and the companies participating in the program’s initia-
tives.
EPA has been able to gauge the success of the program by
measuring impacts. In 2013, EPA estimates its work with the
industrial sector through ENERGY STAR resulted in electrical
savings of more than 33,000 GWh and fuel savings of 274 tril-
lion British thermal units (BTU).19
Plant Certification
Industrial plants earning ENERGY STAR certification are the
most efficient in their sector and save more energy than aver-
age performing plants. Eligibility for certification is determined
using an ENERGY STAR Plant Energy Performance Indicator
(EPI) that is plant professionally verified. As of 2015, certifica-
tion is available for 12 plant types. The first plants were certified
in 2006 and results through July 2015 are presented in the fol-
lowing table. In 2014, 70 certified plants saved 91 trillion BTUs
in energy, equivalent to over 8.2 billion metric tons of GHG
emissions, and saved over $700 million.
RESULTS
ENERGY STAR Plant Certification (As of July 2015)
Number of plant-types eligible for certification 12
Total number of plants earning certification 141
Total number of certifications awarded 460
Annual energy saved (Trillion BTU source) 544
Households powered by energy savings 3,023,000
GHG Savings (Million Metric Tons CO2e) 36
Challenge for Industry
Plants that achieve the ENERGY STAR Challenge for Industry
reduce their energy intensity by 10% or more within five years
or less. Savings are professionally verified. The Challenge was
launched in 2010 and a median reduction of 20% within two
years has been observed nearly five years later. Results as of
July 2015 are presented in the following table.
ENERGY STAR Challenge for Industry (As of July 2015)
Total number of plants taking the Challenge 1107
Total plants achieving the Challenge 341
Annual energy saved (Trillion BTU source) 60
Number of homes powered by energy savings 338,000
Average energy intensity reduction 20%
GHG Savings (Million Metric Tons CO2e) 12
2013
Aluminum Casting
Indust r ial Sector
Focus starts.
2014 2015
EPA publishes the Energy
Treasure Hunt guide to help
companies find savings by
engaging employees.
Ammonia / Nitrogenous
Fer t i l i ze r Indus t r i a l
Sector Focus launches.
E P A p u b l i s h e s f i r s t
Industrial Insights to share
unique in fo rmat i on on
ENERGY STAR Industrial
Focus sectors.
12
REDUCING GREENHOUSE GAS EMISSIONS BY
ADVANCING INDUSTRIAL ENERGY EFFICIENCY
2000—2015
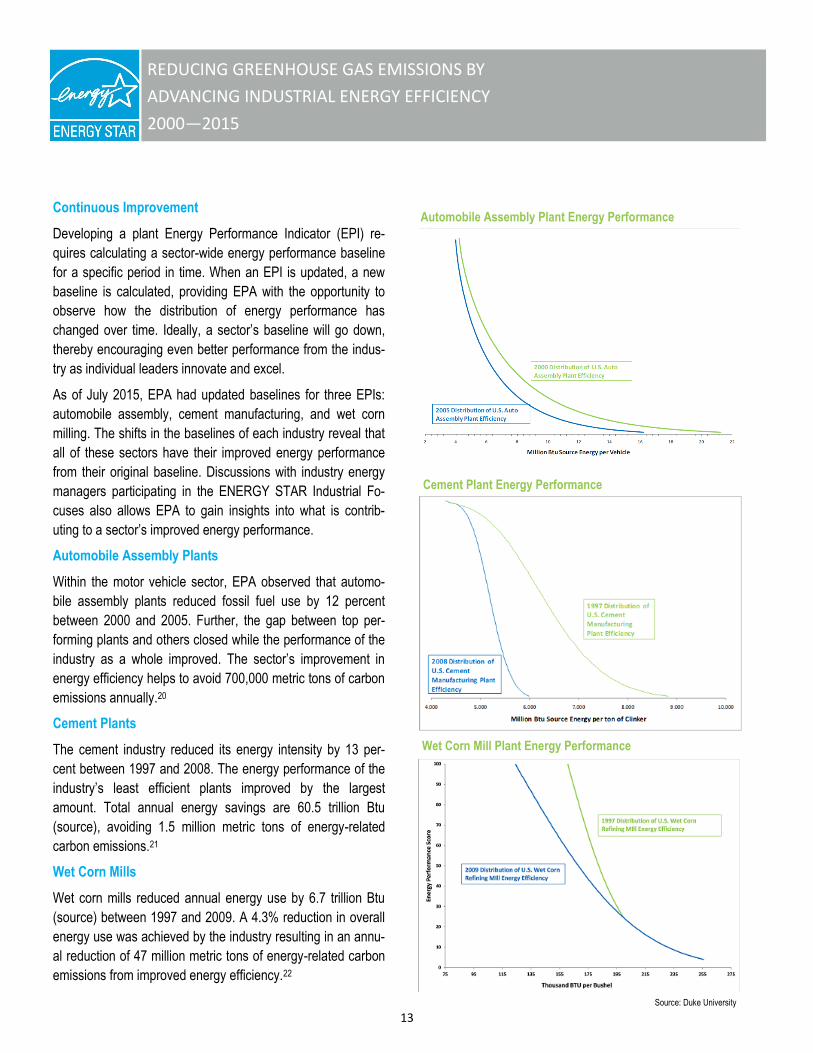
Continuous Improvement
Developing a plant Energy Performance Indicator (EPI) re-
quires calculating a sector-wide energy performance baseline
for a specific period in time. When an EPI is updated, a new
baseline is calculated, providing EPA with the opportunity to
observe how the distribution of energy performance has
changed over time. Ideally, a sector’s baseline will go down,
thereby encouraging even better performance from the indus-
try as individual leaders innovate and excel.
As of July 2015, EPA had updated baselines for three EPIs:
automobile assembly, cement manufacturing, and wet corn
milling. The shifts in the baselines of each industry reveal that
all of these sectors have their improved energy performance
from their original baseline. Discussions with industry energy
managers participating in the ENERGY STAR Industrial Fo-
cuses also allows EPA to gain insights into what is contrib-
uting to a sector’s improved energy performance.
Automobile Assembly Plants
Within the motor vehicle sector, EPA observed that automo-
bile assembly plants reduced fossil fuel use by 12 percent
between 2000 and 2005. Further, the gap between top per-
forming plants and others closed while the performance of the
industry as a whole improved. The sector’s improvement in
energy efficiency helps to avoid 700,000 metric tons of carbon
emissions annually.20
Cement Plants
The cement industry reduced its energy intensity by 13 per-
cent between 1997 and 2008. The energy performance of the
industry’s least efficient plants improved by the largest
amount. Total annual energy savings are 60.5 trillion Btu
(source), avoiding 1.5 million metric tons of energy-related
carbon emissions.21
Wet Corn Mills
Wet corn mills reduced annual energy use by 6.7 trillion Btu
(source) between 1997 and 2009. A 4.3% reduction in overall
energy use was achieved by the industry resulting in an annu-
al reduction of 47 million metric tons of energy-related carbon
emissions from improved energy efficiency.22
Automobile Assembly Plant Energy Performance
Cement Plant Energy Performance
Wet Corn Mill Plant Energy Performance
Source: Duke University
13

REDUCING GREENHOUSE GAS EMISSIONS BY
ADVANCING INDUSTRIAL ENERGY EFFICIENCY
2000—2015
Fifteen years since the expansion of ENERGY STAR to the industrial sector and nearly 25 years since the inception of
Green Lights, the ENERGY STAR principles for achieving energy efficiency and greenhouse gas emissions reductions
remain unchanged. ENERGY STAR is still rooted in the power of collaborative partnerships, the importance of high-level
organizational commitment, the value of a good plan, a consistent and objective way to measure real-world consumption
and savings on a continuous basis, and recognition awarded for achievement. These core values will continue to be of
great importance as even greater emphasis is placed on reducing GHG emissions tied to energy use.
As the 2000—2015 time period concludes, EPA, through ENERGY STAR, is poised to lead the industrial sector to greater
energy achievements. The ENERGY STAR industrial partnership will continue to grow as new sectors are added to the
Industrial Focuses. EPA anticipates that many of these sectors will be suppliers to existing focus industries which will con-
tinue the strong network of industries linked by market segments. New tools designed to encourage greater improvements
in energy efficiency in the workplace will be developed and new collaborations with other entities promoting industrial en-
ergy efficiency will be explored. Organizations will continue to use ENERGY STAR as a platform for their energy efficiency
efforts and as a result will be better positioned to address future climate risks, policies, reporting requirements and regula-
tions. EPA looks forward to the next decade of collaboration with the industrial sector on energy performance as we work
to help make industry become more sustainable.
FUTURE DIRECTIONS
14

REDUCING GREENHOUSE GAS EMISSIONS BY
ADVANCING INDUSTRIAL ENERGY EFFICIENCY
2000—2015
Industrial Sector Focus Launch Year Energy Performance Indicator
Ammonia / Nitrogenous Fertilizer 2015 In progress
Cement Manufacturing 2002 2nd Version Released
Concrete Manufacturing 2010 Draft
Corn Refining (Wet Corn Mills) 2002 2nd Version Released
Dairy Fluid Dairies
Ice Cream
Cheese
2010 Draft
Draft
Food Processing Frozen Fried Potato Products
Cookies & Crackers
Juice
Tomato Products
Bread & Rolls
2006
2008
2008
2008
2012
Released
Released
Released
Draft
Draft
Glass Manufacturing Flat glass
Container glass
Fiberglass
2004 Released
Released
Draft
Iron & Steel Mills Integrated Mills
Mini Mills
2008 Draft
Metal Casting Iron
Investment Steel Casting
Carbon/Alloy Casting
Aluminum
2009
2009
2009
2014
Draft
Draft
Draft
In progress
Motor Vehicle Manufacturing Assembly Plants
Engine Plants
Transmission Plants
2001
2011
2011
2nd Version Released
Draft
Draft
Petrochemical Manufacturing 2007 Draft
Petroleum Refining 2003 Private system recognized by EPA
Pharmaceuticals 2004 Released
Printing 2009 Draft
Pulp & Paper Integrated Mills
Pulp Mills
2006 Released
Released
15

REDUCING GREENHOUSE GAS EMISSIONS BY
ADVANCING INDUSTRIAL ENERGY EFFICIENCY
2000—2015
INDUSTRIAL ENERGY MANAGEMENT TOOLS & RESOURCES
Energy Management Program Development
Guidelines for Energy Management – Guidance for developing a company energy management system.
Energy Program Assessment Matrix – Tool to evaluate a company’s energy program.
Facility Energy Management Assessment Matrix – Tool to evaluate a site’s energy management practices.
Energy Management Assessment Matrix for Small Companies – Simplified version of the matrices.
Teaming Up To Save Energy – Guidance on how to build an energy team.
Benchmarking To Save Energy – Guidance on how to benchmark a site’s energy performance.
Energy Strategy for the Road Ahead – Guidance on developing an advance energy strategy and related strategic energy management pro-
gram.
Energy Treasure Hunt Guide – Guidance for finding low and no cost savings opportunities.
Technical Resources & Tools
Energy Guides – Technical guides for finding energy savings in specific sectors’ plants.
Small and Medium Sized Manufacturers’ Guide – Energy management guidance for small to mid-sized manufacturers.
Plant Energy Performance Indicators – Sector-specific plant energy performance benchmarking tools.
Energy Tracking Tool – Energy tracking & goal setting tool for manufacturing sites and companies.
Industrial Service & Product Providers – Case studies of successful energy projects through the assistance of industrial service and product
providers.
Partner Profiles – Case studies on successful energy management strategies and projects.
Quick Converter – Tool for converting most common fuels and units to source mmBTUs.
Industrial Insights – Summary information and data on selected industrial sectors’ energy use, performance, and greenhouse gas emissions.
Networking & Training
Annual Partner & Focus Meeting – Yearly meeting for energy managers from partner companies and industrial focuses.
Partner Web Conference Series – Information sharing by leading companies on energy management.
Brown bags – Quarterly partner web conferences with presentations on hot topics in energy management.
On-line trainings –Training on selected ENERGY STAR tools & resources offered through remote learning platforms
Communication Resources
Bring Your Green to Work – Resources for promoting energy efficiency to employees.
Plant Poster Series – Customizable posters to raise awareness on energy management.
Communication Tool Kit – Ready-to-use resources for promoting energy efficiency.
Recognition
ENERGY STAR Partner of the Year – Annual award for outstanding energy achievements and commitment to energy management.
ENERGY STAR Plant Certification – Awarded to qualifying plants for superior energy performance nationally.
ENERGY STAR Challenge for Industry – Recognizes sites that achieve a 10% reduction in energy intensity within 5 years. The Challenge for
Industry is open to any manufacturing plant
16
REDUCING GREENHOUSE GAS EMISSIONS BY
ADVANCING INDUSTRIAL ENERGY EFFICIENCY
2000—2015
REFERENCES
1. US Census Bureau, 2013 Annual Survey of Manufacturers and Federal Reserve Bank of St. Louis (https://research.stlouisfed.org/fred2/
series/VAPGDPMA)
2. U.S. Environmental Protection Agency, Introducing … The Green Lights Program EPA 430-F-93-050, December 1993
3. U.S. Environmental Protection Agency, ENERGY STAR® Products: 20 Years of Helping Americans Save Energy Save Money And Protect
the Environment EPA 430-K-12-001, March 2012.
4. U.S. Environmental Protection Agency, Office of Air and Radiation, Climate Protection Partnerships Division, National Awareness of ENER-
GY STAR® for 2013: Analysis of 2013 CEE Household Survey, 2014.
5. Interbrand, Building a Powerful and Enduring Brand: The Past, Present, and Future of the ENERGY STAR® Brand, June 2007.
6. U.S. Environmental Protection Agency, Celebrating a Decade of ENERGY STAR Buildings, 1999-2009, 2010.
7. U.S. Environmental Protection Agency Climate Protection Partnership Division, 2000 Annual Report The Power of Partnerships ENERGY
STAR® and Other Voluntary Programs, EPA 430-R-01-009, July 2001
8. U.S. Environmental Protection Agency 2001
9. Elizabeth Dutrow, “Protecting the environment and influencing energy performance within process industries.” In Energy Management and
Efficiency for the Process Industries, ed. A Rossiter and B. Jones. 81-92. Hoboken, NJ: John Wiley and Sons. 2015
10. U.S. Environmental Protection Agency Climate Protection Partnership Division, ENERGY STAR® and Other Voluntary Programs 2001 An-
nual Report, EPA 430-R-02-010, August 2002
11. Gale Boyd and Walt Tunnessen, Plant Energy Benchmarking: A Ten Year Retrospective of the ENERGY STAR Energy Performance Indica-
tors (ES-EPI), 2013 ACEEE Summer Study on Energy Efficiency in Industry, August 2013
12. Gale Boyd , A Method for Measuring the Efficiency Gap between Average and Best Practice Energy Use: The ENERGY STAR Industrial
Energy Performance Indicator, Journal of Industrial Ecology 9(3): 51-65, 2005
13. Boyd and Tunnessen 2013
14. Gale Boyd, Elizabeth Dutrow and Walt Tunnessen, The evolution of the ENERGY STAR® energy performance indicator for benchmarking
industrial plant manufacturing energy use, Journal of Cleaner Production 16(6): 709-715, 2007.
15. Boyd and Tunnessen 2013
16. Walt Tunnessen, “Closing the Energy Management Gap,” in Environmental Quality Management, Volume 14, Number 1, pp 49 -57 2004
17. U.S. Environmental Protection Agency Climate Protection Partnership Division, ENERGY STAR® and Other Voluntary Programs 2003 An-
nual Report, EPA 430-R-04-011, September 2004
18. Walt Tunnessen, “Engaging Small Manufacturing Plants in Strategic Energy Management: Early Lessons Learned from the ENERGY STARfor Industry Partnership and Southside Plant Performance Project” 2015 ACEEE Summer Study on Energy Efficiency in Industry, August
2015
19. Marvin J. Horowitz, Technical Memorandum: Impact Evaluation of ENERGY STAR for the Industrial Sector in 2013, to EPA in January 2015.
20. Gale Boyd, Assessing Improvement in the Energy Efficiency of U.S. Auto Assembly Plants, Department of Economics, Duke University,
Working Paper EE 10-01 June 2010
21. Gale Boyd and Gang Zhang, Measuring Improvement in the Energy Performance of the U.S. Cement Industry, Department of Economics,
Duke University, White Paper, May 2011
22. Gale Boyd and Christian Delgado, Measuring Improvement in the Energy Performance of the U.S. Corn Refining Industry, Department of
Economics, Duke University, White Paper, July 2012
17

Document Number 430-R-15-006
Office of Air Programs—Climate Protection Partnership Division
November 2015