reducing emissions from the ga state vehicle fleet
TRANSCRIPT
Reducing Emissions from the GA State Vehicle Fleet
Formulation and Application of a Vehicle Replacement Model
Caleb WeedMaster’s of Sustainable Energy & Environmental Management Capstone Project

Introduction
● Research question: How much would it cost to reduce CO2 emissions from public vehicles?
● 28% of GHG emissions came from transportation sector in 2018 (EPA)
● State fleet data acquired via Open Records Request
● Calculated life-cycle emissions for Georgia’s publicly owned and operated light-duty cars,
SUVS, and PUTs
● Designed a vehicle replacement model to make fleet management decisions and quantify
emissions abatement costs for different market scenarios, demonstrating which policy
mechanisms are most important for low-emissions vehicles

The Georgia State Fleet
11,000 4,000 2,000
● Purchased, leased, rented● 20,264 vehicles● 16,929 light duty (< 10,000 lbs)● 957 medium duty (< 26,000 lbs)● 2,378 heavy duty (> 26,001 lbs)
● Only 94 hybrids, PHEVs, & EVs
15 million gallons
211 million miles

Cleaning the Dataset
● Focus on light-duty vehicles to refine analysis
● Vehicles lacking fuel consumption or VMT data omitted
● Lack of telematics
● Fire, medical, emergency, law enforcement, and off-road vehicles omitted
● 9,031 vehicles analyzed
3,325 cars 1,139 SUVs 4,567 PUTs

Baseline Methodology & Emissions
● Missing CO2 was calculated via model-specific per-mile emissions rates (FuelEconomy.gov)
○ Operation conducted for 1,026 vehicles
● Upstream fuel pathway emissions calculated using GREET lifecycle model
○ Gasoline (E10), CNG, LNG, flex fuel (E85)
● Upstream vehicle pathways emissions also via GREET
○ Engine types: ICE, EV, PHEV, natural gas
Tailpipe Fuel Vehicle Total
39,217 t 14,998 t 3,119 t 57,336 t

Vehicle Replacement Model
● Spreadsheet model selects most economic new replacement vehicles to purchase each year
○ Assumed 15 year operational lifetime, modelled lifecycle of vehicles until MY2030
○ Tesla Model 3, Nissan Leaf, Toyota Prius, Kia Forte, Hyundai Kona (EV), Toyota RAV4,
Mazda CX-5, Honda CRV, Chevy Silverado, Ford F-150, Ford F-150 Diesel, Toyota Tacoma,
Rivian R1T (MY2021+)
● Increased demand modelled with increased VMT, not increased vehicle count (1% per year)
● MSRP +2% ICE, -8% EVs until 2025 (price parity)
● MPG +1.5%; grams CO2 per mile -0.017%
● Assumed VMT replaced directly by new vehicles
● 3% discount rate

VRM - Formulation of Scenarios● 8 unique policy/market scenarios● Filled boxes indicate high values used● Each scenario modelled for purchased to 2030, lifetime impacts to 2044● 88 executions

VRM - Optimization Function & Constraints

VRM - ExampleExample model run for S0 - 2030
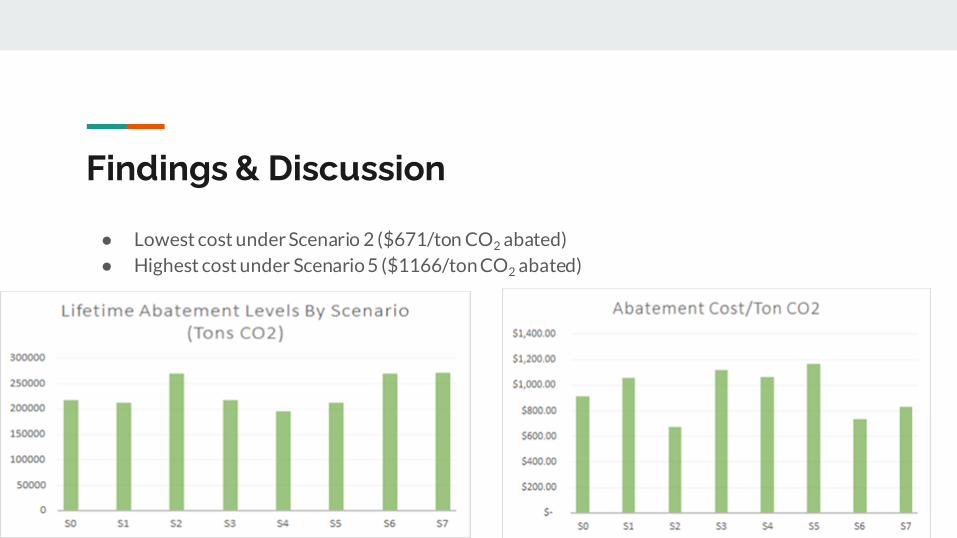
Findings & Discussion
● Lowest cost under Scenario 2 ($671/ton CO2 abated)
● Highest cost under Scenario 5 ($1166/ton CO2 abated)
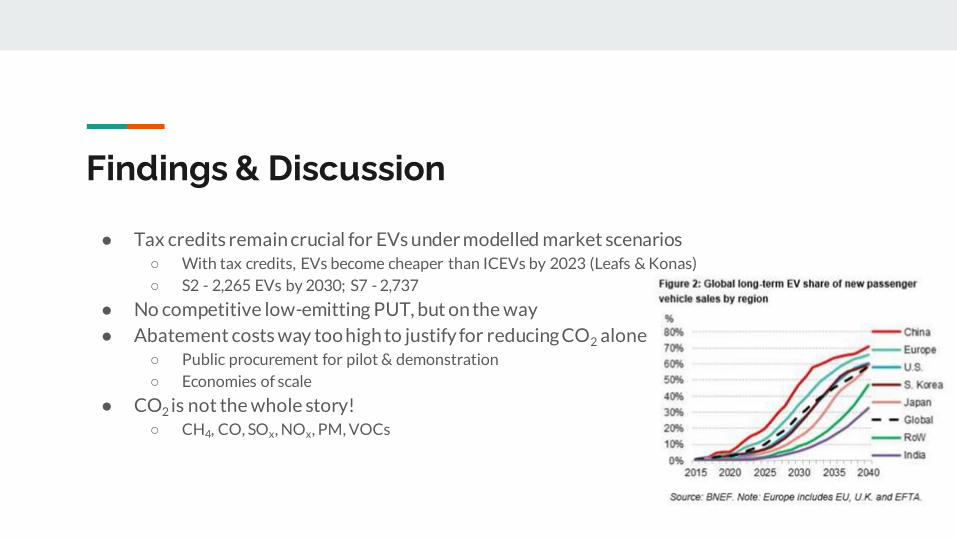
Findings & Discussion
● Tax credits remain crucial for EVs under modelled market scenarios○ With tax credits, EVs become cheaper than ICEVs by 2023 (Leafs & Konas)
○ S2 - 2,265 EVs by 2030; S7 - 2,737
● No competitive low-emitting PUT, but on the way
● Abatement costs way too high to justify for reducing CO2 alone○ Public procurement for pilot & demonstration
○ Economies of scale
● CO2 is not the whole story!○ CH4, CO, SOx, NOx, PM, VOCs
Next Steps...
● Telematics device deployment for more dynamic modelling of emissions from on-road
activity
○ Could help identify specific vehicle activities that should be targeted for
electrification, diesel, hybrid
● Re-visit and update as electric trucks come on the market
○ Ford F-150 EV in MY2022
● Attempt to quantify benefits of public procurements on EV technology costs
● Potentially expand to include M/HD vehicles as alternative technologies become available
in that space

Thanks for a great year!