reducing crime in durban a victim ... - iss … · the institute for security studies has conducted...
TRANSCRIPT

2011/04/15 12:50 PMUntitled Document
Page 1 of 72file:///Users/mbadenhorst/Documents/websites/iss/pubs/Monographs/No58/Mono58Full.html
REDUCING CRIME IN DURBANA VICTIM SURVEY AND SAFER CITY STRATEGY
LIST OF ILLUSTRATIONS
ACKNOWLEDGEMENTS
AUTHORS
FOREWORD
PREFACE
EXECUTIVE SUMMARY
PART 1 A SAFER CITY STRATEGY FOR DURBAN
Chapter 1THE STRATEGY DEVELOPMENT PROCESS
Chapter 2THE DURBAN SAFER CITY STRATEGY: 2000
PART 2 RESULTS OF THE DURBAN VICTIM SURVEY
Chapter 3INDTRODUCTION
Chapter 4SURVEY METHODOLOGY
Chapter 5THE EXTENT OF CRIME
Chapter 6REPORTING CRIME AND PERCEPTIONS OF THE POLICE
Chapter 7CRIME PROFILESBurglaryRobberyCar theftCar-hijackingAssault
Chapter 8CHANGES IN BEHAVIOUR AFTER VICTIMISATION
Chapter 9TYPES OF PROTECTION USED FOR THE HOME
Chapter 10PERCEPTIONS OF VICTIM SUPPORT
Chapter 11PERCEPTIONS OF SAFETY
Chapter 12
2011/04/15 12:50 PMUntitled Document
Page 2 of 72file:///Users/mbadenhorst/Documents/websites/iss/pubs/Monographs/No58/Mono58Full.html
PERCEPTIONS ABOUT HOW TO SOLVE CRIME IN DURBAN
Chapter 13CONCLUSION
NOTES
LIST OF ILLUSTRATIONS
FIGURE 1Target settlement sample and realised sample
FIGURE 2Crime levels in 1997
FIGURE 3Rates at whcih various crime types were reported to the police
FIGURE 4Victims who had insurance coverage for stolen goods
FIGURE 5Victims who were satfisfied with the way police responded when a crime was reported
FIGURE 6General views of police performance
FIGURE 7Perceptions of policing, by race
FIGURE 8Perceptions of policing, by residential area
FIGURE 9Use of violence and threats during the course of a burglary
FIGURE 10Where robberies occurred
FIGURE 11Where vehicle thefts took place
FIGURE 12Type of protection used against vehicle theft
FIGURE 13Where hijackings took place
FIGURE 14Where assaults occurred

2011/04/15 12:50 PMUntitled Document
Page 3 of 72file:///Users/mbadenhorst/Documents/websites/iss/pubs/Monographs/No58/Mono58Full.html
FIGURE 15Weapon used during assaults
FIGURE 16Behaviour changes after burglary and whether these improved feelings of safety, by race
FIGURE 17Behaviour changes after assault and whether these improved feelings of safety, by race
FIGURE 18Behaviour changes after car theft and whether these improved feelings of safety, by race
FIGURE 19Behaviour changes after hijacking and whether these improved feelings of safety, by race
FIGURE 20Victims who had heard of support services, by crime type
FIGURE 21Victims who had used support services, by crime type
FIGURE 22Victims who thought support services would have been useful,by crime type 94
FIGURE 23How safe people felt walking in their areas during the day, by race
FIGURE 24How safe people felt walking in their areas after dark, by race
FIGURE 25How safe people felt walking in their areas during the day, by residential area
FIGURE 26How safe people felt walking in their areas after dark, by residential area
TABLE 1Demographic profile of the survey sample
TABLE 2Sample and overall victimisation rates, 1993-1997
TABLE 3People who reported actual and attempted victimisation in 1997 and between 1993-1997
TABLE 4Percentage of people who were victims of actual and attempted crimes, 1993-1997
TABLE 5

2011/04/15 12:50 PMUntitled Document
Page 4 of 72file:///Users/mbadenhorst/Documents/websites/iss/pubs/Monographs/No58/Mono58Full.html
Percentage of people who were victims of actual and attempted crimes, 1997
TABLE 6Type of weapons used during burglary, by race
TABLE 7Type of weapons used during robbery, by race
TABLE 8Types of protection measures used, by race
TABLE 9Type of support that victims would have liked
TABLE 10Parts of the city believed to be the most unsafe, by race
TABLE 11What people feared the most about crime
TABLE 12What people thought the government should do to make Durban safer, by race
TABLE 13What the government should do, other than policing, to make Durban safer, by race
TABLE 14What individuals said they could do to make Durban safer, by race
ACKNOWLEDGEMENTS
The European Union and the Royal Netherlands Embassy for funding the survey and the publicationof the monograph.
DRA Development, and in particular Aki Stavrou and Clare Hansmann for conducting the survey,processing the data and assisting in analysis.
The Durban Safer City team.
Rory Robertshaw and Euníce Reyneke for their patience throughout a long production process.
Mark Shaw who initiated the survey, helped analyse the data and write early sections of themonograph.
AUTHORS
Rory Robertshaw is an expert consultant for the United Nations Centre for Human Settlements working invarious African cities. He has facilitated public-private partnerships at local government level, includingoperationalising the Metropolitan Trading Company where he filled the position of acting chief executiveofficer. He also worked for the STREETS Community Development Association in Cape Town, the Centre forOpportunity Development, the Safer Cities project in Greater Johannesburg, and Capital B Management. Hehas been a speaker and facilitator at international conferences and is a published author.

2011/04/15 12:50 PMUntitled Document
Page 5 of 72file:///Users/mbadenhorst/Documents/websites/iss/pubs/Monographs/No58/Mono58Full.html
Antoinette Louw is the head of the Crime and Justice Programme at the ISS. She joined the ISS in August1997 as a senior researcher. She has been conducting research and has written extensively on issues ofpolitical violence and crime since joining the University of Natal’s Centre for Social and DevelopmentStudies in 1991, where she was also the editor of the two quarterly publications, Indicator SA and Crimeand Conflict. Antoinette has a Masters degree in Political Studies from the University of Natal.
Dr Mark Shaw is a research fellow at the South African Institute for International Affairs (SAIIA) at theUniversity of the Witwatersrand in Johannesburg. He has written widely on issues related to policing andcrime control in Southern Africa. Shaw worked previously at the Centre for Policy Studies, Institute forSecurity Studies and the Department of Safety and Security.
Mduduzi Mashiyane worked at Codesa in 1993 as a member of the support staff of the multipartynegotiations. During 1993-1994, Mdu was a facilitator on the RDP Presidential Lead Project for the KathorusPeace Committee. In 1995, he took up the position as co-ordinator of the Community Safety Unit of theInstitute for Democracy in South Africa (Idasa), which also encompassed the position of co-ordinator of theGreater Pretoria Crime Prevention Unit. In 1999, Mdu joined the Durban Safer City Project as project co-ordinator until January 2001. He is currently pursuing further studies.
Sid Brettell served as a duty officer in the Flying Squad, a station commander and a divisional recruitmentofficer in the South African Police in Durban. He joined the newly established Durban municipal securitysection in 1981 and rose to the position of chief security officer. He was appointed director of humanresources in the Community Service Unit in 1991 and established the Durban Safer City Project inSeptember 1999. Sid has also been a member of the South African Security Association (SASA) since 1982and has served as branch chairperson for SASA KwaZulu-Natal on the SASA National Council, and also asa governor of the South African Institute of Security. He completed his Master degree in BusinessAdministration in 1985.
FOREWORD
The City of Durban commits itself to work in partnership with business, civil society and community-basedstructures to support the police and the criminal justice agencies to create the safest metropolitan city onthe continent.
We present the Safer City Strategy as a plan and framework to guide our joint action in order to achievethis goal. The strategy is a product of many months of consultations with stakeholders in the areas ofsafety and security throughout the Durban metropolitan area. It is as much a plan of action as it is astatement of the status of current work and existing programmes with our partners. We must build on thisand strive harder to create safer communities in all parts of our city. The Safer City Strategy is informed bythe best national policy and international practice of cities around the world meeting in the challenges ofurban safety. Development lies at the heart of the strategy. We have prioritised economic development and,with our partners in business, are working to develop a framework to attract investment and grow oureconomy. For this reason, the business vision for Durban was formulated. The Best City PracticeCommission has recognised the need to improve safety as a prerequisite for investment and economicgrowth.
The Safer City Strategy recognises that crime is not a matter to be dealt with by the police alone. We mustaddress the social and environmental factors that contribute to criminality. These aspects are addressed inthe strategy and the city is engaged in a number of programmes focused on these factors. We call on ourpartners in the communities, business and public sector to co-operate with us in realising the vision of asafer city and in maintaining Durban’s established tradition as a winning city.
Let us work together to create a safer city for all.
Mayor Obed MlabaMayor: Durban Metropolitan Council
Councillor ShabalalaChairperson: Safer City Steering Committee
Mayor N Dube
2011/04/15 12:50 PMUntitled Document
Page 6 of 72file:///Users/mbadenhorst/Documents/websites/iss/pubs/Monographs/No58/Mono58Full.html
Chairperson: Unicity Committee
PREFACE
Accurate information about crime is essential for the planning, design and monitoring of a crime reductionstrategy. Information is needed not only about crime levels, but also about the resources and capacityavailable in an area to assist in crime reduction projects, as well as the views of the public about crime andsafety. Victim surveys are one way of gathering this information. They supplement police statistics byproviding data on unreported crimes. Victim surveys also show who is most at risk of becoming a victimand what the public think the priority issues are in their area.
The Institute for Security Studies has conducted four city victim surveys in recent years to help citygovernments when planning their crime reduction strategies. Surveys were conducted in Johannesburg(July 1997), Durban (December 1997), Cape Town (February 1998) and Pretoria (April 1998). The ISS hasmore recently conducted victim surveys in two local council areas, Highveld Ridge in Mpumalanga (June2000) and Uitenhage in the Eastern Cape (July 2000). These surveys are also being used to design crimereduction strategies for the councils.
This monograph is the first to include both the victim survey results and the crime reduction strategy whichthe survey findings helped to inform. It provides an example of the initial steps in the difficult task ofreducing crime in South Africa’s cities — gathering and analysing information and using this to design astrategy that is focused, clear and measurable.
The aim of the monograph is to assist those involved in crime reduction by broadening the understandingof crime in one particular city and by providing a practical example of a crime reduction strategy. This iscomplemented by some background details on its development and how it will be implemented. It is hopedthat by documenting and sharing experience in this manner, the many promising initiatives under way inSouth Africa will be encouraged and improved.
Antoinette LouwHead: Crime and Justice Programme, Institute for Security Studies, PretoriaJuly 2001
EXECUTIVE SUMMARY
The Durban Safer City Project was established in October 1999 following discussions between the city andofficials from the United Nations Centre for Human Settlements (Habitat) who were setting up similarinitiatives in other parts of the world. The lack of safety and security was identified as the main threat to thecity’s ability to attract investment and implement its economic growth strategy.
After extensive consultation both inside and outside of the council, the strategy was compiled by the SaferCity Project co-ordinators with the help of the Independent Projects Trust (IPT). The strategy was officiallyadopted by the Unicity Committee on 11 October 2000 and implementation could therefore begin. TheDurban Safer City Strategy 2000 has three strategic components, each complementing the other:
effective policing and crime preventiontargeted social crime preventionenvironmental design.
The strategy development process was preceded by a victim survey conducted by the Institute for SecurityStudies. The survey results supplemented the official police crime statistics and provided data on people’sexperiences of crime, perceptions of safety and policing, and suggestions on how to make the city safer.The Durban victim survey was the third in a series of six city victim surveys undertaken by the ISS between1997 and 2000. The ISS aimed to assist metropolitan and local government practitioners to develop crimereduction strategies.
In total, 1 884 people were interviewed in December 1997 across the Durban metropolitan area. Of these,59% said that they had been a victim of at least one crime between 1993 and 1997. The risk of victimisation
2011/04/15 12:50 PMUntitled Document
Page 7 of 72file:///Users/mbadenhorst/Documents/websites/iss/pubs/Monographs/No58/Mono58Full.html
varied according to race, gender and age: women were more at risk than men; African and colouredresidents were more likely to be victims than Asians and whites; and the youngest and oldest residentswere more at risk than other age groups. Burglary followed by robbery were the two most prevalent crimetypes in the Durban metropolitan area.
A majority of victims said they reported the most recent incident of murder, car theft, hijacking, burglaryand sexual offence to the police. Insurance coverage was not the main reason for reporting. Theoccurrence of violence and injuries, and whether or not a victim knew the offender also played a role.Levels of satisfaction with police service when reporting a crime were low: only 38% of victims said theywere satisfied.
Victims tended to change their behaviour to reduce the chances of victimisation in future. With theexception of assault victims, most changed their behaviour after victimisation. Typically, African victimswere less likely to adopt precautionary measures than white or Asian victims. This applied across all typesof crime and could relate to the cost of improving security or changing lifestyle patterns. Those who rely onpublic transport cannot always change their routes or purchase a car to avoid victimisation. Although manyvictims did change their behaviour, on average, less than half of them said they felt safer as a result.
Victim support is a crucial part of helping people to deal with the impact of crime. The type of support thatvictims favoured the most was effective policing and emotional support. However, needs differed acrossrace. African and white victims were most likely to request emotional support followed by better policing.More white victims wanted advice, information and counselling than other victims. Of concern was that lessthan a third of victims were familiar with any support services and less than a quarter had used suchservices. Victims of sexual offences were most likely to have heard of these services, to have used them,and to believe that they would be useful.
Based on perceptions of policing and other types of protection, the poor were disadvantaged in terms oftheir access to safety. The survey indicated that 21% of people had no protection for their homes at all.White (and wealthier) residents were much more likely to use physical security measures than African andcoloured residents. For example, 63% of whites and 46% of Asians had high fences or walls compared toonly 1% of Africans. Those most at risk of crime therefore had the least protection for their homes. Mostwhites (80%) and Asians (60%) said that they felt safer as a result of using these forms of protection.Coloured and African residents were less positive.
Perceptions of policing differed significantly across the metropolitan area. Just over half of all respondentsthought the police were doing a poor job at controlling crime in Durban. White respondents and those livingin the inner city were more likely to be satisfied than Asians, Africans and those living in informalsettlements. The quality of policing appeared to be better in the wealthier parts of the city and those areaspoliced by the former Durban City Police such as the inner city area and surrounding (largely white)suburbs.
Despite the police’s positive rating by inner city residents, 53% of all Durban residents thought that theinner city was the most unsafe part of the metropolitan area. Coloured, white and Asian respondents weremuch more likely to hold this view than were Africans. Fear of crime in the inner city is no doubt based ona range of concerns, not all of which relate to crime or policing, such as congestion, overcrowding andlitter. The risk of crime may also be unjustifiably associated with particular groups of people such as streetchildren and street traders.
Feelings of safety varied according to where people lived. During the day, only 49% of those living in theinner city and 51% in informal settlements felt safe, compared to 78% of those in the suburbs. After dark,only 13% in informal settlements felt safe compared to 35% in the suburbs. Higher levels of fear in informalsettlements are probably caused by the general lack of services and infrastructure. This increases the riskof victimisation in an environment already lacking in basic policing and other systems of protection andsupport.
The concept of ‘safety’ was clearly associated with policing and justice. Although the importance of jobcreation and development was recognised, most respondents thought that better policing and criminaljustice would improve safety in the city. The majority (80%) said that the government should improve theprovision of criminal justice, in particular, the police. White respondents were three and a half times morelikely to call for harsher punishment than Africans. When asked what they could do to improve their ownsafety, the most common response among Africans and whites was ‘work with the police’. People’s

2011/04/15 12:50 PMUntitled Document
Page 8 of 72file:///Users/mbadenhorst/Documents/websites/iss/pubs/Monographs/No58/Mono58Full.html
willingness to work with the police and share responsibility for their own safety is encouraging.
PART 1 A SAFER CITY STRATEGY FOR DURBAN
Chapter 1THE STRATEGY DEVELOPMENT PROCESS
The establishment of the Durban Safer City Project was motivated by the Durban Metropolitan Council’scommitment to make Durban the safest city in Africa. The Best City Practice Commission, set up by thecouncil, identified safety and security as the number one threat to the city’s ability to attract investment andimplement its economic growth strategy. Making the city safer was thus singled out as a necessarycondition for growing the city’s economy and attracting investment and tourism. Tourism, in particular, isthe major economic generator for the city.
The Safer City Project was established in October 1999 following discussions between the city and officialsfrom the United Nations Centre for Human Settlements (Habitat) who visited Durban and proposed apartnership that would link the city with similar initiatives in other cities in the world. One of the first tasksof the project was to develop a safer city strategy that would provide the framework to guide the city’sinitiatives and partnerships for safety.
The strategy development process was preceded by a victim survey conducted by the Institute for SecurityStudies (ISS). Undertaking this survey meant that official crime statistics recorded by the South AfricanPolice Service (SAPS) could be supplemented with data reflecting citizens’ experiences of crime — many ofwhich were not reported to the police. The survey also recorded ordinary people’s perceptions of crime andtheir feelings of safety.
Other research reports were collected and reviewed to complete the picture of the nature and extent ofcrime in the Durban area. Part of this assessment included an investigation of the causal factors of crimethat would have to be addressed in the strategy. Existing programmes and service providers that couldassist the Safer City Project were also identified.
Extensive consultation was subsequently undertaken with appropriate structures and organisations bothinside and external to the council. Through this process, many issues were identified that had to beaddressed in the strategy. The co-ordinators of the Safer City Project then had to prioritise the key issuesfor inclusion in the final strategy.
A framework consisting of the most important issues was developed and discussed with key roleplayers.The framework was subsequently accepted by the decisionmaking structures in council and served as thebasis for developing a more detailed strategy. The strategy had to be a simple plan with clear roles andresponsibilities identified for the various agencies and with realistic and achievable objectives. Althoughcrime prevention is implemented at the local level, the strategy had to be broadly applicable to most placesin the Durban metropolitan area.
The strategy was developed by the Safer City Project co-ordinators with the assistance of the IndependentProjects Trust (IPT), which was contracted for this purpose. The co-ordinators presented the draft strategyto the various committees in council for consultation and input. The strategy was officially agreed to andadopted by the Unicity Committee on 11 October 2000 and implementation could begin.
While the strategy was being developed, various projects were implemented and piloted. These projectsinformed the strategy development process and are reflected in the strategy document. A majordevelopment was the establishment of the Metro Police on 1 July 2000, which made Durban the first city inthe country with a metropolitan police service. The Metro Police, in partnership with the SAPS, will play animportant role in the implementation of the strategy.
The strategy also recognised existing best practices in the Durban area and recommended that theseshould be extended to other areas where they will make a difference. New projects and new ways ofapproaching some issues were also recommended in the strategy. The strategy has three key components,each of which will be led by an official appointed on a full-time basis when implementation begins.

2011/04/15 12:50 PMUntitled Document
Page 9 of 72file:///Users/mbadenhorst/Documents/websites/iss/pubs/Monographs/No58/Mono58Full.html
The strategy was publicly launched in Durban on 12 November 2000. Widespread support for the strategyhas been evident among politicians, the SAPS, the business sector, community organisations, non-governmental organisations (NGOs) and practitioners from other cities in South Africa and abroad. Thecouncil has committed itself to its implementation and has called on its partners in business and civilsociety to play an active role in the process. Discussions are already under way between the SAPS and theMetro Police to establish ways of co-operating and co-ordinating activities to ensure that the strategy isimplemented and that the vision for a safer Durban is achieved.
Chapter 2THE DURBAN SAFER CITY STRATEGY: 2000
Introduction1
Durban is a thriving tourist and commercial centre in KwaZulu-Natal, with a large diverse population andrich cultural heritage. It is home to South Africa’s busiest port and an important industrial hub. The city haswon numerous awards including the 1999 Global Achievement Award as one of the world’s ten bestinternational cities — the only recipient on the African continent.
However, like so many other cities in the world, Durban is concerned with the growing threat of crime andviolence and its impact on the safety and security of its citizens. Under current circumstances, the criminaljustice institutions at national and provincial level are unable to stop or even control the escalation of urbanviolence.
Making Durban safe both now and in the future requires a city wide crime prevention strategy. Localgovernment has both the capacity and mandate to initiate and implement this strategy. This mandate issupported by numerous national policy documents including the White Paper on Safety and Security 1999-2004, "In Service of Safety" (September 1998) which states that:
"Local government has a key role to play in ensuring an environment less conducive to crimeand is well placed, provided the required resources and capacity are available, to design andimplement programmes targeted at specific crime problems and groups at risk."
This is supported by the mission statement of Durban Metro, which makes a commitment to undertakeprocesses to make the Metro area a safe and secure place. Local government’s lead role in crimeprevention is further encouraged by local communities as demonstrated by Durban Metro Quality of LifeSurveys, in which citizens were asked their opinions on crime in the Metro area. The respondents werecritical of the Council’s failure to achieve "safety" and "full employment" at both the central andneighbourhood levels. Four out of five respondents said that crime, corruption and mugging were thebiggest problems facing the city. If the City Council is to deliver an appropriate and effective service, crimeprevention initiatives must be a key component. Crime prevention means many things to different people,but essentially it is about stopping crime before it happens rather than reacting afterwards.
Best Practice Commission
The Durban Metro Council aims to improve the quality of life for all residentsby making Durban a world class city where manufacturing, tourism, financialinstitutions and enterprises flourish. For this purpose, the Councilestablished a Best Practice City Commission to identify and find ways toattract new investment to the region. This commission acknowledged thatthe unacceptable levels of crime were a key hindrance in achieving this andthat a reduction in crime was a priority, otherwise the Best PracticeCommission’s recommendations will represent an exercise in futility.

2011/04/15 12:50 PMUntitled Document
Page 10 of 72file:///Users/mbadenhorst/Documents/websites/iss/pubs/Monographs/No58/Mono58Full.html
This is a paradigm shift from the traditional view of crime prevention as a police activity which focuses onthe perpetrator. This is supported by international research which shows that purely reactive strategieshave an insufficient impact on crime levels. More recently best practice has shown that a holistic approachis needed to create a crime free society. For example, in Rochdale, England, close cooperation betweenprobation services, police, and social services within a housing project led to a 75% reduction in burglaries.
Cost effectiveness
Preventing a young person from offending through school and recreationalprogrammes is less costly than police investigations, court procedures,replacing damaged property or stolen goods, lost work time owing toinjuries and trauma and overburdened health facilities.
Crime prevention is a more cost effective option than dealing with the aftermath of crime even though it issometimes perceived that a tougher reaction by police and courts is the best response. Effective crimeprevention would boost investor confidence in the city with a direct impact on prosperity and employmentin Durban. Low crime levels are one of the global indicators for stability and social integration. This plays arole in attracting new investments and in maintaining current levels of investments, thereby ensuring theretention of a skilled workforce and contributing to improvements in the quality of life for citizens.
Economic and social injustices of the past must also be addressed. International research commonlysuggests that the post-apartheid crime levels in South African cities can be partly attributed to a longhistory of social inequality and exclusion and a lack of institutional and social control. Basically, insufficienturban services and exclusion encourage crime and violence. The White Paper on Local Government (March1998) supports a strategic response through social and economic justice:
"Local government should promote integrated spatial and socio-economic development that issocially just and equal for everyone in the community. This requires that crime preventionprinciples be integrated with other aspects of local development, including economicdevelopment."

2011/04/15 12:50 PMUntitled Document
Page 11 of 72file:///Users/mbadenhorst/Documents/websites/iss/pubs/Monographs/No58/Mono58Full.html
Turning the tide on crime also requires a critical mass of people who share the same strategy. So, thestrategy must make crime prevention a core function of city departments, employees and the generalpopulation.
A good strategy should develop a critical mass of crime prevention tactics. Utilising a large range of tacticscoordinated within a single strategy will naturally meet with more success than isolated small projects. Thediagram below shows that crime is a product of many factors, each of which must be addressed through aholistic multi-agency approach.
Durban’s crime prevention strategy takes into account existing information and research. As part of thedevelopment process, a safety audit was conducted through a review of current research documentation.
Through this process the ingredients for successful crime prevention have become evident and includepreventative, inclusive and multifaceted approaches which address the inequalities which contribute to highcrime rates.
This strategy was also guided by lessons drawn from local urban development and urban renewal projectsincluding those at Cato Manor and Warwick Junction as well as the Pilot Project on Safety at TransportNodes. Best practice identified included dealing with crime and security issues through an integratedapproach, one which is holistic, geographically specific and requires local ownership.
A local model
One of the projects that serves as a model for crime fighting strategies isthe ‘Greater Warwick Avenue and Grey Street Urban Renewal Project’ whichled to a drop in crime in a troubled inner city area. The target area makes upa large portion of the central business district and includes the main busstation, train stations, and taxi ranks through which 300 000 commuterspass daily. Elements of its success were providing a venue in the area thatincluded offices where multidisciplinary project teams from various citydepartments could work and meeting halls and rooms for ongoinginteraction between community members and city representatives. From

2011/04/15 12:50 PMUntitled Document
Page 12 of 72file:///Users/mbadenhorst/Documents/websites/iss/pubs/Monographs/No58/Mono58Full.html
there a multitude of successful projects were designed and implemented.
The role of the City in this effort is to both design and oversee the implementation of a crime preventionstrategy that employs a preventative, inclusive, multi-agency approach and addresses some of theinequalities that contribute to high crime rates. All of these factors are addressed within three strategiccomponents, each of which is detailed in the next section of the strategy document. These are:
effective policing and crime prevention
targeted social crime prevention
environmental design
These components should not be seen in isolation but should rather be seen as supporting andcomplementing each other. They are separated here for the clear identification of strategic objectives anddesired outcomes.
Effective policing and crime prevention
According to numerous surveys, the majority of the South African population believes that better policingand criminal justice are essential to their safety. People often report that seeing police members in publicdoing their jobs is reassuring.
In South Africa the fear of crime is serious and reducing the fear of crime can be as important as reducingor preventing crime itself. Therefore effective policing is also effective crime prevention and must be anintegrated part of the strategy. In this regard the City of Durban is in a unique position as the first city inSouth Africa to have a Metropolitan Police Service and the goodwill exists for the city to work closely andin conjunction with the South African Police Service (SAPS).
Effective policing
In a survey of women’s perceptions of safety, it was found that women donot feel secure in their own neighbourhoods and many feel unsafe in theirown homes. It was found that only 40% of women said they felt safe inpublic places and of these only a quarter said they always felt safe. In thissame survey, 74% of respondents felt that the government’s most importantrole in improving women’s safety was to provide better law enforcement andjustice.
The City also has the resources that can aid in improving the existing levels of service and in helping tocoordinate the various roleplayers. In terms of the South African Police Service Amendment Act theMetropolitan Police are responsible for:
policing road traffic and related lawspolicing of municipal by-lawsvisible policing and related crime prevention functions
These functions are complimentary to the much broader functions of the SAPS and together these two
2011/04/15 12:50 PMUntitled Document
Page 13 of 72file:///Users/mbadenhorst/Documents/websites/iss/pubs/Monographs/No58/Mono58Full.html
agencies are well placed to contribute to a safer city.
As can be seen from existing research, law enforcement is considered of primary importance to mostresidents of the city. An important aspect of the strategy is to ensure an effective level of police service.The performance of the Metro Police, in partnership with SAPS, is vital to this strategic objective.
Objective 1
To contribute to an improved policing service within the Durban Metro area.
Outcomes:
The Durban Metro Police and SAPS work closely together and actively participate in the legislatedjoint coordinating committee with other criminal justice departments in order to have:
Aligned the Metro Police Plan with the SAPS Area Plan and to have coordinated joint activities.
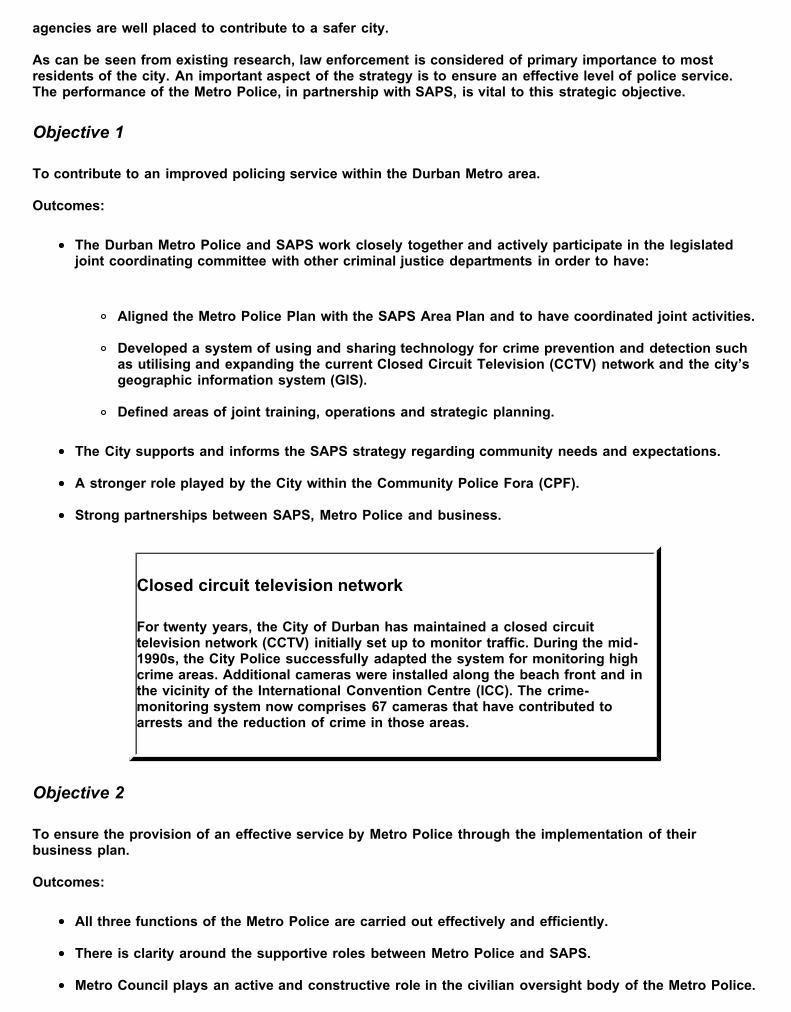
Developed a system of using and sharing technology for crime prevention and detection suchas utilising and expanding the current Closed Circuit Television (CCTV) network and the city’sgeographic information system (GIS).
Defined areas of joint training, operations and strategic planning.
The City supports and informs the SAPS strategy regarding community needs and expectations.
A stronger role played by the City within the Community Police Fora (CPF).
Strong partnerships between SAPS, Metro Police and business.
Closed circuit television network
For twenty years, the City of Durban has maintained a closed circuittelevision network (CCTV) initially set up to monitor traffic. During the mid-1990s, the City Police successfully adapted the system for monitoring highcrime areas. Additional cameras were installed along the beach front and inthe vicinity of the International Convention Centre (ICC). The crime-monitoring system now comprises 67 cameras that have contributed toarrests and the reduction of crime in those areas.
Objective 2
To ensure the provision of an effective service by Metro Police through the implementation of theirbusiness plan.
Outcomes:
All three functions of the Metro Police are carried out effectively and efficiently.
There is clarity around the supportive roles between Metro Police and SAPS.
Metro Council plays an active and constructive role in the civilian oversight body of the Metro Police.

2011/04/15 12:50 PMUntitled Document
Page 14 of 72file:///Users/mbadenhorst/Documents/websites/iss/pubs/Monographs/No58/Mono58Full.html
Support mechanisms are in place to ensure the delivery of service.
A system of training and education for members of the service is in place.
Active participation in the Provincial Asiphephe Road Safety Campaign.
Objective 3
To improve the enforcement of by-laws and promote a sense of lawfulness and order.
Outcomes:
Consolidated and standardised by-laws throughout the Metro region.A priority enforcement list of by-laws that have the most impact.Set standards for enforcement levels and inform residents of the city.Support the criminal justice system and consider the establishment of ‘municipal courts’.A monitoring process to measure effectiveness.
Objective 4
To improve and expand community education regarding crime prevention.
Outcomes:
Effective school programmes delivered by Metro Police and SAPS.
Increased public education programmes and partnerships, outreach programmes and sharinginformation.
Distribution to communities of the crime prevention manual, ‘Making South Africa Safe’.
Crime prevention projects developed through the participation of councillors, local governmentrepresentatives, CPF’s and Neighbourhood Watch groups.
Objective 5
To improve the quality of crime information and analysis.
Outcomes:
Improved gathering, sharing, integration and analysis of information between agencies andstakeholders such as community police fora, business, and schools.
A process which ensures that analysis is fed back to constituencies and there is greater publicknowledge and use of this information.
Such information is used in crime prevention plans and initiatives.
Objective 6
To ensure a corruption free local government.
Outcomes:

2011/04/15 12:50 PMUntitled Document
Page 15 of 72file:///Users/mbadenhorst/Documents/websites/iss/pubs/Monographs/No58/Mono58Full.html
An action plan developed and initiated by a multi disciplinary team to attend to municipal malpracticeand prosecution of offenders and recovery of losses.
A process to oversee that tenders and contracts are justly awarded.
Strong financial control mechanisms.
Investigation of all allegations of malpractice involving city officials.
Targeted social crime prevention
While the criminal justice system looks at the effects of crime, social crime prevention focuses on itscauses and the social and economic conditions which contribute to criminal and violent behaviour.
Social conditions which promote crime are varied and further complicated by resource imbalances that werecreated and entrenched by the apartheid system. Substance abuse, street children, inadequate access toeducation, high levels of victimisation and a depressed job market have been identified as some of themain causes of a social condition which promotes the occurrence of crime and violent behaviour. Nowhereis a multi-agency approach more critical than in dealing with these adverse social conditions.
One focus of the social crime prevention strategy is the victim, who is often the first or only link whichpolice have to a perpetrator. International studies have shown that providing an improved victim serviceimpacts positively on the relationship between police and victims which, in turn, supports successful policeinvestigation of the crime.
Durban victim survey
The 1998 Durban victim survey examining the years 1993-1997 tells whymany crimes, especially those of a sexual nature, are never reported to thepolice. This distorts crime statistics and allows perpetrators of crime tofreely continue their cycle of violence. According to the survey, 59% of theresidents had been victims of crime during that period. In cases of sexualabuse, 60% did not know about any victim support agencies. Sixty-eightpercent of all victims described their experience with the police as negative.Only a few had heard, or were aware of victim support agencies locatedwithin Durban.
The social and economic inequalities that breed crime must be carefully addressed. Without development,growth and economic empowerment, the social conditions leading to crime are likely to persist.Perpetrators are usually male youths with very limited resources coming from deprived urban environments.They need centres which offer recreation opportunities, training, counselling and organised youth activities.Offering youth a secure environment where constructive activities take place could go a long way towardspreventing crime.
There are more than a thousand street children in Durban. Owing to the HIV-AIDS epidemic, the numberscould swell and strain social services as has been the experience in other African cities. The managementof street children is a strategic priority since they are children in need of care and are vulnerable to crime,exploitation and abuse. Most of these neglected youngsters lack social and practical skills which increasethe likelihood that they will participate in criminal activity. Since they congregate in business and touristdistricts they can intimidate residents and tourists to the detriment of the city’s economic growth.
Research has found an association between substance abuse and domestic violence, youth violence andneglected children. It can also create run-down areas of the city that further attract crime. ‘Sleazy’establishments have mushroomed in recent years to become centres of crime, drug and alcohol abuse and
2011/04/15 12:50 PMUntitled Document
Page 16 of 72file:///Users/mbadenhorst/Documents/websites/iss/pubs/Monographs/No58/Mono58Full.html
anti-social behaviour.
Studies have also shown that many schools within the city are unsafe and often become places for criminalactivity and recruitment. Drug dealing and gang violence represent only two concerns which challenge thesafety of some schools. Given that schools represent the places where young members of society begintheir training, it is imperative that they be made safe from criminal activity.
Objective 1
To foster relationships that enable greater support to victims of crime with an emphasis on women, childrenand the aged.
Outcomes:
The creation of a local victim support network under the auspices of the Provincial VictimEmpowerment Network that includes:
a data base and mapping of victim support services
informed staff and communities in regard to the existence of this data base
Training in victim support skills and knowledge made available to relevant city role-players.
Co-operation between the City and CPF structures to promote well managed crisis care centres.
Tourist access to information regarding available victim support services.
Objective 2
To reduce the level of drug and alcohol related harm.
Outcomes:
Support and foster partnerships with agencies dealing with drug and alcohol related problems.
A pilot project with licensed premises and taverners associations to reduce alcohol related crime andantisocial behaviour in and around their premises.
A joint operation by which the City can address the ‘sleazy hotel syndrome’.
Objective 3
To create a sustainable infrastructure for the effective management of street children.
Outcomes:
An expanded city role in co-ordinating projects which are aimed at sheltering street children.
A strong coalition with organisations involved in street children programmes.
Establishment of a local inter-departmental committee focusing on the needs and care of streetchildren.
The enforcement of laws and by-laws relating to street children.

2011/04/15 12:50 PMUntitled Document
Page 17 of 72file:///Users/mbadenhorst/Documents/websites/iss/pubs/Monographs/No58/Mono58Full.html
Ongoing training for specialised units at the Metro Police and SAPS.
An increase in the grant-in-aid provision to organisations providing shelter and reintegrating themwith parents and community.
Objective 4
To support local efforts to create safer school environments.
Outcomes:
Participation in the Community Alliance for Safe Schools (CASS), an alliance of departments andorganisations that works towards safe schools.
Stronger relations with Department of Education officials, specifically those assigned to the Cultureof Learning, Teaching and Service campaign (COLTS) and School Governing Bodies (SGB).
To have initiated a process to inform other roleplayers such as NGO’s, SGB’s, and teachers aboutcurrent City activities, including recreational opportunities.
A programme of visits by Metro Police and other municipal departments to schools for educationpurposes.
Objective 5
To increase opportunities for disadvantaged youth.
Outcomes:
The development of youth centres in disadvantaged areas providing training courses for youth at riskin order to develop skills, provide opportunities and improve self esteem.
A partnership between the local Department of Parks and Recreation, the provincial Department ofEducation and local communities to improve and provide sports fields and recreational facilities.
Holiday programmes for youth.
Objective 6
To foster economic growth and increase job creation.
Outcomes:
Provide support for the growth of small businesses through:
services provided by the Tekweni Business Development Centre
affirmative procurement
The building of community economic fabric by:
regenerating economic infrastructure in disadvantaged communities
creating appropriate support infrastructure (institutional and physical) for income generating

2011/04/15 12:50 PMUntitled Document
Page 18 of 72file:///Users/mbadenhorst/Documents/websites/iss/pubs/Monographs/No58/Mono58Full.html
activities in disadvantaged communities
ensuring involvement of local communities in development projects (including the use of locallabour)
Attract and facilitate new investment through:
improved investor service (reduction of red tape)
ensuring critical investor areas are well maintained and well run
targeted support for growth and employment creating sectors.
Environmental design
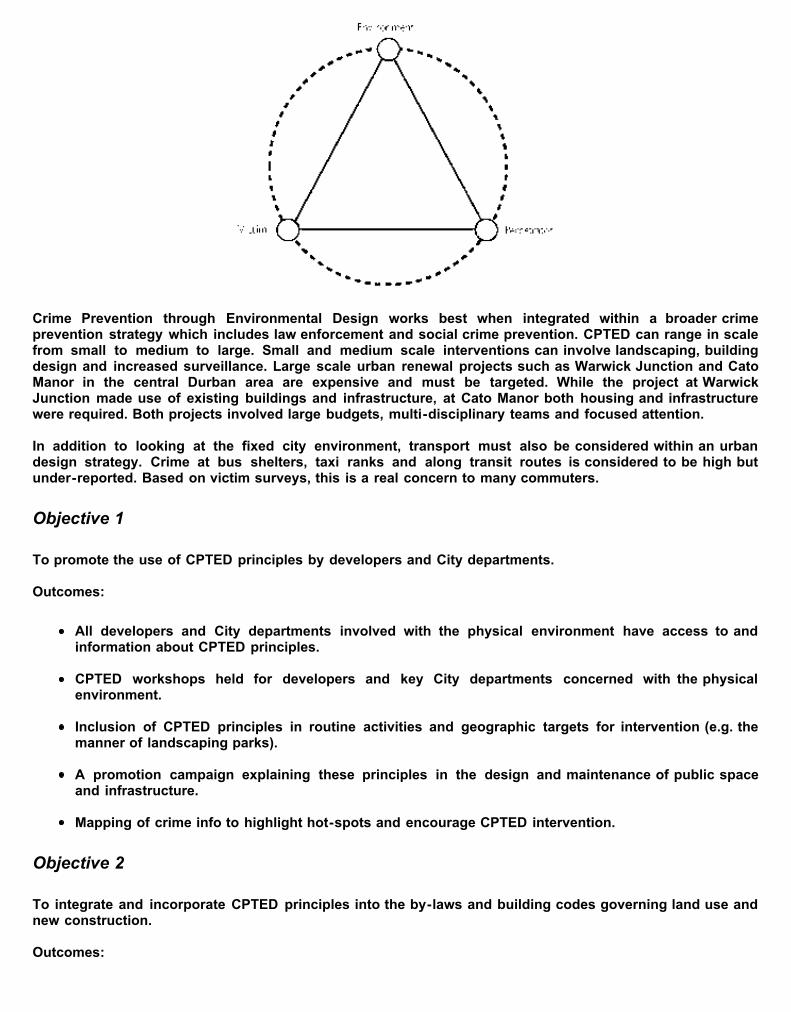
It is commonly recognised that for every crime there is a victim and a perpetrator, however the environmentin which the crime occurs is less often thought about. Interventions into the design of the environment canhelp to reduce the incidence of crime. Internationally, this strategic component is known as CrimePrevention Through Environmental Design or CPTED (pronounced sep-ted) and is being successfullyemployed in many cities worldwide.
CPTED is based on certain principles of architecture, landscaping, visibility and lighting, aesthetics and themarking of spaces that create greater public security both in real terms, and in terms of people feeling safein a location.
CPTED in Durban
At Warwick Junction, an underutilised bridge had been a site of highcriminal activity. After consultation with local traders and residents, marketstalls were alllowed to set up business along the length of the bridge,increasing both passive surveillance and legitimate uses. As a result, crimeat this site has been substantially reduced.
Implementing CPTED often starts by training those city employees who deal with the environment. Keydepartments then work together to incorporate CPTED principles into local government crime preventionplans, building codes, and information campaigns to impact positively on the city.
2011/04/15 12:50 PMUntitled Document
Page 19 of 72file:///Users/mbadenhorst/Documents/websites/iss/pubs/Monographs/No58/Mono58Full.html
Crime Prevention through Environmental Design works best when integrated within a broader crimeprevention strategy which includes law enforcement and social crime prevention. CPTED can range in scalefrom small to medium to large. Small and medium scale interventions can involve landscaping, buildingdesign and increased surveillance. Large scale urban renewal projects such as Warwick Junction and CatoManor in the central Durban area are expensive and must be targeted. While the project at WarwickJunction made use of existing buildings and infrastructure, at Cato Manor both housing and infrastructurewere required. Both projects involved large budgets, multi-disciplinary teams and focused attention.
In addition to looking at the fixed city environment, transport must also be considered within an urbandesign strategy. Crime at bus shelters, taxi ranks and along transit routes is considered to be high butunder-reported. Based on victim surveys, this is a real concern to many commuters.
Objective 1
To promote the use of CPTED principles by developers and City departments.
Outcomes:
All developers and City departments involved with the physical environment have access to andinformation about CPTED principles.
CPTED workshops held for developers and key City departments concerned with the physicalenvironment.
Inclusion of CPTED principles in routine activities and geographic targets for intervention (e.g. themanner of landscaping parks).
A promotion campaign explaining these principles in the design and maintenance of public spaceand infrastructure.
Mapping of crime info to highlight hot-spots and encourage CPTED intervention.
Objective 2
To integrate and incorporate CPTED principles into the by-laws and building codes governing land use andnew construction.
Outcomes:
2011/04/15 12:50 PMUntitled Document
Page 20 of 72file:///Users/mbadenhorst/Documents/websites/iss/pubs/Monographs/No58/Mono58Full.html
The establishment and revision of by-laws and building codes concerning land use and newconstruction which support CPTED.
A mechanism for checking building plan submissions against the by-laws.
Objective 3
To access a broad range of information for accurately mapping crime problems.
Outcomes:
A partnership between SAPS, Community Policing Fora, Neighbourhood Watches and the appropriatemunicipal departments in order to access this broad range of information.
GIS mapping of the data.
All roleplayers including communities, developers, SAPS, and the City know about and have accessto this resource.
Information to all relevant departments and developers regarding the existence and method ofaccessing such a resource.
Objective 4
To use CPTED interventions to improve safety along transport routes.
Outcomes:
The appointment of a champion to support the existing Transport Node Safety Project and ensure itsimplementation.
Replication of the pilot Transport Node Safety Project based on lessons learnt.
An established and ongoing dialogue with a broad range of roleplayers in the transport industry togenerate programmes and projects to reduce crime around facilities and along routes.
Objective 5
To improve levels of safety in Kwa Mashu through the Presidential Project.
Outcomes:
Strategic support of the project which ensures safety benefits.
A communication process between local, provincial and national actors within this presidentialproject.
A project team that includes departments from all levels of government to ensure the integrated andholistic provision of services.
The alignment of planning within the Presidential Project.
Objective 6
To promote safety through implementation of the Urban Improvement Precinct programmes (UIP).

2011/04/15 12:50 PMUntitled Document
Page 21 of 72file:///Users/mbadenhorst/Documents/websites/iss/pubs/Monographs/No58/Mono58Full.html
Outcomes:
An evaluation of the Central Business District UIP program.
A plan and guideline for replicating the programme throughout the city.
A safety component is included in all UIP’s.
An information and media campaign that advertises the benefits of UIP’s and encourages widerparticipation
CBD revitalisation
Cleaning up the city helps to reclaim areas and foster pride. One example ofthis is the crime and grime campaign of the existing Urban ImprovementPrecinct Programme. This is managed by the ratepayers themselves whoformed a Section 21 company. Wherever 51% or more of the ratepayersagree, the level of the rebate to taxpayers is reduced. They can decide tohire additional services like security or waste removal to address crime andgrime.
Delivering the Safer City requires sound management to ensure success. This includes careful attention topartnerships, adequate budget allocations and developing action plans with timetables and performanceindicators to measure outcomes and evaluate the impact of the strategy.
Partnerships
International research also shows that reducing crime must become everyone’s responsibility and that thiscan only be achieved through the active participation of citizens, business, NGOs, the criminal justicesystem and local government in strong cooperative partnerships.
Different partnerships are required for different programmes and projects. It is essential to include thestakeholders and community members most affected by the project in the planning phase, otherwise plansmay be obstructed by people who feel alienated from decision making.
While champions can motivate and support crime prevention initiatives, it is important that the projects arenot seen as being the responsibility of just one person. Broad participation and accountability is bestachieved by disseminating the City’s strategy as widely as possible.
Budgetary considerations
The funding of crime prevention initiatives influences whether or not they will succeed. Apart from seekingadditional funds, it is important that existing budgets are redirected towards crime prevention activities inorder to avoid departments being told to take account of crime prevention without receiving the necessarysupport to do so.
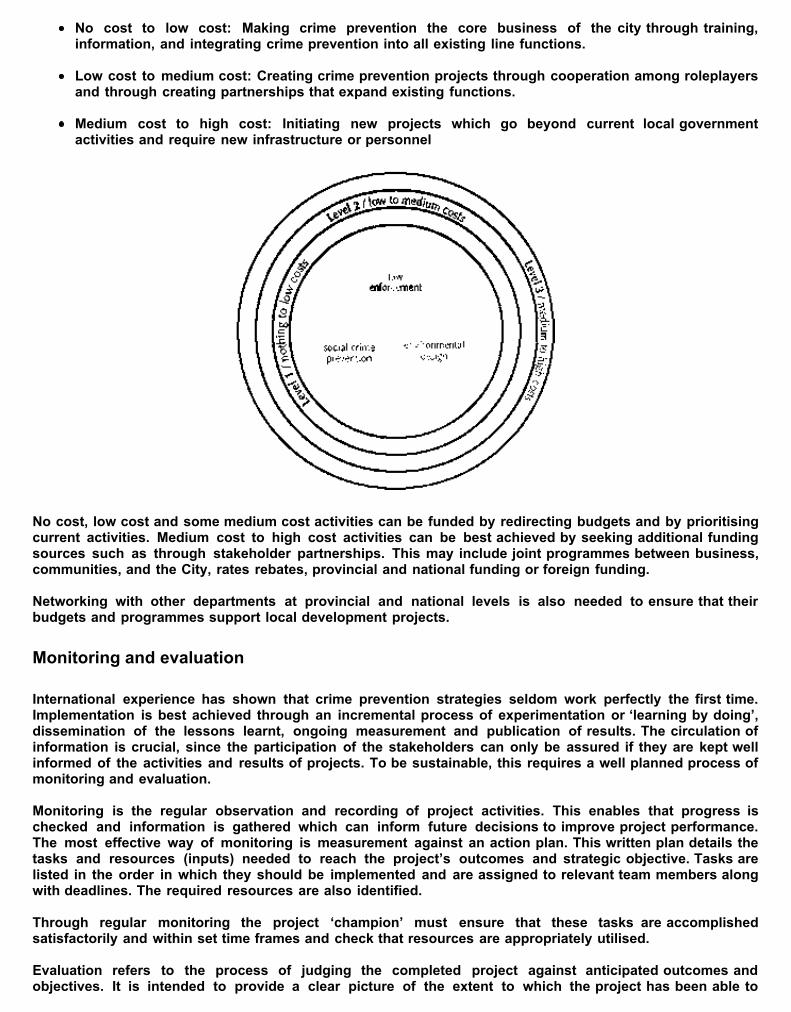
Three levels of cost should be considered in implementing this strategy. Even with little money, the Citycan have an impact on crime in these areas. As one moves up each level, greater effort and resources arerequired. The three levels are:
2011/04/15 12:50 PMUntitled Document
Page 22 of 72file:///Users/mbadenhorst/Documents/websites/iss/pubs/Monographs/No58/Mono58Full.html
No cost to low cost: Making crime prevention the core business of the city through training,information, and integrating crime prevention into all existing line functions.
Low cost to medium cost: Creating crime prevention projects through cooperation among roleplayersand through creating partnerships that expand existing functions.
Medium cost to high cost: Initiating new projects which go beyond current local governmentactivities and require new infrastructure or personnel
No cost, low cost and some medium cost activities can be funded by redirecting budgets and by prioritisingcurrent activities. Medium cost to high cost activities can be best achieved by seeking additional fundingsources such as through stakeholder partnerships. This may include joint programmes between business,communities, and the City, rates rebates, provincial and national funding or foreign funding.
Networking with other departments at provincial and national levels is also needed to ensure that theirbudgets and programmes support local development projects.
Monitoring and evaluation
International experience has shown that crime prevention strategies seldom work perfectly the first time.Implementation is best achieved through an incremental process of experimentation or ‘learning by doing’,dissemination of the lessons learnt, ongoing measurement and publication of results. The circulation ofinformation is crucial, since the participation of the stakeholders can only be assured if they are kept wellinformed of the activities and results of projects. To be sustainable, this requires a well planned process ofmonitoring and evaluation.
Monitoring is the regular observation and recording of project activities. This enables that progress ischecked and information is gathered which can inform future decisions to improve project performance.The most effective way of monitoring is measurement against an action plan. This written plan details thetasks and resources (inputs) needed to reach the project’s outcomes and strategic objective. Tasks arelisted in the order in which they should be implemented and are assigned to relevant team members alongwith deadlines. The required resources are also identified.
Through regular monitoring the project ‘champion’ must ensure that these tasks are accomplishedsatisfactorily and within set time frames and check that resources are appropriately utilised.
Evaluation refers to the process of judging the completed project against anticipated outcomes andobjectives. It is intended to provide a clear picture of the extent to which the project has been able to

2011/04/15 12:50 PMUntitled Document
Page 23 of 72file:///Users/mbadenhorst/Documents/websites/iss/pubs/Monographs/No58/Mono58Full.html
achieve its intended objectives. By comparing the anticipated outcome with what actually happened, it ispossible to identify practices that both worked and failed. Knowing that a project succeeded or failed is lessimportant than knowing why it failed. It is critical that this information be shared with others throughbriefings, newsletters and appropriate forms of communication. This allows the City to approach the nextproject with increased information and skills.
Objectives and outcomes provide the basis for monitoring and evaluating a project. They are the yardsticksupon which the success or failure of a project is measured. Outcomes in this strategy are written in such away that they are easy to monitor and evaluate. Specific and measurable indicators can be developed fromthese outcome statements.
Some of the strategic objectives contained in this document are achievable in the short to medium termand are relatively easy to measure. Others are more complex and only achievable in the longer term.Nevertheless each objective requires its own method and scale of evaluation designed to measure thespecific indicators which demonstrate the achievement of the outcomes.
Monitoring and evaluation of this strategy should occur at a multitude of levels:
At project level to check that projects are relevant, effective and have impact.
At management level to make sure that the co-ordinating and management structure is suitable andable to fulfil its role and meet the objective.
Across the whole Metro area. The entire strategy and structure should be monitored and evaluated toensure that the overall objective of a Safe City is achieved.
While monitoring and reporting is best done internally through roleplayers who are intimate with thestrategy and its projects, final evaluation can often be better accomplished through an external evaluator.

2011/04/15 12:50 PMUntitled Document
Page 24 of 72file:///Users/mbadenhorst/Documents/websites/iss/pubs/Monographs/No58/Mono58Full.html
To ensure that the City’s programmes and projects in the area of social crime prevention are based on asound scientific understanding, the Safer City Initiative established an external Research Advisory Group(RAG). This body includes social scientists and experienced researchers from NGO’s, universities, businessand other organisations who advise the Safer City Coordinators. RAG will assist in baseline data collectionand in monitoring and evaluation. It will also advise on best practices and research requirements.
Already, the RAG has identified and recommended research priorities and provided a consultative forum forthe selection of certain components and tactics in the social crime prevention section. The priority areasidentified by the RAG on social crime prevention were based on the potential impact on crime reduction, thecapacity of the city, cost factors and the need to adhere to national and provincial policy.
Conclusion
This strategy is an expression of a joint plan of action for local government and its partners which includeprovincial and national government, the criminal justice system, business, NGO sectors and communitybased structures.
It highlights the important areas of delivery and the outcomes which will make a positive impact on crime inthe city. The strategy is firmly located within Durban’s Integrated Development Plan and Long TermDevelopment Strategy. This builds on a common vision with the intention of creating a critical mass ofprojects and people which will allow us to stem the tide of crime.
By making crime fighting the core business of the City, the Metro will be able to achieve a very possibledream: a thriving, world class industrial and commercial centre, employment opportunities for all citizens, apremier tourist destination and a city with a clean, safe environment, full effective employment and a highquality of life. This is the overarching objective of the Safer City Strategy.

2011/04/15 12:50 PMUntitled Document
Page 25 of 72file:///Users/mbadenhorst/Documents/websites/iss/pubs/Monographs/No58/Mono58Full.html
PART 2 RESULTS OF THE DURBAN VICTIM SURVEY
Chapter 3INDTRODUCTION
Victim surveys have been conducted across the world for the past 30 years as a means of supplementingpolice crime statistics. Official statistics about crime, given a range of factors, are not always accessible oraccurate. Compiling official statistics depends on both the public to report crime and the police to recordthe details once they do. But the nature of criminal events themselves often mitigate against reporting.Some incidents are not regarded as significant enough to warrant the effort. Others are sensitive andvictims prefer not to disclose the details to a stranger behind a desk in a police charge office.
Reducing crime requires that practitioners understand the extent and nature of the problem. Accurateinformation is therefore vital. Victim surveys are the one source of information that can fill the gaps left byofficial crime statistics. They present an independent source about crime based on questions asked of arepresentative sample of the population in a specific geographic area. As such, victim surveys record theexperience of crime from the unique perspective of the victim. Crimes that are not recorded in official policerecords are captured in the survey, as are the details about each offence. Information of this sort is limitedin official records since the criminal justice process requires the collation of the offender’s rather than thevictim’s details.

2011/04/15 12:50 PMUntitled Document
Page 26 of 72file:///Users/mbadenhorst/Documents/websites/iss/pubs/Monographs/No58/Mono58Full.html
The Durban victim survey is the third in a series of four city victim surveys conducted by the Institute forSecurity Studies (ISS). Comparable surveys were carried out in the metropolitan areas of Johannesburg(July 1997), Cape Town (February 1998) and Pretoria (April 1998).2 The Durban survey was conducted inDecember 1997. The ISS has also conducted victim surveys in rural areas of the country, as well as in twolocal council areas: Uitenhage in the Eastern Cape and Highveld Ridge in Mpumalanga.3
As in the case of both the Johannesburg and Pretoria victim surveys, the results of the Durban survey havebeen channelled directly to the metropolitan government’s crime control and reduction initiatives.4 For thisreason, the data below is presented in a way that can assist practitioners and decision makers in local andprovincial government, the police, the non-governmental community and other sectors that are workingtowards making the Durban metropolitan area safer.
The data presented in this monograph focuses on the extent and nature of crime in Durban, who is most atrisk of particular crimes, public levels of anxiety about crime, and the perceptions of victims and of thepublic, in general, about the police. As such, the report provides a balance between the reality ofvictimisation, on the one hand, and public perception about crime, on the other. This information isessential for formulating local crime prevention strategies.
Strengths of victim surveys
Victim surveys provide several types of information necessary in understanding crime and developinglocalised responses to crime reduction and control. These include:
Determining the extent of crime: Survey data measures those crimes that are not recorded by thepolice. If conducted at regular intervals over an extended period of time, victim surveys enable anassessment of the extent to which changes in crime levels — as recorded by the police — are real ora function of changing reporting tendencies.
Identifying who is most at risk of particular crimes: Because victim surveys gather information fromboth victims and non-victims who are part of a representative sample of the population in any area,the data can show whether particular people are more at risk of victimisation than others. Thisinformation (which is more difficult to extract from police statistics) is essential for designing crimereduction strategies — a process that involves prioritising certain crime categories and vulnerablegroups. Surveys also enable the measurement of who is at risk of becoming a repeat victim of aparticular crime, as well as the levels of multiple victimisation across different crime types.
Understanding the nature of particular crime types, especially those that are rarely reported to thepolice: Victim surveys provide useful information such as where and when crimes are most likely tooccur, the relationship between victims and offenders, weapons used and the degree of violence andinjury sustained. This information is particularly important in the case of crimes such as mugging andassault that are infrequently reported to the police.
Measuring levels of fear of crime: Feelings of insecurity have social, economic and politicalconsequences for society and, as such, anxiety about crime needs to be addressed as an issue initself. High levels of fear can also affect the way the public respond to crime reduction initiatives. Theinformation is therefore important for the marketing of strategies. By recording the perceptions ofboth victims and non-victims, the surveys illustrate the extent and nature of fear of crime.
Determining public perceptions of police effectiveness and service delivery: Victim surveys provide auseful mechanism for recording the opinions of the general public and of victims about theperformance of the police.
Establishing the opinions of victims and the general public about appropriate interventions: Crimeprevention and victim support are relatively new fields in South Africa. Accurate information aboutwhat victims would prefer in this regard is particularly relevant.
The strengths of victim surveys are well recognised. The International Crime Victim Survey (ICVS) has nowbeen conducted in more than 50 countries. In the United States and the United Kingdom, national victim

2011/04/15 12:50 PMUntitled Document
Page 27 of 72file:///Users/mbadenhorst/Documents/websites/iss/pubs/Monographs/No58/Mono58Full.html
surveys are conducted on a regular basis.5 The Durban survey was based on a questionnaire similar to thatused by the International Crime Victim Survey.6 The ISS city surveys differ primarily from the ICVS model,however, in their application as street rather than household surveys.
Limitations of the city victim survey
While city victim surveys provide valuable information about the crime situation in particular localities,certain limitations relating to the street survey methodology, as well as to victim surveys more generally,should be acknowledged:
Higher crime levels? Interviewing people on the street may result in higher crime counts as thosewho are particularly active (and thus more likely to be the victims of certain crimes) are more likely tobe interviewed.
Undercounting or non-counting of some crime types: Both street surveys and household victimsurveys undercount crimes of a sensitive nature such as sexual assault.7 Incidents in which thevictim and offender know each other are also undercounted in victim surveys, since respondentsmay not perceive these as ‘real crimes’ and may also be reluctant to disclose details to interviewers.8Thus, the levels of domestic or ‘non-stranger’ violence may not be fully reflected in victim surveydata.
Moreover, crimes such as child abuse, fraud, corruption, crimes against business and ‘victimless crimes’such as drugtaking or soliciting are not usually covered in victim surveys. In the case of child abuse,parental consent is required to survey children. Specialised focused surveys that are accompanied byqualitative methods are more appropriate for measuring these types of crime.
The ISS city victim surveys focused on the more serious crime types due to budgetary constraints. Thismeans that crimes such as theft out of motor vehicles and bicycle theft were not covered.
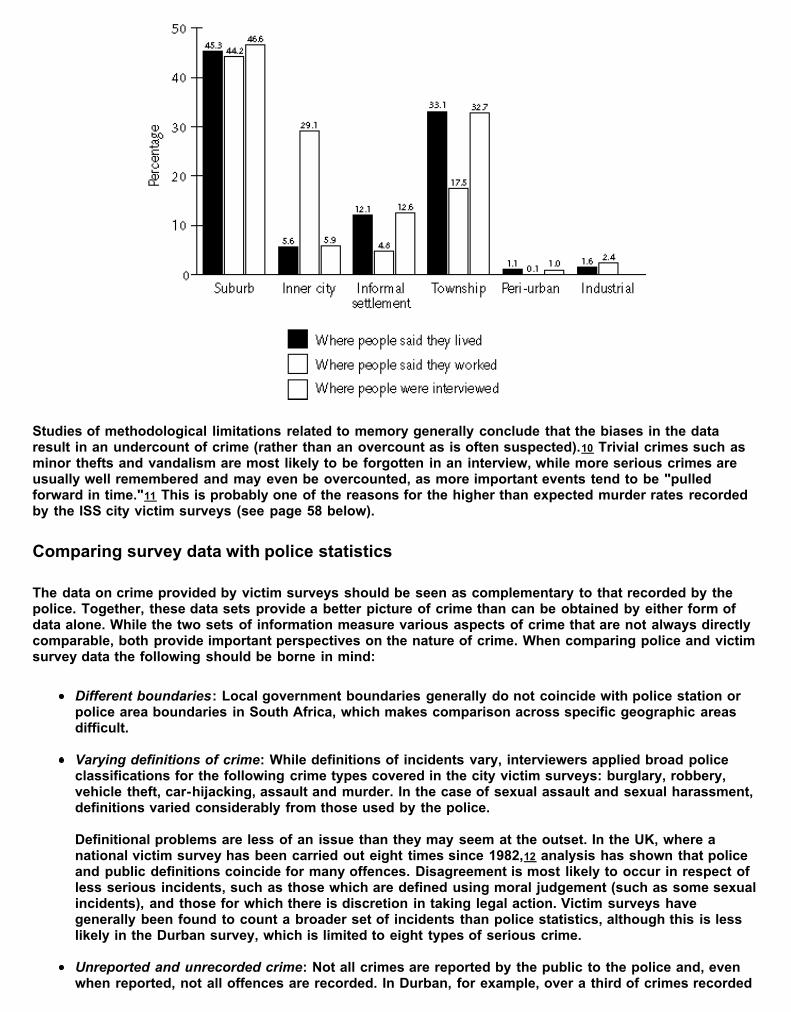
Is data on the risk of burglary affected by the street sample? According to the sampling frame,representative categories of respondents are interviewed in public places across the city. However,since people are chosen on the street and not in their homes (as is the case in household surveys), itis impossible to control where respondents actually live. While the sample may target arepresentative number of people in the streets of the inner city, for example, the number who actuallyreside in the inner city may vary dramatically. The implications for establishing who is most at risk ofa particular crime are most serious for burglary, since this is the one crime type that is directlyassociated with the victim’s home. The problem is much less serious for other crimes such asmugging, assault and car theft. The risk of victimisation for these crimes depends largely on whereand when people work, shop and engage in recreation. However, as shown in figure 1, this problemappears to have been limited in the Durban survey, since there was a close correlation betweenwhere people were interviewed and where they live.
Difficulties remembering details of a crime: Limitations arising from the inability of victims to recallexperiences of crime are a recognised problem. Respondents may make up an offence, not realisethat an incident constitutes one of the offences covered in the survey, incorrectly remember when theevent happened, or forget a relevant incident altogether.9
Figure 1: Target settlement sample and realised sample
2011/04/15 12:50 PMUntitled Document
Page 28 of 72file:///Users/mbadenhorst/Documents/websites/iss/pubs/Monographs/No58/Mono58Full.html
Studies of methodological limitations related to memory generally conclude that the biases in the dataresult in an undercount of crime (rather than an overcount as is often suspected).10 Trivial crimes such asminor thefts and vandalism are most likely to be forgotten in an interview, while more serious crimes areusually well remembered and may even be overcounted, as more important events tend to be "pulledforward in time."11 This is probably one of the reasons for the higher than expected murder rates recordedby the ISS city victim surveys (see page 58 below).
Comparing survey data with police statistics
The data on crime provided by victim surveys should be seen as complementary to that recorded by thepolice. Together, these data sets provide a better picture of crime than can be obtained by either form ofdata alone. While the two sets of information measure various aspects of crime that are not always directlycomparable, both provide important perspectives on the nature of crime. When comparing police and victimsurvey data the following should be borne in mind:
Different boundaries: Local government boundaries generally do not coincide with police station orpolice area boundaries in South Africa, which makes comparison across specific geographic areasdifficult.
Varying definitions of crime: While definitions of incidents vary, interviewers applied broad policeclassifications for the following crime types covered in the city victim surveys: burglary, robbery,vehicle theft, car-hijacking, assault and murder. In the case of sexual assault and sexual harassment,definitions varied considerably from those used by the police.
Definitional problems are less of an issue than they may seem at the outset. In the UK, where anational victim survey has been carried out eight times since 1982,12 analysis has shown that policeand public definitions coincide for many offences. Disagreement is most likely to occur in respect ofless serious incidents, such as those which are defined using moral judgement (such as some sexualincidents), and those for which there is discretion in taking legal action. Victim surveys havegenerally been found to count a broader set of incidents than police statistics, although this is lesslikely in the Durban survey, which is limited to eight types of serious crime.
Unreported and unrecorded crime: Not all crimes are reported by the public to the police and, evenwhen reported, not all offences are recorded. In Durban, for example, over a third of crimes recorded

2011/04/15 12:50 PMUntitled Document
Page 29 of 72file:///Users/mbadenhorst/Documents/websites/iss/pubs/Monographs/No58/Mono58Full.html
by the victim survey were not reported to the police. However, this varies significantly across crimetypes. Virtually all car-hijackings were reported to the police, whereas few muggings were brought totheir attention. Because victim surveys capture incidents that may not have been reported to theauthorities, levels for some categories of crime are likely to be higher than those recorded in policestatistics.
This is the major strength of victim surveys. By comparing police statistics with those obtained fromvictim surveys, for example, it is possible to establish whether crime is actually increasing or whetherthe increase reflected in police statistics is simply the result of more people reporting crime to theauthorities.
Chapter 4SURVEY METHODOLOGY
Given the difficulties encountered with surveys discussed in the introduction, as well as financial and timeconstraints, the methodology for the city victim surveys required careful consideration. The Durban victimsurvey was initiated to gain an understanding of the levels of crime and violence in different communitieswithin the Durban Metropolitan Council. This entailed:
the collection, collation and synthesis of all existing and available research and information ongeneric types of communities (including demographic statistics) and residential areas located withinthe Durban metropolitan area;
the development of broad profiles of the defined constituents, including some select demographicstatistics on age, gender, vocation and place of work and study;
the identification of the ratio of victims to non-victims of crime by race and residential areas; and
the development of the necessary sampling formulae to accommodate this ratio.
The administration of interviews in an uncontrolled environment, such as on the street, at nodalinterchanges and in other public spaces such as places of welfare, is unique to the street surveymethodology. This is a significant departure from typical crime surveys that rely either on face-to-faceinterviews in a controlled environment, or on postal surveys. Such surveys have advantages, but are bothexpensive and time-consuming to administer.
Given the financial constraints of the project, it was decided to conduct a survey based on a street sampleinstead. The methodology had been applied in similar studies conducted by the ISS and DRA Developmentin Johannesburg, Cape Town and in Pretoria.13 This resulted in the calculated application of a more refinedresearch methodology as the surveys proceeded in each metropolis. As the second survey within the ISScity victim survey series, the Durban survey methodology was improved from the original survey conductedin Johannesburg. The most significant improvement was made in relation to the questionnaire design,tailoring the survey to generate more useful forms of data.
Careful planning was required to establish the sample mix and sample points. This was done in a numberof stages.
Stage 1
The Durban survey, similar to the Johannesburg survey, included the separation of the grid questionnairethat determines crime levels (providing a profile of both victims and non-victims in the metropolis by age,gender, race, residential area, crime type, victimisation level, as well as repeat victimisation and multiplevictimisation) from the more detailed section of the survey. In the latter, respondents were required toprovide specific information about the most recent incidents of victimisation for each of the crimecategories covered.
In total, 1 884 people were approached in different areas across the Durban metropolitan area. In each

2011/04/15 12:50 PMUntitled Document
Page 30 of 72file:///Users/mbadenhorst/Documents/websites/iss/pubs/Monographs/No58/Mono58Full.html
sampling node, a predetermined number of people were approached in four age categories, equally dividedinto male and female respondents. This provided the minimum required subsample in each age and gendercategory. Prior to approaching the respondents, no distinction was made between victims and non-victims.The only screening criterion was age.
Stage 2
It was decided that, although the research could not be representative of individual substructures with theDurban Metropolitan Council, it should represent the various area types within the metropolis. Since thereare very few areas in Durban that do not have a residential population, all geographic localities wereincluded in the sample framework with the exception of industrial areas.
To target the correct types of sample areas, at least one sample point was selected to represent eachresidential generic typology. In order to ensure that the selected sample points covered the entiremetropolis, and that all residential generic typologies were represented, a series of primary sample pointswere identified for the grid survey. Another series of primary sample points were identified for the detailedsurvey. Primary sample points were suburbs, townships, the inner city and informal settlements.
Within each primary sample point, a number of secondary points were selected where interviews would beconducted. Examples of primary points included:
shopping and recreation centres (shopping malls, flea markets, corner cafes and stores, plazas,spazas, shebeens, sports grounds, public parks and major streets);
transport nodes (taxi ranks, bus stops, railway stations and parking lots);
education centres (schools, universities and technikons);
health and welfare centres (pension pay-out points, civic buildings, hospitals); and
residential areas (private homes, old-age centres, apartment blocks and informal settlements).
At least five secondary points were identified in each primary sample point. Secondary points wereidentified within the locality of each of the primary points, but in places of lower accessibility, such as civicbuildings, gardens of residential complexes and public health facilities. A minimum of 15% of the quota ofrespondents for each primary sample point were selected at the secondary points.
Within each secondary sample point, an interview referral point had to be identified. This achieved twoobjectives:
the identification and selection of respondents; andan appropriate interview environment.
Finally, in order to limit any selection bias, the number of interviews conducted at each secondary samplepoint was restricted by both time-delay and locality factors.
Stage 3
The questionnaire was refined through the experiences and results of the Johannesburg city victim survey.The pilot study thus functioned more as a training tool for refining interview techniques, measuring thelength of the questionnaire and establishing a respondent sampling technique.
For respondents who had been victims of crimes that required detailing in the second section of the survey,the average interview time was 30 minutes — slightly longer than for the Johannesburg survey. For thoserespondents who were not crime victims and were required to provide only answers to grid questions, theinterview was usually completed in less than five minutes. Generally, respondents wanted to speak abouttheir experiences. In fact, fieldworkers often had difficulty to terminate interviews.
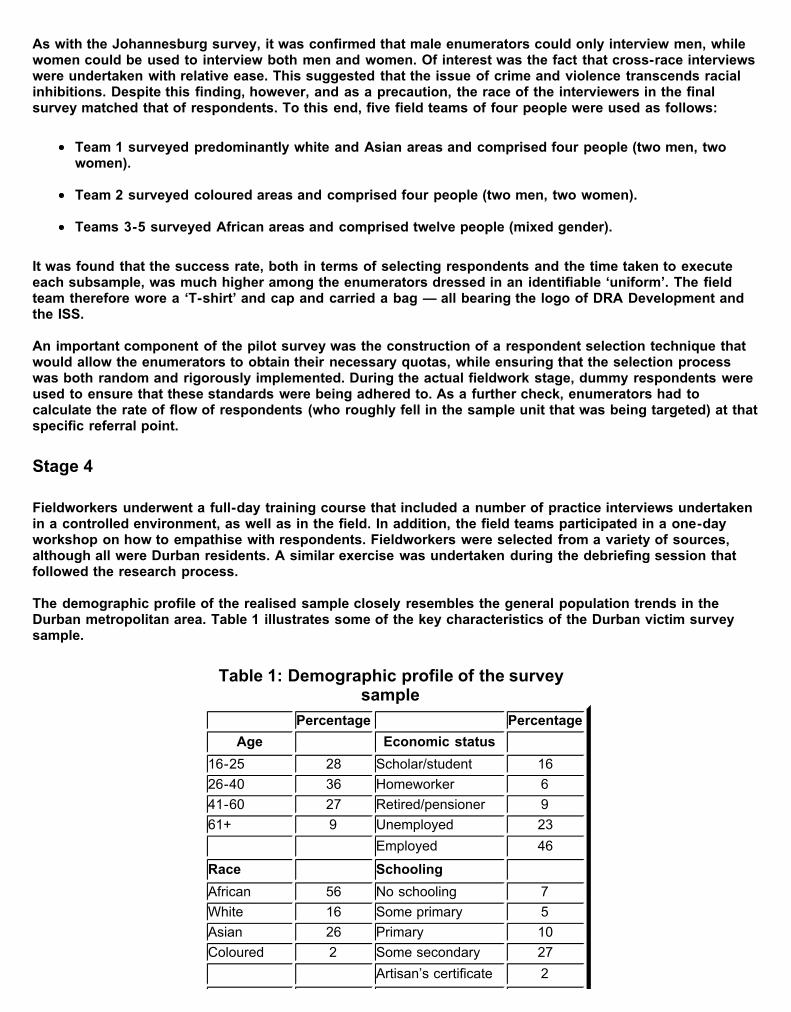
2011/04/15 12:50 PMUntitled Document
Page 31 of 72file:///Users/mbadenhorst/Documents/websites/iss/pubs/Monographs/No58/Mono58Full.html
As with the Johannesburg survey, it was confirmed that male enumerators could only interview men, whilewomen could be used to interview both men and women. Of interest was the fact that cross-race interviewswere undertaken with relative ease. This suggested that the issue of crime and violence transcends racialinhibitions. Despite this finding, however, and as a precaution, the race of the interviewers in the finalsurvey matched that of respondents. To this end, five field teams of four people were used as follows:
Team 1 surveyed predominantly white and Asian areas and comprised four people (two men, twowomen).
Team 2 surveyed coloured areas and comprised four people (two men, two women).
Teams 3-5 surveyed African areas and comprised twelve people (mixed gender).
It was found that the success rate, both in terms of selecting respondents and the time taken to executeeach subsample, was much higher among the enumerators dressed in an identifiable ‘uniform’. The fieldteam therefore wore a ‘T-shirt’ and cap and carried a bag — all bearing the logo of DRA Development andthe ISS.
An important component of the pilot survey was the construction of a respondent selection technique thatwould allow the enumerators to obtain their necessary quotas, while ensuring that the selection processwas both random and rigorously implemented. During the actual fieldwork stage, dummy respondents wereused to ensure that these standards were being adhered to. As a further check, enumerators had tocalculate the rate of flow of respondents (who roughly fell in the sample unit that was being targeted) at thatspecific referral point.
Stage 4
Fieldworkers underwent a full-day training course that included a number of practice interviews undertakenin a controlled environment, as well as in the field. In addition, the field teams participated in a one-dayworkshop on how to empathise with respondents. Fieldworkers were selected from a variety of sources,although all were Durban residents. A similar exercise was undertaken during the debriefing session thatfollowed the research process.
The demographic profile of the realised sample closely resembles the general population trends in theDurban metropolitan area. Table 1 illustrates some of the key characteristics of the Durban victim surveysample.
Table 1: Demographic profile of the surveysample
Percentage PercentageAge Economic status
16-25 28 Scholar/student 1626-40 36 Homeworker 641-60 27 Retired/pensioner 961+ 9 Unemployed 23 Employed 46
Race Schooling African 56 No schooling 7White 16 Some primary 5Asian 26 Primary 10Coloured 2 Some secondary 27 Artisan’s certificate 2
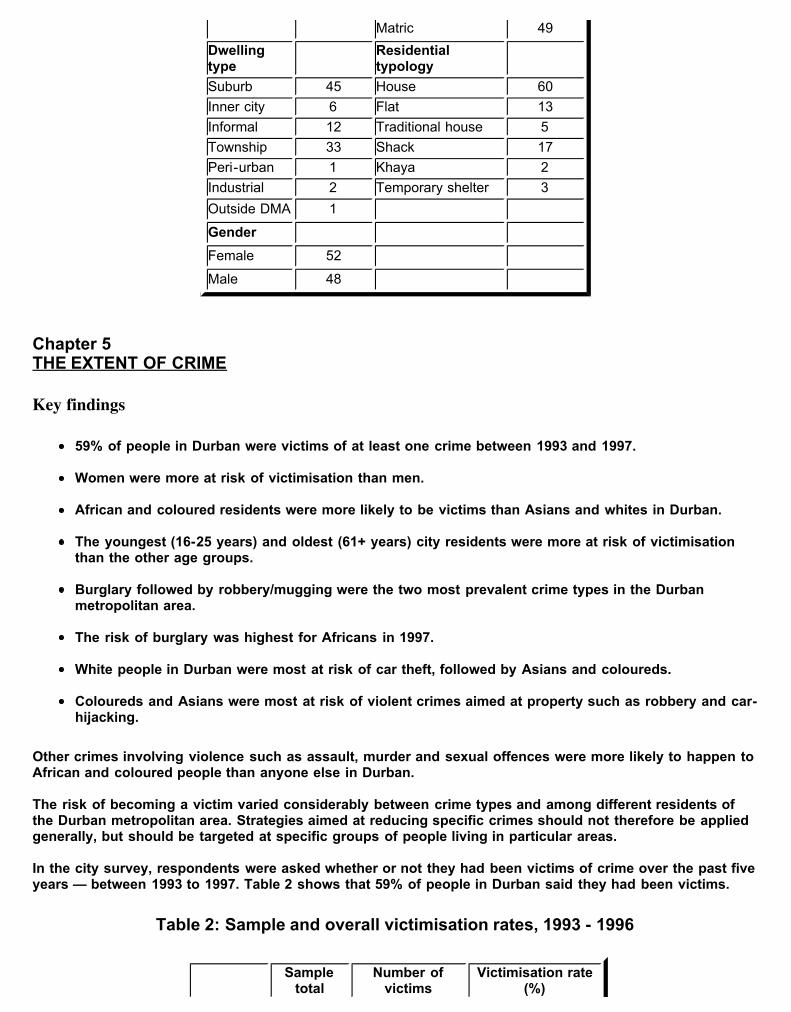
2011/04/15 12:50 PMUntitled Document
Page 32 of 72file:///Users/mbadenhorst/Documents/websites/iss/pubs/Monographs/No58/Mono58Full.html
Matric 49Dwellingtype Residential
typology Suburb 45 House 60Inner city 6 Flat 13Informal 12 Traditional house 5Township 33 Shack 17Peri-urban 1 Khaya 2Industrial 2 Temporary shelter 3Outside DMA 1 Gender Female 52 Male 48
Chapter 5THE EXTENT OF CRIME
Key findings
59% of people in Durban were victims of at least one crime between 1993 and 1997.
Women were more at risk of victimisation than men.
African and coloured residents were more likely to be victims than Asians and whites in Durban.
The youngest (16-25 years) and oldest (61+ years) city residents were more at risk of victimisationthan the other age groups.
Burglary followed by robbery/mugging were the two most prevalent crime types in the Durbanmetropolitan area.
The risk of burglary was highest for Africans in 1997.
White people in Durban were most at risk of car theft, followed by Asians and coloureds.
Coloureds and Asians were most at risk of violent crimes aimed at property such as robbery and car-hijacking.
Other crimes involving violence such as assault, murder and sexual offences were more likely to happen toAfrican and coloured people than anyone else in Durban.
The risk of becoming a victim varied considerably between crime types and among different residents ofthe Durban metropolitan area. Strategies aimed at reducing specific crimes should not therefore be appliedgenerally, but should be targeted at specific groups of people living in particular areas.
In the city survey, respondents were asked whether or not they had been victims of crime over the past fiveyears — between 1993 to 1997. Table 2 shows that 59% of people in Durban said they had been victims.
Table 2: Sample and overall victimisation rates, 1993 - 1996
Sampletotal
Number ofvictims
Victimisation rate(%)

2011/04/15 12:50 PMUntitled Document
Page 33 of 72file:///Users/mbadenhorst/Documents/websites/iss/pubs/Monographs/No58/Mono58Full.html
GenderFemale 988 614 62Male 896 494 55Total 1 884 1 108 59GroupAfrican 1 043 679 65Coloured 34 22 65Asian 495 272 55White 312 135 43Total 1 884 1 108 59Age16-25 years 534 351 6661+ years 173 112 6526 - 40years 664 369 56
41 - 60years 513 276 54
Total 1 884 1 108 59
When asked about their experience of victimisation over a slightly different five-year period, comparativeoverall crime levels in South Africa’s other metropolitan areas were: 63% in Johannesburg, 54% in Pretoriaand 49% in Cape Town.
Table 2 also provides a measurement of who was most at risk of victimisation:
Females were more at risk of victimisation than males.
Africans and coloureds faced an equal risk of becoming victims of crime. They were more at riskthan whites and Asians and were more likely to be victimised than the general population. Whiteswere least likely to be victims of crime in Durban.
Of all the age groups, the young and the elderly were most likely to be victimised. They were alsomore at risk than the general population.
The chances of becoming a victim varied not only according to demographics but also according toparticular crime types. Some crimes were more prevalent than others (table 3 and figure 2).
Figure 2: Crime levels in 1997

2011/04/15 12:50 PMUntitled Document
Page 34 of 72file:///Users/mbadenhorst/Documents/websites/iss/pubs/Monographs/No58/Mono58Full.html
Figure 2 gives an indication of which crimes were most prevalent in Durban in 1997. Burglary and robberywere the most common crimes reported in the metropolitan areas. Similar trends were found in the othercities surveyed by the ISS. In Durban, levels of robbery/mugging, however, were comparatively high. Theprevalence of robbery is cause for concern, particularly because this is the one crime type that hasincreased dramatically in the country according to police statistics: ‘common robbery’ increased by over95% between 1994 and 1999 compared to 7% for all crime.14 Robbery also causes heightened fear of crimebecause it is violent, difficult to prevent and fairly random.
Three per cent of the city’s residents reported having been victims of car theft in 1997. In order to estimatethe risk of car theft more accurately, however, vehicle ownership patterns must be considered. The nationalVictims of Crime Survey illustrated this well. The rate of car theft increased about four times when accessto or ownership of cars was considered.15
One per cent of respondents said they had experienced car hijacking in 1997. This figure is probably a littleinflated because the victim survey allowed responses from passengers and drivers of vehicles. This mayhave led to some overreporting in comparison to police statistics.
The figure for murder needs to be treated with caution. Table 3 shows that as many as 10% of people saidsomeone in their household or immediate family had been murdered between 1993 and 1997. This is in alllikelihood an overestimation. Respondents probably reported murders to the survey that happened topeople outside of their immediate households (among their extended family) and beyond the time periodcovered by the survey.
Table 3: People who reported actual and attempted victimisation in 1997 and between1993-1997
Actual1997
Attempted1997
Total1997
Actualsonly in1997*
Actuals andattempts in
1997
Actualsbetween
1993 1997(n) (n) (n) (%) (%) (%)

2011/04/15 12:50 PMUntitled Document
Page 35 of 72file:///Users/mbadenhorst/Documents/websites/iss/pubs/Monographs/No58/Mono58Full.html
Burglary 137 74 211 7 11 26Robbery 132 52 184 7 10 23Assault 89 17 106 5 6 12Car theft 48 41 89 3 5 14Hijacking 17 16 33 1 2 5Murder 33 10 43 2 2 10Sexualharassment 21 1 22 1 1 3
Sexualassault 14 3 17 1 1 3
*Total sample used to calculate percentages is 1884.
Levels of sexual assault and harassment were in all likelihood higher than those reflected in figure 2. Fewwomen were willing to talk about these crimes to any of the interviewers involved in the victim surveysconducted by ISS. These crimes are among the ‘hidden crimes’ that are rarely reported to the police or togeneral victim surveys such as this one.
The risk of particular crimes in Durban also varied according to race. Tables 4 and 5 indicate which peoplewere most at risk of each crime type over the five-year period (1993-1997) and over a one-year period(1997). The latter should be regarded as more accurate since victims’ recollection of events is better over ashorter than a longer period.
Table 4: Percentage of people who were victims of actual and attempted crimes, 1993-1997
African Coloured Asian White TotalBurglary 27 12 26 25 26Robbery 23 27 31 12 23Car theft 9 9 21 18 14Assault 18 21 5 1 12Murder 17 9 3 1 10Car hijacking 5 0 9 4 5Sexual harassment 4 0 2 1 3Sexual assault 6 0 0 0 3
Table 5 shows that the risk of burglary was highest for Africans, followed closely by white people living inDurban. Both tables 4 and 5 show that coloured people were least likely to be burgled.
Table 5: Percentage of people who were victims of actual and attempted crimes, 1997
African Coloured Asian White TotalBurglary 12 6 9 11 11Robbery 10 18 13 4 10Assault 8 12 2 1 6Car theft 3 6 6 8 5Car hijacking 1 0 3 2 2

2011/04/15 12:50 PMUntitled Document
Page 36 of 72file:///Users/mbadenhorst/Documents/websites/iss/pubs/Monographs/No58/Mono58Full.html
Murder 3 0 1 0 2Sexual assault 1 0 0 0 1Sexual harassment 1 0 1 1 1
White people in Durban were most at risk of car theft — followed by Asians and coloureds (table 5). Thistrend probably reflects the relative wealth of these groups compared to Africans living in Durban.Coloureds and Asians were most at risk of violent crimes aimed at property such as robbery and carhijacking. Other crimes involving violence such as assault, murder and sexual offences were more likely tohappen to African and coloured people than anyone else in Durban.
The city victim surveys have shown that people in poorer communities (in the case of Durban, mainlyAfrican residents) are generally more at risk of violent crime than those in wealthier communities. Propertycrimes tend to affect those who are better off economically. The very wealthy usually experience less crime,however, because they can afford private security measures and alarm systems that the middle incomegroups cannot afford. The middle income groups are therefore vulnerable because they have propertyworth stealing, but are less able to protect themselves and their property from crime. These trends areborne out by the survey data in tables 4 and 5.
The data shows that the risk of becoming a victim varied considerably between crime types and amongdifferent residents in the Durban metropolitan area. Strategies aimed at reducing specific crimes should nottherefore be applied generally, but should be targeted at specific groups of people living in particular areas.This data provides a broad indication of risk only. In order to reduce crime effectively for those who aremost vulnerable, more information will be needed on the causes of these trends, as well as the specificcharacteristics of each crime type in the affected community. The factors that influence one particular crimeare not always the same across areas and for all residents of those areas.
Chapter 6REPORTING CRIME AND PERCEPTIONS OF THE POLICE
Key findings
A majority of victims said they reported the most recent incident of murder, car theft, hijacking,burglary and sexual offences to the police.
Although more victims with insurance cover reported property crimes to the police, insurance wasnot the main reason for reporting, since a majority of burglary victims and car theft victims who did
not have insurance nevertheless reported the crime.
The occurrence of violence and injuries is one factor that makes reporting of the offence more likely.
In the case of assault and sexual harassment, victims who knew the offenders by name or by sightwere slightly more likely to report the crime to the police than those who did not know the offender.
Only 38% of victims were satisfied with the service they received from the police when reporting acrime.
Just over half of all respondents thought the police were doing a poor job at controlling crime inDurban, while 28% believed the police were doing a good job and the remaining 20% were unsure.
White respondents and those living in the inner city were more likely to be satisfied with policeperformance than were Asian and African respondents and those living in informal settlements.
It would appear that the quality of policing is better in the wealthier parts of the city and those areaspoliced by the former Durban City Police — which are also the areas mostly inhabited by white
residents

2011/04/15 12:50 PMUntitled Document
Page 37 of 72file:///Users/mbadenhorst/Documents/websites/iss/pubs/Monographs/No58/Mono58Full.html
The survey determined the propensity of people to report crime to the police, their views on police servicewhen reporting and reasons why those who did not report a crime failed to do so.
A wide range of factors influence whether or not a crime is reported to the police:
perceived seriousness of the crime;perceptions about the effectiveness of the criminal justice system;accessibility of the police;the need to make an insurance claim;fear of the consequences of reporting;desire for goods to be recovered or offender to be arrested; andaccess to alternative systems of justice.
In Durban (as in other cities surveyed), levels of reporting varied according to crime type. Serious violentcrimes (such as murder and hijacking) and property crimes (such as car theft and burglary) were morelikely to be reported than crimes like robbery/mugging (figure 3). Of the crime types covered in the survey,the lowest reporting rate was recorded for assault.
Figure 3: Rates at which various crime types were reported to the police
Insurance and reporting
The survey enables some assessment of whether the reporting of property crimes could be linked toinsurance coverage. Figure 4 shows how many victims had insurance for the property that was stolen fromthem. The majority of victims of burglary and robbery did not have insurance, while most victims of cartheft and hijacking were covered.
Figure 4: Victims who had insurance coverage for stolen goods

2011/04/15 12:50 PMUntitled Document
Page 38 of 72file:///Users/mbadenhorst/Documents/websites/iss/pubs/Monographs/No58/Mono58Full.html
An analysis of the numbers of victims with and without insurance who reported the crime showed that for:
burglary — 90% of victims with insurance and 63% without insurance reported the crime to thepolice;
robbery — 70% of victims with insurance and 45% without insurance reported the crime to the police;and
car theft — 80% of victims with insurance and 86% without insurance reported the crime to thepolice.
More victims with insurance cover reported burglary and robbery. However, insurance is clearly not themain reason for reporting these crimes to the police, since two-thirds of burglary victims and 86% of cartheft victims who did not have insurance nevertheless reported the crime. Of the crime types coveredabove, insurance seemed to have the greatest impact on the reporting of robbery.
These findings provide some evidence that reporting is driven by a range of factors of which insurancecoverage is merely one. Reporting may be driven more by the perceived seriousness of the crime than bythe need to replace the lost property. Reasons why victims would consider a crime ‘serious’ should beexamined in order to understand reporting patterns better. The degree of seriousness may be associatedwith the degree of violence used and injuries sustained during the commission of a crime. It may also bedetermined (in the case of violent crimes) by whether or not the victim and offender are known to eachanother.
Violence and reporting
The link between how serious victims believe an incident to be, and the degree of violence is evident (andmost obvious) in the reporting rates of murder. More murders were reported to the police than any othercrime type covered in the survey (figure 3). An analysis of the link between violence and injury, on the onehand, and reporting rates, on the other, for the other crime categories shows that the occurrence ofviolence and injuries is one factor that makes reporting more likely:
Burglary: The majority (81%) of victims of burglaries that involved violence reported the crimecompared to 69% of victims who experienced non-violent burglaries. Similar percentages appliedregarding injuries sustained: 84% of victims who were injured in the burglary reported it compared to71% who were not hurt.
Robbery: Reporting rates were slightly higher among those victims who were subjected to violence(54%) than among those who reported threats only (41%). Similarly, 54% of victims who were injuredreported the robbery to the police compared to 42% who were not injured.
Hijacking: Slightly more victims who experienced violence reported the incident to the police (85%)

2011/04/15 12:50 PMUntitled Document
Page 39 of 72file:///Users/mbadenhorst/Documents/websites/iss/pubs/Monographs/No58/Mono58Full.html
than did those who experienced threats only (71%). A more significant relationship was foundbetween reporting and injuries: 96% of victims who were injured reported the case compared to 72%who were not hurt during the hijacking.
Assault: More victims who experienced violence (43%) reported the crime to the police than thosewho did not (33%).16 A stronger correlation was found with regard to injuries sustained duringassaults: 58% of victims who were seriously injured (requiring hospitalisation) reported to the policecompared to only 32% who sustained light injuries or no injuries at all.
Victim-offender relationship and reporting
An analysis of whether the victim’s relationship to the offender influenced the likelihood of reportingshowed the following:
Assault: Slightly more victims who knew the offender by name reported the crime to the police (49%)than did those who knew the offender by sight only (36%) or who did not know the offender at all(37%). This trend applied to both male and female victims of assault.
Sexual harassment: More victims who knew their offender by sight only reported the crime to thepolice (65%) than did those who did not know the offender at all (50%).
These results — which show a greater inclination to report incidents when the offender is known to thevictim — do not follow the common expectation that survivors of domestic violence (which would beincluded under ‘assault’ as defined in this survey) and sexual offences are reluctant to report the incidentto the police. The reason for this is that survivors are more inclined to regard crimes committed bystrangers as a criminal matter than crimes perpetrated by family, intimate partners, friends andacquaintances.17
The survey results suggest that victims may be more inclined to report the crime if they know the offenderbecause they believe the police will act, and that their case stands a greater chance of succeeding in courtbecause the suspect can be identified.
Victim support and reporting
Apart from the perceived seriousness of the crime, another variable which was found to influence thereporting tendency was whether people sought help after victimisation or not:
Burglary: The majority of victims who sought help (78%) reported the incident, whereas only 41%who had no form of assistance reported the crime to the police.
Assault: More victims who received help (46%) reported the crime compared to only 13% of thosewho did not seek any assistance.
Robbery: Nearly half of the victims who sought help reported the crime to the police (49%) comparedto only 25% of those who did not receive any sort of assistance.
The data showed that those who had sought some kind of assistance after victimisation were more likely tohave reported the offence to the police. It should be noted that many of those who sought help said theyturned to the police for assistance. This might explain the strong correlation between help-seeking andreporting. Although the data cannot show whether victims reported the crime before or after seeking ‘help’,it is more likely that victims were referred to the police by family members or support agencies, than viceversa.18
These results suggest that victim support, whether formal or informal, may be an important vehicle forencouraging victims to report crime. This is the crucial first step in ensuring that the crime is ultimatelyresolved.

2011/04/15 12:50 PMUntitled Document
Page 40 of 72file:///Users/mbadenhorst/Documents/websites/iss/pubs/Monographs/No58/Mono58Full.html
Perceptions of the police when reporting
When reporting the crime, most victims (62%) described their experience with the police as negative.Respondents explained that the level of investigation was poor, there was little follow-up to report on theprogress of the case and the police were slow and incompetent. A few said they were told by the police notto report the offence, that bail had been set too low, or that the perpetrator had been released too soon(issues which are determined by the courts rather than the police).
Of the 38% who said they were satisfied with the way the police dealt with their report, the most commonreason given was that the police were professional and competent. (It should be noted that no distinctionwas made in the survey between the SAPS and the former Durban City Police). Some victims also gave thepolice the benefit of the doubt, arguing that poor service was due to a lack of resources and the policebeing overburdened.
Levels of satisfaction varied somewhat depending on the type of offence being reported (figure 5).Survivors of sexual harassment, sexual assault and car theft were more likely to be satisfied with the policethan victims of assault, robbery and burglary. This may give some indication of which crime types thepolice regard as more serious — and thus provide a better service to victims when these are reported.However, this would not explain why so few people reporting a murder in their immediate household weresatisfied (only 38%).
Figure 5: Victims who were satisfied with the way police responded when a crime wasreported
General perceptions of policing in Durban
All respondents (victims and non-victims) were asked whether they thought the police were doing a "goodjob at controlling crime" and why.
Just over half (54%) said the police were not successful in controlling crime, while 28% believed the policewere doing a good job and the remaining 20% were unsure. Those who were dissatisfied with policing saidthe services were inadequate and slow, that the police treated them badly and that they were corrupt (figure
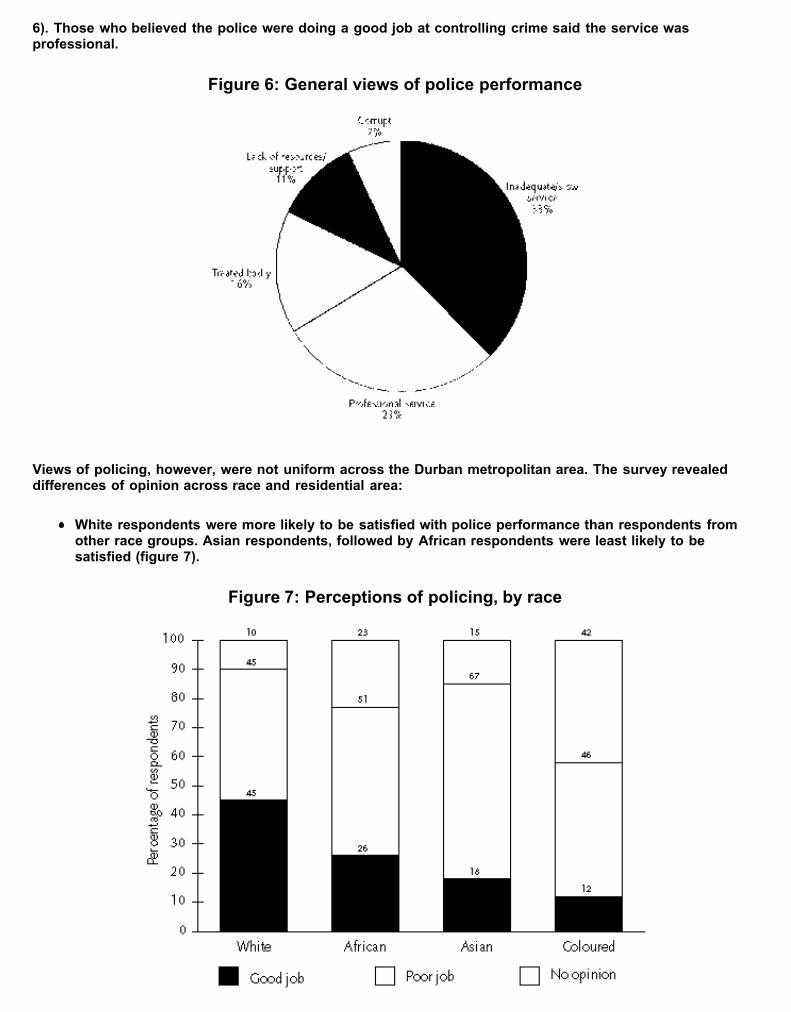
2011/04/15 12:50 PMUntitled Document
Page 41 of 72file:///Users/mbadenhorst/Documents/websites/iss/pubs/Monographs/No58/Mono58Full.html
6). Those who believed the police were doing a good job at controlling crime said the service wasprofessional.
Figure 6: General views of police performance
Views of policing, however, were not uniform across the Durban metropolitan area. The survey revealeddifferences of opinion across race and residential area:
White respondents were more likely to be satisfied with police performance than respondents fromother race groups. Asian respondents, followed by African respondents were least likely to besatisfied (figure 7).
Figure 7: Perceptions of policing, by race
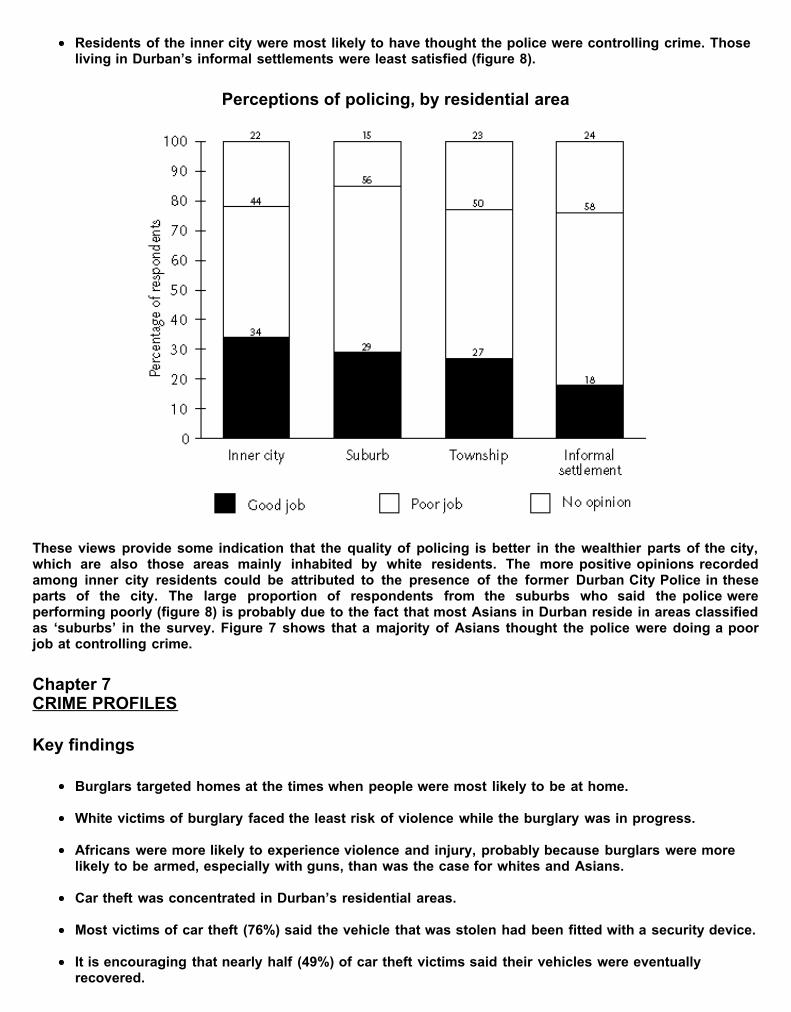
2011/04/15 12:50 PMUntitled Document
Page 42 of 72file:///Users/mbadenhorst/Documents/websites/iss/pubs/Monographs/No58/Mono58Full.html
Residents of the inner city were most likely to have thought the police were controlling crime. Thoseliving in Durban’s informal settlements were least satisfied (figure 8).
Perceptions of policing, by residential area
These views provide some indication that the quality of policing is better in the wealthier parts of the city,which are also those areas mainly inhabited by white residents. The more positive opinions recordedamong inner city residents could be attributed to the presence of the former Durban City Police in theseparts of the city. The large proportion of respondents from the suburbs who said the police wereperforming poorly (figure 8) is probably due to the fact that most Asians in Durban reside in areas classifiedas ‘suburbs’ in the survey. Figure 7 shows that a majority of Asians thought the police were doing a poorjob at controlling crime.
Chapter 7CRIME PROFILES
Key findings
Burglars targeted homes at the times when people were most likely to be at home.
White victims of burglary faced the least risk of violence while the burglary was in progress.
Africans were more likely to experience violence and injury, probably because burglars were morelikely to be armed, especially with guns, than was the case for whites and Asians.
Car theft was concentrated in Durban’s residential areas.
Most victims of car theft (76%) said the vehicle that was stolen had been fitted with a security device.
It is encouraging that nearly half (49%) of car theft victims said their vehicles were eventuallyrecovered.

2011/04/15 12:50 PMUntitled Document
Page 43 of 72file:///Users/mbadenhorst/Documents/websites/iss/pubs/Monographs/No58/Mono58Full.html
Hijackings were most likely to occur at intersections, followed by driveways or garages, or in thestreets of a residential area.
Most hijackings (56%) were perpetrated using threats only. Violence was reported by 44% of hijackingvictims.
Few cases of domestic violence were reported to the survey under the category of assault.
A significant number of assaults occurred in public places, were carried out by more than oneoffender, and most victims did not know the offenders.
Most assaults were committed without the use of a weapon. When a weapon was used, it was mostlikely a knife.
A range of questions was put to victims about each of the crime types covered in the survey. Some factorswere common across crime types (such as the day of the week when the crime occurred) but othercircumstances (such as the type of weapon used and where the crime occurred) were often specific toparticular crime types.
Burglary
Definition
Burglary applied only to the respondent’s home premises, and not to work or employment premises.Respondents were asked to recall their most recent experience "of having your premises burgled or brokeninto without your consent."
Property stolen
In 80% of cases, burglaries were successful (ie property was actually stolen). In the remainder of cases(20%), premises were broken into but nothing was taken.
When burglaries occurred
Burglaries were evenly spread throughout the year, with slight increases reported in March and October.Burglaries were more likely on Fridays and Saturdays and least likely on Sunday and Monday. Nearly half ofthe victims said they were burgled between 18h00-24h00 (46%). The next most common time of day was12h00-18h00 (22%), followed by 06h00-12h00 (17%). Burglaries were least likely in the early hours of themorning (15%). It is thus not surprising that, in 45% of cases, someone was at home when the burglaryoccurred. People living in townships were more likely to be at home during burglaries (53%) than thoseliving in suburbs (42%).
Use of violence
In instances when people were at home, violence was used in 33% of incidents. A further 20% of victimswho were at home said only threats were used, and the remaining 47% said neither threats nor violencewas used. African victims were much more likely to have experienced violence during the course of theburglary than were victims of other races (figure 9).
Figure 9: Use of violence and threats during the course of a burglary

2011/04/15 12:50 PMUntitled Document
Page 44 of 72file:///Users/mbadenhorst/Documents/websites/iss/pubs/Monographs/No58/Mono58Full.html
The data on when burglaries occurred and the use of violence, suggests that offenders targeted homes attimes when people were most likely to be at home. This has implications for the kind of protective andpreventive measures that may be suggested for burglary.
Weapons used and injuries sustained
In nearly half of the incidents (49%), victims said that no weapons were visible. When victims did seeweapons carried by the perpetrators, guns were most common (used in 22% of cases) with knives used in14% of burglaries. In the remainder of instances, a variety of weapons were used, ranging from axes, sticks,pangas and clubs to physical strength.
Although the number of actual cases were small, burglaries committed against white people were leastlikely to involve weapons (table 6). Guns were also least likely to be used in burglaries of white people’shomes: 9% of whites reported that guns were used compared to 17% of Asian victims and 27% of Africanvictims. Africans were also more likely to be injured (32%) than whites (6%).
Table 6: Type of weapons used during burglary, by race
African White AsianN % N % N %
No weapon visible 100 44 24 71 30 47Gun 62 27 3 9 11 17Knife 49 21 4 12 14 22Other weapon 17 7 3 9 9 14Total 228 100 34 100 64 100
The data on when burglaries occurred and the type of weapons used suggests that white people were leastat risk of violence during the course of a burglary. Africans faced a much greater chance of being exposedto violence, and perpetrators were more likely to be armed, especially with guns, than was the case forwhites and Asians.

2011/04/15 12:50 PMUntitled Document
Page 45 of 72file:///Users/mbadenhorst/Documents/websites/iss/pubs/Monographs/No58/Mono58Full.html
Robbery
Definition
Robbery or mugging included "the theft of any item from the person, where force or the threat of force isused."
Nature of the incident
Victims were most likely to have lost money in the robbery (33%), followed by a handbag or briefcase (27%)and accessories such as jewellery (21%). Men were more likely to report that they had lost money, whilewomen were much more likely to report that they had lost a handbag or briefcase. The vast majority ofvictims (83%) said the property taken was not insured.
When robbery occurred
Levels of robbery were comparatively low between January and May. There was an upswing during Juneand July, followed by a slight downturn during August and September (which was still higher than theJanuary to May data). Levels of the crime again increased as the end of the year approached.
As in the case of most of the crimes covered in the survey, robbery was most likely to happen on Fridayand Saturday, and between 12h00-18h00 (41% of cases). Equal numbers of victims said they were robbedbetween 06h00-12h00 (26%) and between 18h00-24h00 (28%).
Where robbery occurred
Robbery was most likely to happen in the street outside shops or offices, followed by a place of work, ashop or an office (figure 10). Around one in ten victims said they were robbed either at public transportranks or while travelling in public transport. Few robberies occurred at places of entertainment or in openspaces such as parks.
Figure 10: Where robberies occurred
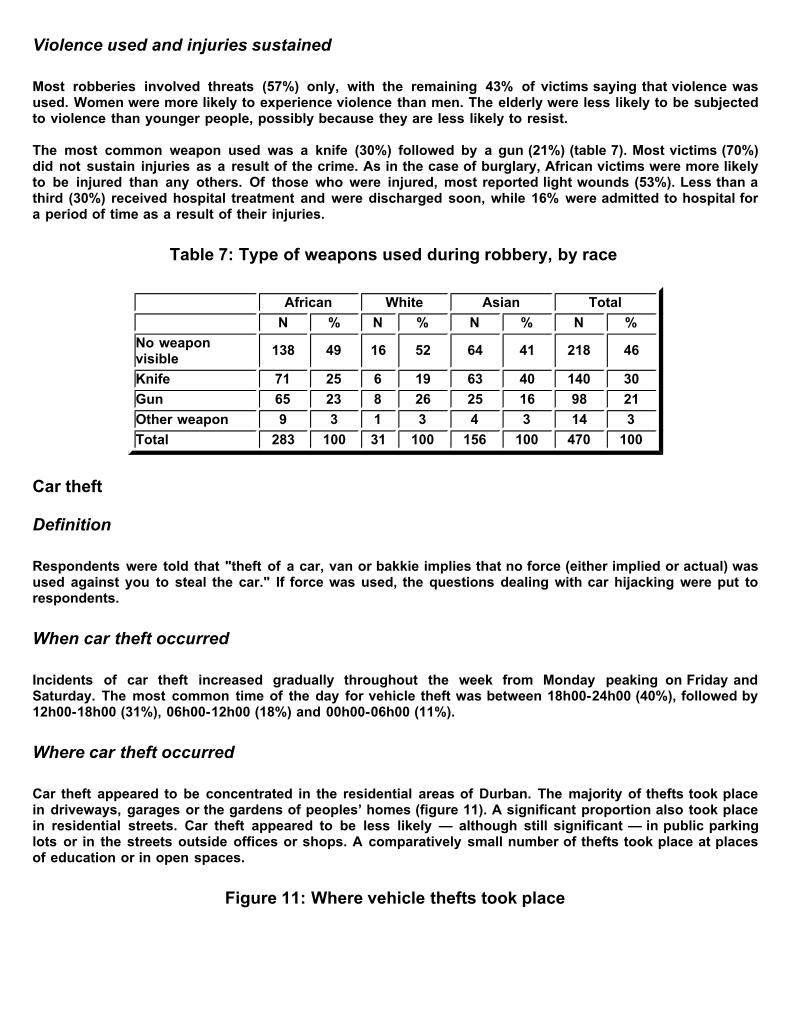
2011/04/15 12:50 PMUntitled Document
Page 46 of 72file:///Users/mbadenhorst/Documents/websites/iss/pubs/Monographs/No58/Mono58Full.html
Violence used and injuries sustained
Most robberies involved threats (57%) only, with the remaining 43% of victims saying that violence wasused. Women were more likely to experience violence than men. The elderly were less likely to be subjectedto violence than younger people, possibly because they are less likely to resist.
The most common weapon used was a knife (30%) followed by a gun (21%) (table 7). Most victims (70%)did not sustain injuries as a result of the crime. As in the case of burglary, African victims were more likelyto be injured than any others. Of those who were injured, most reported light wounds (53%). Less than athird (30%) received hospital treatment and were discharged soon, while 16% were admitted to hospital fora period of time as a result of their injuries.
Table 7: Type of weapons used during robbery, by race
African White Asian TotalN % N % N % N %
No weaponvisible 138 49 16 52 64 41 218 46
Knife 71 25 6 19 63 40 140 30Gun 65 23 8 26 25 16 98 21Other weapon 9 3 1 3 4 3 14 3Total 283 100 31 100 156 100 470 100
Car theft
Definition
Respondents were told that "theft of a car, van or bakkie implies that no force (either implied or actual) wasused against you to steal the car." If force was used, the questions dealing with car hijacking were put torespondents.
When car theft occurred
Incidents of car theft increased gradually throughout the week from Monday peaking on Friday andSaturday. The most common time of the day for vehicle theft was between 18h00-24h00 (40%), followed by12h00-18h00 (31%), 06h00-12h00 (18%) and 00h00-06h00 (11%).
Where car theft occurred
Car theft appeared to be concentrated in the residential areas of Durban. The majority of thefts took placein driveways, garages or the gardens of peoples’ homes (figure 11). A significant proportion also took placein residential streets. Car theft appeared to be less likely — although still significant — in public parkinglots or in the streets outside offices or shops. A comparatively small number of thefts took place at placesof education or in open spaces.
Figure 11: Where vehicle thefts took place

2011/04/15 12:50 PMUntitled Document
Page 47 of 72file:///Users/mbadenhorst/Documents/websites/iss/pubs/Monographs/No58/Mono58Full.html
Security devices to prevent car theft
The survey sought to determine whether victims had taken measures to prevent car theft. Most victims(76%) said that vehicles stolen from them had been fitted with security devices. The most common form ofsecurity was an immobiliser, followed by an electronic alarm, and gear or brake locks (figure 12). Only twovictims reported the use of air surveillance tracking systems. The survey did not determine whether thesewere activated at the time of the theft.
Figure 12: Type of protection used against vehicle theft
It is encouraging that, when asked whether their vehicles were eventually recovered, nearly half (49%) saidthat they were.
Car hijacking
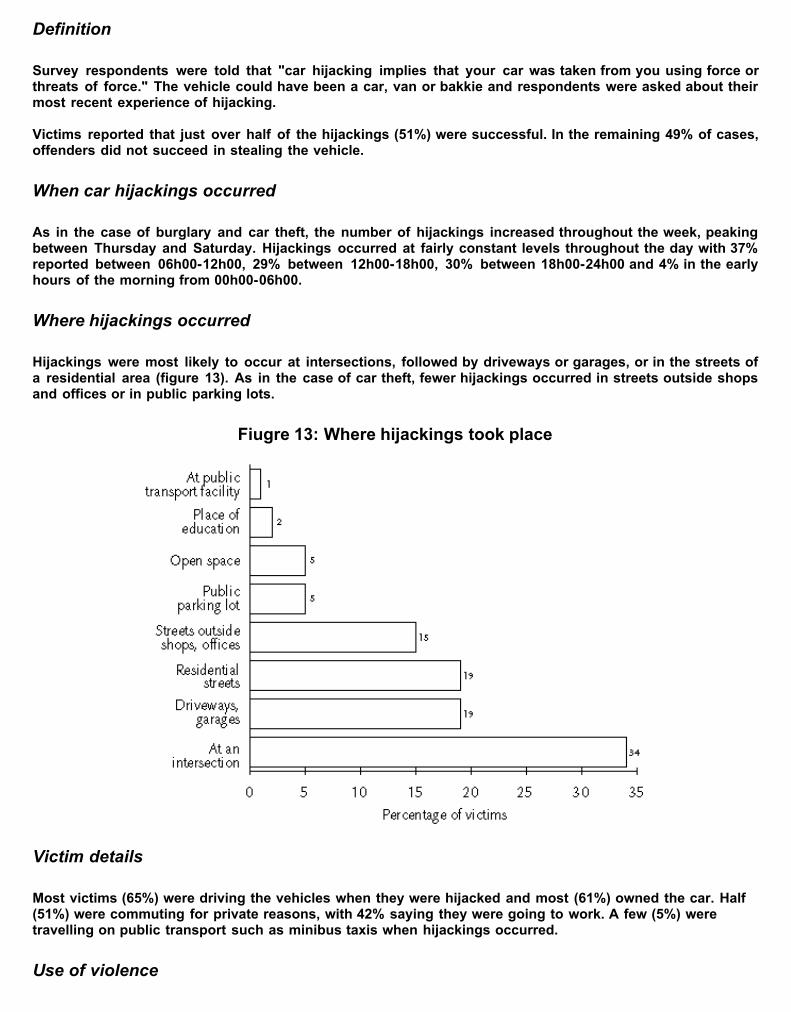
2011/04/15 12:50 PMUntitled Document
Page 48 of 72file:///Users/mbadenhorst/Documents/websites/iss/pubs/Monographs/No58/Mono58Full.html
Definition
Survey respondents were told that "car hijacking implies that your car was taken from you using force orthreats of force." The vehicle could have been a car, van or bakkie and respondents were asked about theirmost recent experience of hijacking.
Victims reported that just over half of the hijackings (51%) were successful. In the remaining 49% of cases,offenders did not succeed in stealing the vehicle.
When car hijackings occurred
As in the case of burglary and car theft, the number of hijackings increased throughout the week, peakingbetween Thursday and Saturday. Hijackings occurred at fairly constant levels throughout the day with 37%reported between 06h00-12h00, 29% between 12h00-18h00, 30% between 18h00-24h00 and 4% in the earlyhours of the morning from 00h00-06h00.
Where hijackings occurred
Hijackings were most likely to occur at intersections, followed by driveways or garages, or in the streets ofa residential area (figure 13). As in the case of car theft, fewer hijackings occurred in streets outside shopsand offices or in public parking lots.
Fiugre 13: Where hijackings took place
Victim details
Most victims (65%) were driving the vehicles when they were hijacked and most (61%) owned the car. Half(51%) were commuting for private reasons, with 42% saying they were going to work. A few (5%) weretravelling on public transport such as minibus taxis when hijackings occurred.
Use of violence
2011/04/15 12:50 PMUntitled Document
Page 49 of 72file:///Users/mbadenhorst/Documents/websites/iss/pubs/Monographs/No58/Mono58Full.html
Only threats were used in most hijackings (56%), with violence used in the remainder (44%). Guns wereused in most hijackings (59%). Surprisingly, the use of other weapons such as knives, axes or pangas wasreported by 20% of victims. The remaining 21% of victims said that no weapon was used or that they didnot see a weapon. Although violence was used in nearly half of all incidents, only 28% of victims saidinjuries were sustained. Most of these injuries were relatively light — after receiving medical treatment,victims were discharged immediately. Hospitalisation occurred in only a small number of cases (5%).
Assault
Definition
Respondents were asked: "have you in the past five years been personally attacked or hurt by someone ina way that really frightened you either at home or elsewhere, such as in a bar/shebeen, in the street, atschool, on public transport, at a shopping centre, or at your workplace? The person doing this could besomeone you do not know, or it could be a relative, friend or family member." Weapons may or may nothave been used in the incident, but no items should have been stolen during the assault. If this was thecase, the questions on robbery would have applied.
When assaults occurred
Levels of assault were comparatively low during the first few months of the year with small increasesreported during June and July and again in October and November. Compared to the crimes coveredabove, assaults were much more likely to occur on Friday and Saturday than on any other day of the week.Nearly half (49%) of assaults occurred between 12h00-18h00 with 37% reported during the night from 18h00-24h00. A further 11% occurred between 06h00-12h00 and only 2% in the early hours of the morningbetween 00h00-06h00.
Where assaults occurred
A quarter of all assaults were committed in the home — either that of the victim (14%) or someone else(11%) (figure 14). Places of entertainment were also common locations followed by streets in residentialareas. A significant minority of victims said they were assaulted while travelling in public transport or whilewaiting at these facilities.
Figure 14: Where assaults occurred
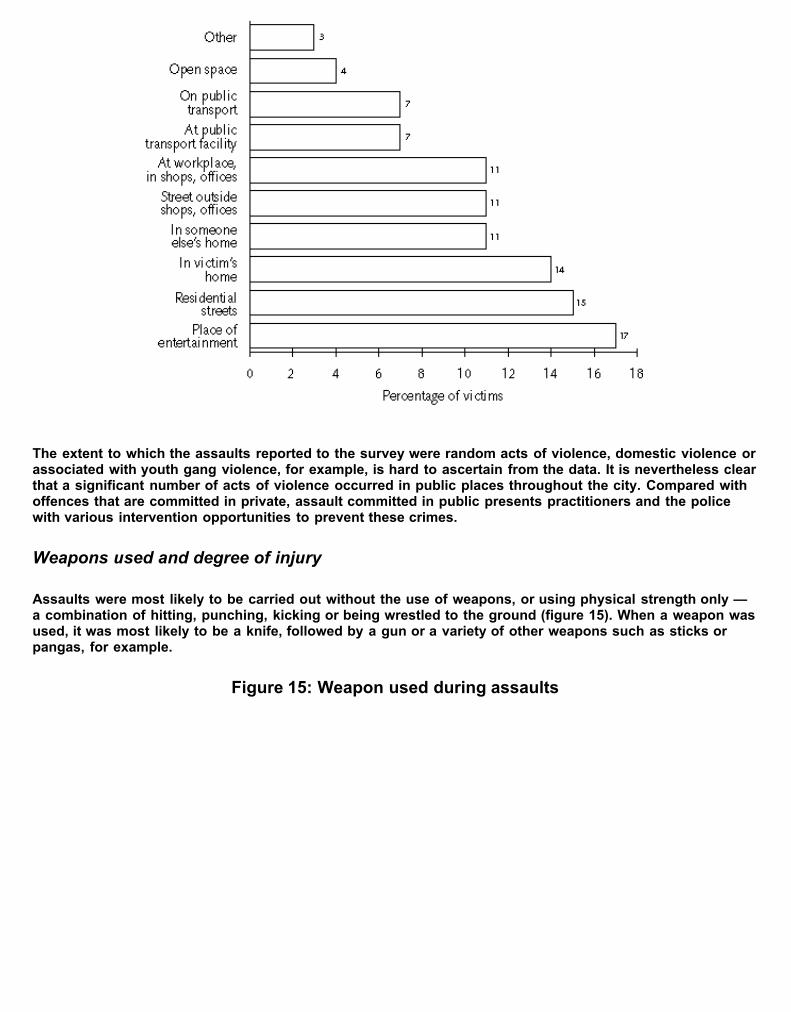
2011/04/15 12:50 PMUntitled Document
Page 50 of 72file:///Users/mbadenhorst/Documents/websites/iss/pubs/Monographs/No58/Mono58Full.html
The extent to which the assaults reported to the survey were random acts of violence, domestic violence orassociated with youth gang violence, for example, is hard to ascertain from the data. It is nevertheless clearthat a significant number of acts of violence occurred in public places throughout the city. Compared withoffences that are committed in private, assault committed in public presents practitioners and the policewith various intervention opportunities to prevent these crimes.
Weapons used and degree of injury
Assaults were most likely to be carried out without the use of weapons, or using physical strength only —a combination of hitting, punching, kicking or being wrestled to the ground (figure 15). When a weapon wasused, it was most likely to be a knife, followed by a gun or a variety of other weapons such as sticks orpangas, for example.
Figure 15: Weapon used during assaults

2011/04/15 12:50 PMUntitled Document
Page 51 of 72file:///Users/mbadenhorst/Documents/websites/iss/pubs/Monographs/No58/Mono58Full.html
Injuries were sustained in most cases (73%), although most of the injuries (54%) were light. Some 27% ofvictims required hospitalisation but were released immediately after treatment, and only 14% remained inhospital for a period of time.
Relationship between victim and offender
The survey sought to determine whether or not the victim was known in some way to the offender.Understanding the relationship between victim and offender has important consequences for crimeprevention. Given that many assaults in Durban occurred in the home or at places of entertainment, it waslikely that many victims would have known the offender. However, most victims (56%) said they did notknow the offender. A quarter (25%) knew the perpetrator by sight and 19% knew the perpetrator by name.
Number of offenders
Most assaults (57%) were perpetrated by more than one offender. Four or more offenders were reported in22% of incidents, two offenders in 18% of cases and three in 17% of incidents. The involvement of oneoffender was reported in 43% of assault cases. The high number of assaults committed by more than oneperson correlates with the large number of assaults that occurred in places of entertainment and in thestreets in residential areas. It also correlates with the data that showed that most victims did not know theoffenders. These results suggest that most assaults reported to the survey were not incidents of ‘domesticviolence’.
Chapter 8CHANGES IN BEHAVIOUR AFTER VICTIMISATION
Key findings
Most respondents said they changed their behaviour after victimisation. Victims of assault were theexception — only 44% changed their behaviour. To the extent that these crimes were committed in ahome environment, it may be difficult for victims to change their behaviour in order to avoidvictimisation.
Typically, African victims were less likely to change their behaviour than white or Asian victims. Thisapplied across all types of crime and could relate to the cost of improving security or changinglifestyle patterns. For example, those who rely on public transport cannot always change their routesor purchase a car to avoid victimisation.

2011/04/15 12:50 PMUntitled Document
Page 52 of 72file:///Users/mbadenhorst/Documents/websites/iss/pubs/Monographs/No58/Mono58Full.html
Although many victims did change their behaviour, less than a half on average said they felt safer asa result. This could indicate that the measures taken were not sufficient to enhance safety. However,it is also likely that perceptions of safety and the fear of crime are determined by factors other thanthe perceived risk of victimisation.
Respondents were asked whether they changed their behaviour as a result of the crime that they hadexperienced. They were also asked what form these changes took and whether they felt safer as a result.
Burglary
Most victims of burglary (62%) changed their behaviour after the crime had occurred. Asians and whites,however, were much more likely to change their behaviour than Africans (figure 16). Whites were also morelikely to use costly measures with 35% employing security guards and 16% installing home alarms. Africanvictims also employed security guards (27%) and supplemented this with ensuring that someone wasalways at home (10%). Significantly, 16% of African victims chose to relocate to avoid further victimisation.
Figure 16: Behaviour changes after burglary and whether these improved feelings ofsafety, by race
Just over half of the victims who had changed their behaviour after victimisation reported feeling safer as aresult. Given the more sophisticated nature of the measures taken, it is not surprising that white victimswere more likely to feel safe than African and Asian victims (figure 16).
Assault
Most victims of assault did not change their behaviour after the incident. Although the number of Asianvictims was small, it is noteworthy that comparatively few African victims changed their behaviour (figure17). The most common forms of behaviour change were avoiding those places where assault is likely tooccur (21%) and avoiding alcohol and gambling (13%). These findings provide some evidence of the links

2011/04/15 12:50 PMUntitled Document
Page 53 of 72file:///Users/mbadenhorst/Documents/websites/iss/pubs/Monographs/No58/Mono58Full.html
between assault and alcohol consumption — supported by earlier results that showed a large proportion ofassaults occurring at places of entertainment.
Figure 17 Behaviour changes after assault and whether these improved feelings of safey,by race
Of those who took precautions against assault, only 48% said they felt safer.
Vehicle theft and hijacking
The greatest impact of victimisation leading to behaviour change was recorded for these crimes: 70% ofvictims of car theft and 75% of hijacking said they changed their behaviour (figures 18 and 19). These highrates of change in relation to vehicle crimes could relate to the value of a vehicle for a household, as wellas the wide range of possibilities for protecting a vehicle from theft. In the case of hijacking, the violentnature of the crime combined with the factors above may encourage people to change their behaviour.
Figure 18: Bahaviour changes after car theft and whether these improved feelings ofsafety, by race

2011/04/15 12:50 PMUntitled Document
Page 54 of 72file:///Users/mbadenhorst/Documents/websites/iss/pubs/Monographs/No58/Mono58Full.html
Figure 19: Behaviour changes after hijacking and whether these improved feelings ofsafety, by race
The types of behaviour change adopted by car theft victims compared with hijacking victims were quitedifferent. In the case of car theft, most people (59%) fitted devices or parked their cars in more securelocations (17%). Several victims — probably those who could not afford the above options — chose to usepublic transport instead or join a lift club (9%). Hijacking victims were most likely to be more alert orcautious, particularly at intersections (31%). A further 14% of victims said they avoided places they

2011/04/15 12:50 PMUntitled Document
Page 55 of 72file:///Users/mbadenhorst/Documents/websites/iss/pubs/Monographs/No58/Mono58Full.html
regarded as dangerous and 13% said they had resorted to carrying a gun. Comparing the interventions,and given that hijacking involves violence, it is not surprising that more car theft victims felt safer as aresult of their actions than hijacking victims.
Chapter 9TYPES OF PROTECTION USED FOR THE HOME
Respondents were asked whether they changed their behaviour as a result of the crime that they hadexperienced. They were also asked what form these changes took and whether they felt safer as a result.
Burglary
Most victims of burglary (62%) changed their behaviour after the crime had occurred. Asians and whites,however, were much more likely to change their behaviour than Africans (figure 16). Whites were also morelikely to use costly measures with 35% employing security guards and 16% installing home alarms. Africanvictims also employed security guards (27%) and supplemented this with ensuring that someone wasalways at home (10%). Significantly, 16% of African victims chose to relocate to avoid further victimisation.
Figure 16: Behaviour changes after burglary and whether these improved feelings ofsafety, by race
Just over half of the victims who had changed their behaviour after victimisation reported feeling safer as aresult. Given the more sophisticated nature of the measures taken, it is not surprising that white victimswere more likely to feel safe than African and Asian victims (figure 16).
Assault
Most victims of assault did not change their behaviour after the incident. Although the number of Asianvictims was small, it is noteworthy that comparatively few African victims changed their behaviour (figure

2011/04/15 12:50 PMUntitled Document
Page 56 of 72file:///Users/mbadenhorst/Documents/websites/iss/pubs/Monographs/No58/Mono58Full.html
17). The most common forms of behaviour change were avoiding those places where assault is likely tooccur (21%) and avoiding alcohol and gambling (13%). These findings provide some evidence of the linksbetween assault and alcohol consumption — supported by earlier results that showed a large proportion ofassaults occurring at places of entertainment.
Figure 17 Behaviour changes after assault and whether these improved feelings of safey,by race
Of those who took precautions against assault, only 48% said they felt safer.
Vehicle theft and hijacking
The greatest impact of victimisation leading to behaviour change was recorded for these crimes: 70% ofvictims of car theft and 75% of hijacking said they changed their behaviour (figures 18 and 19). These highrates of change in relation to vehicle crimes could relate to the value of a vehicle for a household, as wellas the wide range of possibilities for protecting a vehicle from theft. In the case of hijacking, the violentnature of the crime combined with the factors above may encourage people to change their behaviour.
Figure 18: Bahaviour changes after car theft and whether these improved feelings ofsafety, by race

2011/04/15 12:50 PMUntitled Document
Page 57 of 72file:///Users/mbadenhorst/Documents/websites/iss/pubs/Monographs/No58/Mono58Full.html
Figure 19: Behaviour changes after hijacking and whether these improved feelings ofsafety, by race
The types of behaviour change adopted by car theft victims compared with hijacking victims were quitedifferent. In the case of car theft, most people (59%) fitted devices or parked their cars in more securelocations (17%). Several victims — probably those who could not afford the above options — chose to usepublic transport instead or join a lift club (9%). Hijacking victims were most likely to be more alert orcautious, particularly at intersections (31%). A further 14% of victims said they avoided places they
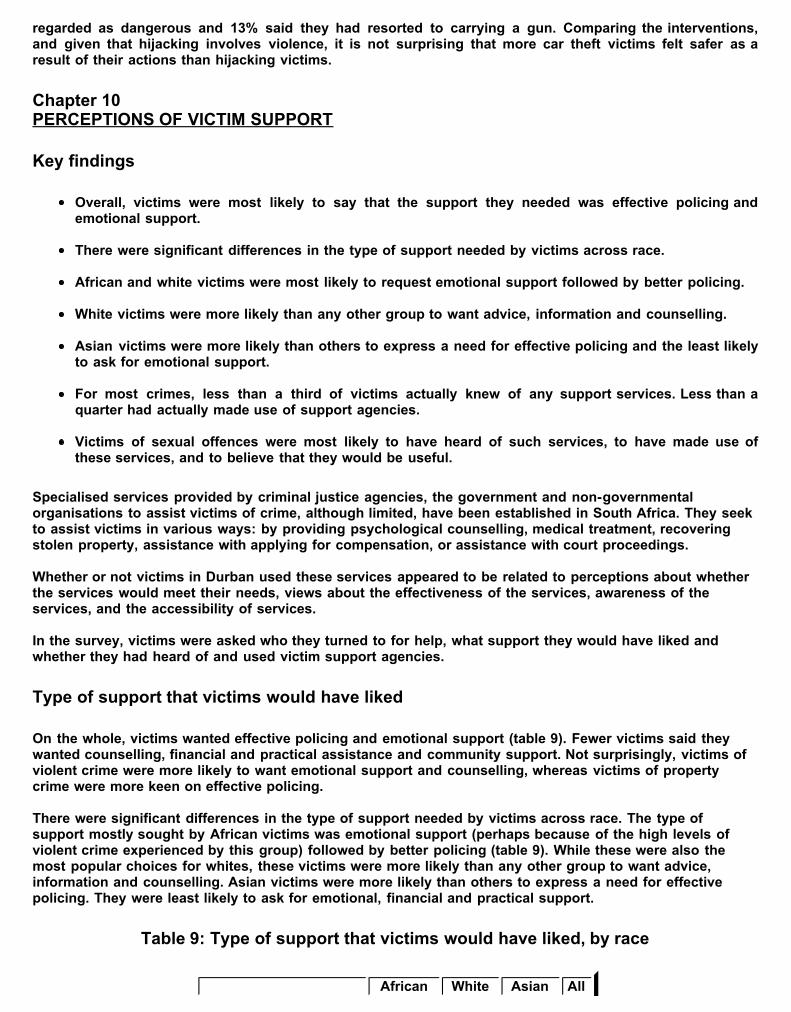
2011/04/15 12:50 PMUntitled Document
Page 58 of 72file:///Users/mbadenhorst/Documents/websites/iss/pubs/Monographs/No58/Mono58Full.html
regarded as dangerous and 13% said they had resorted to carrying a gun. Comparing the interventions,and given that hijacking involves violence, it is not surprising that more car theft victims felt safer as aresult of their actions than hijacking victims.
Chapter 10PERCEPTIONS OF VICTIM SUPPORT
Key findings
Overall, victims were most likely to say that the support they needed was effective policing andemotional support.
There were significant differences in the type of support needed by victims across race.
African and white victims were most likely to request emotional support followed by better policing.
White victims were more likely than any other group to want advice, information and counselling.
Asian victims were more likely than others to express a need for effective policing and the least likelyto ask for emotional support.
For most crimes, less than a third of victims actually knew of any support services. Less than aquarter had actually made use of support agencies.
Victims of sexual offences were most likely to have heard of such services, to have made use ofthese services, and to believe that they would be useful.
Specialised services provided by criminal justice agencies, the government and non-governmentalorganisations to assist victims of crime, although limited, have been established in South Africa. They seekto assist victims in various ways: by providing psychological counselling, medical treatment, recoveringstolen property, assistance with applying for compensation, or assistance with court proceedings.
Whether or not victims in Durban used these services appeared to be related to perceptions about whetherthe services would meet their needs, views about the effectiveness of the services, awareness of theservices, and the accessibility of services.
In the survey, victims were asked who they turned to for help, what support they would have liked andwhether they had heard of and used victim support agencies.
Type of support that victims would have liked
On the whole, victims wanted effective policing and emotional support (table 9). Fewer victims said theywanted counselling, financial and practical assistance and community support. Not surprisingly, victims ofviolent crime were more likely to want emotional support and counselling, whereas victims of propertycrime were more keen on effective policing.
There were significant differences in the type of support needed by victims across race. The type ofsupport mostly sought by African victims was emotional support (perhaps because of the high levels ofviolent crime experienced by this group) followed by better policing (table 9). While these were also themost popular choices for whites, these victims were more likely than any other group to want advice,information and counselling. Asian victims were more likely than others to express a need for effectivepolicing. They were least likely to ask for emotional, financial and practical support.
Table 9: Type of support that victims would have liked, by race
African White Asian All

2011/04/15 12:50 PMUntitled Document
Page 59 of 72file:///Users/mbadenhorst/Documents/websites/iss/pubs/Monographs/No58/Mono58Full.html
% % % %Effective policing 20 25 46 28Emotional support 24 29 8 20Counselling 15 20 13 15Financial, practical 18 10 5 14Community support 14 2 4 10Justice to be done 6 2 7 6Advice and information 2 12 9 5Anything 2 0 8 3
Knowledge and use of support services
Victims’ knowledge and use of victim support agencies were low. For most crimes, less than a third ofvictims had heard of any support services (figure 20). Victims of sexual offences were most likely to haveheard of such services — probably because agencies have been active in this sector for some time.
Figure 20: Victims who had heard of support services, by crime type
The limited knowledge of these services shows the need to improve the information available to victims.However, before raising awareness about victim support services, the availability of existing services, aswell as the capacity of the police and other agencies to refer victims have to be considered.
The fact that few victims had heard about these services does not in itself mean that all victims require thissort of assistance. The data here has to be considered in conjunction with that above on what victims want,as well as whether they think victim support will be useful (see below).
Figure 21: Victims who had used support services, by crime type

2011/04/15 12:50 PMUntitled Document
Page 60 of 72file:///Users/mbadenhorst/Documents/websites/iss/pubs/Monographs/No58/Mono58Full.html
Since few victims had heard of such services, it is not surprising that few had actually made use of thistype of assistance. In most crime categories, with the exception of sexual offences, a quarter or less ofvictims had received help (figure 21). This probably relates as much to awareness about these services asto the availability or lack of such services in many areas. It is encouraging, however, that over half of thevictims reporting sexual offences did receive assistance. This high rate may not reflect the experiences ofsexual assault survivors generally, since those visiting support agencies were probably also those mostlikely to report this crime to the survey.
Given that victims had so little experience and knowledge of support services, it is not surprising that fewthought these services would be useful (figure 22). Whether or not victims judge these services to be usefulprobably depends on several factors, such as awareness about victim support and its benefits, and howmuch time has passed between the occurrence of the crime and the interview. The latter is one factor thatis likely to affect the type of assistance that victims think is important.
Figure 22: Victims who thought support services would have been useful, by crime type
Chapter 11
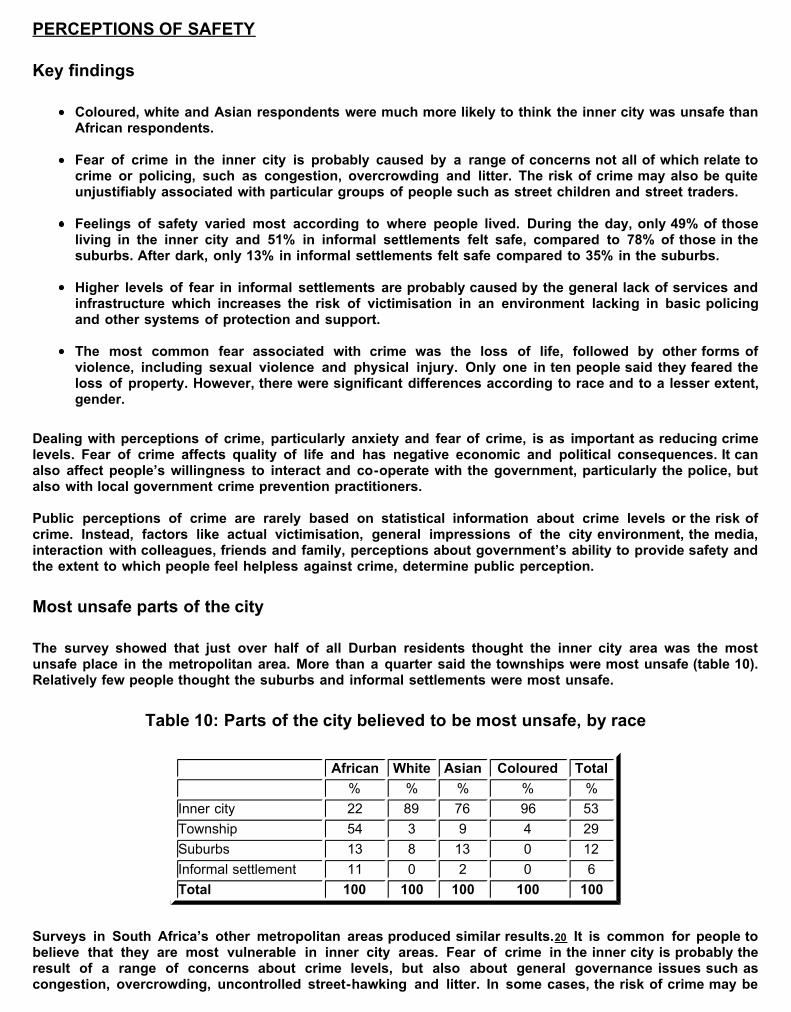
2011/04/15 12:50 PMUntitled Document
Page 61 of 72file:///Users/mbadenhorst/Documents/websites/iss/pubs/Monographs/No58/Mono58Full.html
PERCEPTIONS OF SAFETY
Key findings
Coloured, white and Asian respondents were much more likely to think the inner city was unsafe thanAfrican respondents.
Fear of crime in the inner city is probably caused by a range of concerns not all of which relate tocrime or policing, such as congestion, overcrowding and litter. The risk of crime may also be quiteunjustifiably associated with particular groups of people such as street children and street traders.
Feelings of safety varied most according to where people lived. During the day, only 49% of thoseliving in the inner city and 51% in informal settlements felt safe, compared to 78% of those in thesuburbs. After dark, only 13% in informal settlements felt safe compared to 35% in the suburbs.
Higher levels of fear in informal settlements are probably caused by the general lack of services andinfrastructure which increases the risk of victimisation in an environment lacking in basic policingand other systems of protection and support.
The most common fear associated with crime was the loss of life, followed by other forms ofviolence, including sexual violence and physical injury. Only one in ten people said they feared theloss of property. However, there were significant differences according to race and to a lesser extent,gender.
Dealing with perceptions of crime, particularly anxiety and fear of crime, is as important as reducing crimelevels. Fear of crime affects quality of life and has negative economic and political consequences. It canalso affect people’s willingness to interact and co-operate with the government, particularly the police, butalso with local government crime prevention practitioners.
Public perceptions of crime are rarely based on statistical information about crime levels or the risk ofcrime. Instead, factors like actual victimisation, general impressions of the city environment, the media,interaction with colleagues, friends and family, perceptions about government’s ability to provide safety andthe extent to which people feel helpless against crime, determine public perception.
Most unsafe parts of the city
The survey showed that just over half of all Durban residents thought the inner city area was the mostunsafe place in the metropolitan area. More than a quarter said the townships were most unsafe (table 10).Relatively few people thought the suburbs and informal settlements were most unsafe.
Table 10: Parts of the city believed to be most unsafe, by race
African White Asian Coloured Total% % % % %
Inner city 22 89 76 96 53Township 54 3 9 4 29Suburbs 13 8 13 0 12Informal settlement 11 0 2 0 6Total 100 100 100 100 100
Surveys in South Africa’s other metropolitan areas produced similar results.20 It is common for people tobelieve that they are most vulnerable in inner city areas. Fear of crime in the inner city is probably theresult of a range of concerns about crime levels, but also about general governance issues such ascongestion, overcrowding, uncontrolled street-hawking and litter. In some cases, the risk of crime may be

2011/04/15 12:50 PMUntitled Document
Page 62 of 72file:///Users/mbadenhorst/Documents/websites/iss/pubs/Monographs/No58/Mono58Full.html
quite unjustifiably associated with particular groups of people such as street children and street traders.
Perceptions about Durban’s inner city, however, did vary based on where people lived and worked.Coloured, white and Asian respondents were much more likely to think the inner city was the most unsafeplace in Durban than African respondents. Africans were much more likely to believe that township areas —where most Africans in Durban live — were the most unsafe places in the metropolitan area (table 10). Thepublic’s assessment of their own safety is thus not always based on the same set of factors. For some, fearof crime may be based on actual victimisation — for others, it might be about the anticipated risk andconsequences of crime, as well as the belief that the government is unsuccessful in managing certain partsof the city and controlling some of its inhabitants.
Fear of crime
Fear of crime does not affect everyone to the same extent. It is likely to be highest among those peoplewho:
think they are at risk of becoming a victim;are least likely to receive protection and support;feel helpless to prevent crime or respond to victimisation; andworry about the consequences of crime — whether psychological, social, physical or economic.
Women, the aged and the poor typically fear crime the most. These trends have been supported by victimsurveys in South Africa and abroad.21 Similar patterns were found in Durban, with the exception of age. Thesurvey showed that fear of crime varied little from one age category to the next.
The Durban victim survey asked people how safe they felt walking in their residential areas during the dayand after dark. The question was posed in this particular way to ensure that respondents considered theirpersonal safety in their own neighbourhood, rather than formulating answers on the basis of broad politicaland social factors that may influence perceptions of safety. Respondents were presented with a spectrumof options ranging from ‘very safe’ to ‘very unsafe’. These have been combined into the two variables usedin the analysis below.
Most respondents (68%) felt safe in their areas during the day, and unsafe (73%) after dark. During bothperiods, Africans were least likely of all the race groups to feel safe, and coloureds and Asians were mostlikely to feel safe (figures 23 and 24).
Figure 23: How safe people felt walking in their areas during the day, by race
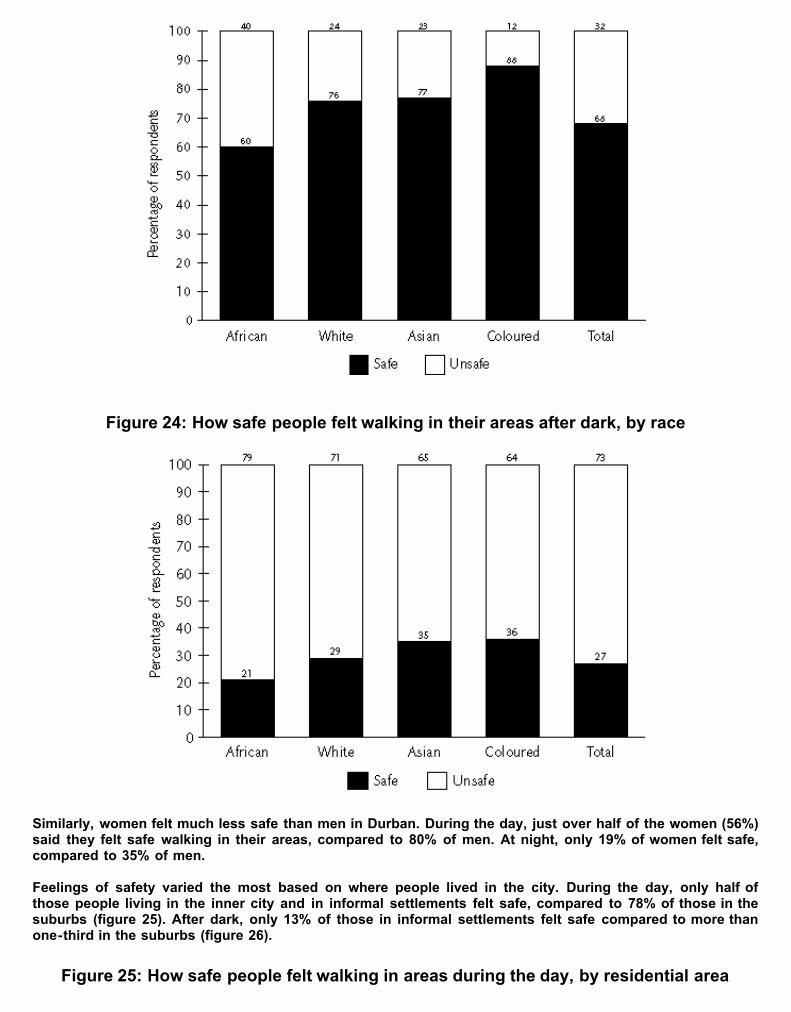
2011/04/15 12:50 PMUntitled Document
Page 63 of 72file:///Users/mbadenhorst/Documents/websites/iss/pubs/Monographs/No58/Mono58Full.html
Figure 24: How safe people felt walking in their areas after dark, by race
Similarly, women felt much less safe than men in Durban. During the day, just over half of the women (56%)said they felt safe walking in their areas, compared to 80% of men. At night, only 19% of women felt safe,compared to 35% of men.
Feelings of safety varied the most based on where people lived in the city. During the day, only half ofthose people living in the inner city and in informal settlements felt safe, compared to 78% of those in thesuburbs (figure 25). After dark, only 13% of those in informal settlements felt safe compared to more thanone-third in the suburbs (figure 26).
Figure 25: How safe people felt walking in areas during the day, by residential area

2011/04/15 12:50 PMUntitled Document
Page 64 of 72file:///Users/mbadenhorst/Documents/websites/iss/pubs/Monographs/No58/Mono58Full.html
Figure 26: How safe people felt walking in their areas after dark, by residential area
The patterns relating to fear of crime among the various race groups in Durban correlate with the findingsrelated to residential areas. Thus, Africans felt less safe than other people in the city — and people living ininformal settlements and townships (who are mostly African) also felt least safe.
The general lack of services and infrastructure in informal settlements also plays a role in increasing therisk of victimisation in an environment lacking in basic policing and other systems of protection andsupport. Residents of informal settlements are thus least able to protect themselves from crime, eitherthrough physical measures to safeguard their property or the ability to choose safer transport routes,places to live, or places of recreation. In addition, these areas are poorly policed. The survey showed(chapter 6) that residents of informal settlements were least likely to say the police were doing a good jobat controlling crime: 18% were of this opinion, compared to 27% in the townships, 29% in the suburbs and

2011/04/15 12:50 PMUntitled Document
Page 65 of 72file:///Users/mbadenhorst/Documents/websites/iss/pubs/Monographs/No58/Mono58Full.html
34% in the inner city.
These findings also support the analysis above that views of safety in the inner city are based on a rangeof factors — not all of which are directly related to crime and policing. Thus, inner city residents felt mostunsafe during the day (when the inner city is alive with people and crowds) — but felt safer than most otherresidents did at night (when the inner city is quiet). Given that inner city residents were most likely to saythe police were doing a good job, these findings illustrate that fear of crime in these parts is based onfactors quite different from those applying to informal settlements and townships.
What people fear the most about crime
Respondents were asked what they feared the most about crime. Their answers were grouped into the fourcategories listed in table 11 below. The question aimed to understand more about the nature of the fear ofcrime and the impact of crime.
Table 11: What people feared the most about crime
African White Asian Coloured Total% % % % %
Loss of life 40 55 68 70 50Sexual violence 19 26 17 15 20Physical injury 23 16 13 9 19Loss of property 18 3 2 6 11Total 100 100 100 100 100
The most common fear expressed by people in Durban was loss of life. This was followed by other formsof violence, including sexual violence and physical injury. Only one in ten people said they feared the lossof property. There were, however, significant differences in what people feared about crime based on raceand, to a lesser extent, gender.
Africans were least likely to fear loss of life, but most likely to fear physical injury and loss of property.Coloureds were much more likely to fear loss of life, but least likely to worry about physical injury (table11). In the case of gender, men were more likely to say they feared physical injury the most (24%) than werewomen (14%). Men also worried more about the loss of life (57%) than women (44%). Not surprisingly, morewomen feared sexual violence (32%) than men (5%).
The fact that half of all Durbanites said their primary fear about crime was physical violence of some sortindicates the extent to which the problem of violence pervades society. This is probably a reflection both ofreality and of perception. Among Africans, for example, fearing loss of life, sexual violence and physicalinjury correlates with their risk of becoming victims of these crimes. The survey showed that Africans weremost at risk of murder and sexual assault and that their risk of assault was higher than the total forDurban. For whites and Asians, however, a similar prioritisation of fears does not match the actual risksfaced by these groups.
Fear about crime is thus based on more than the actual risk of victimisation. The perceived consequencesare one possible factor. This may explain why Africans in Durban were six times more likely than whites(and nine times more likely than Asians) to say their main fear was loss of property. For those who cannotafford insurance and are less able to replace stolen goods — particularly if it is the car used to get to work— the impact of such a property crime is much higher than for the wealthy.22
It may also be true that those who have been exposed to particular types of crime (or any other event forthat matter) for some time, are more accustomed to dealing with it, and are more confident that they will beable to ‘handle’ the incident. This may explain why Africans (who were most at risk of murder) were leastlikely to fear loss of life. Similarly, it may explain why coloureds (who were most at risk of assault) wereleast likely to fear physical injury.

2011/04/15 12:50 PMUntitled Document
Page 66 of 72file:///Users/mbadenhorst/Documents/websites/iss/pubs/Monographs/No58/Mono58Full.html
Ultimately, the survey results show that feelings of safety and fear of crime are complex phenomena. Rarelydo all people in a particular area express the same views. Understanding the basis for these views is alsonot simple. If practitioners and policy makers wish to intervene to reduce the fear of crime, these issuesshould be better understood.
Chapter 12PERCEPTIONS ABOUT HOW TO SOLVE CRIME IN DURBAN
Key points
Most people (80%) said that the government should improve the provision of criminal justice, inparticular, policing.
9% thought that creating employment opportunities, providing infrastructure and housing, andbuilding schools were the most important activities that the government could undertake to makeDurban safer.
White respondents were three and a half times more likely to call for harsher punishment thanAfricans. Whites were least likely to think the government should focus on employment anddevelopment.
When asked what they could do themselves to improve safety, the most common response was ‘workwith the police’.
African and white respondents were much more inclined towards working with the police thanAsians. Community action and youth programmes were also more popular among Africans.
Only 4% of Africans suggested taking precautions as a safety measure, compared to 38% of whitesand 51% of Asians.
It is encouraging that people indicated a clear willingness to work with the police and to shareresponsibility for their own safety.
Overall, people thought that better policing and criminal justice would improve safety in the city.While they recognised the importance of job creation and development, the concept of ‘safety’ wasclearly associated with policing and justice.
All respondents, victims and non-victims, were asked a range of questions about possible measures toimprove their personal safety, as well as that of the city, in general. People were asked two open-endedquestions about what they thought the government should do to make Durban safer and about what theycould do to enhance their own personal safety. Given that in previous surveys most respondents hadspoken about policing in response to the first question, people were also asked to choose between severalmeasures that the government could take that excluded policing. These perceptions are important for acrime prevention strategy not only because they indicate what the public want the most, but also becausethey assist in the management of public relations around the strategy.
What government should do
As found by other victim surveys in South African cities, the vast majority of people believed that thegovernment should intervene by improving the criminal justice sector. Most emphasis lay with the policerather than with the courts and justice system. A quarter of respondents called for harsher punishment(13% of these wanted the death penalty). In comparison, over half (54%) mentioned interventions relating topolicing: one quarter wanted more effective police (saying police needed to be ‘more responsible’, bettertrained, and should arrest more offenders), 19% thought police numbers should be increased, and one inten suggested increasing police visibility and patrols (table 12).
Table 12: What people thought the government should do to make Durban safer, by race

2011/04/15 12:50 PMUntitled Document
Page 67 of 72file:///Users/mbadenhorst/Documents/websites/iss/pubs/Monographs/No58/Mono58Full.html
African White Asian Total% % % %
Harsher punishment, justice 14 50 31 24More effective police 25 17 26 24More police 24 12 11 19More visible police/patrols 11 11 10 11Create employmentopportunities 13 3 5 9
Infrastructure, housing, developinformal areas 9 4 14 9
End corruption 2 1 0 1Build more schools 2 0 1 1Involve community 1 1 1 1Total 100 100 100 100
Few people (less than one in ten) believed that creating employment opportunities, providing infrastructure,housing and development and building more schools were the most important activities that thegovernment could undertake to make Durban safer.
However, attitudes did vary significantly based on race. White respondents were three and a half timesmore likely to call for harsher punishment than Africans (table 12). Not surprisingly (due to their bettereconomic status), whites were the least likely of all race groups to think that the government should focuson employment and development. It is significant that African respondents were more inclined to say thatthe government should improve police effectiveness and increase their numbers than white people. Thisprobably reflects the better standards of policing in white areas. However, the fact that half of all whiterespondents called for harsher punishment also indicates a substantial lack of confidence in thegovernment’s ability to provide safety in general.
When asked what the government should to do, other than policing, to make the Durban metropolitan areasafer, nearly half of the respondents indicated the provision of employment opportunities (table 13).Although people were discouraged from thinking about policing interventions, a significant proportion (30%)nevertheless said that harsher punishment was needed. Few thought that changing norms and values,encouraging community action or providing infrastructure, was important. As with the previous question,views differed according to race. Africans were much more likely to believe that employment andinfrastructure were important. Whites, Asians and coloureds were more likely than Africans to identify theneed for harsher punishment and justice.
Table 13: What the government should do, other than policing, to make Durban safer, byrace
African White Asian Coloured Total% % % % %
Provide employment 58 31 31 35 46Harsher punishment, justice 13 49 52 53 30Change norms and values 15 14 5 3 12Mobilise the community 6 4 8 3 6Improve local infrastructure 8 2 4 6 6Total 100 100 100 100 100

2011/04/15 12:50 PMUntitled Document
Page 68 of 72file:///Users/mbadenhorst/Documents/websites/iss/pubs/Monographs/No58/Mono58Full.html
What individuals could do
Effective crime reduction depends on building partnerships and engaging in joint efforts betweengovernment actors and members of those communities that are affected by crime. Respondents in thesurvey were therefore asked an open-ended question, not only about what they thought the governmentshould do to make the city safer, but also what they could do.
The most common response was that people could work with the police (table 14). Activities such asvolunteer work, participating in community police forums, reporting crime to the police, assisting the policeand providing them with information about crime, were mentioned by respondents. A quarter said thattaking precautions would improve their safety. These measures included activities such as keeping doorslocked, being more aware and avoiding high crime areas. ‘Community action’ was also mentioned by asignificant number of respondents. Included in this category were activities such as community patrols,assisting neighbours and friends, and becoming involved in community projects.
Table 14: What individuals said they could do to make Durban safer, by race
African White Asian Total% % % %
Work with the police 46 46 25 40Take precautions 4 38 51 24Community action 24 7 12 18Youth programmes 9 0 3 6Create employment 9 0 2 5Awareness about crime 8 6 1 5Self-defence, weapons 0 3 7 3Total 100 100 100 100
Views on what individuals could do to improve safety differed according to race. African and whiterespondents were much more likely to want to work with the police than Asians. Similarly, communityaction and youth programmes were more popular among Africans than other respondents.
The greatest difference in opinion was in the proportion of people who said they could take precautions asa safety measure. Only 4% of Africans suggested this, compared to 38% of whites and 51% of Asians. Thiscorrelates to some extent with the findings in chapter 8 on whether victims changed their behaviour afterexperiencing a crime. These results showed that African victims — of all types of crime covered in thestudy — were less likely to change their behaviour than white or Asian victims. The types of behaviourchange described by respondents were similar to those described here as ‘taking precautions’. The mostobvious explanation for this trend relates to the cost of improving security or changing lifestyle patterns.The perception may also be that crime levels are so high in African areas that taking precautions, beingmore aware and avoiding high crime areas are either pointless or impossible. However, the results suggestthat there is scope for increasing awareness of ways to minimise the risk of victimisation among Africanpeople in Durban.
The results are nevertheless encouraging. They indicate that, despite decades of feeling distrustful andfearful of the police, many people were prepared to work with the police to enhance their safety. Efforts bymembers of the South African Police Service to improve their relationship with citizens must therefore besucceeding.
It is also a positive sign that people were prepared to share responsibility for their own safety inconstructive ways. Community or individual initiatives to prevent crime should not be taken for granted. In arecent victim survey conducted in Dar es Salaam, for example, between 14% and a quarter of respondentssaid there was nothing they could do to improve safety. None mentioned taking precautions or being morealert.23

2011/04/15 12:50 PMUntitled Document
Page 69 of 72file:///Users/mbadenhorst/Documents/websites/iss/pubs/Monographs/No58/Mono58Full.html
Overall, the findings indicate that people in Durban believed that better policing and criminal justice wouldimprove levels of safety in the city. This is clear both with regard to government-led interventions andindividual or community-based action. While people recognised the importance of job creation anddevelopment in reducing crime, the concept of ‘safety’ was clearly associated with policing and justice.
Chapter 13CONCLUSION
The Durban Metropolitan Council has demonstrated a rare commitment at local governmentlevel to tackle the problem of crime. This commitment should not be taken for granted,considering that policing and criminal justice are not local government competencies in SouthAfrica. Although safety is now recognised as being about far more than law enforcement, theexpectation that cash-strapped, overstretched local governments around the country will easilytake up the challenge of crime prevention, is shortsighted.
Despite the clear mandate given to local governments in the White Paper on Safety andSecurity 1999-2004, the capacity, skills and resources to make this a reality are limited. In thecase of Durban, the crime prevention drive was fuelled by the recognition that the city’s growthand development revolved around its ability to attract investment and tourism. As long as crimeimpedes this goal, the council must intervene.
The decision by the council in late 1999 to establish a Safer City Project with dedicated staffindicated that the project was being taken seriously. Without this crucial step, research results— like those of the victim survey — were unlikely to have become more than paper-basedstatistics. The importance of information to guide strategy development was clear from the startof the Project’s work. The victim survey results were only one part of the lengthy process ofconsultations that culminated in the writing of the Durban Safer City Strategy 2000. The processof deciding which crime problems to prioritise, and what form the strategy should take, involvedbalancing many research findings with political imperatives, budgetary constraints and publicexpectations.
The victim survey showed that, above all, the people of Durban expected the government toprovide more effective policing and law enforcement. Even non-state interventions weredescribed by the respondents in terms of policing. This raised important challenges for a crimeprevention strategy that was led by local government (as opposed to the police or justicesystem).
The Durban Safer City Strategy 2000 took up the challenge, with ‘effective policing and crimeprevention’ being the first of three components of the strategy. The key to this component is theMetro Police, established in Durban on 1 July 2000, the first such service in the country. Apartfrom its functions of enforcing traffic laws and municipal by-laws, visible policing and relatedcrime prevention functions, the Metro Police will take the lead in establishing a ‘policingpartnership’ between the Durban Metropolitan Council and the South African Police Service.This has been a crucial step in enabling the council to turn its commitment to prevent crime intoaction. As such, it raises a question about local government’s role in crime prevention: how willlocal governments that are unable to establish and afford municipal or metropolitan policerespond to the demands of their constituencies for better law enforcement?
The links between the victim survey results and the Durban Safer City Strategy 2000 are alsoevident in the second component of the strategy, ‘targeted social crime prevention’. Thiscomponent is largely motivated by a concern with the causes of crime, the stark resource

2011/04/15 12:50 PMUntitled Document
Page 70 of 72file:///Users/mbadenhorst/Documents/websites/iss/pubs/Monographs/No58/Mono58Full.html
imbalances bred by apartheid and their implications, especially for education and young people,as well as the stigmatisation of vulnerable groups such as street children who are associatedwith crime and disorder, especially in the inner city. ‘Targeted social crime prevention’ alsohopes to respond to the needs of crime victims who are identified as the most important linkbetween the police and the perpetrator. The victim survey covered many of these areas. Itillustrated how the risk of crime varied between rich and poor, how the poor were particularlyexposed to violence and how policing resources were skewed in favour of the wealthier (andoften white) communities in the city. Public fear of crime in the inner city suggested concerns notso much about crime and policing, but about other factors associated with overcrowding, street-traders, street children and congestion.
The victim survey, by its very nature, highlighted the position of victims in the fight against crime.The evidence was clear that people received very little support after victimisation, eitherpractically or emotionally. Under these circumstances, it is not surprising that many SouthAfricans feel helpless and trapped by their fear of crime. At the same time, it was encouragingthat such a large number of people told the survey that they were prepared to work with thepolice and share the responsibility for ensuring their own safety.
NOTES
1. The Durban Safer City strategy is reprinted with the permission of the Durban Metropolitan council. Itwas first published as 2000 Durban Metro Safer City Durban.
2. See L Camerer, A Louw, M Shaw, L Artz & W Scharf, Crime in Cape Town: Results of a city victimsurvey, ISS Monograph 23, Institute for Security Studies, Halfway House, April 1998; A Louw, MShaw, L Camerer & R Robertshaw, Crime in Johannesburg: Results of a city victim survey, ISSMonograph 18, Institute for Security Studies, Halfway House, February 1998; A Louw, Crime inPretoria: Results of a city victim survey, ISS and Idasa, Halfway House/ Pretoria, August 1998.
3. The rural survey results appear in E Pelser, A Louw & S Ntuli, Poor safety: Crime and policing inSouth Africa’s rural areas, ISS Monograph 47, Institute for Security Studies, Pretoria, May 2000.
4. The Safer Cities: Greater Johannesburg Crime Prevention Strategy was accepted and approved bythe Greater Johannesburg Metropolitan Council on 20 April 1998.
5. See U Zvekic & A Alvazzi del Frate (eds), Criminal victimisation in the developing world, UNICRI,Rome, 1995; C Mirrlees-Black, P Mayhew & A Percy, The 1996 British crime survey: England andWales, Home Office Statistical Bulletin 19/96, Research and Statistics Directorate, London, 24September 1996.
6. A similar questionnaire to that used in the Durban survey can be found in Louw et al, op cit.
7. See Camerer et al, op cit, p 15 for more details on this issue.
8. Mirrlees-Black et al, op cit.

2011/04/15 12:50 PMUntitled Document
Page 71 of 72file:///Users/mbadenhorst/Documents/websites/iss/pubs/Monographs/No58/Mono58Full.html
9. Ibid.
10. Ibid. See also Zvekic & Alvazzi del Frate, op cit; P Mayhew, Some methodological issues invictimisation surveys, in Crime victims surveys in Australia, conference proceedings, Criminal JusticeCommission, Brisbane, 1995.
11. Mirrlees-Black et al, op cit.
12. Ibid; C Kershaw, TBudd, GKinshott, J Matlinson, P Mayhew & AMyhill, The 2000 British crimesurvey:England and Wales, Home Office Statistical Bulletin 18/00, London, 2000.
13. See Louw et al, op cit; Camerer et al, op cit.
14. See Nedbank ISS Crime Index 4(3), 2000 or the SAPS website <www.saps.org.za>.
15. R Hirschowitz et al, Victims of crime survey, Statistics SA and the Department of Safety and Security,Pretoria, 1988. See also A Louw, Who suffer most? The national victims of crime survey, Crime andConflict 16, Winter 1999.
16. Assault was defined in very broad terms in the survey: respondents were asked whether they hadbeen "attacked or threatened by someone in a way that really frightened [them] either at home orelsewhere, such as in a bar/shebeen, in the street, on public transport, at a shopping centre, or at[their] workplace." It is thus possible to distinguish between assaults in which the victim wasattacked, and those in which only threats were used.
17. This has been shown particularly in respect of violence against women, where survivors are morelikely to regard abuse as a criminal act and to report it to the police if it is committed by strangers.This is probably as much the result of perceptions among the police about what constitutes a‘serious’ crime as it is about the survivor’s views. See S Rasool, Violence against women survey,Nedbank ISS Crime Index 4(4), July-August 2000.
18. A recent study of police service delivery showed that very few complainants surveyed in an exit polloutside police stations across the country, were provided with information by the police about wherethey could receive victim support or alterative forms of assistance. E Pelser and A Louw, Communitypolicing and police service improvement study, project report for the SAPS, Institute for SecurityStudies, Pretoria, 1 February 2001.
19. See Camerer et al, op cit.
20. See references cited in note 2 above.
2011/04/15 12:50 PMUntitled Document
Page 72 of 72file:///Users/mbadenhorst/Documents/websites/iss/pubs/Monographs/No58/Mono58Full.html
21. See Louw, 1998, op cit.
22. For more on the impact of crime on the poor, see M Shaw & A Louw, Stolen opportunities: The impactof crime on South Africa’s poor, ISS Monograph 14, Institute for Security Studies, Halfway House,July 1997.
23. See R Robertshaw, A Louw & A Mtani, Crime in Dar es Salaam: Results of a city victim survey,Institute for Security Studies, Pretoria, May 2001.