reducing alcohol-related harm in the workplace: a...
TRANSCRIPT

REDUCING ALCOHOL-RELATED HARM IN THE WORKPLACE
A FEASIBILITY STUDY OF SCREENING
AND BRIEF INTERVENTIONS FOR HAZARDOUS DRINKERS
Conducted by
Hazel Watson, Professor of Nursing Glasgow Caledonian University
Christine Godfrey
Professor of Health Economics, University of York
Angus McFadyen Reader and Statistician, Glasgow Caledonian University
Katherine McArthur
Research Assistant, Glasgow Caledonian University (now at the University of Strathclyde)
Marisa Stevenson
Occupational Health Advisor, University of the West of Scotland
February 2009

Glasgow 2009 Published by: Caledonian Nursing & Midwifery Research Centre School of Nursing, Midwifery, and Community Health Glasgow Caledonian University Cowcaddens Road Glasgow G4 0BA © Glasgow Caledonian University

i
CONTENTS LIST
Page CONTENTS i
ACKNOWLEDGEMENTS iv EXECUTIVE SUMMARY v 1. BACKGROUND 1 2. METHODS 4 2.1. Purpose of the study 4 2.2. Plan of investigation 4 2.3. Study population 4 2.4. Access and ethics 4 2.4.1 Screening 5 2.4.2 Exploratory trial 5 3. STAGE 1: SCREENING 6 3.1. Sample 6 3.2. Data collection 6 3.2.1 Alcohol use 6 3.2.2. Screening costs 7 3.3. Recruitment to screening 7 3.4. Data collection and management 9 3.5. Results 9 3.5.1 Response rate 9 3.5.2 Demographic data 9 3.5.3 Alcohol use 10 3.5.4 Screening costs 11 4. STAGE 2: EXPLORATORY RANDOMISED CONTROLLED TRIAL 12 4.1. Eligibility and recruitment 12 4.2. Outcome measures 12 4.3. Instruments 12 4.3.1 AUDIT 12 4.3.2 Retrospective drinking diary 12 4.3.3 Quality of life 13 4.3.4 Economic evaluation questionnaire 13 4.4 Data collection 13 4.5 Intervention 14 4.5.1 Intervention costs 15 4.6 Statistical analysis 15 4.7 Results 16 4.7.1 Response rates 16 4.7.2 Baseline data 16 4.7.3 Primary outcomes 17 4.7.3.1 Maximum number of units in 24 hours 18 4.7.3.2 Number of drinking days in one week 19
ii
4.7.3.3 Number of units of alcohol consumed in one week 21 4.7.3.4 AUDIT 22 4.7.4 Statistical power calculation 23 4.7.5 Secondary outcomes 23 4.7.5.1 EQ-5ID and thermometer scales 23 4.7.6 Costs of the Intervention 24 4.7.6.1 Patterns of service use 24 4.7.6.2 Costs of service use 26 4.7.7 Correlations between measures 28 5. ACCEPTABILITY OF THE SCREENING, DATA COLLECTION
INSTRUMENTS AND INTERVENTION 29 5.1. Introduction 29 5.2. Sample 29 5.3. Data collection tools 29 5.4. Results 30 5.4.1 Response rates 30 5.4.2 The screening process 30 5.4.3 The Council’s role in providing health and lifestyle-related information 31 5.4.4 The brief intervention 32 5.4.5 Interview with Occupational Health Nurse 33 6. DISCUSSION AND CONCLUSIONS 35 6.1. Introduction 35 6.2. Screening 35 6.2.1 Demographic data 36 6.2.2 AUDIT scores 36 6.3. Exploratory trial of the intervention 36 6.4. Economic evaluation 37 6.5. Feasibility issues 38 6.6. Methodological issues 38 6.7. Conclusions 39 REFERENCES 40
TABLES
3.1 Questionnaire distribution and response rates by wave of recruitment 9 3.2 Ages, occupations and AUDIT scores at screening 10 3.3 AUDIT categories at screening 10 3.4 Alcohol use at screening by age and gender 10 3.5 Material costs of screening 11 4.1 Demographic data at baseline 16 4.2 Alcohol-related data at baseline 17 4.3 Mean values for alcohol use variables 17 4.4 Max. no. units in 24 hours by gender and occupational group 18 4.5 No. drinking days in one week by gender and occupational group 20 4.6 Total consumption of alcohol in one week by gender and
occupational group 21 4.7 AUDIT scores by gender and occupational group 23

iii
4.8 QALY and thermometer scores 24 4.9 Self reported absences from work in the previous 6 months 26 4.10 Calculated costs of service use and days absence at baseline and follow-up 27 5.1 Participants’ views on the provision of health and lifestyle assessments
by the Council’s Occupational Health Service 31 5.2 Participants’ views on the provision of health and lifestyle assessments
by the Council’s Occupational Health Service 31
FIGURES
4.1 Mean plot of max. no. units in 24 hours by group and time 18 4.2 Mean plot of no. drinking days in one week by group and time 19 4.3 Mean plot of total no. units of alcohol in one week by group and time 21 4.4 Mean plot of AUDIT by group and time 22
APPENDICES Appendix 1 Letter from the Council confirming access 44 Appendix 2 Letter confirming ethics approval 45 Appendix 3 Letter of invitation to participants in screening 46 Appendix 4a/b Letters of invitation to intervention and control group participants 47 Appendix 5 General Lifestyle Questionnaire (screening questionnaire) 49 Appendix 6 7-day retrospective drinking diary 53 Appendix 7 Economic evaluation questionnaire, EQ-5D and thermometer scale 54 Appendix 8 Unit cost estimates and sources 63 Appendix 9a/b/c Service utilisation by intervention and control group 64 Appendix 10 Acceptability questionnaire (for responders) 65 Appendix 11 Acceptability questionnaire (for non- responders) 66

iv
ACKNOWLEDGEMENTS
The authors first and foremost wish to thank the Council employees who took part in the study, the Principal Safety Officer and Senior Occupational Health Advisor for their help and support, and the Research Advisory Group for giving their time and expertise. Acknowledgement is also due to the Alcohol Education and Research Council for funding the study.
RESEARCH ADVISORY GROUP
Dr Ewan Macdonald, Hon. Senior Clinical Lecturer, University of Glasgow
Dr Dorothy Ferguson, Head of Division of Community Health, Glasgow Caledonian University
Professor John B Davies, University of Strathclyde
Joyce Craig, NHS Quality Improvement Scotland and AERC
Lindsay Liddle, Research and Strategy Development at the Scottish Executive
Iain MacAllister, Principal Research Officer,
Alcohol and Drugs Misuse Team, Scottish Government
v
Reducing alcohol-related harm in the workplace: a feasibility study of screening and brief interventions for hazardous drinkers
EXECUTIVE SUMMARY
INTRODUCTION
The negative impact of hazardous and harmful drinking on health and well-being for individuals and at a societal level has been well documented, and there is convincing evidence of the cost-effectiveness of brief interventions in primary care (Kaner et al. 2007, Fleming et al.2002). Less attention has been focused on the workplace as an arena for brief alcohol interventions.
Recent policy has highlighted the importance of Occupational Health Services in providing screening and interventions on a range of lifestyle issues (World Health Organization 2006, Scottish Executive 2003; Department of Health 2003). However, our literature search identified only two reports of lifestyle screening of the workforce in the UK that included alcohol use (Hanlon et al. 1995, 1998 and Addley 2001) and no empirical studies of brief interventions in UK occupational settings were found.
METHODS
The exploratory study reported here was designed to examine the feasibility and cost implications of conducting a randomised controlled trial of screening and brief interventions (SBI) delivered by an occupational health nurse. It also aimed to explore the acceptability of SBI to members of the workforce.
The study was conducted in a local authority Council which serves a mixed urban and rural population in Scotland. Screening was undertaken by administering the Alcohol Use Disorders Identification Test (AUDIT) within a self-complete general lifestyle questionnaire which was mailed to a randomly selected sample of employees. Employees who were identified as hazardous drinkers by the AUDIT tool were invited to take part in an exploratory randomised controlled trial.
The brief intervention that was tested was delivered by an occupational health nurse. The intervention was underpinned by self-efficacy (Bandura 1977) and readiness to change theory (Prochaski and Di Clemente 1984, Miller and Rollnick 2002) and was based on the principles of motivational enhancement.
Screening
A random stratified sample of 1,514 employees that reflected the occupational profile of the Council was mailed a self-complete general lifestyle questionnaire that incorporated the Alcohol Use Disorders Identification Test (AUDIT). The criterion for identification as a hazardous drinker, and therefore eligible to the exploratory trial, was an AUDIT score of between 8 and 15 for males or between 6 and 15 for females (Bergman and Kallmen 2002). The number of employees who took part in the screening and trial are as follows:

vi
Exploratory randomised controlled trial
The data that were collected at both baseline and at follow-up 6 months after delivery of the intervention were:
the AUDIT score
variables from a 7-day retrospective drinking diary (the maximum number of units in one 24-hour period, the number of days in the week when alcohol was consumed, and the total consumption reported for the week)
a generic measure of health-related quality of life based on the EQ-5D score
information on use of health, social and voluntary sector service use
a self-assessment of health state using a visual analogue scale (thermometer)
FINDINGS
Alcohol use variables and indicators of health
The analysis of the pre- and post-test data showed that the employees in the intervention group reported greater reductions than those in the control group in terms of:
the mean maximum number of units consumed in one 24-hour period the number of drinking days per week the mean number of units consumed in one week
The employees in the intervention group at follow-up reported fewer days use of hospital services and primary care than at baseline. This contrasts with the control group whose use of health care resources increased.
None of these changes reached levels of statistical significance, but the aim of the study was not to show the effectiveness of a brief intervention on alcohol use or health status. Rather, the aim was to provide data on which to calculate the sample size required for a randomised controlled study and to determine the feasibility of conducting such an investigation.
Both groups reported a statistically significant reduction in AUDIT scores at follow-up (p = 0.004) but there were no differences at either point between the groups.
Economic evaluation
The total costs were: Screening: £5,043.36, i.e. £3.60 per individual screened

vii
Intervention: £12.48 per intervention Net saving of resources from the intervention: £332.02
Given the small sample size of this feasibility study, the estimate of £332.02 as the net saving of resources is subject to a wide margin.
Statistical power calculation
The statistical power calculation showed that 8,258 employees would need to be screened to identify 150 hazardous drinkers each for the intervention and control group in order to achieve statistical power in excess of 90%. A sample size of 6,606 employees should be screened to detect 120 hazardous drinkers for both groups for a trial with a power of 80%. This estimate assumes attrition rate between pre- and post-test of up to 20%.
Acceptability of the screening and interventions
The views of participants of the acceptability of the screening and interventions were sought through a postal survey of 20% of those who had been selected as potential participants at the screening stage and through the use of open ended questions at the end of the follow-up telephone interview with the trial participants.
The vast majority (92%) of respondents indicated that they had been happy to take part in the general health and lifestyle survey in which the AUDIT was administered as the screening tool. Most (60.4%) said they would prefer to receive such questionnaires at their home address, compared with 16.7% whose preference was to receive it at work. 21.9% had no preference for either home or work. 70% felt that the Council’s occupational health service should provide advice and information to employees about alcohol use and health.
When asked about the intervention, all except one participant were very positive about its content and the manner in which it had been carried out. Several participants commented that the intervention had raised their awareness of risks associated with alcohol use and had found the information about calculating the ethanol content of different beverages useful. They had appreciated receiving the Drink-Aware unit calculator wheel. Several said that, since the intervention, they now used smaller wine glasses when pouring drinks at home or used a measure for spirits.
IMPLICATIONS
The main results from the trial suggest that brief interventions in the workplace have the potential to reduce alcohol related harm and also save public sector resources. The employees in the intervention group reported greater reductions than those in the control group in terms of the mean alcohol use variables, and fewer days use of hospital services and primary care than at baseline compared with those in the control group, whose use of such services rose at follow-up.
None of the analyses, however, indicated statistically significant effects, so the findings need to be regarded with caution. However, interesting trends were evident in this small sample and the study has shown that conducting a fully powered RCT of screening and delivering a brief intervention for hazardous alcohol use within the working population would make a useful contribution to the evidence base.
viii
This study raises a number of feasibility issues that would face a full trial. First the screening method did not yield the expected number of hazardous drinkers and therefore the overall screening costs could be significant. Second, all the analyses point to the large sample size that would be needed for definitive trials possibly also with follow-up over longer periods so that a fuller impact of changes in drinking could be captured.
If the same design were to be adopted in a main study, 8,258 employees would need to be screened to identify 150 hazardous drinkers each for the intervention and control group in order to achieve statistical power in excess of 90%. A sample size of 6,606 employees should be screened to detect 120 hazardous drinkers for both groups for a trial with a power of 80%. These estimates assumes attrition rate between pre- and post-test of up to 20%. It may be that a lower number of participants would require to be screened if a face-to-face or telephone method was used, but this was not an option in this study.
REFERENCES
Aalto M, Seppa K, Kiianmaa K, Sillanaukee P. (1999) Drinking habits and prevalence of heavy drinking among primary health care outpatients and general population. Addiction. 94(9):1371-9.
Addley K, McQuillan P, Ruddle M. (2001) Creating healthy workplaces in Northern Ireland: evaluation of a lifestyle and physical activity assessment programme. Occupational Medicine (Oxford) 51(7):439-49.
Alcohol Concern (2006) Impact of alcohol problems on the workplace. Acquire: Alcohol Concern’s Quarterly Information and Research Bulletin, Winter 2006, Alcohol Concern, London.
Bandura A. (1977) Social learning theory. Englewood Cliffs, N.J. Prentice Hall.
Bergman H, Kallmen H (2002) Alcohol use among Swedes and a psychometric evaluation of the Alcohol Use Disorders Identification Test. Alcohol Alcohol 37:245–251.
Department of Health, Royal College of Nursing, Association of Occupational Health Nurse Practitioners (UK) (2003). Taking a Public Health Approach in the Workplace, http://www.dh.gov.uk/en/Publicationsandstatistics/Publications/PublicationsPolicyAndGuidance/DH_4069327
Fleming MF, Mundt MP, French MT, Manwell LB, Stauffacher EA, Barry KL. (2002) Brief physician advice for problem drinkers: long-term efficacy and benefit-cost analysis. Alcohol Clin Exp Res. 26(1), 36-43.
Hanlon P, McEwen J, Carey L, Gilmour H, Tannahill C, Tannahill A, Kelly M (1995) Health checks and coronary risk: further evidence from a randomised controlled trial British Medical Journal. 311:1609-1613.
ix
Hanlon P, Carey L, Tannahill C, Kelly M, Gilmour H, Tannahill A and McEwen J. (1998) Behaviour change following a workplace health check: how much change occurs and who changes? Health Promotion International. 13, 131-139.
Kaner EF, Dickinson HO, Beyer FR, Campbell F, Schlesinger C, Heather N, Saunders JB, Burnand B, Pienaar ED. (2007) Effectiveness of brief alcohol interventions in primary care populations. Cochrane Database of Systematic Reviews 2007, Issue 2. Art. No.: CD004148. DOI: 10.1002/14651858.CD004148.pub3.
Miller WR. and Rollnick S. (2002) Motivational interviewing: preparing people for change. 2nd ed. London: Guilford Press.
Prochaska, J.O. and DiClemente C.C. (1984) The transtheoretical approach: Crossing traditional boundaries. Ch.3. Dow Jones-Irwin, Illinois.
Scottish Executive (2003) Improving Scotland’s Health: the Challenge. The Stationery Office, Edinburgh.
World Health Organization (2006) http://www.who.int/occupational_health/Declarwh.pdf

x
1
1 BACKGROUND
The most recent research, based on the National Statistics Omnibus Survey, suggests that 43.9% of men and 41.5% of women of working age in the United Kingdom consume alcohol at levels that exceed the daily benchmarks (Goddard 2008). The negative impact of hazardous and harmful drinking on health and well-being for individuals and at a societal level has been well documented, and debate is now being promoted by government in the United Kingdom about potential solutions to the problems that arise from hazardous and harmful alcohol use (Department of Health 2008, Scottish Government 2008). While attention has been drawn to the alcohol-related health problems and to the behavioural problems associated with intoxication, less consideration has been given to the consequences of hazardous drinking for the general well-being of people who are in employment and of the workplace as an arena for health promotion.
The cost of alcohol misuse through lost productivity in England was estimated to be £6.4B (Cabinet Office 2004). In Scotland it was conservatively estimated that over 1 million sick days are lost from the workplace as a result of alcohol dependence (Varney & Guest 2002). The Institute of Alcohol Studies (2008) have reported that around 50,000 people in the UK claim incapacity benefit because of alcohol problems. According to Alcohol Concern (2001), problems that can affect organisations include poor performance at work and reduced productivity, increased staff turnover and loss of experienced staff, increased accident rates, stress and low morale and damage to an organisation’s reputation and image.
The Health Departments for both Scotland and England have highlighted the importance of Occupational Health Services in providing screening and interventions on a range of lifestyle issues (Scottish Executive 2003; Department of Health 2004). The implementation of health promotion in the workplace and achievement of a reduction in hazardous drinking are key objectives of a range of national and international public health policy documents such as Improving Scotland’s Health: the Challenge (Scottish Executive 2003), Choosing Health (Department of Health 2004), Health for All in the 21st Century (World Health Organization 2005). Despite this, the Health Development Agency (2004) has suggested that few occupational health services in the United Kingdom offer lifestyle screening which would identify those individuals who would be likely to benefit from the provision of appropriate health-related information.
Although many workplaces now have policies regarding services for people intoxicated at work or who are alcohol dependent (Alcohol Concern 2006), a much higher proportion of the population comprises individuals who are drinking at hazardous rather than harmful levels (Goddard 2008). In its 2004 publication entitled ‘Drugs and Alcohol in the Workplace: developing drug policies 3’, the National Treatment Agency for Substance Misuse (NTA) infers an approach using brief interventions for hazardous drinkers but no systematic guidance was given. In her recent review of the health of Britain’s working age population, Black (2008) highlights the key role the workplace can play in promoting health and well-being and called for a coordinated programme of further research to inform future action with a comprehensive evidence base.
2
Access to occupational health services has been reported as ranging from 15% - 96% across Europe (Pilkington et al.2002), with such services becoming increasingly available to the working population in the United Kingdom (Nicholson 2002). It appears, however, that as a consequence of employers’ legal responsibilities, the prevention of industrial injury and occupation-related morbidity may be prioritised over health promotion activities (Franklin & Oakley 2002).
There is convincing evidence of the effectiveness of generic health professionals in providing a brief intervention, in the form of simple advice or brief counselling, in primary care for patients whose levels and patterns of consumption place them at risk of developing alcohol dependency (Kaner et al. 2007, Moyer et al. 2002). Such interventions have also been shown to be cost effective when delivered in primary health care settings (Kaner et al 2007, Ludbrook et al.2002, Fleming et al. 2002).
Our literature search identified only two reports of lifestyle screening of the workforce in the UK that included alcohol use. Hanlon et al. (1995, 1998) reported a study of the effect of health education on coronary risk in a randomly selected cohort of 1,632 engineering factory workers in Scotland, the primary outcome being cholesterol level. A control group was recruited that comprised 261 employees of a separate smaller engineering company. Data collected on secondary outcomes included self-reported levels of alcohol consumption, for which a statistically significant change from excessive to low-risk levels was reported. No information was given about how alcohol intake was measured, the nature of health education interventions or the professional background of those who carried out the health education. This study suggests that workplace interventions have the potential to be effective, but further evidence is required if recommendations are to be made for the implementation of such an approach within the routine practice of occupational health personnel.
Addley et al. (2001) evaluated the impact, in Northern Ireland, of a programme designed to assess a range of lifestyle factors that included levels of alcohol use. The programme was delivered by an occupational health nurse working with the civil service and incorporated a follow-up survey of self-reported behaviour change. No control group was recruited. Descriptive statistics suggested reductions in levels of consumption six months after the intervention to low-risk drinking in eight percent of those reporting excessive levels of drinking at entry to the study. In two separate randomised controlled studies of a work-based approach to health promotion in Australia, Richmond et al. (2000) and Simpson et al. (2002) reported no statistically significant changes in consumption for the intervention group across the study samples. In the study conducted by Richmond et al., however, a significant reduction was found only in the number of drinks consumed by the women in the intervention group in a matched group comparison.
In a study that focused on alcohol use, Walters and Woodall (2003) recruited 74 employees from a manufacturing firm in California to take part in a study using a mailed invitation that was sent to 1,000 workers to take part in a free check-up related to their alcohol use. All data were collected by mail and included measures of quantity and frequency of consumption, readiness to change, and perceptions of risk. Participants were randomly assigned either to receive feedback immediately or after a delay of eight weeks. Following receipt of the feedback, participants in both groups reported reductions in mean consumption with a significantly greater change

3
in those who received immediate feedback. The absence of a true control group, however, detracts from the internal validity of the study.
Hermansson et al. (1998) demonstrated the feasibility of screening and delivering a brief intervention in the workplace in Sweden within a routine health check of employees conducted by the occupational health service. The delivery of such interventions for hazardous drinkers by occupational health nurses in the United Kingdom may be appropriate, with the aim of helping employees to reduce their levels of consumption to within the limits for low-risk drinking. However, since the evidence base for the delivery of such interventions in this country is currently weak, a preliminary study was undertaken to explore the feasibility of conducting a randomised controlled trial study and to explore the acceptability of brief interventions by members of the workforce.
Furthermore, although the cost effectiveness of brief interventions delivered in primary care has been demonstrated, it would be inappropriate to extrapolate the cost implications to the workplace setting. While the workplace is a potential site for cost-effective brief alcohol interventions, data are very limited especially from non-US sources. Inclusion of an economic element in this project will allow the potential for such interventions to be explored and the methods needed to collect economic data alongside a randomised trial to be tested.
Previous studies in clinical settings have collected a range of data on the wider social consequences of hazardous drinking and valued these consequences in monetary terms. Which costs should be included in such economic analysis have been the subject of debate. Studies of treatment interventions, such as UKATT, have focused on public sector resource costs and excluded other costs such as the impact on productivity (UKATT Research Team, 2005). The UKATT study followed guidelines issued by NICE (NICE 2008) which reflect that for treatment the main decision maker is the NHS or more broadly the public sector. Such evaluation excludes productivity costs.
Costs relevant to employers may well be different and clearly small effects of screening for hazardous drinking and delivering brief interventions, for example through extra sickness absence from binge drinkers, could have a major impact on them. The outcomes could include productivity of individuals but also wider employment outcomes such as turnover and staff development goals (Godfrey 1997). In addition, employers may have much less concern of the costs that fall on the public sector and the general taxpayer. However, the delivery of brief interventions to employees could bring potential benefits to both employers and the public sector.
For all of these reasons, it was decided to incorporate an economic evaluation into the study design from the outset. A detailed description of this exploratory study is the focus of this report.

4
2 METHODS
2.1 Purpose of the study
The study aimed to explore the feasibility and cost effectiveness of screening employees for hazardous drinking prior to conducting a randomised controlled trial (RCT) of a brief intervention, delivered by an occupational health nurse.
The objectives were to:
a) provide data on which to estimate the sample size required to detect a statistically significant difference, with statistical power of 80%, between experimental and control groups.
b) evaluate the appropriateness of the proposed economic model to evaluate the cost-effectiveness of screening for hazardous drinking and the brief intervention delivered by an occupational health nurse.
c) identify potential logistical difficulties that may be encountered when screening employees for hazardous drinking, and conducting an RCT of a brief intervention administered by an occupational health nurse.
d) identify confounders that could influence the dependent variables. e) explore participants’ views of the acceptability of the screening and the
intervention.
2.2 Plan of investigation
There were three elements to the study, namely:
i) An investigation of the costs and logistics of screening employees for hazardous drinking;
ii) The exploratory trial to test the feasibility of conducting an RCT and economic evaluation;
iii) An assessment of the acceptability to employees of the screening and the intervention.
The methods used for each of these elements and the results from each stage are presented in Chapters 3, 4 and 5 of this report. The findings of the entire study are discussed in Chapter 6.
2.3 Study population
In the UK, local authorities employ individuals from a range of occupations and socio-economic groups. In light of this, it was felt that local authority employees are, in many ways, representative of the working population.
2.4 Access and ethics
Permission was sought to conduct the study in a local authority council which serves a mixed urban and rural population in Scotland. This was granted by the Assistant Chief Executive (Personnel) of the Council (Appendix 1). The Principal Health and Safety Advisor was nominated as the contact person for the Research Team.

5
The local authority council did not have an Ethics Committee, so approval to conduct the study was sought and granted by the Ethics Committee of the School of Nursing, Midwifery and Community Health of Glasgow Caledonian University (Appendix 2).
All potential participants at each stage of the study were sent a letter of invitation which included information about the study and what their participation would involve (Appendices 3 and 4). Assurances of confidentiality were given to all participants. All data were anonymised such that names were replaced by an identification number. All hard copies of data were stored separately in a locked filing cabinet, and all electronic data on a password protected computer.
2.4.1 Screening
The potential recruits to the screening were informed that the purpose of this stage of the study was to conduct a general health and lifestyle survey and that they may be invited to take part in a future stage of the study. Included with the letter of invitation was a copy of the screening questionnaire, instructions for its completion and return, and a stamped addressed envelope. In an attempt to maximise the response rate to the screening, all individuals who returned completed questionnaires had the opportunity to enter into a prize draw for £50 worth of gift tokens for a well known department store. Offering such an incentive has been shown to be effective in increasing response rates in postal surveys (Edwards et al. 2002).
Individuals who responded to the screening questionnaires saying that they would like to stop smoking and/or make improvements to their diet were sent a booklet designed to promote the relevant health behaviour change used by the local NHS Health Promotion Department as well as information on local support agencies. Screened participants who were excluded from the randomised controlled trial on grounds of harmful drinking as identified by the AUDIT tool were given information regarding appropriate local services, the national Helpline telephone number, and a self-help booklet.
2.4.2 Exploratory trial
Following discussion within the Research Team and with the Research Advisory Group, it was decided that the focus of the study (i.e. alcohol consumption at hazardous levels) should not be disclosed. This decision was taken in order to protect the confidentiality of participants with regard to colleagues and managers, whose permission would be required for hazardous drinkers to attend the consultation for delivery of the brief intervention. It was therefore decided to refer to the brief intervention as a ‘health and lifestyle consultation’. The participants allocated to the intervention group were informed verbally that the consultation would focus on alcohol use and health and wellbeing.
Participants assigned to the control group received information on reducing alcohol consumption to within recommended levels following collection of the follow-up data.
6
3 STAGE 1: SCREENING
3.1 Sample
At the time of recruitment, the local authority in which the study was conducted employed 7,522 people within four service designations, namely Corporate Services, Educational Services, Social Services, and Property Services.
Employees’ posts were categorised as a), managerial and professional occupations, b), intermediate occupations, and c), routine and manual occupations according to the classification used in the 2006 General Household Survey (Office for National Statistics 2006). The target sample size was 60, with the experimental and control groups both comprising 20 hazardous drinkers from each occupational category.
In a study conducted in Finland in which employees were screened by occupational health services to determine eligibility for recruitment to a brief intervention study (Aalto et al. 1999), 9.4% of the total sample were identified as ‘heavy drinkers’. Assuming a consent rate of 75% to the intervention study, we estimated that 900 employees would be required to be screened to identify a sample of 63 hazardous drinkers. As described in Section 3.3, the number of employees that was ultimately required was 1,514.
The sample was stratified such that the proportions selected for recruitment reflected the profile of the service designation populations. Computer generated random numbers were used initially to identify potential participants from a numbered list that gave the occupational categories of the employees. A random stratified sample that reflected the occupational profile of the Council was selected.
3.2 Data collection
3.2.1 Alcohol use
The data were collected by means of a self-complete questionnaire that incorporated the Alcohol Use Disorders Identification Test (AUDIT). The AUDIT is a well validated screening tool for the identification of hazardous and harmful drinkers, developed specifically for use in generic settings such as primary care (Babor et al. 2001). It therefore was considered appropriate as the screening tool for this study.
Babor et al. (2001) suggest that administration of the AUDIT as a self-complete questionnaire may produce more accurate responses than when administered within an interview, in addition to being less time-consuming and costly. The authors also contend that the AUDIT can be used within a general lifestyle questionnaire. Early discussions with the Senior Occupational Health Advisor had ascertained that there were no opportunities for employees to attend the occupational health service on a routine basis at which screening for this project could be conducted. It was decided, for these reasons and also to protect the confidentiality of participants from workplace colleagues, that the screening questionnaire would be administered by means of a postal survey.
The full questionnaire (Appendix 5) comprised four sections that sought information on the participants’ demographic characteristics, smoking, diet, and alcohol

7
consumption. The section on smoking used the Fagerstrőm Test for Nicotine Dependence, which is a well validated tool (Heatherton et al. 1991). Seven items that are associated with the most common diet-related health risks were selected from the European Health and Behaviour Survey questionnaire, developed and validated by Wardle and Steptoe (1991) using a format and layout that was similar to that of the AUDIT. The final section comprised the AUDIT. The criterion for identification as a hazardous drinker, and therefore eligible to the exploratory trial, was an AUDIT score of between 8 and 15 for males or between 6 and 15 for females (Bergman and Kallmen 2002).
The format of response options for the items on smoking and diet were amended to ensure consistency with the AUDIT. Since it was being used in this study as a self-complete instrument, we felt that it was important to incorporate information on what one ‘drink’ means in terms of the ethanol content of a unit of alcohol for common beverages (see Item 2, Section C of the screening instrument, Appendix 5).
The full questionnaire was pre-tested with a panel of experts (n=16) which comprised members of the Research Advisory Group and other individuals with experience of health promotion, occupational health, questionnaire design and analysis, and statistics prior to its use for this study. 3.2.2 Screening costs
The costs of the intervention and control conditions for the exploratory trial are made up of both screening costs and intervention costs. The long run opportunity costs are calculated following standard methodology developed by the University of Kent (Curtis 2007). This builds upon the actual salary costs to include allowance for salary on costs (14%); qualifications, and overheads. The costs were based on the average of the NHS pay scale (£24,103 - £32,653). This yields an annual cost of £45,508. Assuming a working year of 1575 hours, this yields a cost per minute of £0.48.
Screening was necessary for both the intervention and control conditions. A simple costing analysis was undertaken on the costs of the mailing method used in this study based on the time and materials used.
The AUDIT score was calculated by a research assistant, taking two minutes per returned questionnaire.
3.3 Recruitment to screening
As indicated in Section 3.1, the initial intention had been to invite a selected sample of 900 employees to take part in the screening survey. They were also given the opportunity to complete it by telephone, if preferred, but no-one did so. Reminder letters with a further copy of the questionnaire and a stamped addressed envelope were sent on one occasion. When a completed questionnaire was returned indicating a hazardous drinker, the participant was invited by letter to take part in the exploratory trial. If no consent form was returned within four weeks a further invitation was posted (details of the information that was sent at this stage are given in Section 4.1).

8
Recruitment proceeded at a lower rate than was anticipated, so additional numbers of employees were selected and invited to take part. The number of invitations to take part and response rates at each wave of recruitment are summarised in Table 3.1 below. The criterion for eligibility was an AUDIT score of between 8 and 15 for males or between 6 and 15 for females (Bergman and Kallmen, 2002). From the 900 employees who were originally screened, 105 hazardous drinkers were identified and invited to take part in the exploratory trial. Of these 105 individuals, 36 employees consented, i.e. 24 short of the target number.
A further 300 employees were selected, using the same process as is described in Section 3.1, from whom 24 were identified hazardous drinkers and eight consented to take part in the exploratory trial. Since this was 16 short of the target sample size, a meeting was held with the Council’s Principal Health and Safety Advisor and the Senior Occupational Health Nurse. It was agreed that a different approach to recruitment should be explored. The Senior Occupational Health Advisor suggested that the research assistant could distribute the questionnaires in the waiting room while employees waited for their appointments.
The research assistant attended clinics on two occasions for six hours on each day. On the first occasion that she attended one of these clinics, ten employees were invited to take part. Six consented, one had already responded to the postal survey, and three declined. On the second occasion a further five employees were approached, three of whom completed questionnaires.
Given that this method of data collection resulted in seven completed screening questionnaires at a cost of 12 hours of research assistant time, in addition to four hours of travel time, it was felt that this was not a cost effective use of the research assistant’s time. A further meeting was held with the Council’s Principal Health and Safety Advisor and it was agreed to facilitate the identification of a further 300 employees, who were subsequently invited to take part, but that no further recruitment would be facilitated.
In summary, the screening questionnaire was delivered by post to a total of 1,500 employees, and fourteen following a face-to-face invitation (n=1,514).

9
Table 3.1
Questionnaire distribution and response rates by wave of recruitment
1st mailing of screening questionnaires Questionnaires sent Completed
questionnaires returned
Hazardous drinkers Consented to take part in exploratory
trial 900 409 105 36
2nd mailing of screening questionnaires 300 116 24 8
Distribution of questionnaires at Occupational Health services 14 7 1 -
3rd mailing of screening questionnaires 300 95 33 11
Totals 1,514 627 (41.4%) 163 55
The 163 hazardous drinkers constitute 26.01% of those who took part in the screening process, and 10.8% of the total number (n=1,514) who were sent a screening questionnaire. The 55 who consented to take part in the trial represented 33.7% of the individuals who were identified by AUDIT as hazardous drinkers (n=163).
3.4 Data collection and management
Data were collected by means of a postal survey as described above. Data from all returned questionnaires were entered into an SPSS (version 16) file by the research assistant. A ten percent sample of the data was checked by the PI for accuracy.
3.5 Results
3.5.1 Response rate
Following one reminder, 627 questionnaires were returned, giving a 41.4% response rate to the screening.
3.5.2 Demographic data
One hundred and sixty-nine (27.0%) respondents were male and 458 (72.8%) were female. Table 3.2 provides information on the participants’ ages and occupational categories.

10
Table 3.2
Ages, occupations and AUDIT scores at screening Age Frequency (%) 16-24 yrs 22 (3.5%)25-44 yrs 244 (38.9%)45-64 yrs 357 (56.9%)65 yrs+ 4 (0.6%)Occupation Managerial/professional 240 (38.3%) Intermediate occupations 210 (33.5%)Routine/manual 173 (27.6%)Missing values 4 (0.6%)
3.5.3 Alcohol use
An AUDIT score of 0-7 for men, or 0-5 for women is indicative of low-risk drinking, 8-15 for men and 6-15 for women indicates hazardous drinking (Bergman and Kallmen 2002), and between 16 and the maximum score of 40 suggests a high level of alcohol problems (Babor et al. 2001).
Table 3.3 presents the frequency values for the categories of drinkers derived from the total AUDIT scores and Table 3.4 gives frequencies for responses to Items 2 and 3 information of the AUDIT that refer to alcohol use by gender and age.
Table 3.3
AUDIT categories at screening
AUDIT categories Abstainers (zero score) 77 (12.3%)Males ≤ 7; females ≤ 5 (Low risk) 361 (57.6%)Males 8-15; females 6-15 (hazardous drinkers)
163 (26.0%)
≥ 16 (harmful drinkers) 15 (2.4%)Missing values 11 (1.8%)
Table 3.4
Alcohol use at screening by age and gender
Age Gender
6-24 yrs 25-44 yrs 45-64 yrs 65 yrs+
Male (n=169)
Female (n=458)
Never 2 (0.3%) 27 (4.3%) 48 (7.7%) 0 11 (1.7%) 66 (10.5%) Monthly or less 6 (1.0%) 61 (9.7%) 68 (10.8%) 0 18 (2.9%) 117 (18.7%)
2-4 times/mth 8 (1.3%) 64 (10.2%) 82 (13.1%) 0 46 (7.3%) 109 (17.4%)
2-3 times/wk 7 (1.0%) 78 (12.4%) 106 (16.9%) 0 60 (9.6%) 131 (21.0%)
4 or more/wk 2 (0.3%) 16 (2.6%) 52 (8.3%) 0 34 (5.4%) 35 (5.6%)

11
3.5.4 Screening costs
Table 3.5 Material Costs of Screening
Stationery £ 3,000 pages of A3 paper for questionnaire 155.94 3,000 pages of A4 paper for letter 72.06 3,000 A4 envelopes 508.20 3,000 A5 envelopes for return of completed questionnaires 285.24 Postage 3,000 business reply labels (2nd class postage) 1,020.00
Photocopying 3,000x 8 pages at 1p per page 2,400.00
Staff time 3,000 at 240 envelopes per hour (4/min) at £0.48/min 627 AUDIT scores @ 2 mins per Audit @ £0.48/min
360.00 253.00
TOTAL £5,043.36
The total costs for screening for 3000 mailings, which includes one posting plus one reminder, are shown in Table 3.4. The AUDIT score was calculated by a research assistant, taking two minutes per returned questionnaire (n=627) at £0.48 per minute. The total cost, therefore, of screening 1,500 individuals in the workplace by post were £5,043.36, i.e. £3.60 per person screened.
Information regarding the acceptability of the screening process is given in Section Five of this report.
12
STAGE 2: EXPLORATORY RANDOMISED CONTROLLED TRIAL
4.1 Eligibility and recruitment
The inclusion criterion for entry to this part of the study was based on the AUDIT scores described in Section 3.3 of this report. Those employees whose scores indicated hazardous drinking of 8-15 for men and 6-15 for women satisfied the inclusion criterion. Those employees who indicated on the screening questionnaire that they did not wish to receive any further information about alcohol were also excluded (n=11).
Based on the above criterion, a total of 152 participants were eligible. As the screening questionnaires were returned, those individuals whose AUDIT scores indicated eligibility were invited to take part in Stage 2. The first eligible individual for whom a completed questionnaire was received was randomly allocated to the control group and all subsequent eligible individuals were invited alternately to intervention or control group as the questionnaires were received.
Seventy-six employees were invited by letter to take part in the intervention group and 76 in the control group. Of these, 28 individuals returned consent forms agreeing to take part in the intervention group, and 29 in the control group. Those who had not replied within four weeks were sent a reminder invitation. Two of those who consented to take part in the intervention group could not be contacted for the intervention, therefore a total of 26 employees received the intervention and were available to provide both pre- and post-test data.
4.2 Outcome measures
The primary outcome measures were changes in AUDIT score and reported alcohol consumption at six months follow-up as measured by a seven-day retrospective drinking diary. Secondary outcomes comprised changes in the quality of life and economic indicators in terms of service use, employment outcomes, public sector resource and employment costs.
4.3 Instruments
The data collection instruments that were used to measure the primary outcomes were the AUDIT and a retrospective drinking diary. The EQ-5D and a service use questionnaire were used as measures of the secondary outcomes. 4.3.1 AUDIT
In addition to its use as a screening instrument, the AUDIT was used at follow-up to determine whether change had occurred. 4.3.2 Retrospective drinking diary
The seven-day retrospective drinking diary (Appendix 6) was used to calculate weekly alcohol intake, the maximum units of alcohol consumed on any one day in the last week, and the number of alcohol drinking days in the last week. Measurement of alcohol consumption in this way provides a reliable method of

13
detecting individuals who consume a high level of alcohol (Watson 1999, Del Boca and Darkes 2003). 4.3.3 Quality of life
Quality of life was assessed by the EQ-5D (Appendix 7). This tool was developed by an international network of researchers (Robin and de Charro 2001) and provides a generic measure of health-related quality of life. The EQ-5D index can be used to calculate Quality of Life Years (QALYs) from quality of life indices combined with information about gains from an intervention . The use of generic measures, such as the EQ-5D, for economic evaluations is advocated by NICE so that comparisons can be made across different types of interventions (NICE 2008).
The participants were also asked to estimate their own health state using a visual analogue ‘thermometer’ scale (Brooks 1996). These data were collected during a telephone interview at baseline and at the 6 month follow-up period.
4.3.4 Economic evaluation questionnaire
The economic evaluation questionnaire (Appendix 7) was also administered on both occasions to both groups as part of the telephone interview, as was the EQ-5D.
The service use questionnaire comprises items designed to measure:
1. Treatment for drinking problems
2. Primary and secondary health care use
3. A range of social care and information services in statutory, private and voluntary sectors
4. Sources and levels of income
5. Employment status, sickness absence, work-related accidents, and self assessed alcohol related problems at work
6. Criminal justice service involvement and use
The instrument was originally developed for the UKATT trial (UKATT Research Team 2005) but was subsequently revised and has been used in both an alcohol randomised controlled trial in primary care (Drummond et al. 2003) and in two drug misuse trials (UKCBTMM Project Group 2004), and enhanced counselling in the primary prevention of Hepatitis C amongst injecting drug users (Abou-Saleh et al. 2008).
4.4 Data Collection
All four instruments were administered to participants in both the intervention and control groups at both baseline and also at follow-up 6 months after delivery of the intervention:
At Time 1, the AUDIT was administered within the screening process as described previously. At follow-up, the AUDIT was administered as the first part of a

14
telephone interview conducted by the principal investigator (PI), who was blind to the group to which the participants had been assigned.
At Time 1, the retrospective drinking diary for alcohol use was administered to participants in the intervention group as a structured interview by the occupational health nurse who delivered the brief intervention. It was administered by the PI to the control group participants at baseline, and also to both groups at follow-up, as part of the telephone interview, during which the economic and EQ-5D questionnaires were also administered.
4.5 Intervention
The participants who were randomized to the experimental group received the brief intervention. This comprised a one-to-one consultation during which information aimed at promoting behaviour change was provided. The brief intervention was underpinned by self-efficacy (Bandura 1977) and readiness to change theory (Prochaski and Di Clemente 1984, Miller and Rollnick 2002).
The intervention was delivered by a registered nurse (Marisa Stevenson) who has a post-registration qualification in occupational health nursing and several years of experience in that field. She is therefore a specialist in occupational health but not in addictions. In order to prepare for her role in this study, she received training in delivering the intervention from Dr Niamh Fitzgerald, an experience trainer in the alcohol field, and Professor Hazel Watson (PI). The training took the form of discussion, practical exercises based on case studies, and role play.
The intervention was based on the principles of motivational enhancement and incorporated the six elements of the FRAMES model (Miller and Rollnick 2002), namely Feedback, Responsibility, Advice, Motivation, Empathy, and Self-Efficacy. She was trained to assess motivation and readiness to change and to adopt an empathetic interviewing style that enhanced self-confidence to change. She acknowledged the fact that people choose to drink in a range of ways that are contextualised and mediated by a variety of social factors. She aimed to avoid ‘labelling’ while providing information about drinking and fostering goal setting within a personal development plan to reduce alcohol use. She was taught how to help people to draw up a decisional "balance sheet" of what, for them, were positive and negative effects of drinking. Where appropriate, she:
gave information about the links between their drinking and any identified health or social problems
taught participants how to calculate how much they drink gave information about moderate drinking limits and health risks
associated with increasing levels of consumption gave information about how to cut down their consumption discouraged binge drinking gave advice about spreading drinking throughout the week, pointing out
that everyone should have at least one alcohol-free day each week
During the delivery of the intervention she used the Drinkaware Unit Calculator and health promotion booklets produced by NHS Health Scotland to reinforce specific points. These materials were left with the participants. All participants were offered the choice of meeting with the occupational health nurse for delivery of the intervention on either Council premises or at home. Interestingly, 21 chose to meet

15
in the workplace as opposed to five who elected their home as the venue. Two of those whose intervention was delivered in their own home were off sick at the time, and the remaining three did not have ready access to a private location for the consultation.
4.5.1 Intervention costs
The duration of the intervention ranged between 20 and 45 minutes, the average being 26 minutes. The long run opportunity costs of delivering this intervention are calculated following standard methodology developed by the University of Kent (Curtis 2007). As described in Section 3.2.2, the cost per minute for delivery of the screening and the intervention was estimated at £0.48. Intervention costs were based on the average time per intervention. The control condition was assumed to incur no extra costs.
4.6 Statistical analysis
The baseline and follow-up data were entered into an SPSS (version 16) file by the research assistant (K McA). All data were checked by the principal investigator (HW) for accuracy.
The main outcome variables (AUDIT, Number of Drinking Days per Week, Maximum Number of Units in One Day, and Total Weekly Consumption) were firstly summarised by group and time using their means and standard deviations. Two factor general linear analysis (ANOVA) models were then used on each of the four variables to investigate the significance or not of the Group factor, the Time factor and the Group*Time interaction. The assumptions of normality and constant variance were assessed and found to be acceptable. There was some evidence that the constant variance assumption was perhaps suspect for the Total Weekly Consumption variable. The level of significance was set at 5% and all analyses were performed on SPSS v16 and Minitab v15.
The economic analysis of the exploratory trial consisted of estimates of the costs of delivering the intervention, potential for resource saving and the outcomes of the trial expressed as Quality Adjusted Life Years (QALYs). EQ-5D results were combined with the population values from Kind et al. (1999) to give an overall index score of health. Changes between baseline and follow-up were calculated from the 53 participants with completed cases for the economic questionnaires (2 datasets were incomplete).
Unit costs from a variety of sources were used (see Appendix 8) to convert service use as derived from the responses to the Service Use Questionnaire to costs. The questionnaire was extensive and not all items occurred among the sample; only those used are reported in Appendix 9. All costs were converted to 2006/07 price year, the nearest date to the research. Sources of the data for the unit cost and average use of each item are shown in Appendix 8.
16
4.7 Results
4.7.1 Response rates
As indicated in Section 4.1, 55 employees consented to take part in the Stage 2 study, 26 in the intervention group and 29 as controls.
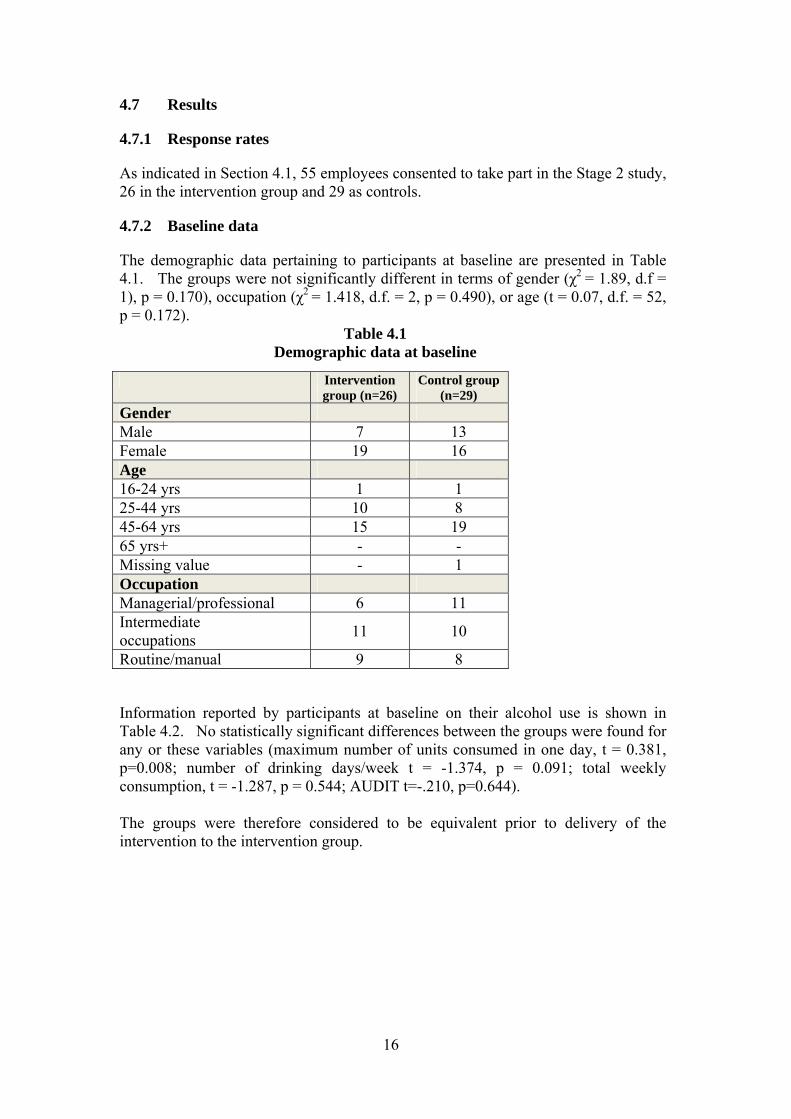
4.7.2 Baseline data
The demographic data pertaining to participants at baseline are presented in Table 4.1. The groups were not significantly different in terms of gender (χ2 = 1.89, d.f = 1), p = 0.170), occupation (χ2 = 1.418, d.f. = 2, p = 0.490), or age (t = 0.07, d.f. = 52, p = 0.172).
Table 4.1 Demographic data at baseline
Intervention
group (n=26) Control group
(n=29) Gender Male 7 13 Female 19 16 Age 16-24 yrs 1 1 25-44 yrs 10 8 45-64 yrs 15 19 65 yrs+ - - Missing value - 1 Occupation Managerial/professional 6 11 Intermediate occupations 11 10
Routine/manual 9 8
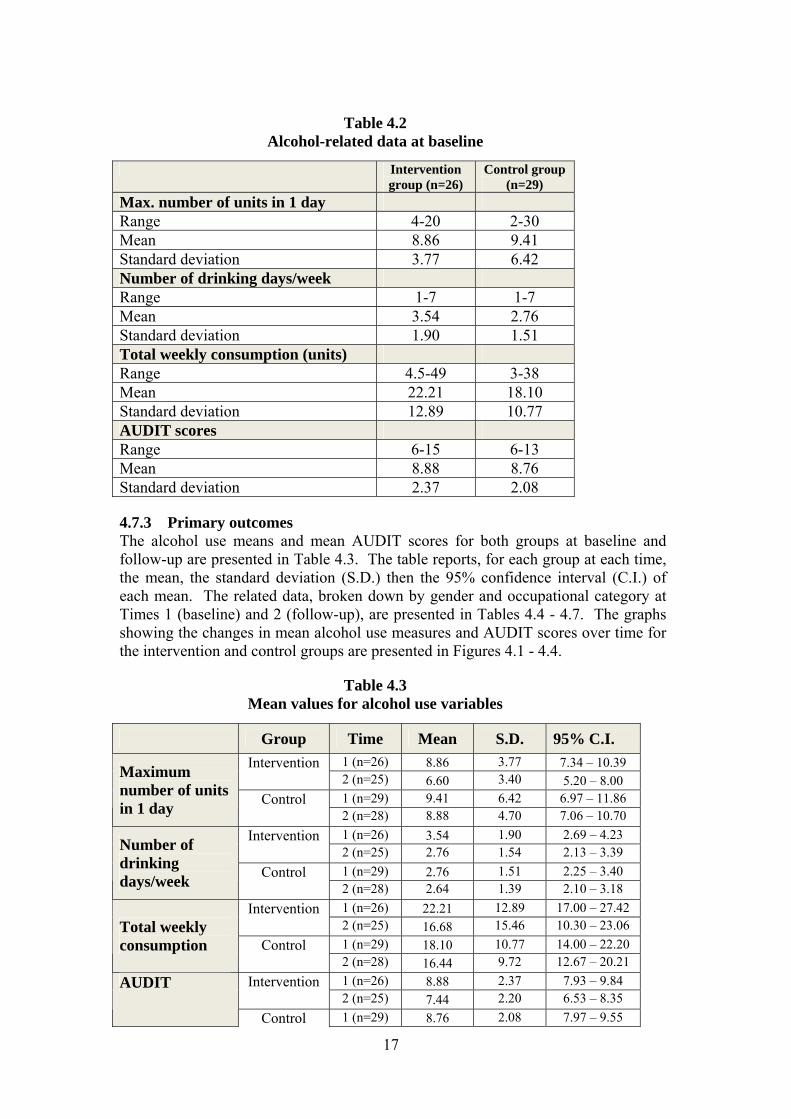
Information reported by participants at baseline on their alcohol use is shown in Table 4.2. No statistically significant differences between the groups were found for any or these variables (maximum number of units consumed in one day, t = 0.381, p=0.008; number of drinking days/week t = -1.374, p = 0.091; total weekly consumption, t = -1.287, p = 0.544; AUDIT t=-.210, p=0.644). The groups were therefore considered to be equivalent prior to delivery of the intervention to the intervention group.
17
Table 4.2
Alcohol-related data at baseline
Intervention group (n=26)
Control group (n=29)
Max. number of units in 1 day Range 4-20 2-30 Mean 8.86 9.41 Standard deviation 3.77 6.42 Number of drinking days/week Range 1-7 1-7 Mean 3.54 2.76 Standard deviation 1.90 1.51 Total weekly consumption (units) Range 4.5-49 3-38 Mean 22.21 18.10 Standard deviation 12.89 10.77 AUDIT scores Range 6-15 6-13 Mean 8.88 8.76 Standard deviation 2.37 2.08
4.7.3 Primary outcomes The alcohol use means and mean AUDIT scores for both groups at baseline and follow-up are presented in Table 4.3. The table reports, for each group at each time, the mean, the standard deviation (S.D.) then the 95% confidence interval (C.I.) of each mean. The related data, broken down by gender and occupational category at Times 1 (baseline) and 2 (follow-up), are presented in Tables 4.4 - 4.7. The graphs showing the changes in mean alcohol use measures and AUDIT scores over time for the intervention and control groups are presented in Figures 4.1 - 4.4.
Table 4.3 Mean values for alcohol use variables
Group Time Mean S.D. 95% C.I. Intervention 1 (n=26) 8.86 3.77 7.34 – 10.39
2 (n=25) 6.60 3.40 5.20 – 8.00 Control 1 (n=29) 9.41 6.42 6.97 – 11.86
Maximum number of units in 1 day 2 (n=28) 8.88 4.70 7.06 – 10.70
Intervention 1 (n=26) 3.54 1.90 2.69 – 4.23 2 (n=25) 2.76 1.54 2.13 – 3.39
Control 1 (n=29) 2.76 1.51 2.25 – 3.40
Number of drinking days/week 2 (n=28) 2.64 1.39 2.10 – 3.18
Intervention 1 (n=26) 22.21 12.89 17.00 – 27.42 2 (n=25) 16.68 15.46 10.30 – 23.06
Control 1 (n=29) 18.10 10.77 14.00 – 22.20 Total weekly consumption
2 (n=28) 16.44 9.72 12.67 – 20.21 Intervention 1 (n=26) 8.88 2.37 7.93 – 9.84
2 (n=25) 7.44 2.20 6.53 – 8.35 AUDIT
Control 1 (n=29) 8.76 2.08 7.97 – 9.55

18
2 (n=28) 7.54 2.72 6.48 – 8.59
4.7.3.1 Maximum number of units in 24 hours
Figure 4.1
TIMEPostPre
Mea
n nu
mbe
r of
uni
ts
10.0
5.0
0.0
IGCG
GROUP
Mean Plot of Maximum Units per Day by Group and Time
Table 4.4 Maximum number of units in 24 hours by gender and occupational group
Group Time Mean S.D. Intervention 1 (n=26) 8.86 3.77
2 (n=25) 6.60 3.40 Control 1 (n=29) 9.41 6.42
All participants
2 (n=28) 8.88 4.70 Intervention 1 (n=7) 10.93 4.75
2 (n=7) 7.93 4.31 Control 1 (n=14) 11.82 8.04 Males
2 (n=13) 10.75 5.54 Intervention 1 (n=19) 8.11 3.14
2 (n=18) 6.08 2.97 Control 1 (n=15) 7.17 3.35 Females
2 (n=15) 7.27 3.21 Intervention 1 (n=6) 9.33 3.06
2 (n=6) 9.67 1.86 Control 1 (n=12) 8.38 5.07
Managerial/ professional 2 (n=11) 9.46 4.23
Intervention 1 (n=11) 8.46 2.52 2 (n=11) 6.59 2.84
Control 1 (n=10) 9.20 6.51 Intermediate
2 (n=10) 8.65 6.17 Intervention 1 (n=9) 9.06 5.49 Routine/
2 (n=8) 4.31 3.41
19
Control 1 (n=6) 12.08 9.30 manual 2 (n=6) 8.00 3.58
As shown in Table 4.4, the mean maximum amount of alcohol consumed within one 24 hour period during the week prior to data collection reduced in both groups. The reduction was greater in the intervention group. The analysis of variance of the data indicated that, although there was no significant effect for group (F = 3.01, p = 0.087), the time effect approached the level of statistical significance (F = 3.830; p = 0.054). No interaction was found (F=1.48; p = 0.228). The descriptive statistics suggest a time effect for both males and females but, for both genders, this is much more pronounced in the intervention group where the mean values at follow-up drop to close to the accepted level of binge drinking (>8 units for men; >6 units for women), whereas those in the control group remain elevated.
It is interesting to note that the mean maximum number of units consumed within one day reported by those in managerial or professional roles in both intervention and control groups rose slightly between baseline and follow-up. On the other hand, the mean levels reported by both intermediate and routine/manual workers fell, the most marked reduction being reported by the routine/manual workers who had received the intervention. The baseline value was lower in the intervention group than the control group, but the extent of the reduction was marked. Findings should, however, be regarded with caution as the number of cases is small.
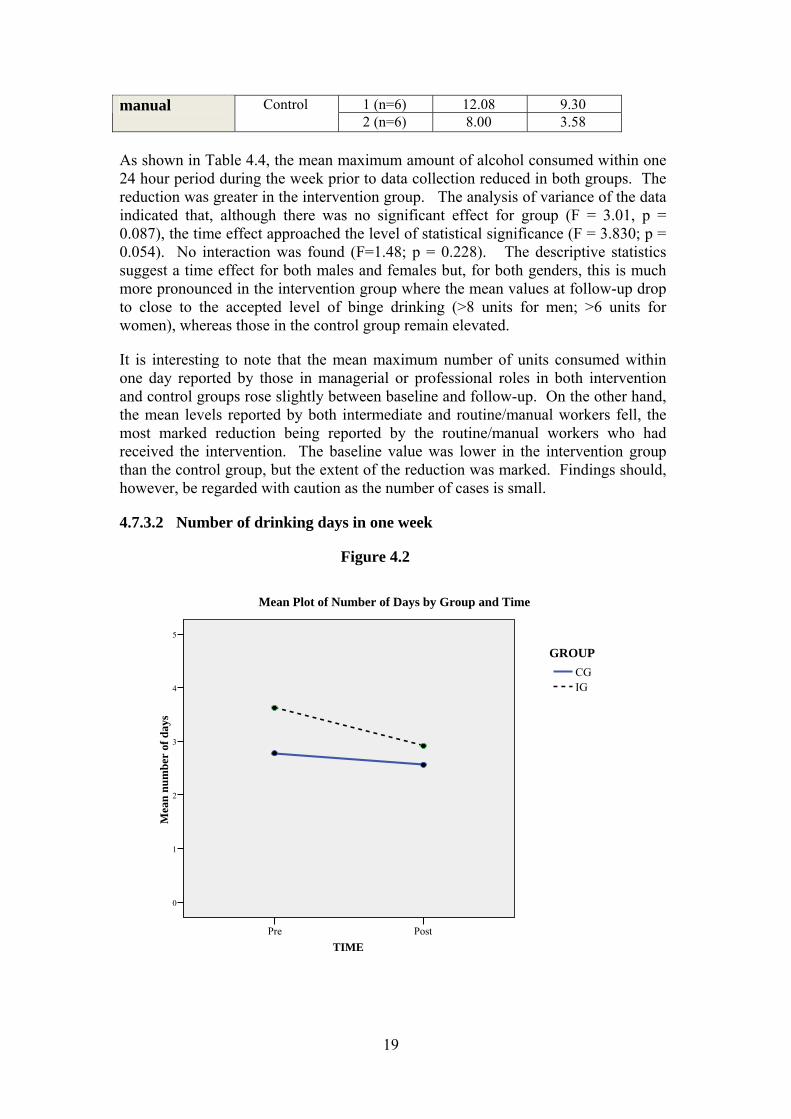
4.7.3.2 Number of drinking days in one week
Figure 4.2
TIMEPostPre
Mea
n nu
mbe
r of
day
s
5
4
3
2
1
0
IGCG
GROUP
Mean Plot of Number of Days by Group and Time

20
Table 4.5 Number of drinking days in one week by gender and occupational group
Group Time Mean S.D.
Intervention 1 (n=26) 3.46 1.90 2 (n=25) 2.76 1.54
Control 1 (n=29) 2.83 1.51 All participants
2 (n=28) 2.64 1.39 Intervention 1 (n=7) 4.00 2.58
2 (n=7) 2.71 1.97 Control 1 (n=14) 2.64 1.50 Males
2 (n=13) 3.00 1.29 Intervention 1 (n=19) 3.39 1.61
2 (n=19) 2.79 1.40 Control 1 (n=15) 2.87 1.55 Females
2 (n=16) 2.33 1.45 Intervention 1 (n=6) 4.33 2.34
2 (n=6) 3.33 1.63 Control 1 (n=12) 2.75 1.71
Managerial/ professional 2 (n=11) 3.27 1.19
Intervention 1 (n=11) 3.73 1.62 2 (n=11) 3.18 1.40
Control 1 (n=10) 2.90 1.66 Intermediate
2 (n=10) 2.40 1.35 Intervention 1 (n=9) 2.78 1.79
2 (n=9) 1.75 1.28 Control 1 (n=6) 2.50 1.05
Routine/ manual
2 (n=7) 1.50 0.84
The analysis of variance of the number of drinking days in the previous week found no significant time (F = 2.47, p = 0.120) or interaction effects (F = 0.71, p = 0.402). The overall group effect did however approach significance (F = 3.66, p = 0.060). The greatest mean reduction was reported by the males in the intervention group. The men in the control group reported a slight rise in the number of days when they consumed alcohol, but the baseline mean value was lower than that of the intervention group.
21
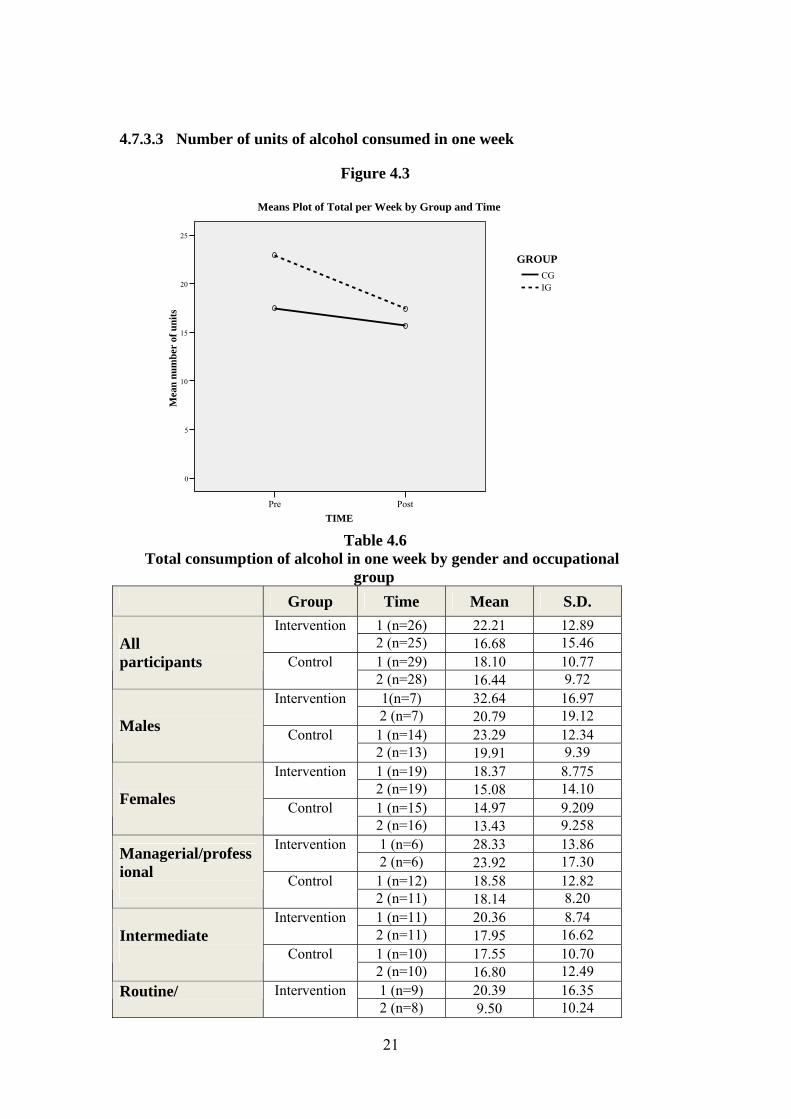
4.7.3.3 Number of units of alcohol consumed in one week
Figure 4.3
TIMEPostPre
Mea
n nu
mbe
r of
uni
ts
25
20
15
10
5
0
IGCG
GROUP
Means Plot of Total per Week by Group and Time
Table 4.6
Total consumption of alcohol in one week by gender and occupational group
Group Time Mean S.D. Intervention 1 (n=26) 22.21 12.89
2 (n=25) 16.68 15.46 Control 1 (n=29) 18.10 10.77
All participants
2 (n=28) 16.44 9.72 Intervention 1(n=7) 32.64 16.97
2 (n=7) 20.79 19.12 Control 1 (n=14) 23.29 12.34 Males
2 (n=13) 19.91 9.39 Intervention 1 (n=19) 18.37 8.775
2 (n=19) 15.08 14.10 Control 1 (n=15) 14.97 9.209 Females
2 (n=16) 13.43 9.258 Intervention 1 (n=6) 28.33 13.86
2 (n=6) 23.92 17.30 Control 1 (n=12) 18.58 12.82
Managerial/professional 2 (n=11) 18.14 8.20
Intervention 1 (n=11) 20.36 8.74 2 (n=11) 17.95 16.62
Control 1 (n=10) 17.55 10.70 Intermediate
2 (n=10) 16.80 12.49 Intervention 1 (n=9) 20.39 16.35 Routine/
2 (n=8) 9.50 10.24

22
Control 1 (n=6) 22.00 12.26 manual 2 (n=7) 10.67 4.13
The analysis of variance for the total consumption of alcohol during the previous week, no significant effects were found for group (F = 2.26, p = 0.137) or time (F = 2.69, p = 0.105), and no interaction (F = 0.69, p = 0.409). Both males and females in the intervention groups reported larger reductions than the control groups. The average drop was greater in men, but the standard deviations are large.
4.7.3.4 AUDIT
Figure
4.4

23
Table 4.7
AUDIT scores by gender and occupational group Group Time Mean S.D.
Intervention 1 (n=26) 8.88 2.37 2 (n=25) 7.44 2.20
Control 1 (n=29) 8.76 2.08 All participants
2 (n=28) 7.54 2.72 Intervention 1 (n=7) 9.43 1.81
2 (n=7) 8.86 2.55 Control 1 (n=14) 9.50 1.91 Males
2 (n=13) 8.15 2.61 Intervention 1 (n=19) 8.68 2.56
2 (n=18) 6.89 1.84 Control 1 (n=15) 7.80 1.74 Females
2 (n=16) 7.00 2.78 Intervention 1 (n=6) 8.83 0.98
2 (n=6) 8.33 2.34 Control 1 (n=12) 8.50 1.57
Managerial/ professional 2 (n=11) 7.18 2.56
Intervention 1 (n=11) 8.73 2.37 2 (n=11) 6.91 2.12
Control 1 (n=10) 8.60 2.22 Intermediate
2 (n=10) 7.00 2.66 Intervention 1 (n=9) 9.11 3.14
2 (n=9) 7.50 2.27 Control 1 (n=6) 8.83 2.77
Routine/ manual
2 (n=7) 9.00 3.27
A statistically significant effect was found in the mean AUDIT scores over time (F = 8.84, p = 0.004) but not for group (F = 0.001, p = 0.972), and no significant interaction was found (F = 0.14, p = 0.709).
4.7.4 Statistical power calculation
Given that one of the main aims of the project was to obtain estimates which could inform the future design of a large scale randomized controlled trail (RCT), details of proposed power estimates are now outlined.
Using the newly obtained estimates of the standard deviations for AUDIT, total weekly and maximum units per day as indicated on Table 4.3, nQuery Advisor v7 software, based on a two factor repeated measures ANOVA with Greenhouse-Geisser correction suggested that a fully powered RCT with 150 subjects per group should achieve a power in excess of 90%. Allowing for attrition of up to 20%, a power of at least 80% should still be possible with samples of 120 per group.
4.7.5 Secondary outcomes
4.7.5.1 EQ-5D and thermometer scales

24
Only data for which there were complete sets at baseline and follow-up were analysed, namely 25 in the intervention group and 28 in the control group.
As may have been expected from a sample of employees, general health was good and a significant number of both the control (18 out of 28) and intervention (16 out of 25) groups had a QALY value of 1 at baseline and all but 4 of these (2 in both groups) also had a value of 1 at the six month follow-up point. Average values of both the calculated QALY score and the thermometer values for the sample are given in Table 4.8. These indicate few differences between the two groups, both showing a small and insignificant fall in health status whether measured by the EQ-5D questionnaire or the thermometer scale.
Table 4.8 QALY and thermometer scores
Intervention Control Total Sample Mean S.D No. Mean S.D. No. Mean S.D. No. QALY baseline 0.88 0.19 25 0.92 0.10 29 0.91 0.15 54
QALY follow-up 0.88 0.21 24 0.91 0.21 28 0.90 0.21 52
QALY diff -0.002 0.24 24 -0.010 0.17 28 -0.006 0.21 52 Therm baseline 84.00 9.68 25 82.97 15.10 29 83.44 12.77 54
Therm follow-up 82.90 11.85 25 83.11 15.74 28 83.01 13.75 53
Therm diff -1.10 9.36 28 -0.85 16.34 28 -0.97 13.38 53
4.7.6 Costs of the Intervention
The duration of the intervention ranged between 20 and 45 minutes, the average being 26 minutes. It is likely in practice that an occupational health nurse may need extra time for record keeping etc. However, for this trial the cost is based on the average time of 26 minutes which yields a cost of £12.48 for each intervention delivered at the cost of 0.48 per minute.
4.7.6.1 Patterns of service use
Alcohol treatment
No participant at baseline and only one participant post-intervention reported any specialist alcohol treatment. The one participant reporting some treatment post intervention (from the control group) responded that it was in the form of counselling but gave no details of intensity. Given the lack of information and low response this was not costed in the final analysis. Given that there is a general low level of specialist treatment provision in the UK, this finding within a working population of hazardous rather than dependent drinkers is not surprising. The questions for this item were quite long and perhaps in future research this could be shortened to a simple yes/no question.

25

26
Hospital treatment Only sixteen of the 55 participants had any contact with hospital services prior to baseline and 15 had some contact in the six months between intervention and follow-up. 30 participants had no use of hospital services in either period, eight used hospital services in both periods. Eight used hospital services in the period before the trial but not in the period before follow-up while seven used hospital services in the period before follow-up but not in the period before the trial began. For most of the participants the contact was on an outpatient basis with few A&E or inpatient episodes. Only one incidence of using an emergency ambulance was recorded. More details are given broken down by intervention group and the two measurement points in Appendix 9a, b, and c. Primary care As may be expected there was far greater use of primary care services, 41 of the participants in the period before the study and 38 in the follow-up period. Of these, 29 had some use in both periods, with 11 only having contact before the study began and nine only having contact with any primary care services in the six months before the follow-up interview. A wide variety of the primary care services were used, the most frequent and numerous use being appointments at the practice for GP or practice nurse appointments. There was no use of Community Psychiatric Nurse services. Other social care, voluntary organisation and privately provided services Participants were offered a long list of other services and there were 11 participants who suggested they had used one of these services at baseline and an equal number at follow-up. However, there were rather more total services used at baseline with people using more than one service. Five used state housing advice; two alternative medicine practitioners, two counsellors, one a debt advisor, one a podiatrist and one a physiotherapist. At follow-up there was a drop in the different types of service and in general those using at the first time were the same at follow-up with three using state housing advice, three using other services and one a debt collector. More were using physiotherapists at follow-up, five compared to one at baseline and two rather than one were using occupational health services. Employment By its nature this trial recruited from a relatively stable workforce, all of whom had been employed at the Council in the six months prior to the study. Only two were not employed in the follow-up period. There were however some who had considerable periods of sick leave both prior to the study and in the period before the follow-up interview. No-one at the baseline interview compared to two at follow-up (one from the control and one from the interventions group) felt that their alcohol consumption had affected their work performance. Three people reported accidents at work at baseline but only one was reported at the follow-up interview. Average absences from work are shown in Table 4.9. Along with the reported fall in self reported health, absences also increased slightly in both groups, but there are no discernable differences.

27
28
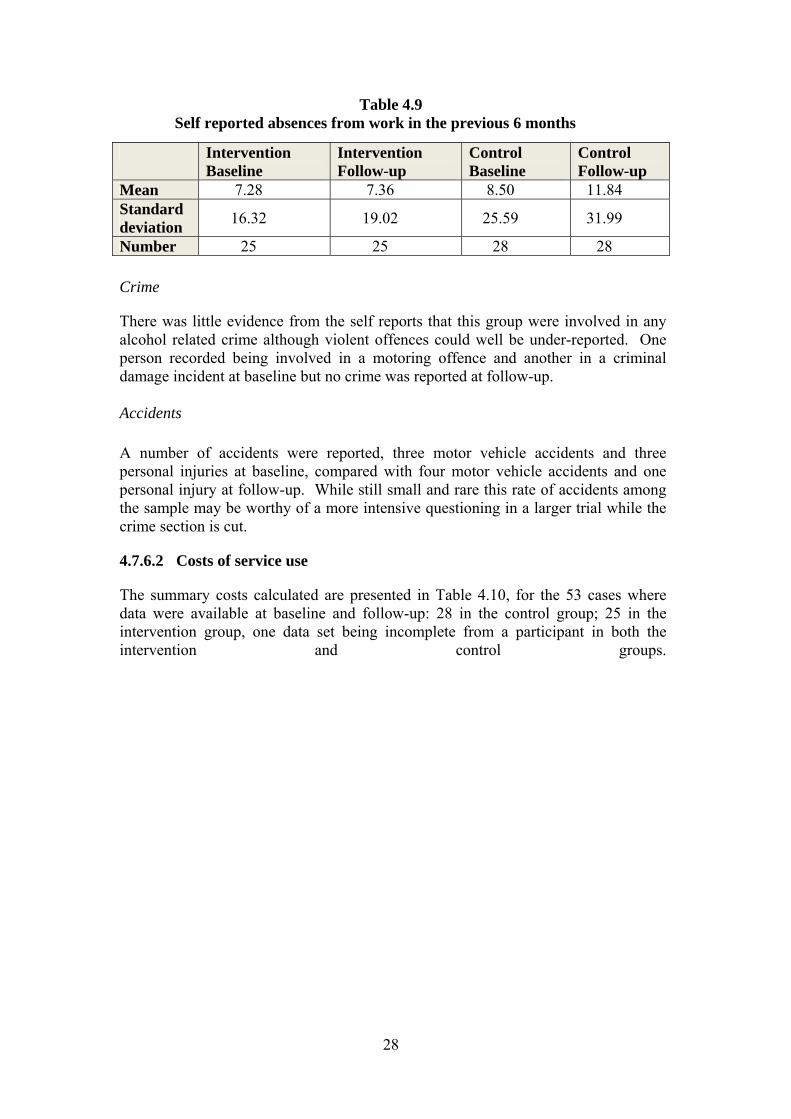
Table 4.9 Self reported absences from work in the previous 6 months
Intervention Baseline
Intervention Follow-up
Control Baseline
Control Follow-up
Mean 7.28 7.36 8.50 11.84 Standard deviation 16.32 19.02 25.59 31.99
Number 25 25 28 28 Crime
There was little evidence from the self reports that this group were involved in any alcohol related crime although violent offences could well be under-reported. One person recorded being involved in a motoring offence and another in a criminal damage incident at baseline but no crime was reported at follow-up. Accidents A number of accidents were reported, three motor vehicle accidents and three personal injuries at baseline, compared with four motor vehicle accidents and one personal injury at follow-up. While still small and rare this rate of accidents among the sample may be worthy of a more intensive questioning in a larger trial while the crime section is cut.
4.7.6.2 Costs of service use
The summary costs calculated are presented in Table 4.10, for the 53 cases where data were available at baseline and follow-up: 28 in the control group; 25 in the intervention group, one data set being incomplete from a participant in both the intervention and control groups.

29
Table 4.10
Calculated costs of service use and days absence at baseline and follow-up
Intervention (n=25)Mean S.D.
Control (n=28) Mean S.D.
Total (n=53) Mean S.D.
BASELINE
Primary care 45.60 81.72 37.29 42.55 41.21 63.56 Hospital care 119.56 261.52 295.11 573.13 212.30 458.20 Other services 24.24 94.25 13.96 36.98 18.81 69.54 Total service costs 189.40 306.11 346.36 588.28 272.32 478.78 Absences from work 408.00 716.08 633.68 1530.49 527.23 1210.72
FOLLOW-UP
Primary care 39.20 45.90 39.11 44.08 39.15 44.51 Hospital care 112.2 313.74 614.29 2858.36 377.45 2086.07 Other services 10.40 24.95 9.93 26.81 10.15 25.70 Total service costs 161.80 338.82 663.32 2876.51 426.75 2100.75 Absences from work 521.60 1288.15 1176.6 3608.48 867.66 2762.22 Differences in service costs between baseline & follow-up
27.60 398.93 -316.9 2865.91 -154.4 2090.04
Putting costs and consequences together
An incremental cost-effectiveness ratio is calculated from the following formula:
(cost of delivering the intervention – cost of delivering the control) – (changes in service costs due to the intervention – changes in service costs due to the control)/ (changes in outcome due to the intervention – changes in outcome due to the control)
This ratio is generally presented in terms of a unit change of the outcome measure, i.e. net cost per QALY.
Using the results presented, the ratio is made up of:
Differences in costs of intervention and control - £12.48 per person Differences in service costs – (27.60 – (316.9) = £344.5 per person; that is
there is a net saving of health and other care costs in the intervention group compared to the control.
This implies that there is a net saving of resources from the intervention of £332.02 However, this is subject to a very wide margin of error and is only presented as an illustration. The QALYs fell in both intervention and control but rather less for the
intervention group. The difference is -0.002 – (-0.010) yields a net advantage of the intervention of 0.008 QALYs.
30
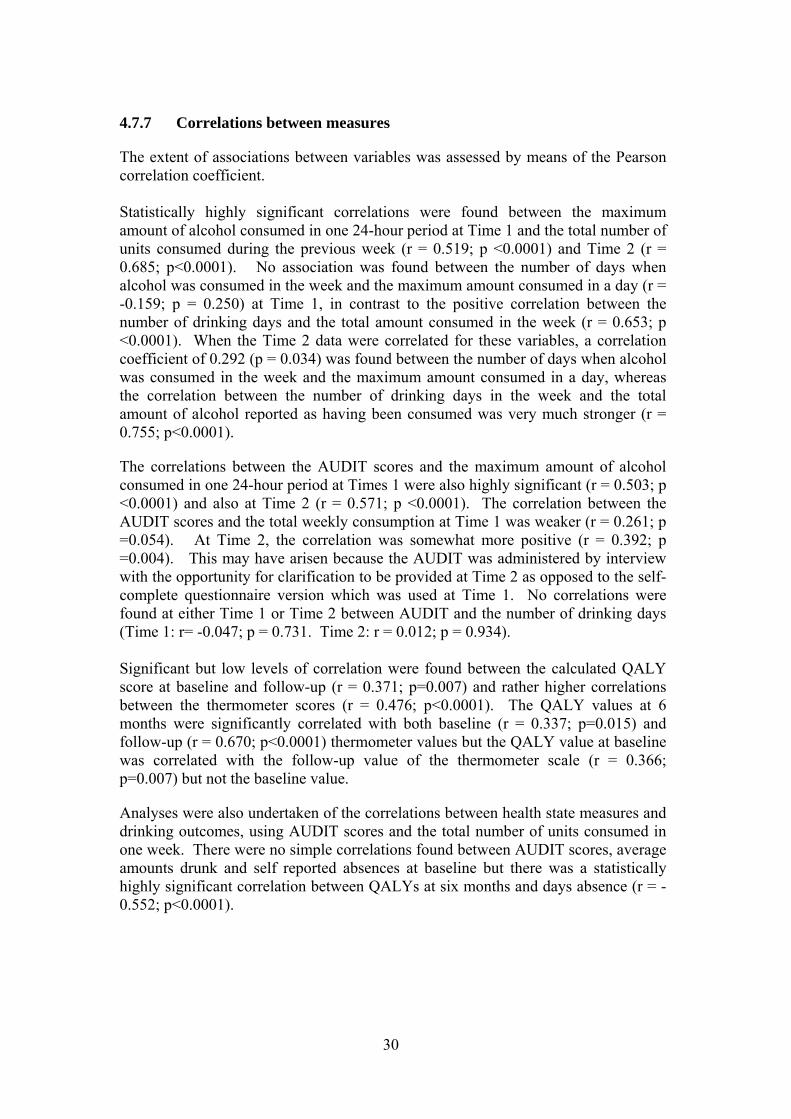
4.7.7 Correlations between measures
The extent of associations between variables was assessed by means of the Pearson correlation coefficient. Statistically highly significant correlations were found between the maximum amount of alcohol consumed in one 24-hour period at Time 1 and the total number of units consumed during the previous week (r = 0.519; p <0.0001) and Time 2 (r = 0.685; p<0.0001). No association was found between the number of days when alcohol was consumed in the week and the maximum amount consumed in a day (r = -0.159; p = 0.250) at Time 1, in contrast to the positive correlation between the number of drinking days and the total amount consumed in the week (r = 0.653; p <0.0001). When the Time 2 data were correlated for these variables, a correlation coefficient of 0.292 (p = 0.034) was found between the number of days when alcohol was consumed in the week and the maximum amount consumed in a day, whereas the correlation between the number of drinking days in the week and the total amount of alcohol reported as having been consumed was very much stronger (r = 0.755; p<0.0001).
The correlations between the AUDIT scores and the maximum amount of alcohol consumed in one 24-hour period at Times 1 were also highly significant (r = 0.503; p <0.0001) and also at Time 2 (r = 0.571; p <0.0001). The correlation between the AUDIT scores and the total weekly consumption at Time 1 was weaker (r = 0.261; p =0.054). At Time 2, the correlation was somewhat more positive (r = 0.392; p =0.004). This may have arisen because the AUDIT was administered by interview with the opportunity for clarification to be provided at Time 2 as opposed to the self-complete questionnaire version which was used at Time 1. No correlations were found at either Time 1 or Time 2 between AUDIT and the number of drinking days (Time 1: r= -0.047; p = 0.731. Time 2: r = 0.012; p = 0.934). Significant but low levels of correlation were found between the calculated QALY score at baseline and follow-up (r = 0.371; p=0.007) and rather higher correlations between the thermometer scores (r = 0.476; p<0.0001). The QALY values at 6 months were significantly correlated with both baseline (r = 0.337; p=0.015) and follow-up (r = 0.670; p<0.0001) thermometer values but the QALY value at baseline was correlated with the follow-up value of the thermometer scale (r = 0.366; p=0.007) but not the baseline value.
Analyses were also undertaken of the correlations between health state measures and drinking outcomes, using AUDIT scores and the total number of units consumed in one week. There were no simple correlations found between AUDIT scores, average amounts drunk and self reported absences at baseline but there was a statistically highly significant correlation between QALYs at six months and days absence (r = -0.552; p<0.0001).

31
5 ACCEPTABILITY OF THE SCREENING, DATA COLLECTION INSTRUMENTS AND INTERVENTION
5.1 Introduction
The original plan had been to seek the views of the acceptability of the screening and interventions of only the Stage Two (intervention study) participants through the use of open ended questions which would be asked at the end of the follow-up telephone interviews. However, given the lower than anticipated response rates to both stages of the study (i.e. screening and exploratory intervention trial), it was decided also to seek the views of those who had taken part in only the screening and to attempt to seek the views of those who had been invited but who had not taken part. This aspect of the investigation was conducted as a survey.
It was also decided to interview personnel from the organisation which provides the occupational health service to the Council regarding their input in relation to issues concerning alcohol consumption. The Senior Occupational Health Advisor took part in an interview.
5.2 Sample
A random sub-sample of 300 (20%) of those who had been selected as potential participants at the screening stage was sent questionnaires to assess the acceptability of the screening process. Three hundred questionnaires were posted together with an SAE for its return.
All participants in the exploratory trial agreed to give their views, following collection of post-test data as part of the telephone interview.
5.3 Data collection tools
A simple self-complete questionnaire (Appendix 10) was designed to gauge the views of employees of the acceptability of the screening process and the provision of information and advice by the Council’s occupational health service on a range of lifestyle issues, including alcohol use. Since one of the items asked whether participants had objected to, or found any particular questions difficult, a copy of the screening questionnaire was also sent to remind them of its content. Items designed to identify possible reasons for not having taken part in the screening process were included in the questionnaires that were sent to the non-responders (Appendix 11). The opportunity to provide the information informally by telephone was offered. Those who took part in the intervention were asked their views of their involvement in the study following completion of the post-test follow-up telephone interview, as had been originally planned. Participants were given the opportunity to expand on their responses to the closed questions.
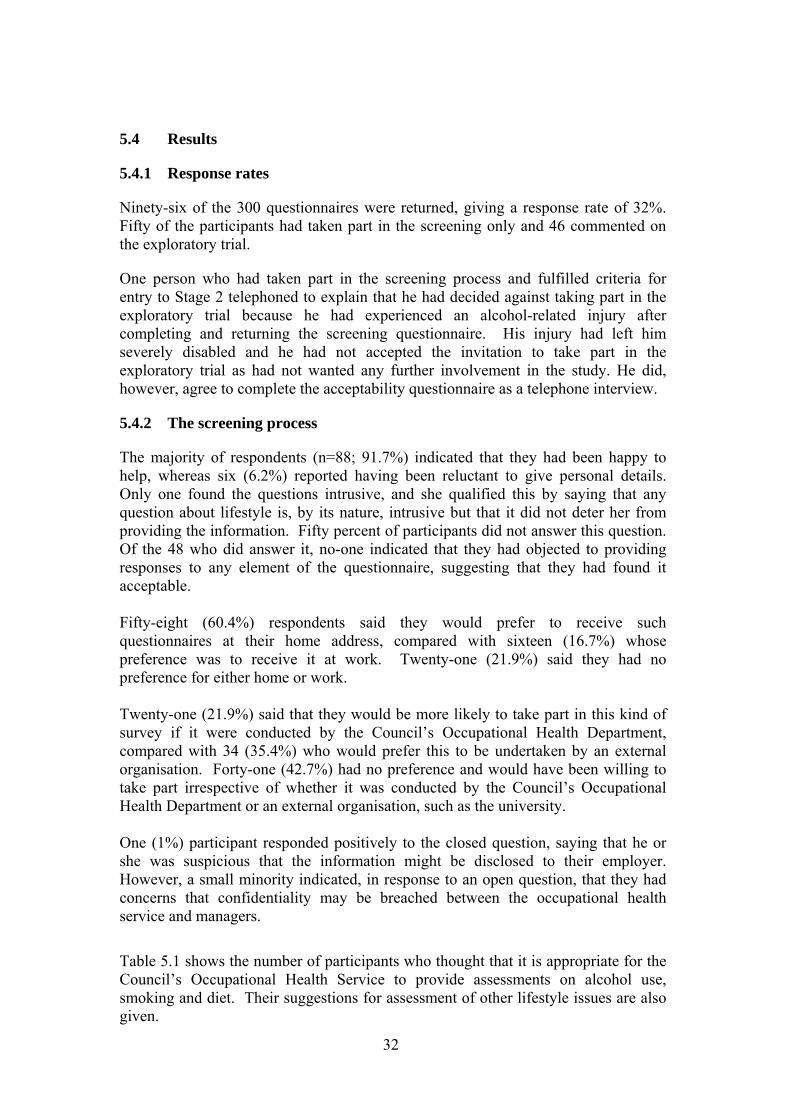
32
5.4 Results
5.4.1 Response rates
Ninety-six of the 300 questionnaires were returned, giving a response rate of 32%. Fifty of the participants had taken part in the screening only and 46 commented on the exploratory trial.
One person who had taken part in the screening process and fulfilled criteria for entry to Stage 2 telephoned to explain that he had decided against taking part in the exploratory trial because he had experienced an alcohol-related injury after completing and returning the screening questionnaire. His injury had left him severely disabled and he had not accepted the invitation to take part in the exploratory trial as had not wanted any further involvement in the study. He did, however, agree to complete the acceptability questionnaire as a telephone interview.
5.4.2 The screening process
The majority of respondents (n=88; 91.7%) indicated that they had been happy to help, whereas six (6.2%) reported having been reluctant to give personal details. Only one found the questions intrusive, and she qualified this by saying that any question about lifestyle is, by its nature, intrusive but that it did not deter her from providing the information. Fifty percent of participants did not answer this question. Of the 48 who did answer it, no-one indicated that they had objected to providing responses to any element of the questionnaire, suggesting that they had found it acceptable. Fifty-eight (60.4%) respondents said they would prefer to receive such questionnaires at their home address, compared with sixteen (16.7%) whose preference was to receive it at work. Twenty-one (21.9%) said they had no preference for either home or work. Twenty-one (21.9%) said that they would be more likely to take part in this kind of survey if it were conducted by the Council’s Occupational Health Department, compared with 34 (35.4%) who would prefer this to be undertaken by an external organisation. Forty-one (42.7%) had no preference and would have been willing to take part irrespective of whether it was conducted by the Council’s Occupational Health Department or an external organisation, such as the university. One (1%) participant responded positively to the closed question, saying that he or she was suspicious that the information might be disclosed to their employer. However, a small minority indicated, in response to an open question, that they had concerns that confidentiality may be breached between the occupational health service and managers.
Table 5.1 shows the number of participants who thought that it is appropriate for the Council’s Occupational Health Service to provide assessments on alcohol use, smoking and diet. Their suggestions for assessment of other lifestyle issues are also given.

33

34
Table 5.1 Participants’ views on the provision of health and lifestyle assessments
by the Council’s Occupational Health Service
Alcohol 61 (63.5%) Diet 67 (69.8%) Smoking 64 (66.7%) Other (asked as an open question) Stress 8 General health 6 Exercise 4 Weight 1 Drugs 1 Mental health 1 Bereavement 1 Work-life balance 1 Sun exposure 1 5.4.3 The Council’s role in providing health and lifestyle-related information
The frequency data on the number of participants who thought that it is appropriate for the Council’s Occupational Health Service to provide advice and information on alcohol use, smoking and diet are presented in Table 5.2. As above, their suggestions with regard to the provision of advice and information about other lifestyle issues are also given.
Table 5.2 Participants’ views on the provision of health and
lifestyle interventions by the Council’s Occupational Health Service
Alcohol 67 (69.8%) Diet 72 (75.0%) Tobacco 69 (71.9%) Other (asked as an open question) Stress 9 General health 5 Exercise 4 Weight 1 Drugs 1 Mental health 1 Bereavement 1 Work-life balance 1 Sun exposure 1
Several participants suggested that such information should be made available and many made the point that the Council did currently instigate health initiatives.

35
Generally those who had previously attended activities organised by the Council, such as a Well Man Clinic, had found them to be very useful and were very positive.
A few stated that Council employees should not be made to feel under duress to attend information-giving sessions. A small minority expressed the view that, while the Council ought to provide such information, they were not convinced of the impact it would have. A few employees indicated that they felt that employees are referred to the occupational health service predominantly to address absenteeism. They suggested that the service ought to adopt a more preventative focus.
Despite the reservations of a few as outlined above, the general view was that health assessments and the provision of health-related information on lifestyle by the occupational health service would be valuable, as one employee, in giving a considered response, said:
‘I do wonder whether this would be a good use of the Council's resources -should public money be spent on this? But, on thinking about it, absence is a big issue, so yes, there should be health assessments in the workplace. Also, if the screening suggests people need to change their lifestyles, then the Council has an obligation to point this out and employees have a responsibility for their own personal health.’
5.4.4 The brief intervention
Of the 26 consultations with the occupational health nurse who delivered the interventions, 21 (80.7%) elected that this should take place in the workplace. When asked about their preferred venue, those who chose to meet her at home said that they did so because there were no facilities at their workplace for a private consultation.
All except one participant who received the intervention were very positive about its content and the manner in which it had been carried out. The one person who expressed reservations reported that he had felt that the intervention was too focused on alcohol consumption for a study which, based on the information which he had been given, was related to general lifestyle issues. This was the only person who raised any concerns about the content of the intervention.
Only six of the participants had claimed to have known nothing about units of alcohol and the ethanol content of different drinks prior to the intervention. Twelve were aware of recommended limits for sensible drinking but they thought of these in terms of the government’s previous advice concerning weekly limits rather than the current information on daily benchmarks.
Almost half of the participants (n=14) had expressed surprise at the cumulated total number of units consumed in one week. Several participants commented that the intervention had raised their awareness of risks associated with alcohol use and had found the information about calculating the ethanol content of different beverages useful. They had appreciated receiving the Drink-Aware unit calculator wheel. Several said that, since the intervention, they now used smaller wine glasses when pouring drinks at home or used a measure for spirits.

36
Five of those who received the intervention were clearly pre-contemplative, expressing the view that they had no intention of changing and indeed, nor did they in terms of alcohol use or AUDIT scores.
Interestingly, several had asked for leaflets to be left for them to share with colleagues and/or family members.
5.4.5 Interview with Occupational Health Nurse
The Senior Occupational Health Advisor, who is a qualified occupational health nurse, was invited to take part in an interview with the principal investigator (HW) to discuss the ways in which the occupational health service was delivered at the time of the study, its priorities, and how any research findings could be integrated into professional practice. In particular, her views in relation to screening employees for hazardous drinking and delivering brief interventions were sought. The semi-structured interview was audio-recorded.
The interview was transcribed and a contact analysis of the data undertaken. The interviewee was asked to ratify the analysis and confirmed that the report represented an accurate resumé of the discussion.
The service is delivered by one senior nurse, two occupational health advisors, one nurse who is employed as a screening nurse. A doctor and a physiotherapist attend once a month. A counselling service is also available.
The role of the service is to promote workplace health. Employees on sickness absence are referred for assessment of fitness to work, and are supported on return to work after a period of sickness absence, assessed for retirement on ill-health grounds, or may be referred for disciplinary reasons.
‘Health surveillance’ includes pre-employment screening, which includes one question about alcohol use, and assessments that are required by Health and Safety legislation, such as risks associated with vibration, noise, hazardous/toxic substances and skin protection, eye tests for computing, and respiratory, skin and hearing tests.
The pre-employment screening had not identified any hazardous or harmful drinkers in the 4.5 years during which the Senior Occupational Health Advisor had provided a service to the local authority council. Alcohol and drug-related problems were usually raised as a result of disciplinary proceedings, at which time they see employees with long-standing alcohol problems (for which brief interventions are not usually appropriate).
A health screening project had recently been piloted for one group of employees using a computerised tool which estimated a risk score and life expectancy based on a personal and family history and lifestyle information. Employees for whom concerns were raised were encouraged to make an appointment to see their GP. The screening was conducted out of working hours at satellite clinics throughout the Council at a cost £45 per person screened. Any follow-up with the GP was entirely confidential between the GP and employee, with no facility for the GP to report back to the Council or occupational health service. The Senior Occupational Health Advisor estimated that, if this service were to be rolled out across the Council, one screening nurse would be required, at a cost of £25,000 per annum, excluding the

37
employer's on-costs for national insurance and pension scheme. The screening would have a broader focus than solely alcohol use and would not incorporate an intervention.
She was asked to consider the implications of introducing alcohol screening and delivery of brief interventions into routine practice within the current service. While acknowledging the potential benefits, she was concerned that it would be impractical to employ someone to undertake this as their sole responsibility as she envisaged it to be implemented on an intermittent basis, as she described: ‘ screening just say 10 people may only take 30 minutes but you couldn't employ someone just to do this on some regular basis - similarly people are already busy and jobs are ‘lumpy’ - you employ people in discrete lumps of time even with some flexible, part-time staff’.
She felt that employees may be reluctant to take part in screening and any appropriate intervention if it were delivered by occupational health service for reasons of confidentiality. She suggested that health promotion initiatives are delivered by the Health Promotion Officer who is employed directly by the Council (in contrast with the occupational health service, which is bought in) and that it may be more appropriate if they were delivered by him, or by the Council’s counselling service.
She acknowledged that the focus of the work of the occupational health service relates to the need to comply with Health and Safety legislation and on dealing with sickness absence, rather than using a preventative approach. She concluded by saying that, ‘There’s a lot we never ever get to.’
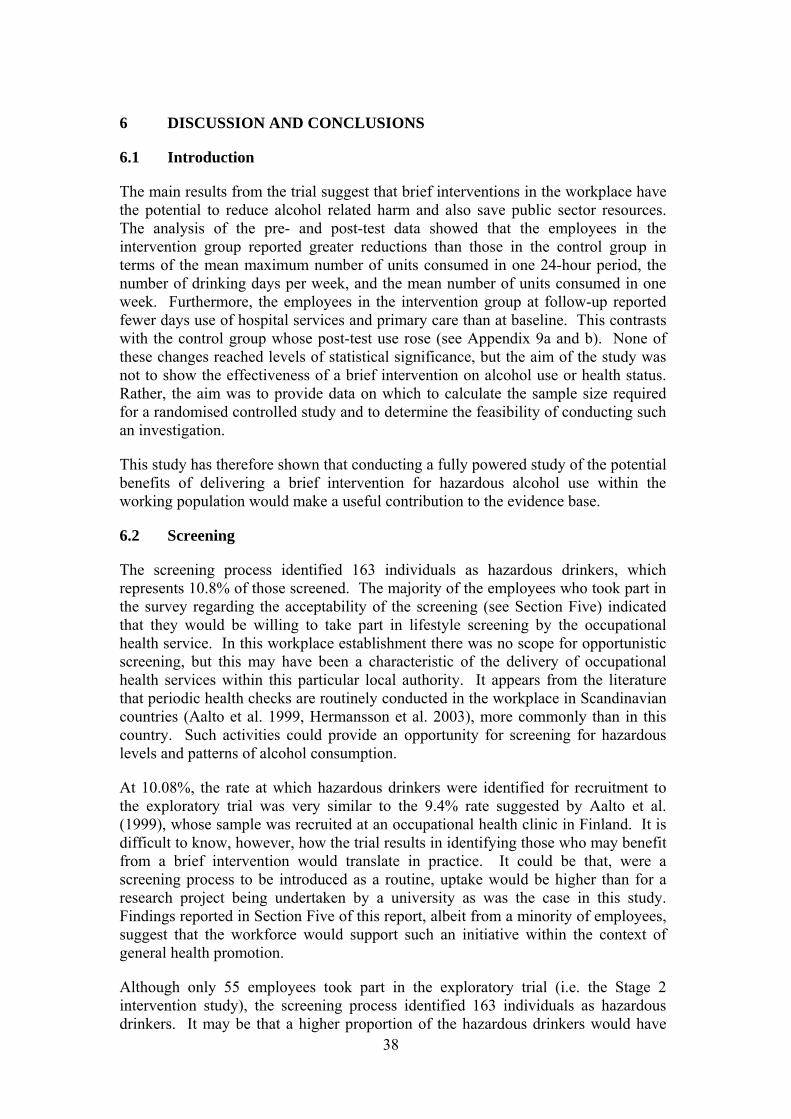
38
6 DISCUSSION AND CONCLUSIONS
6.1 Introduction
The main results from the trial suggest that brief interventions in the workplace have the potential to reduce alcohol related harm and also save public sector resources. The analysis of the pre- and post-test data showed that the employees in the intervention group reported greater reductions than those in the control group in terms of the mean maximum number of units consumed in one 24-hour period, the number of drinking days per week, and the mean number of units consumed in one week. Furthermore, the employees in the intervention group at follow-up reported fewer days use of hospital services and primary care than at baseline. This contrasts with the control group whose post-test use rose (see Appendix 9a and b). None of these changes reached levels of statistical significance, but the aim of the study was not to show the effectiveness of a brief intervention on alcohol use or health status. Rather, the aim was to provide data on which to calculate the sample size required for a randomised controlled study and to determine the feasibility of conducting such an investigation.
This study has therefore shown that conducting a fully powered study of the potential benefits of delivering a brief intervention for hazardous alcohol use within the working population would make a useful contribution to the evidence base.
6.2 Screening
The screening process identified 163 individuals as hazardous drinkers, which represents 10.8% of those screened. The majority of the employees who took part in the survey regarding the acceptability of the screening (see Section Five) indicated that they would be willing to take part in lifestyle screening by the occupational health service. In this workplace establishment there was no scope for opportunistic screening, but this may have been a characteristic of the delivery of occupational health services within this particular local authority. It appears from the literature that periodic health checks are routinely conducted in the workplace in Scandinavian countries (Aalto et al. 1999, Hermansson et al. 2003), more commonly than in this country. Such activities could provide an opportunity for screening for hazardous levels and patterns of alcohol consumption.
At 10.08%, the rate at which hazardous drinkers were identified for recruitment to the exploratory trial was very similar to the 9.4% rate suggested by Aalto et al. (1999), whose sample was recruited at an occupational health clinic in Finland. It is difficult to know, however, how the trial results in identifying those who may benefit from a brief intervention would translate in practice. It could be that, were a screening process to be introduced as a routine, uptake would be higher than for a research project being undertaken by a university as was the case in this study. Findings reported in Section Five of this report, albeit from a minority of employees, suggest that the workforce would support such an initiative within the context of general health promotion.
Although only 55 employees took part in the exploratory trial (i.e. the Stage 2 intervention study), the screening process identified 163 individuals as hazardous drinkers. It may be that a higher proportion of the hazardous drinkers would have

39
consented take part in the study if they had been approached in person, for example during a health screening appointment.
The initial aim had been to screen employees until a sample size of sixty recruits were entered into the exploratory trial. Clearly, a much higher number of employees were required to be screened than had been anticipated and that the screening process was protracted.
6.2.1 Demographic data
The gender distribution of 457 (72.9%) female respondents to 169 (27.0%) males closely reflected the Council profile of 71% females and 29% males. No comment can be made of the age distribution as we had no information regarding the age profile or the entire occupational of the workforce.
6.2.2 AUDIT scores
As shown in Table 3.2, the AUDIT tool identified 178 individuals who were drinking at hazardous or harmful levels. This constituted 28.4% of the employees who returned screening questionnaires. Of these, 15 were categorised as harmful drinkers as their AUDIT scores ranged between 16 and 40, leaving 163 (26.0%) as hazardous drinkers. In one of the few published studies to use the AUDIT as the screening tool in an occupational health setting, Hermansson et al. (2003) found that 23.9% of employees screened positive on the AUDIT, carbohydrate deficient transferring, or GGT. Matano et al. (2007) reported a pilot study of an interactive web-site-based intervention for reducing alcohol consumption was pilot tested. Although the AUDIT was used by participants to assess their risk of having an alcohol-related problem, no data on its use were presented.
6.3 Exploratory trial of the intervention
As indicated above, the results of the exploratory trial were indicative of the effectiveness of the intervention in promoting behaviour change in relation to alcohol use. Since none of the analyses indicated statistically significant effects, the findings need to be regarded with caution. However, interesting trends were evident, although the number of cases analysed for some variables was very small.
In recent years binge drinking has become a major concern in the UK (refs needed). As presented in Section 4.7.3, the effect over time for the maximum number of units in one day during the previous week approached the level of statistical significance (p = 0.054), with the mean reduction in consumption being greater in the intervention group than the control group (see Table 4.3). This suggests the potential for a brief intervention delivered by an occupational health nurse and warrants its further examination in a fully powered trial. In contrast with this finding, when the data pertaining to the number of days on which participants reported drinking alcohol during the week, it was the group effect that approached significance (p = 0.060). Interestingly, as shown in Table 4.3, the intervention group reported greater reductions than the control group for each of the alcohol use variables.

40
The results of the ANOVA of the AUDIT scores confirmed the reduction for both groups over time which reached the level of statistical significance (p = 0.004). However, there was no effect for time, with mean scores being similar at baseline and follow-up for the entire cohort. It is not possible to say whether the change had occurred as a result of repeated exposure to the AUDIT or as a consequence of change in the respondents’ experiences related to alcohol use.
The majority of employees (69.8%) who took part in the survey of the acceptability of the screening and brief intervention felt that the Council’s occupational health service ought to provide advice and information to employees about alcohol use and health. 6.4 Economic evaluation
The economic evaluation indicated that those individuals who received the intervention reported a fall in the use of health care compared with a rise in the control group. As shown in Table 4.5, the control group reported a rise in absences from work between baseline and follow-up, compared with very similar rates on both occasions for the intervention group. No employee reported having received treatment for an alcohol problem, suggesting that the screening had been effective in identifying hazardous as opposed to harmful drinkers. The numbers, however, were too small to detect statistically significant differences.
All but two participants remained in employment with the Council at follow-up. This may be indicative of the occupational stability of those who chose to take part in the study.
The total number of contacts reported by intervention group participants with a range of services provided by social work, voluntary and private organisations was greater at baseline than the control group. However this number fell at follow-up, compared with a rise in reported use by control group participants, as shown in Appendix 9c. Reports of accidents and criminal activity or involvement with criminal justice services were too infrequent to warrant analysis within this employed sample of hazardous, rather than dependent, drinkers.
The EQ-5D and the thermometer scores, which provided a crude estimate of health, showed no significant differences either between or within group. Although the QALYs fell in both intervention and control groups, a small net advantage of 0.008 was found for the intervention QALYs. As presented in Section 4.7.6, the estimated cost of the intervention was calculated as £12.48 per person. The services used by participants were estimated to cost £344.5 per person. The net saving of health and other care costs in the intervention group compared with the control group was found to be £332.02 per person. It is acknowledged, however, that this is subject to a very wide margin of error, given the low number of cases used in feasibility studies such as this. The findings do, however, indicate the value of conducting a larger study in order to examine these potential savings with greater confidence.
41
6.5 Feasibility issues
This study raises a number of feasibility issues that would face a full trial. First the screening method did not yield the expected number of hazardous drinkers and therefore the overall screening costs could be significant. Second, all the analyses point to the large sample size that would be needed for definitive trials possibly also with follow-up over longer periods so that a fuller impact of changes in drinking could be captured.
The statistical power analysis indicated that 150 participants per group should achieve a power in excess of 90%. Allowing for attrition of up to 20%, between recruitment to the trial and collection of post-test data, a power of at least 80% should still be possible with samples of 120 per group. Based on the experience of recruitment to screening and subsequent entry to the trial, this would require that 8,258 employees to be screened to yield 300 hazardous drinkers (i.e. 150 per group), or 6,606 for 240 to be recruited to the trial. It may be that a lower number of participants would require to be screened if a face-to-face or telephone method was used, but this was not an option in this study, except for a very small minority (14/1,514, see Table 3.1) 6.6 Methodological issues
The AUDIT appears to have performed well as a screening tool in this study in that a similar proportion of hazardous drinkers were identified as in the other published study where it has been used in a similar setting (Hermansson et al. 2003). The positive correlations between the AUDIT scores and the maximum amount of alcohol consumed in one day and total weekly consumption are indicative of strong criterion-related validity.
The fact that a small proportion of participants failed to complete Item 2 of the AUDIT, in which they were asked to quantify their levels of consumption, may suggest some confusion. It would be interesting to know if the pictorial representation of the alcohol content of common drinks, as developed by Kaner and colleagues (2006) would provide a more accurate assessment.
The highly significant positive correlations between the maximum amount of alcohol consumed in one 24-hour period and the total number of units consumed during the previous week on both occasions, reported in Section 4.7.7, suggest a high degree of consistency in these two self-reported alcohol use variables. In contrast, the results of the correlations between the number of drinking days per week and both the maximum amount of alcohol consumed in one day and the total weekly consumption are very much weaker. Similarly, no correlations were found between AUDIT and the number of drinking days. This suggests that perhaps the number of drinking days per week has a lower level of criterion-related validity than the other alcohol use variables and is therefore less predictive of hazardous drinking. However, it may be indicative that binge drinkers in the sample, i.e. those with a high total weekly consumption drunk in a few days during which a high number of standard drinks are consumed, may have skewed the data.

42
The economic component of the study has highlighted a number of issues that should be addressed within a fully powered RCT. Firstly, many of the service use items were used infrequently by the sample. A small number of accidents were reported, namely three motor vehicle accidents and three personal injuries at baseline, compared with four motor vehicle accidents and one personal injury at follow-up. While still small and rare this rate of accidents among the sample may be worthy of a more intensive questioning in a larger trial. However, the low rate of reported criminal activity suggests that this is not a feature of hazardous drinking and that these items should be removed from the data collection instrument.
NICE guidance is clear in that considering NHS priorities for England, the QALY is the outcome measure of choice. While in the larger treatment sample of the UK Alcohol Treatment Trial there was an overall change in QALY scores over a 12-month follow-up period, the change was insignificant, unlike changes in the other alcohol related outcome measures. It is not certain at this stage how quickly health status improves after changes in drinking particularly for hazardous rather than dependent drinkers. This will require more data on longer term follow-ups across a wide range of drinking patterns. In this exploratory trial, overall health status reduced for both intervention and control groups and there were few correlations between the health state and drinking outcome variables. An alternative approach would be to use changes in drinking patterns especially those showing a change from hazardous to low risk drinking to predict future life expectancy, quality of life and alcohol related health care costs to augment trial results.
Bodies, such as NICE, that are concerned with health interventions advocate the use of generic measures for economic evaluations so that comparisons can be made across different types of interventions (NICE 2008). However, it is still unclear whether generic measures such as the EQ-5D are sensitive to change in those with hazardous drinking or indeed whether health state change immediately follows drinking behaviour change. It may be that drinking outcomes are better predictors of long term health problems and health care costs than patient self-rated quality of life measured at the same point.
6.7 Conclusions
The study was conducted in one local authority in Scotland, limiting the generalisability of the findings. It is not known how participants from the private sector, for example, would have responded. However, the findings from this study suggest that there is scope within the workplace for the delivery of health promoting initiatives in relation to reducing the prevalence of hazardous and harmful levels and patterns of alcohol consumption. The results of the exploratory trial, despite the small sample size, are indicative of the cost-effectiveness of the delivery of a brief intervention. Furthermore, the findings suggest that the workforce is amenable to assessment of lifestyle issues, including alcohol use and to receipt of information and advice aimed at promoting health and wellbeing.
If the same design were to be adopted in a main study, 8,258 employees would need to be screened to identify 150 hazardous drinkers each for the intervention and control group in order to achieve statistical power in excess of 90%. A sample size of 6,606 employees should be screened to detect 120 hazardous drinkers for both

43
groups for a trial with a power of 80%. This estimate assumes attrition rate between pre- and post-test of up to 20%.
44
REFERENCES Aalto M, Seppa K, Kiianmaa K, Sillanaukee P. (1999) Drinking habits and prevalence of heavy drinking among primary health care outpatients and general population. Addiction. 94(9):1371-9.
Abou-Saleh M, Davis P, Rice P, Checinski K, Drummond C, Maxwell D, Godfrey C, John C, Corrin B, Tibbs C, Oyefeso A, de Ruiter M, Ghodse H (2008) The effectiveness of behavioural interventions in the primary prevention of Hepatitis C amongst injecting drug users: a randomised controlled trial and lessons learned. Harm Reduction Journal. 5:25.
Addley K, McQuillan P, Ruddle M. (2001) Creating healthy workplaces in Northern Ireland: evaluation of a lifestyle and physical activity assessment programme. Occupational Medicine (Oxford) 51(7):439-49.
Alcohol Concern (2001) Impact of alcohol and drug problems on the workplace: glancesheet no. 2. London: Alcohol Concern/DrugScope.
Alcohol Concern (2006) Impact of alcohol problems on the workplace. Acquire: Alcohol Concern’s Quarterly Information and Research Bulletin, Winter 2006, Alcohol Concern, London.
Bandura A. (1977) Social learning theory. Englewood Cliffs, N.J. Prentice Hall.
Babor TF, Higgins-Biddle JC, Saunders JB, Montiero MG. (2001) AUDIT: The Alcohol use Disorders Identification Test, 2nd Edition. World Health Organization, Department of Mental Health and Substance Dependence.
Bergman H, Kallmen H (2002) Alcohol use among Swedes and a psychometric evaluation of the Alcohol Use Disorders Identification Test. Alcohol Alcohol 37:245–251. Black C (2008) Working for a Healthier Tomorrow: London: TSO. http://www.workingforhealth.gov.uk/documents/working-for-a-healthier-tomorrow-tagged.pdf
Brooks R. (1996) Euroqol: the current state of play, Health Policy, 37:53-72.
Cabinet Office Report (2004) Alcohol Harm Reduction Strategy for England. Strategy Unit, London.
Curtis L. (ed.) (2007) Unit Costs of Health and Social Care. Personal Social Services Research Unit. University of Kent, Canterbury.
Del Boca FK, Darkes J. (2003). The validity of self-reports of alcohol consumption: state of the science and challenges for research. Addiction;98 Suppl 2:1-12.
Department of Health (2008), Safe, Sensible, Social – consultation on further action http://www.dh.gov.uk/en/Consultations/Liveconsultations/DH_086412 accessed 31st July 2008.
45
Department of Health (2004). Choosing Health: Making Healthy Choices Easier. http://www.dh.gov.uk/PublicationsAndStatistics/Publications/PublicationsPolicyAndGuidance/PublicationsPolicyAndGuidanceArticle/fs/en?CONTENT_ID=4094550&chk=aN5Cor
Department of Health, Royal College of Nursing, Association of Occupational Health Nurse Practitioners (UK) (2003). Taking a Public Health Approach in the Workplace, http://www.dh.gov.uk/en/Publicationsandstatistics/Publications/ PublicationsPolicyAndGuidance/DH_4069327
Drummond C, James D, Coulton S, Parrot S, Baxter J, Ford J, Godfrey C, Lervy B, Peters T, Russell I and Williams J. (2003) The Effectiveness and Cost-effectiveness of Screening and Stepped-care Intervention for Alcohol Use Disorders in the Primary Care Setting (STEPWICE Project). Final report to the Wales Office for Research and Development (London, St. Georges' Hospital Medical School).
Edwards P, Roberts I, Clarke M, DeGuiseppi C, Pratap S, Wentz R, Kwan I. (2002 Increasing response rates to postal questionnaires: a systematic review. British Medical Journal. 18 (324):1183-1191.
Fleming MF, Mundt MP, French MT, Manwell LB, Stauffacher EA, Barry KL. (2002) Brief physician advice for problem drinkers: long-term efficacy and benefit-cost analysis. Alcohol Clin Exp Res. 26(1):36-43.
Franklin A (2002) Mental health and occupational health nursing, Chapter 12 in Oakley (Ed) Occupational health nursing. Whurr Publishers, Endland.
Goddard E (2008) Drinking: adults’ behaviour and knowledge in 2007. A report on research using the National Statistics Omnibus Survey produced on behalf of the Information Centre for Health and Social Care. Crown Office, London.http://www.statistics.gov.uk/downloads/theme_health/Drinking_2007.pdf, accessed 20 November 2008.
Godfrey, C. (1997) Lost productivity and costs to society, Addiction 92, S49-S54.
Hanlon P, McEwen J, Carey L, Gilmour H, Tannahill C, Tannahill A, Kelly M. (1995) Health checks and coronary risk: further evidence from a randomised controlled trial British Medical Journal. 311:1609-1613.
Hanlon P, Carey L, Tannahill C, Kelly M, Gilmour H, Tannahill A and McEwen J. (1998) Behaviour change following a workplace health check: how much change occurs and who changes? Health Promotion International. 13: 131-139.
Heatherton TF, Kozlowski LT, Frecker RC and Fagerström KO (1991) The Fagerström Test for Nicotine Dependence: A revision of the Fagerström Tolerance Questionnaire British Journal of Addictions 86: 1119-27.
Health Development Agency (2004) Workplace interventions: alcohol and diet. http://www.hda.nhs.uk/downloads/pdfs/choosing_health/CHB19-alcohol_diet-14-7.pdf.
46
Hermansson U, Knutsson A, Ronnberg S, Brandt L (1998) Feasibility of brief intervention in the workplace for the detection and treatment of excessive alcohol consumption. Int J Occup Environ Health, 4(2): 71-8.
Hermansson U, Knutsson A, Brandt L, Huss A, Rönnberg S and Helander A (2003) Screening for high-risk and elevated alcohol consumption in day and shift workers by use of the AUDIT and CDT. Occupational Medicine 53:518–526.
Institute of Alcohol Studies (2008) Alcohol and the Workplace. http://www.ias.org
Kaner EF, Dickinson HO, Beyer FR, Campbell F, Schlesinger C, Heather N, Saunders JB, Burnand B, Pienaar ED. (2007) Effectiveness of brief alcohol interventions in primary care populations. Cochrane Database of Systematic Reviews 2007, Issue 2. Art. No.: CD004148. DOI: 10.1002/14651858.CD004148.pub3.
Kaner EF et al (2006) Screening tools from the brief intervention programme, 'How much is too much?' http://www.ncl.ac.uk/ihs/enterprise/index.htm, accessed 20/´1/2009.
Kind P, Hardman G and Macran S. (1999) UK population norms for EQ-5D. Discussion Paper 172. Centre for Health Economics, University of York: York.
Ludbrook A, Godfrey C, Wyness L. (2002) Effective and cost effective measures to reduce alcohol misuse in Scotland: a literature review. Scottish Executive.
Matano RA, Koopman C, Wanat SF, Winzelberg AJ, Whitsell SD, Westrup D, Futa K, Clayton JB, Mussman L, Taylor CB. (2007) A pilot study of an interactive web site in the workplace for reducing alcohol consumption. Journal of Substance Abuse Treatment 32: 71– 80.
Miller WR. and Rollnick S. (2002) Motivational interviewing: preparing people for change. 2nd ed. London: Guilford Press.
Moyer A, Finney J W, Swearingen C E, and Vergun P. (2002) Brief interventions for alcohol problems: a meta-analytic review of controlled investigations in treatment-seeking and non-treatment-seeking populations. Addiction 97 (3): 279-292.
National Institute for Health and Clinical Excellence (2008) Guide to the methods of technology appraisal. NICE: London.
National Treatment Agency for Substance Misuse (2004) Drugs and Alcohol in the Workplace: developing drug policies 3. NTA, London.
Nicholson PJ. Occupational health in the European Union (2002) Occupational Medicine, 52 (2):80-84.
Office for National Statistics (2006) Page 12, General Household Survey, 2006, Appendix A, Definitions and terms. http://www.statistics.gov.uk/downloads/theme_compendia/GHS06/AppendixA2006.pdf.
Pilkington A, Graham MK, Cowie HA, Mulholland RE, Dempsey S, Melrose AS and Hutchinson PA. Survey of Use of Occupational Health Support. Norwich: Crown, (2002).

47
Prochaska JO and DiClemente CC. (1984) The transtheoretical approach: Crossing traditional boundaries. Ch.3. Dow Jones-Irwin, Illinois
Redman S, Sanson-Fisher RW, Wilkinson C, Fahey PP and Gibberd RW. (1987) Agreement between two measures of alcohol consumption. Journal of Studies on Alcohol, 48: 104 – 108.
Richmond R, Kehoe L, Heather N, Wodak A. (2000) Evaluation of a Workplace Brief Intervention for Excessive Alcohol Consumption: The Workscreen Project. Preventive Medicine 30: 51–63.
Robin R. and de Charro F. (2001) EQ-5D: a measure of health status from the EuroQol Group. Ann Med 33: 337-343.
Scottish Government (2008) Changing Scotland's relationship with alcohol: a discussion paper on our strategic approach. http://www.scotland.gov.uk/Publications/2008/06/16084348/0 accessed 31st July 2008.
Scottish Executive (2003) Improving Scotland’s Health: the Challenge. The Stationery Office, Edinburgh.
Simpson JM, Oldenburg B, Owen N, Harris D, Dobbins T, Salmon A, Vita P, Wilson J, Saunders JB. (2000) The Australian National Workplace Health Project: Design and Baseline Findings. Preventive Medicine 31: 249–260.
Varney SJ and Guest JF (2002) The annual societal cost of alcohol misuse in Scotland. Pharmacoeconomics 20(13):891-907.
UKATT Research Team Cost-effectiveness of treatment for alcohol problems: findings from the UK Alcohol Treatment Trial, British Medical Journal, 2005, 331(7516): 544-547.
UKCBTMM Project Group. The effectiveness and cost effectiveness of cognitive behaviour therapy for opiate misusers in methadone maintenance treatment: a multicentre, randomised, controlled trial. Final Report to the R&D Directorate of the Department of Health as part of the Drug Misuse Research Initiative, November 2004.
Walters ST and Woodall WG (2003) Mailed feedback reduces consumption among moderate drinkers who are employed. Preventive Science. 4 (4): 287-294.
Wardle J and Steptoe A (1991) The European health and behaviour survey: rationale, methods and initial results from the United Kingdom. Social Science and Medicine, 33 (8): 925-936.
Watson HE (1999) Problem drinkers in acute care settings: validation of a screening instrument. International Journal of Nursing Studies 36 (5): 415-423.
World Health Organization (2005) Public health problems caused by harmful use of alcohol. 58th World Assembly (WHA58.26) http://www.who.int/substance_abuse/wha_resolution_58_26_public_health_problems_alcohol.pdf

48
World Health Organization (2006) http://www.who.int/occupational_health/Declarwh.pdf

49
Appendix 1
Letter from the Council confirming access
Appendix 1: Letter from the Council confirming access ASSISTANT CHIEF EXECUTIVE (Personnel): Murray Macfarlane Your Ref: Our Ref: SK/ 17.1.6.3 If telephoning please call: 6 23rd February 2005 Professor Hazel E Watson Nursing & Midwifery Centre School of Nursing City Campus Cowcadden Road Glasgow G4 OBA Dear Professor Watson
Reducing Alcohol - Related Harm in the Workplace: Feasibility study Thank you for your recent letter regarding your request for permission to undertake a feasibility study of screening and brief intervention of hazardous drinkers. I note the contents of your letter and have pleasure in agreeing to participate in this study as requested. As you have already had discussions with Mr Charles McBreen, Principal Health & Safety Adviser, I would ask that you continue to address correspondence to Mr McBreen and advise that he would continue to act as your main contact for the study. Should you require any further assistance please feel free to contact Mr McBreen direct on telephone number 01 294 324686. I look forward to hearing from you in due course. Yours sincerely - -- - - - - . - -- - -- - - --
J Murray Macfarlane Assistant Chief Executive

50
(Personnel) I:\Working Documents\Health & Safety\Correspondence\Letters\PHSA\2006\Leer Professor Hazel E Watson.doc
51
Appendix 3
Letter of invitation to participants in screening (on university headed notepaper)
Date as postmarked Dear Sir or Madam General health and lifestyle survey I am writing to invite you to take part in a survey of healthy lifestyle issues. The survey is being carried out by a team of researchers at Glasgow Caledonian University in Xxxx Xxxx Council as its employees are, in many ways, representative of the Scottish working public. If you are willing to take part please complete and return the enclosed questionnaire in the stamped addressed envelope, preferably by Friday 9th June. It should only take a few minutes to complete. The Council has given permission for its employees to be invited to take part and has agreed to facilitate the work by distributing the questionnaires. All questionnaires are being returned directly to Glasgow Caledonian University and all information you provide will be treated in strict confidence. It will remain in the possession of the research team until the end of the study, when it will be destroyed. No information will be passed to anyone associated with your employment or to anyone who is not a member of this research team. Your name will be used only as a way of tracing individuals who have not responded so that a reminder can be sent. It may also be used to offer you information that could help you to make lifestyle changes if you agree to this, and if your responses indicate that this might be beneficial. If you decide to take part your name will be entered into a prize draw for a £50 gift token for Marks and Spencer. You may be invited to take part in a future stage of the study. Please feel free to contact us on 0141 331 3457 or 0141 331 3528 if you wish any further information. If you would like to take part but would prefer to do so over the phone, please let us know. Yours sincerely Katherine McArthur Hazel Watson Research Assistant Professor of Nursing Tel 0141 331 3528 Tel 0141 331 3457

52

53
Appendix 4a Letter of invitation to intervention group participants
(on university headed notepaper) Date as postmarked Dear
General health and lifestyle consultation Thank you for taking part in the recent lifestyle survey. I am now writing to invite you to take part in the next stage of the study. In this part of the study we want to evaluate the effect of a health and lifestyle consultation. We know that a consultation by a GP or practice nurse can be effective in helping people to make changes to their diet, smoking, drinking and exercise. We want to find out if a similar consultation is effective when delivered by an occupational health nurse. Since we do not know whether it is beneficial, we need to compare the impact on people who have the consultation with those for people who do not. The best way to do this is to choose at random (like tossing a coin) whether people should have the consultation or not. That way it is fair and everyone has an equal chance of having the consultation or not. You have been selected at random to attend the consultation, should you agree to take part.
If you agree to take part in the study, an occupational health nurse will contact you within the next two or three weeks to arrange a suitable time to meet with you. The consultation should take around 15-30 minutes. It will be conducted on Council premises or your own home, depending on your own preference, and will be entirely confidential.
During the consultation you will be asked to give more detailed information about some of your responses to the lifestyle survey and will be given information that may be helpful in relation to your general health. Following this, you will be asked to take part in a short telephone interview about your use of public services and quality of life. Finally, six months after the consultation you will be asked to take part in another telephone interview to ask similar questions and for your views on the consultation and the suitability of this within a workplace setting.
Taking part in the study is voluntary and, even if you agree to take part, you will be free to change your mind and withdraw at any time. If you would like to take part in the study, please return the enclosed Consent Form in the stamped-addressed envelope provided within the next 7 days. If you would like more information about the study before making up your mind, please contact me on 0141 331 3457 or by email, [email protected].
If you would like to receive a summary of the results, please send me your name and address. Yours sincerely Hazel Watson Professor of Nursing encs

54
Appendix 4b
Letter of invitation to control group participants (on university headed notepaper)
Date as postmarked
Dear
General health and lifestyle survey Thank you for taking part in the recent lifestyle survey. I am now writing to invite you to take part in the next stage of the study.
In this part of the study we want to evaluate the effect of a health and lifestyle consultation. We know that a consultation by a GP or practice nurse can be effective in helping people to make changes to their diet, smoking, drinking and exercise. We want to find out if a similar consultation is effective when delivered by an occupational health nurse. Since we do not know whether it is beneficial, we need to compare the impact on people who have the consultation with those for people who do not. The best way to do this is to choose at random (like tossing a coin) whether people should have the consultation or not. That way it is fair and everyone has an equal chance of having the consultation or not. You have been selected at random to be a member of the comparison group.
If you agree to take part in the study I will contact you in two to three weeks by telephone when you will again be asked questions from the lifestyle survey and for information about your use of public services and quality of life. You will be contacted again by telephone in six months time when you will be asked about your health and use of services. You will be given information about any changes that are recommended as a result of the information you have given in relation to general health and lifestyle issues.
Taking part in the study is entirely voluntary and, even if you agree to take part, you will be free to change your mind and withdraw at any time. If you would like to take part in the study, please return the enclosed Consent Form in the stamped-addressed envelope provided within the next 7 days. If you would like more information about the study before making up your mind, please contact me on 0141 331 3457 or by email, [email protected].
If you would like to receive a summary of the results, please send me your name and address. Yours sincerely Hazel Watson Professor of Nursing Encs
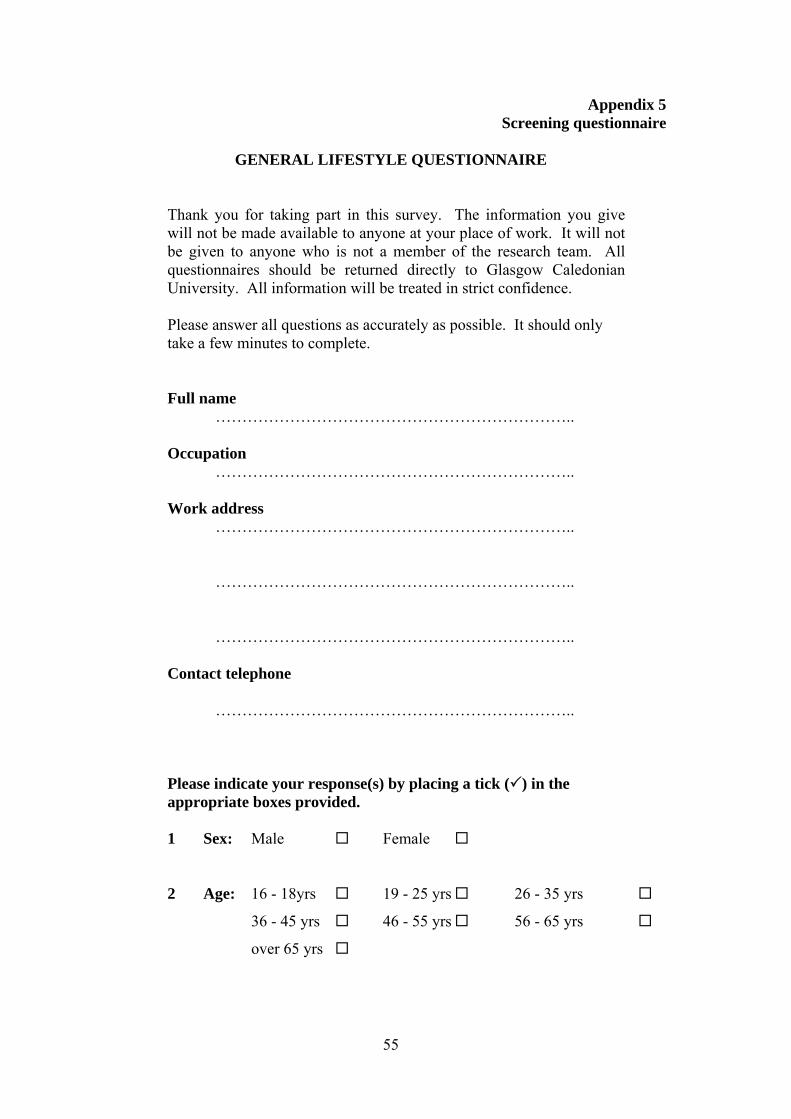
55
Appendix 5 Screening questionnaire
GENERAL LIFESTYLE QUESTIONNAIRE
Thank you for taking part in this survey. The information you give will not be made available to anyone at your place of work. It will not be given to anyone who is not a member of the research team. All questionnaires should be returned directly to Glasgow Caledonian University. All information will be treated in strict confidence. Please answer all questions as accurately as possible. It should only take a few minutes to complete. Full name ………………………………………………………….. Occupation ………………………………………………………….. Work address ………………………………………………………….. ………………………………………………………….. ………………………………………………………….. Contact telephone ………………………………………………………….. Please indicate your response(s) by placing a tick ( ) in the appropriate boxes provided. 1 Sex: Male Female 2 Age: 16 - 18yrs 19 - 25 yrs 26 - 35 yrs
36 - 45 yrs 46 - 55 yrs 56 - 65 yrs
over 65 yrs
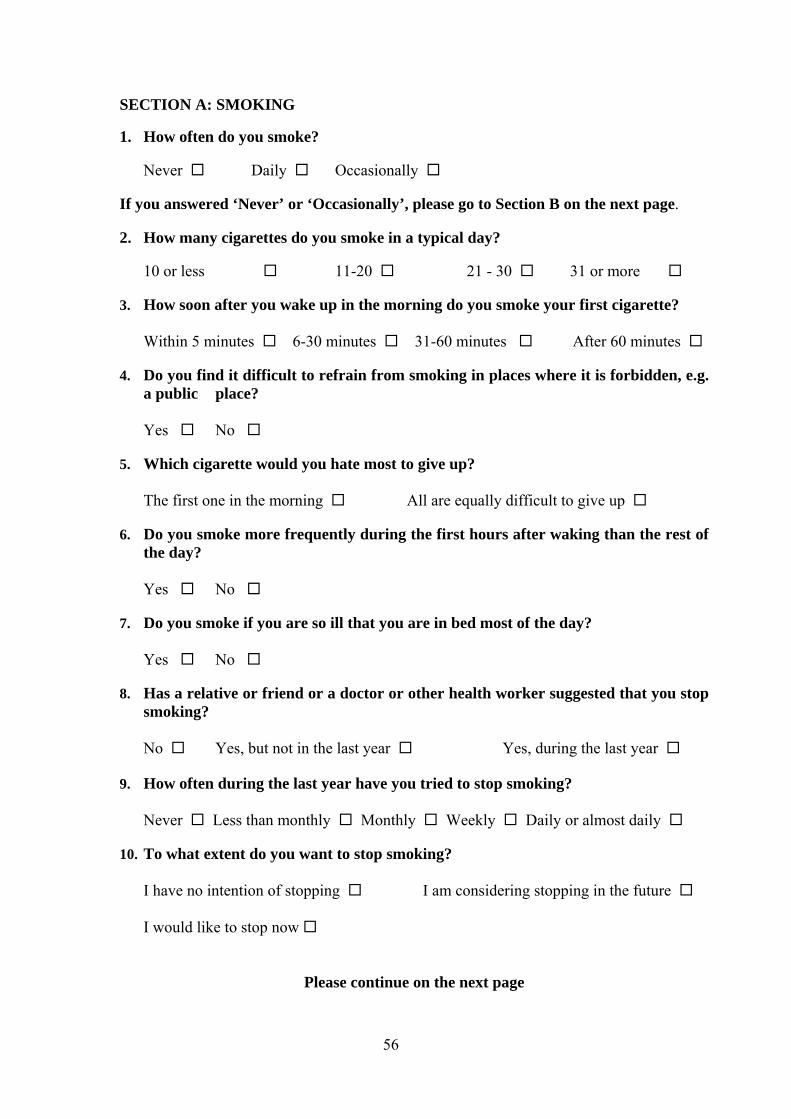
56
SECTION A: SMOKING 1. How often do you smoke?
Never Daily Occasionally If you answered ‘Never’ or ‘Occasionally’, please go to Section B on the next page. 2. How many cigarettes do you smoke in a typical day? 10 or less 11-20 21 - 30 31 or more 3. How soon after you wake up in the morning do you smoke your first cigarette? Within 5 minutes 6-30 minutes 31-60 minutes After 60 minutes 4. Do you find it difficult to refrain from smoking in places where it is forbidden, e.g.
a public place? Yes No 5. Which cigarette would you hate most to give up? The first one in the morning All are equally difficult to give up 6. Do you smoke more frequently during the first hours after waking than the rest of
the day? Yes No 7. Do you smoke if you are so ill that you are in bed most of the day? Yes No 8. Has a relative or friend or a doctor or other health worker suggested that you stop
smoking? No Yes, but not in the last year Yes, during the last year 9. How often during the last year have you tried to stop smoking? Never Less than monthly Monthly Weekly Daily or almost daily 10. To what extent do you want to stop smoking? I have no intention of stopping I am considering stopping in the future I would like to stop now
Please continue on the next page
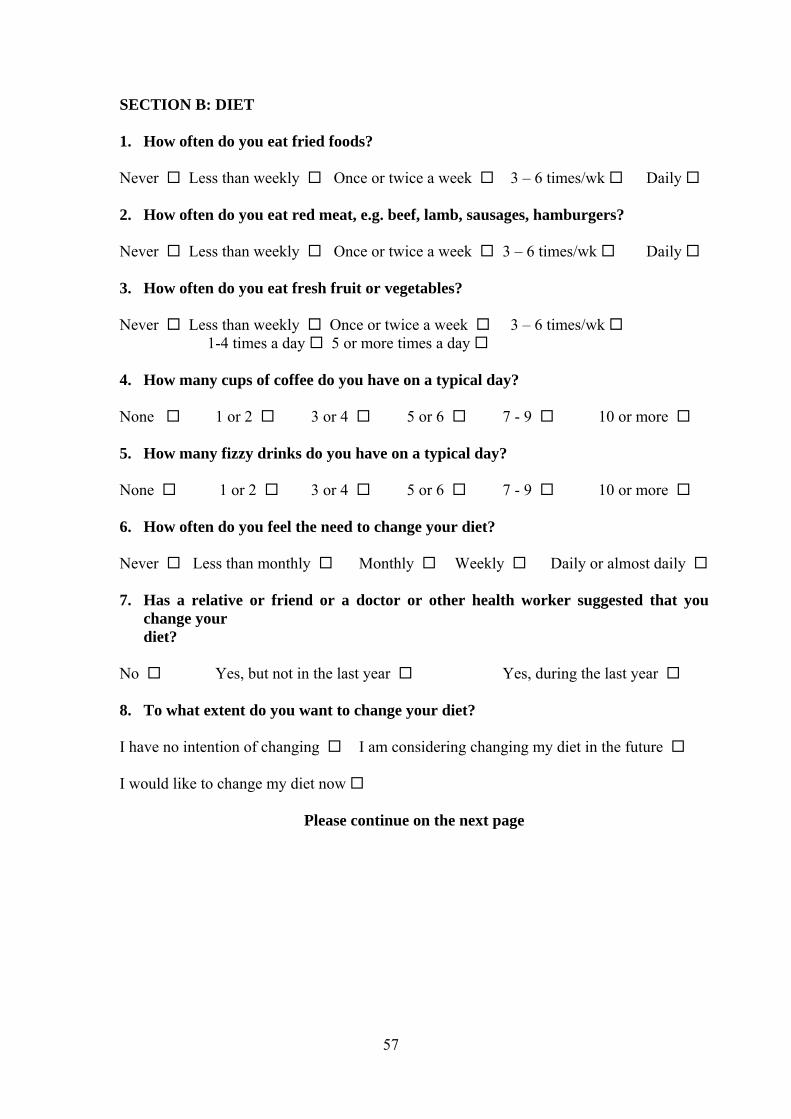
57
SECTION B: DIET
1. How often do you eat fried foods? Never Less than weekly Once or twice a week 3 – 6 times/wk Daily 2. How often do you eat red meat, e.g. beef, lamb, sausages, hamburgers? Never Less than weekly Once or twice a week 3 – 6 times/wk Daily 3. How often do you eat fresh fruit or vegetables? Never Less than weekly Once or twice a week 3 – 6 times/wk 1-4 times a day 5 or more times a day 4. How many cups of coffee do you have on a typical day? None 1 or 2 3 or 4 5 or 6 7 - 9 10 or more 5. How many fizzy drinks do you have on a typical day? None 1 or 2 3 or 4 5 or 6 7 - 9 10 or more 6. How often do you feel the need to change your diet? Never Less than monthly Monthly Weekly Daily or almost daily 7. Has a relative or friend or a doctor or other health worker suggested that you
change your diet? No Yes, but not in the last year Yes, during the last year 8. To what extent do you want to change your diet? I have no intention of changing I am considering changing my diet in the future I would like to change my diet now
Please continue on the next page
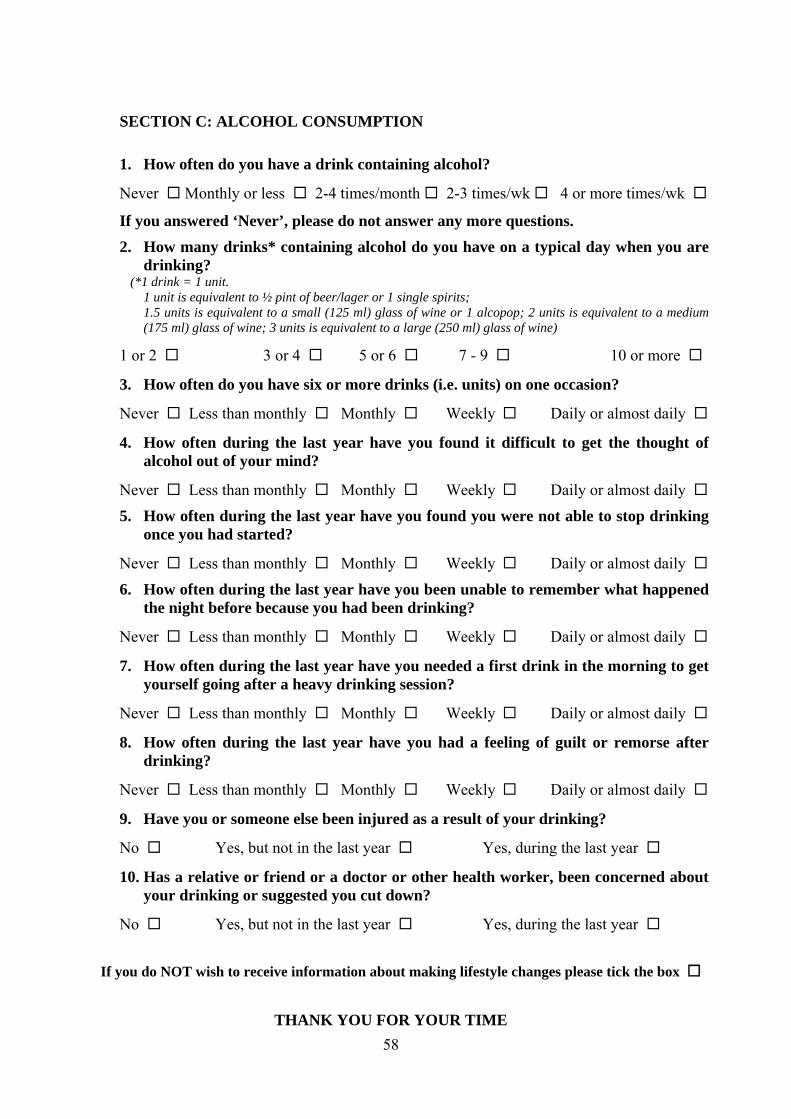
58
SECTION C: ALCOHOL CONSUMPTION 1. How often do you have a drink containing alcohol?
Never Monthly or less 2-4 times/month 2-3 times/wk 4 or more times/wk
If you answered ‘Never’, please do not answer any more questions.
2. How many drinks* containing alcohol do you have on a typical day when you are drinking?
(*1 drink = 1 unit. 1 unit is equivalent to ½ pint of beer/lager or 1 single spirits; 1.5 units is equivalent to a small (125 ml) glass of wine or 1 alcopop; 2 units is equivalent to a medium
(175 ml) glass of wine; 3 units is equivalent to a large (250 ml) glass of wine)
1 or 2 3 or 4 5 or 6 7 - 9 10 or more
3. How often do you have six or more drinks (i.e. units) on one occasion?
Never Less than monthly Monthly Weekly Daily or almost daily
4. How often during the last year have you found it difficult to get the thought of alcohol out of your mind?
Never Less than monthly Monthly Weekly Daily or almost daily
5. How often during the last year have you found you were not able to stop drinking once you had started?
Never Less than monthly Monthly Weekly Daily or almost daily
6. How often during the last year have you been unable to remember what happened the night before because you had been drinking?
Never Less than monthly Monthly Weekly Daily or almost daily
7. How often during the last year have you needed a first drink in the morning to get yourself going after a heavy drinking session?
Never Less than monthly Monthly Weekly Daily or almost daily
8. How often during the last year have you had a feeling of guilt or remorse after drinking?
Never Less than monthly Monthly Weekly Daily or almost daily
9. Have you or someone else been injured as a result of your drinking?
No Yes, but not in the last year Yes, during the last year
10. Has a relative or friend or a doctor or other health worker, been concerned about your drinking or suggested you cut down?
No Yes, but not in the last year Yes, during the last year
If you do NOT wish to receive information about making lifestyle changes please tick the box
THANK YOU FOR YOUR TIME

59
Please return the questionnaire in the Stamped Addressed Envelope provided
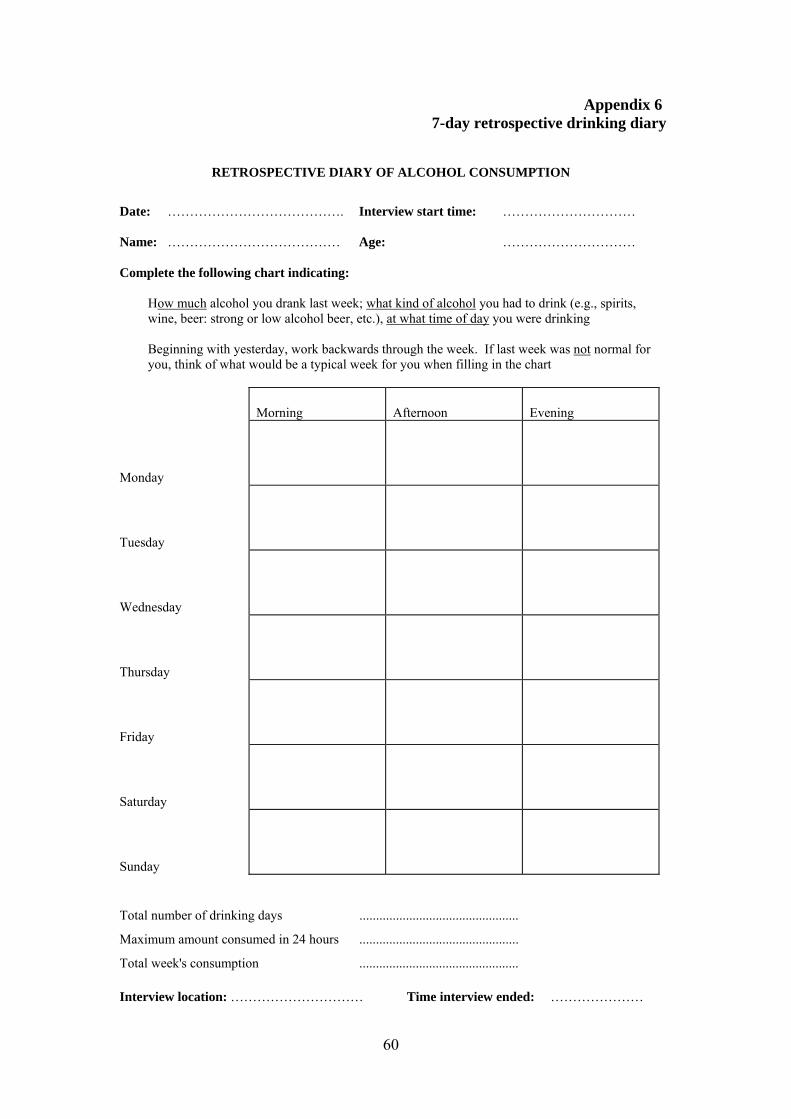
60
Appendix 6 7-day retrospective drinking diary
RETROSPECTIVE DIARY OF ALCOHOL CONSUMPTION
Date: …………………………………. Interview start time: ………………………… Name: ………………………………… Age: ………………………… Complete the following chart indicating:
How much alcohol you drank last week; what kind of alcohol you had to drink (e.g., spirits, wine, beer: strong or low alcohol beer, etc.), at what time of day you were drinking Beginning with yesterday, work backwards through the week. If last week was not normal for you, think of what would be a typical week for you when filling in the chart
Morning Afternoon Evening
Monday
Tuesday
Wednesday
Thursday
Friday
Saturday
Sunday
Total number of drinking days ................................................
Maximum amount consumed in 24 hours ................................................
Total week's consumption ................................................ Interview location: ………………………… Time interview ended: …………………

61
Appendix 7
Economic questionnaire, EQ-5D and thermometer scale Reducing alcohol-related harm in the workplace. Service Use Questionnaire 1. Treatment for drinking problems a) Have you received any treatment to reduce your drinking over the past 6 months? Yes No (go to 2) Not answered Have you received any of the following interventions, where you did not stay overnight. (Record the number of contacts in each box).
NH
S H
ospi
tal
Prim
ary
care
, e.
g. G
P
Day
car
e pr
ogra
mm
e
Afte
r car
e ho
stel
NH
S A
lcoh
ol
Trea
tmen
t
Vol
unta
ry, e
.g.
AA
, vol
unta
ry
Counselling
Yes No Not answered
Medication
Yes No Not answered
Day care
Yes No Not answered
Detoxification
Yes No Not answered
Outpatient treatment
Yes No Not answered
1b) Have you received any of the following interventions where you have stayed overnight. (Record the number of overnight stays in each box).
NHS Hospital - detoxification
Yes No Not answered
After care hostel
Yes No Not answered
Residential programme
Yes No Not answered

62
2. Use of hospital services (excluding treatment for drinking problems recorded in Q 1) Have you visited hospital as a patient for any type of treatment, including A and E, in the last 6 months? Yes No (go to 3) Not answered 2a. Have you visited a hospital A and E dept in the last 6 months? Yes No (go to 2b) Not answered How many times?
How many nights did you stay in total in A and E?
Did you ever travel in an ambulance ? Yes No Not answered How many times did you use an emergency (999 call) ambulance?
How many times did you return home in an ambulance?
2b. Have you stayed in hospital as an inpatient in the last 6 months? i.e. stayed overnight, excluding A and E and addiction problems Yes No (go to 2c) Not answered How many nights did you stay in total?
Did you ever travel in an ambulance ? Yes No Not answered How many times did you travel to hospital by ambulance?
How many times did you return home in an ambulance?
2c. Have you visited hospital as an outpatient? Yes No (go to 2d) Not answered
How many times?
Did you ever travel in an ambulance ? Yes No Not answered How many times did you travel to hospital by ambulance?
How many times did you return home in an ambulance?
2d. Have you visited hospital as a day case patient? Yes No (go to 3) Not answered
How many times?
How many times did you travel to hospital by ambulance?
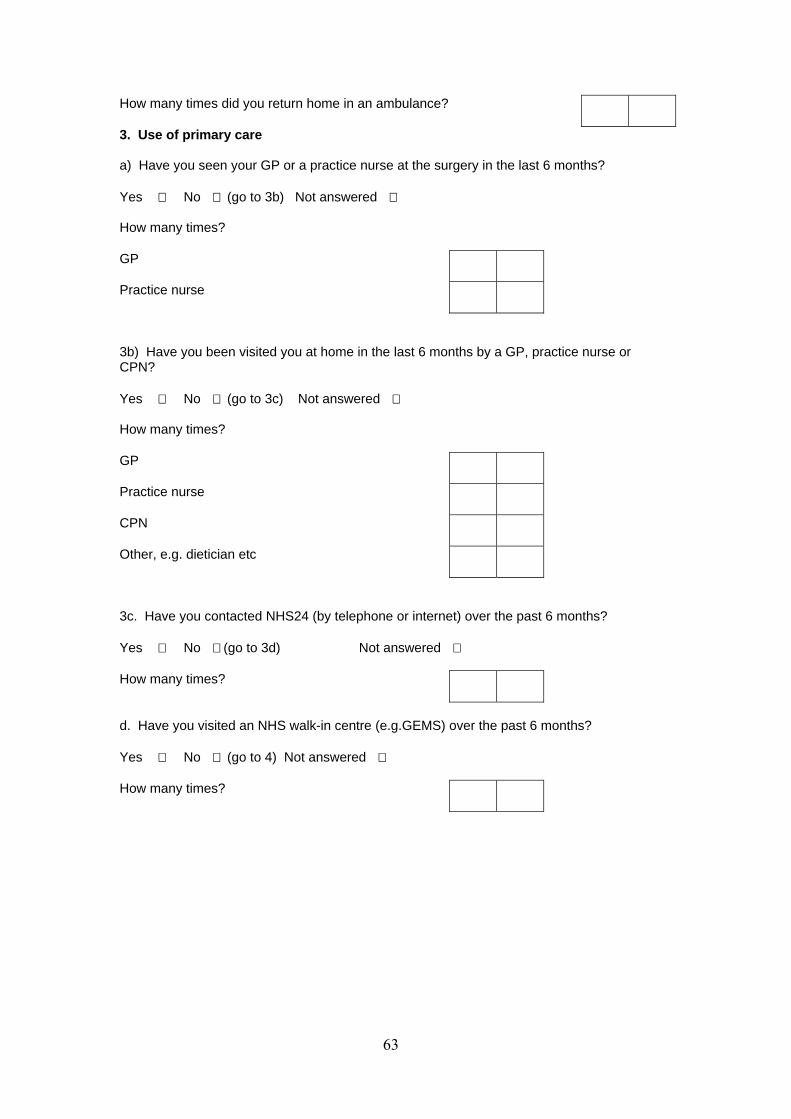
63
How many times did you return home in an ambulance?
3. Use of primary care a) Have you seen your GP or a practice nurse at the surgery in the last 6 months? Yes No (go to 3b) Not answered How many times? GP
Practice nurse
3b) Have you been visited you at home in the last 6 months by a GP, practice nurse or CPN? Yes No (go to 3c) Not answered How many times? GP
Practice nurse
CPN
Other, e.g. dietician etc
3c. Have you contacted NHS24 (by telephone or internet) over the past 6 months? Yes No (go to 3d) Not answered How many times?
d. Have you visited an NHS walk-in centre (e.g.GEMS) over the past 6 months? Yes No (go to 4) Not answered How many times?

64
4. Other services Have you used any of the following services during the last 6 months?
Yes No Not answered
No of contacts (i) Alternative medical practitioners Yes No (ii) Social Worker Yes No (iii) Occupational Therapist (at home) Yes No (iv) Citizens Advice Yes No (v) Marriage/Couples Counselling Yes No (vi) Advisor regarding state benefits or housing issues Yes (vii) Advisor on debt or legal issues (viii) A homeless persons agency Yes No (ix) An employment advisor Yes No (x) Other (please specify) Yes No

65
5. Employment 5a. Have you been continually employed by
the Council for the last 6 months? Yes (go to 5b) No (go to 5c) Not answered
5b. If 'yes' how many weeks have you been employed? Not answered 5c. If ‘no’, were you unemployed for any of this period if yes how
many weeks? Yes No Not answered
5d. Do you currently have a job where you are on a contract and
pay income tax? Yes (Go to 5dd) No (Go to 5e) Not answered
dd) If Yes, Is it full or part time? Full-time Part-time Not answered What is you current salary per year/week/hourly rate?
(Katie, I’m just goint to try this out and see what I get, so don’t change your SPSS file for this yet)
5e. Do you earn money from 'cash in hand' work? Yes (Go to 5ee) No (Go to 5i) Not answered 5ee If Yes, Is it full or part time? Full-time Part-time Not answered How much do you earn from 'cash in hand' work? £
5f How many days have you been absent from work in the last 6 months?
5g. Do you think your performance at work been affected as a result of alcohol use over
the past 6 months ? Yes No Not answered If 'yes' on how many days over the last 6 months has your productivity at work (e.g. amount of work you were able
to do) been affected?
On average, would you say your work performance Slightly? has been affected Moderately? Considerably? Extremely? 5h. Have you had an accident at work in the last 6
months?
Yes No Not answered If 'yes' how many times? If 'yes', please detail Explore if alcohol-related

66
5i. How have you supported yourself financially in the last 6 months?
(tick as many as apply)
Wage / salary (go to 6) Casual work / cash in hand work (go to 6 Family / partner (go to 6) State benefits (go to 5j) Other (please specify) (go to 6) 5j) Have you claimed any of the following benefits, and if so, for how long?
No of weeks claimed in last 6 mths
(i) Income support Yes No Not answered
(ii) Invalidity benefit Yes No Not answered
(iii) Incapacity benefit Yes No Not answered
(iv) Unemployment benefit Yes No Not answered
(v) Sickness benefit Yes No Not answered
(vi) Housing benefit Yes No Not answered
(vii) Severe disablement allowance (DLA) Yes No Not answered
(viii) Mobility allowance Yes No Not answered
(ix) Family credit Yes No Not answered
(x) Child benefit Yes No Not answered
(xi) Lone parent benefit Yes No Not answered
(xii) Attendance allowance Yes No Not answered
(xiii) Other (please specify) Yes No Not answered
Total amount of benefit received per week? (£) (Note: if participant does not receive benefits please enter ‘0’)

67
6. Crime 6a) Have you committed any of the following criminal acts in the last 6 months? Committed No. Times Arrested No. Times Violence or assault against a person
Robbing/mugging
Burglary in a dwelling or commercial premises
Sexual offences
Theft (not of vehicle), including shoplifting
Vehicle theft
Criminal damage (damage to property) (if ‘yes’ go to b)
Drink driving
Other motoring offences
6b) Have you caused any damage to property/persons over the last 6 months? Yes No Not answered
If 'yes', was this damage to: Details • Your home • Someone else’s home/premises • Your own vehicle • Someone else’s vehicle • Other people (bodily harm) 6c) In the last 6 months have you answered bail? Yes No Not answered If Yes, how many times.
6d) In the last 6 months have you had contact with a probation officer? Yes No Not answered
If Yes, how many times.
6e) In the last 6 months have you stayed at a probation hostel? Yes No Not answered
If Yes, how many times.
6f) In the last 6 months have you appeared in court for any reason? Yes No Not answered
If Yes, how many times.
What type of court was this? (enter total number of days spent in court)
Event 1 Event 2 Event 3 Event 4 • District Court
• Sheriff Court
• High Court
6g) Have you spent any time in prison in the past 6 months? Yes No Not answered How many days did you spend in prison in total? Not answered

68
7. Accidents 7a) Have you had an accident in the last 6 months? Had
accident
No. Times
How many times did you attend hospital as a result?
Motor vehicle accident Yes No
Personal injury (exclude road accidents) Yes No
Injury to another person (excl road accidents) Yes No
EQ-5D Mobility • I have no problems in walking about • I have some problems in walking about • I am confined to bed Self Care • I have no problems with self care (looking after yourself) • I have some problems with dressing myself • I am unable to wash and dress myself Usual Activities (e.g. work, study, housework, family or leisure activities)
• I have no problems with performing my usual activities • I have some problems with performing my usual activities • I am unable to perform my usual activities Pain Discomfort • I have no pain or discomfort • I have moderate pain or discomfort • I have extreme pain or discomfort Anxiety/Depression • I am not anxious or depressed • I am moderately anxious or depressed • I am extremely anxious or depressed
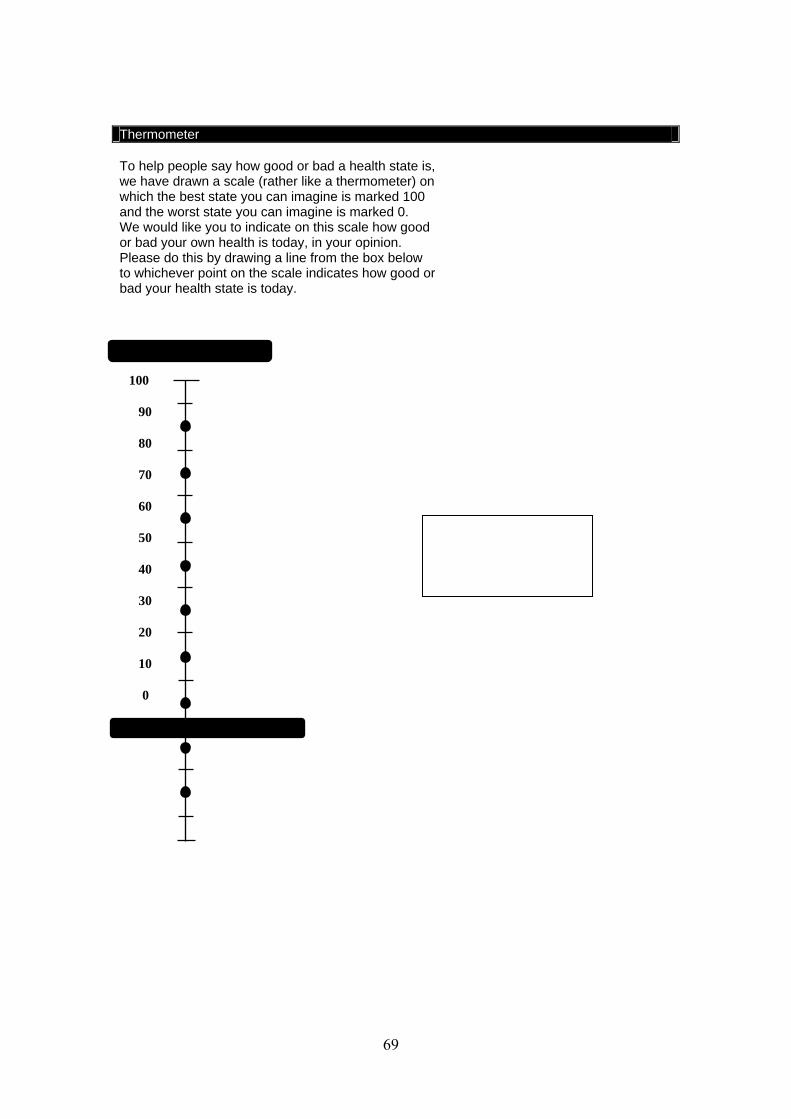
69
Thermometer To help people say how good or bad a health state is, we have drawn a scale (rather like a thermometer) on which the best state you can imagine is marked 100 and the worst state you can imagine is marked 0. We would like you to indicate on this scale how good or bad your own health is today, in your opinion. Please do this by drawing a line from the box below to whichever point on the scale indicates how good or bad your health state is today.
100
90 80 70 60 50 40 30 20 10
0
Worst state imaginable

70
Appendix 8: Unit cost estimates and sources (2006/7 prices)
Hospital Services A and E visit Health Service £110/visit Curtis (2007) p107 A & E stay Health Service £274/stay (2) DRG poisoning Emergency Ambulance Health Service £237/journey Curtis (2007) p108 Inpatient Health Service £443/day NHS Ref costs (weighted average of all
inpatient (TELIP) Outpatient Health Service £116/visit NHS Ref costs average of first attendance
(£142) and follow up (£89) TOPS FAA and TOPS FUA
Day case Health Service £549/case NHS Ref costs (weighted average of all outpatient (TDC)
Primary care services GP Health Service £20/visit Curtis (2007) p133 PN Health Service £9/visit Curtis (2007) p130 GP Home Health Service £59/visit Curtis (2007) p133 PN Home Health Service £12/visit Curtis (2007) p130 NHS 24 Health Service £17/visit £15.11 uprated by inflation NHS walk-in centre Health Service £23.5/visit Salisbury et al. 2002, least cost centres consultation,
p.108 uprated by inflation Counsellor Various £38.5 / visit Curtis (2007) p186 Other Services Occupational Therapist Social Services £18 Based on 30 mins contact (£36/hr) Social worker Social Services £58 30 min contact Benefits advisor Social Services £16 Based on social worker Adult rate per hour of client
Related work (£31 per hour) 30 min contact Housing benefit advisor Social Services £16 As above Counsellor Various £38.5 / visit Curtis (2007) p186 Other social advisor/contact
Social Services £16 As above
Alternative medical practitioner
Health Service £11/visit £10 uprated by inflation
Podiatrist £16 Netten & Dennett p 130 Physiotherapist Various £18 visit Curtis (2007) p171 (£37/hr in hospital) Voluntary Services
• Debt advisor Various £8 0.5 professional and 0.5 volunteer labour References to Appendix 8 Curtis, L (ed.) (2007) Unit Costs of Health and Social Care 2007, Personal Social Services Research Unit,. University of Kent at Canterbury. NHS Reference Costs – see Department of Health website. Sailsbury, C., Chalder, M., Manku-Scott, T., Nicholas, R., Deave, T., Noble, S., Pope, C., Moore, L., Coast, J., Anderson, E., Weiss, M., Grant, C. and Sharp, D. (2002) The National Evaluation of NHS Walk-in Centres. Bristol: University of Bristol.

71
Appendix 9: Service utilisation by intervention and control group
A. Hospital Services
Service Intervention Baseline
Control Baseline
Intervention Follow up
Control Follow up
A&E visit 3 had 1 visit 2 had 1 visit 2 had 1 visit 1 had 1 visit
Inpatient (days) 0 1 had a 5 night
stay 1 had a one-night stay
1 had a one-night stay, 1 had a 3-night stay
Outpatient visits 1 had 6 visits
6 had 1 visit, 3 had 2 visits, 1 had 3 visits, 1 had 4 visits
2 had 1 visit, 2 had 2 visits, 1 had 3 visits
3 had 1 visit 1 had 2 visits 1 had 3 visits
Day case 1 had one visit 2 had 1 visit 1 had 2 day-case admissions
1 had 1 day case I had 25-day case admissions
B. Primary Care Services Service Intervention
Baseline Control Baseline
Intervention Follow up
Control Follow up
GP surgery visit
18 people, 34 visits
17 people, 42 visits
13 people, 39 visits
19 people, 44 visits
PN* surgery visit 9 people, 15 visits 11 people, 17
visits 11 people, 20
visits 11 people, 22
visits GP home visits 2 people, 4 visits none none None PN home visits 1 person, 6 visits none none None NHS24 2 people, one call
each none 1 person, 2 calls 1 person, 1 call Walk-in centre none One person, one
visit none none
*PN: Practice nurse C. Other Services Service Intervention
Baseline Control Baseline
Intervention Follow up
Control Follow up
State housing benefit advice
2 people, 7 contacts
3 people, 9 contacts
2 people, 7 contacts
1 person, 4 contacts
Debt legal 1 person, 3 visits none 1 person, 1 visit none Alt med practitioner 1 person, 3 visits 1 person, 3
visits none none
Occ Health 1 person, 1 contact none 2 people, 3
contact 1 person, 1
contact Counsellor 1 person, 8 visits 1 person, 4
visits none none Podiatrist none 1 person, 1 visit none none Physiotherapist none 1 person, 9
contacts 2 people, 3
contacts 3 people, 10
contacts Other 3 people, 14
contacts 1 person, 1
contact 1 person, 1
contact 1 person, 1
contact

72
Appendix 10
Acceptability questionnaire (for responders)
1. How did you feel about receiving the general lifestyle questionnaire? (Tick as many boxes as relevant).
Happy to help Reluctant to give personal details Found the questions intrusive Suspicious that information might be disclosed to employer 2. Where would you rather receive this kind of questionnaire?
At home At work 3. Would you be more likely to take part in this kind of survey if it were: Conducted by the Council’s occupational health service Conducted by an external organisation 4. Looking at the original questionnaire again, were there any particular
questions you objected to, or found difficult? No Yes (please specify):
If so, what was difficult about these questions?
5. Do you think that the Council’s occupational health service should
provide health assessments on any of the following?
Smoking Diet Alcohol Any other lifestyle factor (please specify):
6. Do you think that the Council’s occupational health service should
provide advice and information on any of the following?
Smoking Diet Alcohol consumption Any other lifestyle factor (please specify):
Please feel free to make any other comments overleaf.

73
THANK YOU! Appendix 11
Acceptability questionnaire (for non- responders)
1. How did you feel about receiving the general lifestyle questionnaire? (Tick as many boxes as relevant).
Happy to help Reluctant to give personal details Found the questions intrusive Suspicious that information might be disclosed to employer 2. Where would you rather receive this kind of questionnaire?
At home At work 3. Would you be more likely to take part in this kind of survey if it were: Conducted by Xxxx Xxxx Council’s occupational health service Conducted by an external organisation 4. If you didn’t return the questionnaire, what was the reason? (Tick as
many boxes as relevant). Forgot Didn’t have time Lost the questionnaire Did not want to give personal details Objected to smoking questions Objected to diet questions Objected to alcohol questions Other (please specify):
5. Do you think that the Council’s occupational health service should
provide health assessments on any of the following?
Smoking Diet Alcohol Any other lifestyle factor (please specify):
6. Do you think that the Council’s occupational health service should
provide advice and information on any of the following?
Smoking Diet Alcohol consumption Any other lifestyle factor (please specify):
Please feel free to make any other comment overleaf.

74
THANK YOU!