redesigning the survey of graduate students and ... · peter einaudi, rti international (rti)...
TRANSCRIPT
Kelly Kang, National Science Foundation (NSF)Patricia Green, RTI International (RTI)Peter Einaudi, RTI International (RTI)
Council of Graduate Schools Annual MeetingDecember 8, 2016
National Science FoundationNational Center for Science and Engineering Statistics
Redesigning theSurvey of Graduate Students and
Postdoctorates in Science and Engineering (GSS)

2
Session Overview
• GSS Background
• Major Changes Planned in GSS
• Increase GSS Data Uses and Utility
• Discussion and Feedback

3
• Conducted annually since 1972
• Sponsored by NSF and the National Institutes of Health (Department of Energy in some years)
• Census of all U.S. academic institutions that grant graduate degrees in science, engineering, and health (SEH) fields
GSS Background
4
Part 1: School coordinators at each institution
• Verify and update eligible units (departments, programs, research centers, or health care facilities)
Part 2: School coordinators report total counts on:
• Fall graduate enrollments by SEH field, enrollment status, demographics, and financial support
• Postdocs in SEH by field, demographics, financial support, and doctoral degree type
• Other doctorate-level nonfaculty researchers (NFRs) in SEH by field, doctoral degree type, and sex
Current GSS Data Collection
5
Major Changes Planned in GSS
• Separate data on master’s and doctoral students to make data much more useful
• Use Classification of Instructional Program (CIP) codes rather than GSS codes
• Move toward file transfer to upload data rather than manual data entry into GSS Web instrument
6
Separate Data on Master’s & Doctorates
For all GSS-eligible science, engineering, and health fields, collect data on:
• All master’s degree students (both research and professional degrees)
• All research doctorate students
7
Using CIP Codes for Field Taxonomy
• CIP codes are used for the Integrated Postsecondary Education Data System (IPEDS) thus available in the institutions student databases
• Using CIP codes allow for more flexibility in data comparisons with other data sources
• Continue using GSS codes for data reporting on postdocs and non-faculty doctoral researchers (NFRs)

8
Use File Transfer to Upload Data
• Separate reporting of master’s and doctorate student data will increase institutions’ response burden
• Burden can be reduced by creating data file from student databases and transferring onto GSS Web instrument
• Three data file transfer options for institutions:1. Upload de-identified individual-level data
2. Upload unit-level data using an Excel macro that aggregates individual-level data
3. Upload unit-level data as in prior cycles

9
Increasing GSS Data Uses and Utility
• Separate data on master’s and doctoral degree students help graduate schools to benchmark their data against peers and national estimates
• Demonstration of current GSS data to show separate reporting of master’s and doctorate student data yielding more useful information

10FT = full time; PT = part time.SOURCE: Survey of Graduate Students and Postdoctorates in Science and Engineering, 2014.
Table 1. 12 Largest U.S. Land-Grant Institutions in Science, Engineering and Health by Graduate Enrollment – Status and Percent in Broad Field: 2014
Public Land-Grant Institutions
Number Percent
Total PT FT Science Engineering Health
Texas A&M U 7,612 1,320 6,292 54.3 41.7 4.0
U Florida 7,317 1,881 5,436 45.4 34.3 20.3
U Illinois at Urbana-Champaign 6,459 428 6,031 56.6 39.2 4.2
Purdue U 6,425 1,923 4,502 42.1 51.8 6.0
U Wisconsin-Madison 6,137 656 5,481 65.3 26.8 7.9
North Carolina State U 6,019 1,315 4,704 55.6 43.3 1.1
U Maryland, College Park 5,613 1,070 4,543 57.7 35.8 6.6
U Minnesota 5,253 445 4,808 64.2 25.3 10.5
Ohio State U 5,233 391 4,842 58.9 26.7 14.3
U California, Berkeley 5,172 0 5,172 63.2 28.7 8.2
Pennsylvania State U 4,695 4,62 4,233 63.1 34.3 2.7
Virginia Polytechnic Institute 4,589 1,182 3,407 53.2 43.1 3.6
Institutional average 5,877 923 4,954 56.6 35.9 7.4

11Source: NSF/NCSES, Survey of Graduate Students and Postdoctorates in Science and Engineering
Table 2. 12 Largest U.S. Engineering Institutions, by Total Graduate Enrollment, Percent Female, and Percent Foreign: 2014
Institutions
Number Percent
Total Female Foreign
Georgia Institute of Technology 3,900 21.2 50.1
U Southern California 3,613 27.4 68.1
Purdue U 3,476 22.5 55.9
Stanford U 3,270 28.4 44.6
Texas A&M U 3,172 23.4 64.4
U Michigan 2,943 23.1 52.2
Arizona State U 2,870 23.1 67.0
Massachusetts Institute of Technology 2,700 28.7 45.2
North Carolina State U 2,608 25.1 50.1
U Illinois at Urbana-Champaign 2,529 22.7 62.6
U Florida 2,512 25.2 53.6
Northeastern U 2,264 28.9 80.7
Institutional average 2,988 25.0 57.9
12
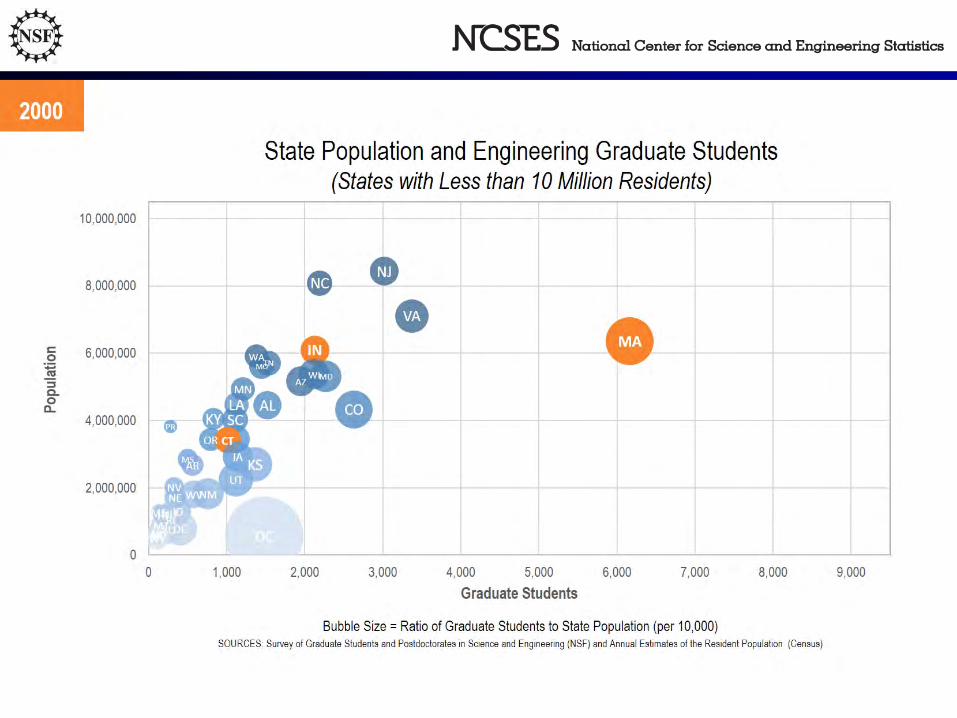
Comparisons Over Time• The GSS can be used to compare change over time
• The following examples look at the relationship between state population and graduate science and engineering enrollment between 2000 and 2014
• Comparisons are done for separately for larger and smaller states
– Cut-point = 10 million residents
• Bubble size shows the ratio of graduate students per 10,000 residents

13
14

15
16
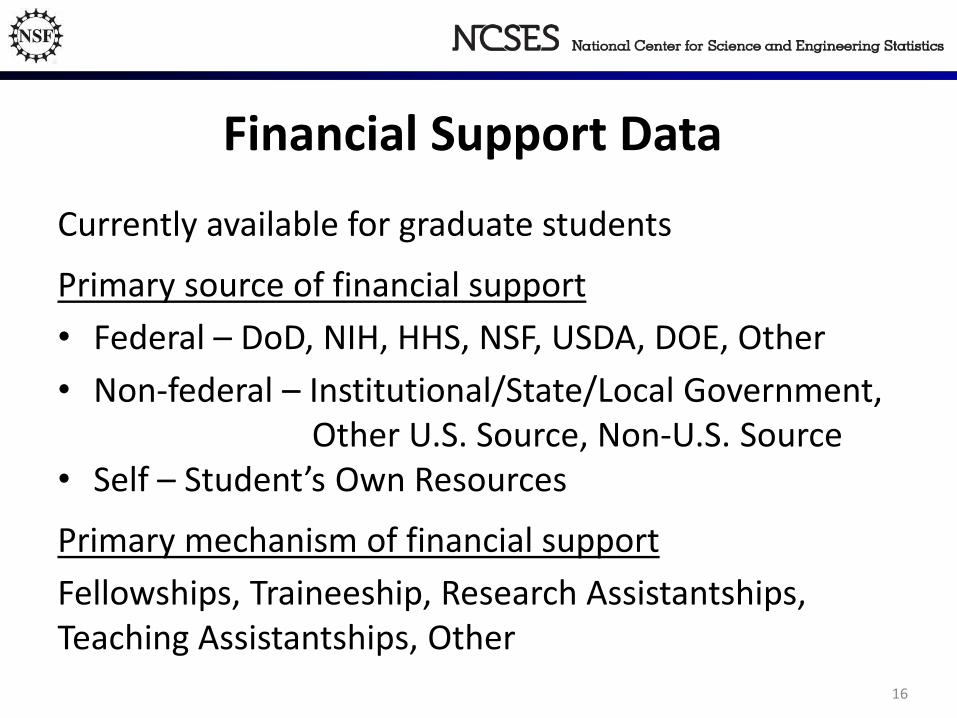
Financial Support Data
Currently available for graduate students
Primary source of financial support
• Federal – DoD, NIH, HHS, NSF, USDA, DOE, Other
• Non-federal – Institutional/State/Local Government,Other U.S. Source, Non-U.S. Source
• Self – Student’s Own Resources
Primary mechanism of financial support
Fellowships, Traineeship, Research Assistantships, Teaching Assistantships, Other
17
Financial Support Data
• Possible changes to sources of financial support data are being considered because it is difficult for many schools to report
• Consideration of collecting financial support data only for doctoral students
• Next slides show the types of data currently collected

18Source: NSF/NCSES, Survey of Graduate Students and Postdoctorates in Science and Engineering
Institutions
Full-Time
Graduate
Students
Primary Source of Support (%)
Federal Institutional Other Self
Johns Hopkins U 1,024 48.9 28.2 11.2 11.6
Georgetown U 543 2.2 11.0 9.0 77.7
Virginia Polytechnic Institute and State U 303 22.8 61.7 9.9 5.6
U Maryland, College Park 302 20.2 63.2 0.0 16.6
Virginia Commonwealth U 282 20.9 52.5 6.4 20.2
U Virginia 239 40.6 52.7 6.7 0.0
George Mason U 216 14.4 46.8 1.9 37.0
Y Maryland Baltimore 169 44.4 39.6 2.4 13.6
George Washington U 141 66.0 19.9 11.3 2.8
Howard U 110 3.6 50.9 16.4 29.1
U Maryland, Baltimore County 103 47.6 33.0 1.0 18.4
Eastern Virginia Medical School 43 7.0 11.6 2.3 79.1
Institutional average 290 28.2 39.3 6.5 26.0
Table 3. Primary Source of Support for Full-time Graduate Students in Biological Sciences at 12 Washington DC-Area Institutions: 2014
19Source: NSF/NCSES, Survey of Graduate Students and Postdoctorates in Science and Engineering
Institutions
Full-Time
Graduate
Students
Primary Mechanism of support (%)
Fellow-
ship
Trainee-
ship RA TA Other
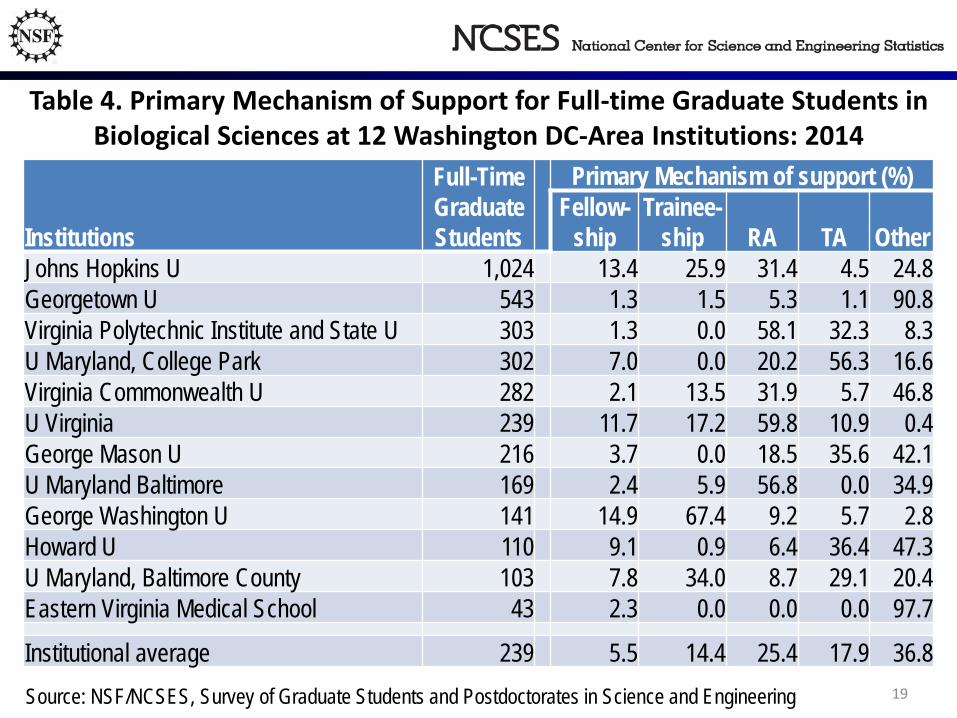
Johns Hopkins U 1,024 13.4 25.9 31.4 4.5 24.8
Georgetown U 543 1.3 1.5 5.3 1.1 90.8
Virginia Polytechnic Institute and State U 303 1.3 0.0 58.1 32.3 8.3
U Maryland, College Park 302 7.0 0.0 20.2 56.3 16.6
Virginia Commonwealth U 282 2.1 13.5 31.9 5.7 46.8
U Virginia 239 11.7 17.2 59.8 10.9 0.4
George Mason U 216 3.7 0.0 18.5 35.6 42.1
U Maryland Baltimore 169 2.4 5.9 56.8 0.0 34.9
George Washington U 141 14.9 67.4 9.2 5.7 2.8
Howard U 110 9.1 0.9 6.4 36.4 47.3
U Maryland, Baltimore County 103 7.8 34.0 8.7 29.1 20.4
Eastern Virginia Medical School 43 2.3 0.0 0.0 0.0 97.7
Institutional average 239 5.5 14.4 25.4 17.9 36.8
Table 4. Primary Mechanism of Support for Full-time Graduate Students in Biological Sciences at 12 Washington DC-Area Institutions: 2014

20
Financial Support Data Needs
• What information about students financial support is most useful for your institution?
• Is collecting financial support data for master’s students as important given additional burden?
• Would less details on primary support source (3 sources - federal, nonfederal, self-support) and primary support mechanism (3 types- RA, TA, other) for the master’s students useful?
• Is “primary” source or mechanism of financial support for students meaningful?

21
Discussion

22
Current Redesign Efforts
• Pilot survey being conducted with a sample of 80 institutions in 2016 GSS cycle
• Methodological study this winter and next spring to examine financial support reporting
• Provide training (e.g., webinars) and targeted technical assistance to help institution coordinators with changes
• Some institutions may need to identify analytic or programming support for coordinator who do not have access the student databases

23
Conclusion
• Support of the graduate school deans are important for successful implementation of the changes
• Collecting more useful graduate education data benefits all data users
• Plan to provide institution profiles for each GSS institutions based on new data when available
24
GSS Contact information
Please send your feedback to:
Kelly Kang [email protected]
Patricia Green [email protected]
Peter Einaudi [email protected]