redesign of processes in industry producing flexible
TRANSCRIPT

REDESIGN OF PROCESSES IN INDUSTRY PRODUCING FLEXIBLE
POLYURETHANE FOAM
SCHOOL OF ECONOMICS, BUSINESS ADMINISTRATION & LEGAL STUDIES /
SCIENCE AND TECHNOLOGY OF
A thesis submitted for the degree of
Master of Science (MSc) in Strategic Product Design
Magoulas Spyridon
ID: 1106170015
Supervisor: Dr Katsaliaki Korina
JANUARY 2020
Thessaloniki-Greece

Abstract
Polyurethane foam is a material that is used in a significant variety of sectors.
Industries producing PUF are still growing their market share and there is margin for
innovative solutions related to production operations and new final products. The
current study aims to map the functions of a specific industry by an operations
management perspective. The process of mapping the operations of the industry led
to the investigation of problems related to the use of working space, waste of raw
material, waste of motion etc. The main scope was to suggest realistic and cost
effective solutions as well as an improved layout design in order to reduce the
existing barriers and increase efficiency and effectiveness.

Table Contents Chapter 1: Introduction ....................................................................................................... 5
1.1 Modern definition of Operations Management ......................................................... 5
1.2 History of Operations Management ........................................................................... 5
1.3 The necessity for manufacturing companies to adapt Operations Management tools. 7
1.4 Motivation................................................................................................................. 8
1.5 Objectives of Dissertation .......................................................................................... 9
Chapter 2: Literature Review ............................................................................................... 9
2.1 The main reasons for redesigning .............................................................................. 9
2.2 Layout and flow ........................................................................................................10
2.2.1 Production processes .........................................................................................11
2.2.2 Main types of facility layout ...............................................................................13
2.3 Inventory management ............................................................................................14
2.4 Enterprise resource planning ....................................................................................15
2.5 Forecasting ...............................................................................................................16
2.6 Quality Management ................................................................................................16
2.7 A Lean perspective for SMEs .....................................................................................17
Chapter 3: Case study of specific PUF industry ...................................................................19
3.1 Introduction to the company ....................................................................................19
3.2 The methodology .....................................................................................................20
3.3 Current situation ......................................................................................................21
3.3.1 Production Processes .........................................................................................22
3.3.2 Cutting Processes ...............................................................................................24
3.3.3 Packaging ..........................................................................................................25
3.3.4 Delivery .............................................................................................................25
3.3.5 Waste material ..................................................................................................25
3.3.6 Current layout and flow .....................................................................................28

Chapter 4 Redesigning-Improvements................................................................................29
4.1 Data presentation-analysis .......................................................................................29
4.1.1 Curved top of block failure .................................................................................29
4.1.2 European prices of raw material in 2018 ............................................................31
4.1.3 Cost calculation of raw material waste ...............................................................33
4.1.4 Trolley material failure .......................................................................................34
4.2 Results and recommendations ..................................................................................36
Chapter 5 Conclusion .........................................................................................................40
5.1 Limitations ...............................................................................................................40
5.2 Future work ..............................................................................................................41
References .........................................................................................................................41
List of tables
Table 1: Dimensional and waste characteristics of blocks ...................................................30
Table 2: Calculating waste cost of TDI .................................................................................34
Table 3: Calculating waste cost of polyols ...........................................................................34

List of figures
Figure 1: Graphic representation of OM’ transformation role .............................................. 5
Figure 2: Innovations in Operations Management ............................................................... 6
Figure 3: Process selection and capacity planning influence system design .........................11
Figure 4: Types of production processes and facility layout relationship .............................12
Figure 5: Lean tools and practises.......................................................................................18
Figure 6: Cause effect fishbone diagram of 5Ms .................................................................21
Figure7: Flowchart of processes from start to end ..............................................................22
Figure 8: Current layout and flow of material. ....................................................................29
Figure 9: Front and Isometric view of Block’s model before and after first cutting process .30
Figure 10: Right and isometric view of block and top removed ...........................................31
Figure 11: Fluctuation of TDI price in Europe for year 2018 ................................................32
Figure 12: Fluctuation of polyol price in Europe for year 2018 ............................................33
Figure 13: Right and isometric view of trolley and loaded block ..........................................35
Figure 14: Current model of machine .................................................................................36
Figure 15: Addition of rollers on the top part of machine ...................................................37
Figure 16: Views of improved trolley ..................................................................................38
Figure 17: Improved layout and flow ..................................................................................39

Chapter 1: Introduction
1.1 Modern definition of Operations Management
Every organization’s objective is to deliver a service or a product to the customer. The
process of transformation, “operations”, makes use of the input resources and add
value to the output product for the customer. Materials, information and customers are
called transformed resources, similarly facilities and staff comprising the transforming
resources (as it is illustrated in Figure 1). According to Greasley (2009) operations
process is a way of transforming a set of input resources into outputs of products and
services. Operations Management is the function used by business aiming for
coordination, planning, and controlling of processes and resources. By using specific
strategy related to OM organizations can take advantage of being efficient and
effective. The main strategic drivers are costs, sequence of operations, logistics,
quality systems, productivity and allocations of resources. After all, selecting the
appropriate strategy will lead to profit maximisation, customisations, quality,
flexibility, quick response, creativity and innovation, reliable delivery and better after
sale service (Ahmed et al., 1996 cited in Yu & Ramanathan, 2012).
Figure 1: Graphic representation of OM’ transformation role
(Source: Nigel Slack et al, 2013)
1.2 History of Operations Management
According to Skinner (1985), for the first time the functions of Operations
Management introduced the period of 1890-1920 with the contribution of Frederick
W. Taylor, Frank and Lillian Gilbreth and Henry L. Gantt. Later this era was

established as ¨scientific management¨. It is based on observation, measurement,
analyzing and improvement of work methods and economic motivation. The main
scope was to find the best way to accomplish each job. In contrast to the great
economic crisis of 1929 the period between 1920 and 1960 is described as the golden
age for the development of industry in the USA (Hopp and Spearman, 2001).
Specifically, they were focused on labor productivity improvements (time and
sequence of tasks), layout, production control and queuing theory. The contribution of
Taiichi Ohno were significant for Toyota Motor company as a new manufacturing
system was developed focusing ¨just in time¨ and automation. After World War II
algorithms and methodologies were developed to solve problems related to
optimization (Chopra et al., 2004). Although studies have been done on aggregate
capacity planning, inventory planning and quality control still were not used widely.
In 1960s, Orlicky and O. Wright started using computers to give solutions in
production control issues. In the following decade MRP systems were developed
followed by information systems and databases as there was necessity for handling of
data. During 1980s, operations management has been accepted globally as a functional
discipline of organizations. Due to the evolution of computers and the need for better
planning and control MRP II was developed by Gene Thomas at IBM. Finally, as
internet was widely established Enterprise Resource Planning software becomes a key
tool in order to coordinate, plan and control all the functions of the
companies(distribution, allocation of resources, accounting, manufacturing process,
procurement, inventory handling, human resources). In Figure 2 the most important
innovations of operations management are illustrated.
Figure 2: Innovations in Operations Management
(Source: Adapted from Nankervis et al, 2015)

1.3 The necessity for manufacturing companies to adapt Operations
Management tools.
The globalization obligates not only multinational companies but also the small and
medium enterprises to improve both the inner and outer environment so that they will
be competitive and sustainable. SMEs are businesses that employs a small number of
employees maintaining revenues and assets. As long as the role of SMEs in each
country is important for their economy, the government supports them to help keep
them viable and competitive. Managing internal processes for SMEs is often based on
learning by doing. By solving practical issues in order to adapt to the market they
develop skills that transform to internal knowledge. It is a significant fact that in SMEs
there are developed strong relationships between members of the companies and
suppliers or other personnel of professional organizations. By knowing it they can
benefit from this knowledge and start using new analytical and business tools for better
planning of production and improve the manufacturing processes in order to optimize
and integrate the supply chain.
Operations management tools are necessary for SMEs as they are vital for control and
improve quality of products. Another reason to adapt OM practices is to improve the
overall efficiency. By knowing production cycles and times companies can be reliable
to their customers concerning delivery times, an indicator for quality of service.
Moreover, improvement of production processes creates benefits as waste reduction
of raw materials and intermediate product. It is significant to handle stock and reduce
it to a safety level as space for inventory creates in SMEs is limited. The volume of
work in progress needs to be controlled for the same reason.
In conclusion, it is a matter of survival for SMEs to have a clear view of the function
of their business so that they can be innovative and keep their market share and grow.
By adopting new technology tools they can deplete production processes and human
resources used. All of the above have an impact on the economic environment of the
company. More significantly, reducing ordering cost of raw materials, cost of delivery,
cost related to defective products, cost of inventory, cost of wastage in production and
energy cost conserves economic resources. It is important to mention that SMEs are
struggling to find cash flow and they are often not get paid in time. So investing in
innovation is a difficult process and saving cost from each process is crucial.

1.4 Motivation
After 10 years of financial crisis in Greece the number of companies that disappeared
is 244,712. A great number of them closed because of bankruptcy, other closed due to
competitiveness and not being viable. High taxation of Greece combined with lower
salaries in Balkan lead domestic companies as well as multinational companies to
depart from Greece and establish their headquarters and operations in the neighboring
countries where financial and political conditions were more stable. In the region of
Thrace specifically in Xanthi more than 30 industries closed for the reasons mentioned
above. As a result unemployment increased and overall productivity is decreased.
There some big business that closed such as the Cooperative Meat Production and
Trading Company (ΣΕΠΕΚ), the Paper Manufacturing Company of Thrace (DIANA),
Pyramis, Co-operative Company of Industrial Development of Thrace (ΣΕΒΑΘ),
Aluminum Industry of North Greece and Greek sugar industry.
It is a fact that bankruptcy of industries and enterprises affected the suppliers and other
stakeholders of the supply chain pushing them to the same direction. Cooperating
companies left without being paid for the products sold to the bankrupted companies.
This situation increased their debt, created cash flow problems and lost the ability to
get loan from banks. The industries that survived fired employees as a consequence of
decrease in demand and a way to reduce costs. Furthermore, financial liquidity
prevents companies from investing in new machinery, expanding business and
adopting new technology. These are tools of great importance for companies to
compete in the global market.
It is a challenge for small and medium enterprises to find ways to improve their overall
performance taking into consideration that circumstances are not conducive.
Furthermore, overcome internal constraints, increase market share and focus on
customers are important key drivers connected with Operations Management
techniques.
Understanding the Lean Manufacturing philosophy would offer great advantages to
Greek companies. It is interesting to mention that 39% of respondents in Greece
associate lean manufacturing with workforce reduction (Konstantinos Salonitis and
Christos Tsinopoulos). Also, the level of understanding lean manufacturing
implementation affiliates more with the durations implemented and not with the size
of the company. Finally, it is crucial to investigate if it possible to overcome key

barriers of investment costs, management barriers related to poor knowledge or poor
belief on the approach. Also, workforce related barriers such as fear of change,
employees’ fear of job cutting and lack of knowledge and understanding.
1.5 Objectives of Dissertation
The objectives of this study are to make the profile of the specific industry producing
flexible polyurethane foam and understand the way that most SMEs operate in Greece.
It is important to analyze the current situation and compare it with management
techniques used by other companies. Their operation activities are focusing in
producing PU foam blocks and layers in a variety of more than 15 different qualities.
The company’s products are applied in the sector of furniture construction, hospital
sector, packaging services, hotels and other industries. It is expected to note down and
answer the following questions.
1. Is it possible to manage in a better way raw materials?
2. Do an improved layout design of the industry can give benefits?
3. How to reduce wasted materials and defective products?
4. Is it possible to reduce stock without affecting customer lead time?
5. Does demand forecasting assist in better organizing of production?
6. Considering the current conditions after collecting and analyzing data, what kind of
applicable recommendations could be made?
Chapter 2: Literature Review
2.1 The main reasons for redesigning
In the Greek manufacturing sector the industries that started operating after the decade
of 1980 had lack of knowledge about management and optimization. Due to this fact
they developed structural business models based on experience. Furthermore, the new
trends in did not transferred and applied in business because of the absence of
managers in small business. In order to be competitive, companies must achieve
excellence in managing their
Manufacturing operations. The redesigning-reengineering process focuses on the
operations performed and how they should be designed to be functional, ergonomic

and qualified. It embodies mapping and analyzing processes so that performance being
improved and implement new solutions.
It is important for business to be sure that all operations are oriented towards the goals
and they function without incidents. By redesigning processes superfluous processes
that slowed down the overall productions are removed. Employees will find it easier
to follow a shorter path and be satisfied. Also there is more time for employees to
perform meaningful work. So overall efficiency and satisfaction is increased. The
reengineering process aims to improve the overall business functions, focus on the
firm’s goal and create an energetic and innovative business environment. As a result,
the enterprise will have lower operation costs, better organizational structure, clear
objectives, more time for new product development and increased profit. Last but not
least, satisfaction of employees is a possible outcome that leads to creativity.
2.2 Layout and flow
Product and service choices, capacity planning, process selection, and layout of
facilities are among the most basic decisions managers make because they have long-
term consequences for business organizations, and they impact a wide range of
activities and capabilities (Stevenson William J.) .As it was mentioned above, small
business tend to be managed by the owner. The involvement of the owner manager is
a basic factor that distinguishes small from big companies considering the way they
are managed. Small businesses are more personalised and rely on the skills and
experience of the owner. Furthermore, there is less time and skills for improvements
on the design of business and operations.

Figure 3: Process selection and capacity planning influence system design
Source (Stevenson William J., 2012)
In figure 3 it is illustrated the dependency of capacity planning and the selected
process. It is obvious that when it is planned to manufacture a new product, make
technological changes to adopt to the competitiveness of the market and forecasting
influencing capacity planning and process selection. Furthermore, capacity planning
and process selection are correlated. Both of them significantly affect facilities
equipment, the layout of the industry and the designing of work. Finally, adapting an
efficient layout design and flow which leads to optimization of space, facilitating
moving in the industry, eliminate unnecessary movements of workers or materials,
extension in the layout, the increase capacity production and provide safety for
workers and production plant.
2.2.1 Production processes
Concerning product variety and production volume production processes are divided
in five categories. Figure 4 presents the correlation between facility layout and
production processes. Definitions of categories are summarized as follows.
A project is a unique non-repetitive set of activities directed toward a unique goal
within a limited time frame (Stevenson William J, 2012). It is a complex process of
high customization with high variable costs and cost per unit. The scheduling and the
control of a project is crucial.

Job shop is a low scale manufacturing process of high variety of products. Each job
requires highly skilled workers and unique operations. It is flexible and products are
made to order.
Batch process implies for medium quantities of products that are variable. It is not a
repetitive process. Furthermore, it is flexible for new products as machines are not
connected with conveyor. Workforce does not need to be highly skilled. Products of
this process are made to stock and are oriented toward mass market.
Mass production is a repetitive automated process (production line, assembly line)
for producing standardised products in high volumes. The variety of products per line
is low as the adjustment of equipment is specific. There is no need for special skilled
workforce except from monitoring the equipment. As it the most efficient process,
changing the sequence of the production line is a difficult task.
Flow or continuous production is appropriate for very low varieties even only one
kind of product. Products are highly standardized in huge volumes and the he cycle
time is very low. Similarly to the mass production changes cost in time and money.
Finally, machine defects affect the whole process.
In the specific PU foam industry batch processes are implied as the orders of customers
are medium in quantity and they are variable for each customer.
Figure 4: Types of production processes and facility layout relationship
Source (György Kovács and Sebastian Kot, 2017)

2.2.2 Main types of facility layout
Fixed Position Layout is appropriate for products that are large and bulky and its
movement is impossible. Workers, raw material and machine equipment are moved to
the production station. Delivery of raw materials and completion time are the most
important factors. There are disadvantages related to space such as crowded work areas
and little lack of storage space. Problems related to space may affect material handling.
Process or functional layout is based on the nature of process through which the
product moves to be manufactured. Processes are grouped in departments in which
similar kind of activities take place (milling, grinding, drilling, painting, assembling,
packaging). Items that moved through departments in lots and batches. This layout is
easier to supervised and more flexible. The success of one operation does not affect
directly another operation as items moved in batches. Also maintenance cost is lower
and the disconnection of one machine does not interrupt the whole manufacturing
process. Financially, investments for spare parts, extension machines or software
updates are lower than in product layouts. In contrast to the benefits there are important
drawbacks to mention. Due to the discontinuous nature of layout work in progress is
increased. Intermediate products increase in-process and reduce the availability of
working floor area. Also, through put time is long. Accounting, inventory control,
scheduling of efficient batch production become complex activities and need special
attention. The lack of well-organized production control creates delays or inefficient
use of manufacturing time.
Cellular layout contains machines which are grouped according to the similar process
needed for the manufacturing of a family of products that are alike. Before grouping
the essential machines it is necessary to identify families of products and train the
employees. There are many advantages in this layout like reduction in set up time, in
work in progress inventory, in material handling and transportation time. Also they are
flexible, less floor space required as there is not work in progress inventory and
efficient use of machines and equipment. Additionally, as workers participate in a
series of sequencing tasks and observing the manufacturing process boredom is
reduced and job becomes more interesting. On the other side, sometimes work in cells
may not be balanced due to decrease in demand of a specific family of products. In
Contrast to this when there is increased demand in another cell workforce should be
adjusted and move. The mobility of operators is possible only if they are multi-skilled

and trained in each cell. Investment for cells is higher because similar machines are
duplicated in order to be used in different cells.
Product or line layout is used for manufacturing standardized products of high
volumes. Machines are grouped sequentially in a conveyor line and the product flows
on the conveyor. In this layout there is less need for scheduling as there is mechanical
pace and automation. It is a beneficial way of production as delay is eliminated. Due
to the continuous flow of products work in progress is not accumulated. Also there is
less need for control and production control is more effective. Conversely, a huge
capital investment is necessary as the same machine is needed to be bought for more
than one product lines. The rearrangement of a production line is not an easy process
and consumes time as it has been designed for a sequence of specific operations. Also,
if a machine stops working it affects the whole product line. Maintaining and fixing
the equipment results in higher costs. Finally from the employees perspective working
in linear production causes monotony due to the repetitive tasks.
The current layout of the PU foam industry is oriented around processes deploying the
advantages mentioned above. Implying characteristics of cellular layout combining
them with process layout could result in more efficiency as it will be proposed in
Chapter 4.
2.3 Inventory management
Keeping inventory of raw materials, partially completed goods or final products is
crucial for the efficient functioning of business. It is important for business to keep
stock in order to meet the needs of customers and respond to demand. Ordering of raw
materials contains ordering cost, cost of handling and space for storage. The right
amount of stock keeps production smooth and protects the business from running out
of materials. It is important for enterprises to keep safety stock of raw materials to
reduce risk. Suppliers’ stock out, weather conditions, workers’ strikes, customs
control, delivery of wrong material and long distances are factors that increase the risk
of delayed deliveries. For small business purchasing cost of raw materials from
multinational suppliers is not negotiable as prices are defined by them. Ordering cost
is depended on the type of cooperation between the supplier and the buyer. In the
chemical supplies it is often included in the price of product and there is a minimum
order quantity. Furthermore, holding cost of chemical supplies in the polyurethane

foam industry contains cost of electricity consumption as a specific temperature is
required before production. There are different ordering policies based on how much
to order and when to order. Inventory that is intended to meet expected demand is
known as cycle stock, while inventory that is held to reduce the probability of
experiencing a stock out (i.e., running out of stock) due to demand and/or lead time
variability is known as safety stock (Stevenson William J., 2012).
2.4 Enterprise resource planning
Regardless of a company’s size today’s business functions become more complex and
the need for efficient interaction between departments of a company arises and
becomes vital. Enterprise resource planning is a strategic tool and business process
management software which synchronizes, integrates, and streamlines data and
processes of the organization into one single system to gain a competitive advantage
in the global market (Antoniadis I. et al, 2010). The right implementation of an ERP
system improves functions of financial control, human resources, customer service,
supply chain, operations management. Specifically, an ERP software incorporates
modules of ERP production planning, ERP purchasing, ERP inventory control, ERP
sales, ERP marketing, ERP financial and ERP human resources to an integrated entity
(Ignatio Madanhire, Charles Mbohwab, 2006). According to Antoniadis I. et al
investigation in 2014 about ERP system adaption of SMEs in Greece it is measured
that in a sample of 37 companies there was an average of 6 year experience in ERP
implementation. Decision making process becomes simpler and it is crucial for small
business to understand this and adapt effective tools as well as they still struggle to
achieve this goal. Additionally, it is important to mention that the traditional manual
recording and processing of data is time consuming and complex.
Finally, it is beneficial for SMEs to adopt a customized ERP software and integrate
the flow of information, improve productivity, maintain a smooth controlling process,
reduce operating costs, be more flexible, locating deviations immediately, increase
sales and facilitating decision making process. Based in the above long term planning
becomes feasible and can generate company’s capabilities. Antoniadis I. et al found
that the advantage SMEs is saving time but not operational resources and cost.
Optimization of function and cost reduction are processes depending on other factors
such as personnel’s leadership skills, culture and strategy of the firm. To conclude,
records and reporting extracted from ERP software related to volume sales, use of raw

material and volume of produced products give important data that can be used for
forecasting.
In the company an ERP system is used for counting and organizing raw material use
and reordering, records of PU foam production and stock, processing of orders and
employees’ payroll.
2.5 Forecasting
Forecasting is an important process that provides information about future conditions
related to demand. Inventory management contains forecasting of supplies for the
expected production of a period. Forecasts also affect capacity planning, budgeting
and sales.
They cannot be accurate 100% but it is an important tool for decision making. For
longer periods forecasts tend to deviate from real demand. Forecasts should be timely,
accurate, reliable, expressed in meaningful units and cost effective. In order to choose
an appropriate technique the first step is defining the objective of the forecast. Then
the time period of forecasting is chosen considering that accuracy is inversely
proportional to time. In the next step appropriate data that affect operations are
analyzed. Based on the above a specific technique that fits the requirements is selected.
After making a forecast monitoring is necessary to calculate its performance. The
accuracy of forecast is measured using forecast error which is the difference between
the value that occurs and the value that was predicted for a given time period
(Stevenson William J., 2012). There are three alternatives to calculate forecast error,
the mean absolute deviation (MAD), the mean squared error (MSE) and the mean
absolute percent error (MAPE).
By interviewing with the director it was found that the forecasting method that is
applied is based on the Mean Absolute Deviation forecasting method.
2.6 Quality Management
Quality is a performance criterion that concerns almost all organizations. Good quality
reduces cost of rectification, waste, complaints and returns and increases customer
satisfaction. Quality improvement are applied to the each operations of an enterprise.
Customer’s view of quality is mapped by the gap created in the comparison of its
expectations of the product or service receives to the perceptions of the product/service
receives. In order to have a clear view of quality first it is necessitated to define the
quality characteristics and decide how to measure each characteristic. Setting quality
standards is the step that follows and gives the possibility to control quality to those
standards.
Total Quality Management is an effective system for integrating the quality
development, quality maintenance and quality improvement efforts of the various
groups in an organization so as to enable production and service at the most
economical levels which allow for full customer satisfaction. (Nigel Slack et al, 2013).
TQM aims to meet expectations of customers, to cover each part of the organization,
include every person of the company and develop ways to support quality and
improvements. Prevention of defects and errors is the main principle of managing
quality. Identifying problems and adjust processes to the right way, redesign and
improvement of processes, training and retrain employees are related to prevention
costs for retain and improve quality.
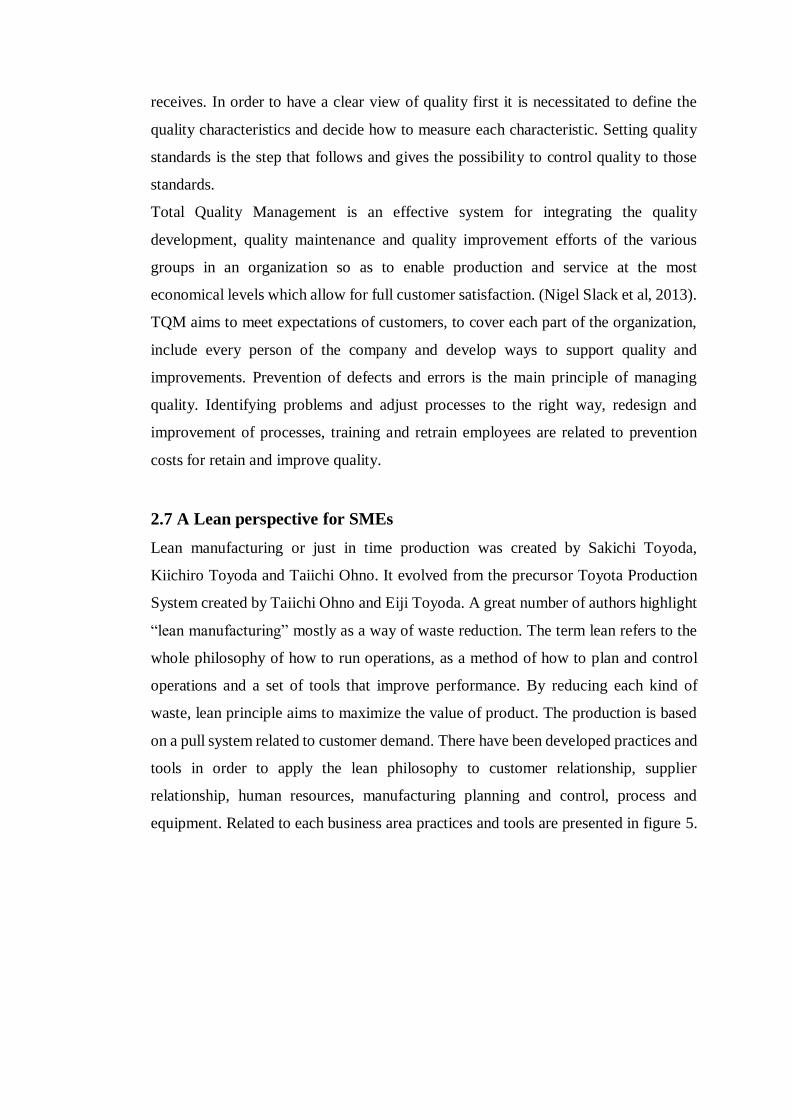
2.7 A Lean perspective for SMEs
Lean manufacturing or just in time production was created by Sakichi Toyoda,
Kiichiro Toyoda and Taiichi Ohno. It evolved from the precursor Toyota Production
System created by Taiichi Ohno and Eiji Toyoda. A great number of authors highlight
“lean manufacturing” mostly as a way of waste reduction. The term lean refers to the
whole philosophy of how to run operations, as a method of how to plan and control
operations and a set of tools that improve performance. By reducing each kind of
waste, lean principle aims to maximize the value of product. The production is based
on a pull system related to customer demand. There have been developed practices and
tools in order to apply the lean philosophy to customer relationship, supplier
relationship, human resources, manufacturing planning and control, process and
equipment. Related to each business area practices and tools are presented in figure 5.

Figure 5: Lean tools and practises
Source (Konstantinos Salonitis, Christos Tsinopoulos, 2016)
Due to the fact that in lean philosophy reduction or elimination of waste constitute a
core idea it is important to mention the 7 different types of waste.
1. Over-production waste
Ohno believed that producing more than you need in the near future is the most
important kind of waste. Consider that manufacturing is the closest spot to the source
that affects the creation of waste in the following processes. With over producing
inventory space is covered and floor space is reduced. Additionally it affects cost of
storage.
2. Waiting time waste
Equipment efficiency and labour efficiency are two popular measures which are
widely used to measure equipment and labour waiting time, respectively. (Nigel Slack
et al, 2013). According to Bicheno and Holweg waiting is related to lead time.
3. Transportation waste
Products that flow to the following processes in an inefficient way affect quality and
productivity. It happens when the products are handled in the same machine after
another. Furthermore, a way to reduce this time layout should change, reduce the
distance of machines and the distance of the whole path that the product follows and
group machines.
4. Processing waste.

Due to the lack of functional design, lack of knowledge of machine handling or
efficient processing some steps may be unnecessary. Training employees to lean
thinking can be beneficial. Furthermore, some processes are overloaded with more
operators than needed resulting in waste of human resources.
5. Inventory waste
In order to eliminate waste it is needed to find the cause of it (a main cause is
overproduction). Inventory is connected with raw material work in progress and final
items. Increased inventory captures space and affects moving flexibility as well as lead
time.
6. Motion waste
Waste of motion occurs both by human and layout. An operator may makes
unnecessary moves that do not add value to the process. Simplifying of work via job
redesigning process results in decreasing production time. A poor layout design may
involves waste of motion. Unnecessary movement in an industry increases the risk
related to both safety issues and declining quality issues.
7. Waste of defects
Defectives may be products that do not approach quality specifications. Errors occur
due to wrong processing or due to accidents in transformation when floor space is
covered. Furthermore, other quality problems occur during the production phase.
To conclude, it should be mentioned that there is not a specific recipe for success in
implementing lean principles. It depends on the manager’s perspective to apply
techniques that benefit each situation. To conclude, there are important drivers for
implementing such as the increase market share, increase of flexibility, the need for
survival from internal constraints, focusing on customers, increase the way of working
to the best and develop key performance indicators (Konstantinos Salonitis and
Christos Tsinopoulos, 2016).
Chapter 3: Case study of specific PUF industry
3.1 Introduction to the company
The company is one of the main manufacturers producing flexible polyurethane foam.
Their operation activities are focusing in producing PU foam blocks and layers. The
manufacturer delivers intermediate and final products made of polyurethane foam. A
big variety of more than 15 different qualities of foam are offered and products

delivered as required and specified by the customer. The companies object is to bring
customized and qualified and innovative solutions to its customers. The company’s
products are applied in the sector of furniture construction, hospital sector, packaging
services, hotels and other industries. The industry was established in 1973 in Xanthi
where there is located the production plants. The industry covers 4700 m2 at the
industrial region of the city. In 1991 a new store department opened in Thessaloniki
and in 1995 another one in Athens. The industry owes one horizontal polyurethane
foam machine and a series of cutting machines that will be presented thoroughly. In
the stores of Thessaloniki and Athens PU foam blocks are transferred to keep stock,
processed there and delivered as ordered by customers. The company owes two trucks
for delivering products to customers. The company faced some unexpected social
related difficulties combined with the socioeconomic issues that aroused due to Greek
crisis. After all it survived and start gaining its lost market share and being competitive.
3.2 The methodology
Redesigning processes, operations and layout arrangement of an industrial facility is a
complex process that is depended on various factors in order to propose a combined
solution that has to be feasible, practicable, flexible and cost effective. The
researcher’s first move is to have a good background about the product the industry
produces. By knowing how it is manufactured, understanding the material properties
of polyurethane foam it will be possible to investigate the overall process from base to
top in a more integrated perspective and find effective solutions. Notwithstanding that
in the beginning there was uncertainty about precise selection of performance
indicators eventually it is proved that the first theoretical assumption was within the
subject.
In the first period of visiting the industry the main objectives were to observe the way
both the employees move in production and office departments as well as the
production of polyurethane foam blocks, various of cutting processes and other
processes in order to understand the nature of job design and material flow. All these
information were written in order to outline and profile the company’s structure,
functions and strategies.
By organizing these information it was possible to decode and extract the company’s
philosophy about managing inventory, understand the production strategy, sales
strategy, operations management, quality management, forecasting, ERP

implementation and the layout of equipment and processes. It is important to mention
that due to the lack of professional management personnel all these strategies are not
specified by the company as they have established academically. In fact, it would be
beneficial for personnel to know the advantages and disadvantages of the strategies
using and not just rely on them. By excluding all this information an enterprise will
struggle to have a positive environment for making changes.
In the second period of visiting the industry the aim was to repeat observation of
employees for evaluating information of the first visiting and increase accuracy. Then
a series of unstructured interviews occurred with the operators, the chemical employee,
office employees and the chief executive-owner. The interviews aimed at extracting
answers about management and organizing issues. The last purpose contained the
collection of ERP data about history of sales, annually and monthly production history
(total production volume of foam and analytical report of produced foam related to
different types of foam), raw material consumption history (focusing on the major )
and technical documents about raw material storage capacity and mechanical sketch
of the industry.
3.3 Current situation
In order to find the causes that affect quality and overcome obstacles there was a need
for categorizing the causes and analyze the roots of the problem. For this reason it was
created the fishbone diagram as it is presented in figure 6 to facilitate the detection of
factors that influence the overall effectiveness and efficiency of the industry.
Figure 6: Cause effect fishbone diagram of 5Ms
Source (own)

Based on the most salient factors that were observed in the industry it was made an
effort to discover latent causes that affect the total quality, effectiveness and
efficiency.
3.3.1 Production Processes
This chapter presents the production processes that occur in order to manufacture
flexible polyurethane foam blocks. PU foam Blocks are transformed to delivery
products for customers made to order. The sequence of processes is presented as it is
indicated in the flowchart of figure 7.
Figure7: Flowchart of processes from start to end
Source (own)
Preparation of production machine
It is the first step before production where the chemical operator checks the machine
and adjusts the parameters related to the specific quality of foam that will be produced.
Some basic characteristics are the ratio of TDI, selection of polyol for soft or hard
foam as well as the ratio of polyols, the pressure of mixing and the velocity of material
flow.
Preparation of curing space
Curing time is the amount of time that is necessary for flexible polyurethane foam to
acquire its final properties. Curing for polyurethane foam takes from 24-48 hours.

Before this period any sharp pressure on the manufactured block causes irreversible
deformation to the block.
Removing equipment or other parts to release space for the new production is
necessary.
Beginning of production
The raw material start flow on the line and after a few second the foam starts inflating.
At the end of the line there is a vertical knife cutting the outgoing mass in blocks. It is
important to notice that due to the release of by-product gases employees have to wear
filtered masks. The machine operator controls the process on the machine interface or
adjusts different ratios for the manufacturing products.
Vertical Cutting
The continuous produced foam flows on the conveyor. Before reaching the descending
conveyor the block is cut in the same length ranging from 200-220cm and then moves
forward to be loaded by employees.
Block loading and transferring
At the end of the line workers are waiting to load the block on a trolley. The trolley
consists of a squared surface with a horizontal wheeled axis and a leverage for
handling. The block is stamped for stock control, then it is loaded on the trolley by the
worker and transferred at the curing area. After discharging it, the worker returns to
take the next. As the production is continuous workers need to go directly back to the
end of the line to load the next part.
End of production
By the end of the production the machine needs to be cleaned. Raw material that are
contained in the trial container and pumps of the production machine are removed and
collected. It is an essential maintaining process that extends the life cycle of machinery
parts. Also the paper that is used to prevent the foam from sticking to the walls of the
flowing tunnel is collected and gets discarded.
Inventory
After curing period where the PU foam has been stabilized (24-48 hours) the
manufactured blocks are moved for storage with a forklift truck. Blocks are
categorized based on their density and quality of foam and banked up.

3.3.2 Cutting Processes
The sequence of operations that are followed after an order has been received depends
on the customers specifications about the desired part. Most of the customers ordering
semi products. Based on the required part’s dimensions the right sequence of
operations is decided to cut the block. The first cutting operation aims to remove the
external layer of the block and results in better quality and uniformed parts. On average
the block’s dimension are 2,04m to 2,20m in length, 2,00m to 2,04m in width and
0,92m to 0,94m in height. The bulky blocks are cut in smaller parts to facilitate
handling. For manufacturing layers and mattresses the cleaned block is introduced in
the round circular cutting machine. Depending on the width of layers the block may
needs a vertical cut before added in the circular cutting machine. A number of blocks
is loaded on the worktable depending on the surface area of it. Blocks are sliced in the
desired thickness. This particular process is characterized by accuracy, automation,
high production efficiency, low amount of defective products and low amount of waste
foam. It is important to notice that due to the free expansion of foam during the
manufacturing process the top of the block has a curve. This curved part increases
waste as it cannot be used in any part and is removed.
In order to form smaller rectangular parts operators make use of vertical and horizontal
cutting machines to reach the ordered part. These types of machines are less
automated. The cutting tool is fixed and the worktable is moved manually by the
operator. Furthermore, the processed part is placed and repositioned by the employee.
Other more complex objects that have gradient lines on their body are processed in an
angular cutting machine. This machines gives the ability for adjusting the tool in
specific angle. Additionally, for complex parts that employees are unable to handle
and standardize the use of CAM pantograph cutting machine is the most reliable.
Thoroughly, the use of pantograph cutting machine gives a series of significant
benefits related to efficiency and effectiveness. Specifically, by organizing cutting
from a lean perspective waste material that arises is minimized. Furthermore the time
of processing is reduced appreciably. Cutting quality, standardization and accuracy are
increased. In order to use the CAM machine specialized training is necessary. For the
production of sleep mattresses, inner layers are cut in another cutting machine to shape
continuous curved patterns.

3.3.3 Packaging
There are two packaging tables close to the cutting machines. The one is next to the
circular cutting machine which serves the packaging of mattresses and the other is next
to the other cutting machines. A layer of nylon is laid on the packaging table and the
produced parts are located there manually in lots by an operator. The packages are
sealed then loaded on a forklift truck and they are transferred towards the exit. They
stored next to the door where trucks park in order to deliver to customers. Packaging
of mattresses is standardized. Packaging of Customized orders depends on the
dimensions of the parts. The way they packaged is based on proper use of truck’s
available space and forklift truck’s transferring capabilities.
3.3.4 Delivery
Managing, planning and controlling of storage space of trucks should be clear in order
to optimize the use of space. Consequently, an optimized control system would reduce
delivery cost. A big transporter serves the orders for the departments of Thessaloniki
and Athens. There are also two smaller trucks that deliver orders in Eastern Macedonia
and Thrace. A key performance indicator for efficiency could be the volume of space
used per delivery route compared to the total volume of truck’s storage space.
Commonly the customer lead time is three days.
3.3.5 Waste material
Production and over production
As the production machine requires 1 hour for preparation and other processes to stop
it is not effective to start production of blocks for a low amount. Some different
qualities can produced in a sequence without stop the process. The chemical just
adjusts a different recipe of polyurethane foam. Even though when some qualities of
low demand are manufactured they remain as stock for a long time and cover floor
space.
Waiting waste
Due to the lack of knowledge to operate the CAM machine as most of the operators
except from one do not know how to use it there is high probability of queuing effect
on the other cutting machines. At the same time the CAM machine operation’s

capacity is not deployed at an optimum level. Additionally, high workloads is possible
to affect delivery customer for some orders.
Transportation waste
By observing the path that the in-processed products follow in the production area it
is ascertained that transportation distance is elongated and complex. An improved path
certainly reduces the risk of transportation accidents inside the industry as forklift
trucks and trolleys manually handled by employees could collide. An accident affects
both safety of employees and quality of products as an employee may be injured and
products have defects from collapsing respectively. Particularly the longest path that
needs to be redefined is the point of packaging area to point of the storage area next to
the exit where trucks are loaded. It is certain that a peripheral route approaches closer
to an optimized solution.
Processing waste
The manufactured blocks that have been stored for inventory need a primary cut
processing to improve their quality before start being cut in the customer’s ordered
dimensions. The outer layer of each face, approximately 1cm in thickness, is removed
as it differs in quality. Additionally, the top face of the block makes a curve that needs
cutting a layer that counts on average 4 cm. After this process the cubic block develops
the desired quality.
Due to the fact that the manufactured blocks have specific dimensions it is a common
situation for operators to deal with customized orders made by customers which do
not fit to the exterior dimensions of the block and create a significant amount of
polyurethane foam waste parts that cannot be used. The way that an operator decides
to handle the cutting processes of an order is based on experience. It seems that there
is room for improvement concerning the organizing of the sequence of processes and
give priority to the waste created aiming to the reduction of it.
Inventory waste
Above it was mentioned that the curved top of the block cannot be used for any
product. The specific waste of the top is related to waste of raw material used for a part
that does not add value. Based on the volume of blocks it was measured that waste of
curved top reaches 4% of the whole volume. By knowing the quantity of raw materials
for producing one block it was found the proportion of TDI and polyol waste of this

part. To support the importance of this amount of raw material wasted it was counted
the precise amount of euros were lost based on the European prices of TDI and polyols
as presented in data analysis.
Motion waste
Due to the fact that the industry’s surface covers approximately 4700m2 unnecessary
movement possibly causes inefficient use of time. The order that is received over the
phone by office worker is passed to the operators. In some cases the customer modifies
the specifications or the quantity of the ordered parts. Somebody has to transfer the
information manually indicating that there is a need for direct communication between
the office department and the production department that should be fulfilled. The time
needed to inform about order changes is crucial and increases risk as time goes by the
processing may have started and create barriers.
Furthermore, due to the lack of direct communication between operators some routes
may be repeated without meaningful purpose. As an example an operator that brings
to the cutting machine area a specific part from the inventory to be processed cannot
be informed to load another part that is needed or make any type of change. Also, it
could be a tool that is forgotten. Additionally, an employee who is available or
physically closer to the desired task could handle the condition without interrupting a
busy operator.
Waste of defects
It is detected that waste of defects occurs at the beginning phase of the production.
Specifically, the employees load the outgoing blocks from the production line on the
single axis trolley to place them at the curing area. Taking into consideration that
bloc’s weight reaches on average 100kg and its mass is approximately 4m3 as well as
there is the pressure of time due to the continuous flow of blocks it is a physical
consequence for employees to get tired. Unconsciously, in order to make the
transportation easier the employees try to place the block as close as possible to their
body when they load it on the trolley in order to decrease the torque that is created due
to the technical characteristics of the single axis trolley. When the block is dropped on
the trolley’s surface it may be pressed by the lever arm and is deformed. Due to the
fact that the foam has not yet acquired its final flexible characteristics the deformation
is permanent. As a consequence a deformed part needs further cut processing to
remove the defective part which increases the amount of waste.

By observing the production process it was found out another type of permanent
deformation but this time at the bottom surface of the block. In order to give a more
visual view it is certain to indicate that there are three cylindrical components with
rolling paper for maintaining the external quality of blocks. Paper prevents the
detachment of foam on the walls of the extrusion part of the machine. When the
outgoing block descends the conveyor to be loaded by the employee the paper at the
bottom is crumpled. An employee pulls the paper to prevent the deformation of the
block. It seems that the crumple of paper is caused due to the long distance between
the conveyor rollers.
Additionally, there is another form of waste at the production process. When the recipe
is changed during the production to manufacture a different density foam an amount
of the outgoing mass has an intermediate structure which occurs due to the alteration
of both chemical flow and proportion of chemicals which are included in the following
quality.
3.3.6 Current layout and flow
All the processes that mentioned above are illustrated in figure … In the right side
there is a caption to facilitate understanding of the layout and flow of material in the
industry. Raw material are transfer through pipeline to the PUF machine. The red
arrows show the path that the produced blocks follow for curing (rhomb). Yellow
arrows indicate completion of curing process and directed transfer for storage. Blue
arrows mark the provision of blocks ready for processing as required by customers.
Finally, black arrows present the move of packaged final products collected and
prepared for delivery to customers.

Figure 8: Current layout and flow of material.
Source (own)
Chapter 4 Redesigning-Improvements
After the identification of the company’s environment and based on the available data
that was possible to extract an attempt was made to measure failures, find causes of
them and support results with economic evidence.
4.1 Data presentation-analysis
4.1.1 Curved top of block failure
In figure 9 it is illustrated the shape of the produced block before and after the removal
of outer layer and curved top. It was found that due to the curve that is created because
of the expansion of polyurethane foam during the formation of the compound, 4% of
each block is wasted without counting the outer layer that is removed in order to have
a homogenous qualified block for further processing. It was necessary to learn the ratio
of raw materials used per block (TDI, polyols) and measure the dimensions of wasted
foam to find this proportion and calculate the amount of raw material wasted for this
part. The dimensions of different quality blocks differ so a mean average for
dimensions was calculated after measuring the dimensions of stocked blocks for each
quality. The dimensions introduced in Solidworks software to measure the mass of the
whole block as long as the mass of the waste curved part.

Figure 9: Front and Isometric view of Block’s model before and after first cutting process
Source (own)
In table 1 the dimensions of blocks are presented categorized per type as measured in
the storage space. It was also measured the distance of horizontal cutting to remove
the top curve. By knowing all the dimension the blocks mass was calculated. Ina
parallel using these information blocks were modeled in Solidworks in order to extract
volume values of the curved part removed. For the purpose of determining and
transforming waste in raw materials mean values were calculated to use them to find
cost of TDI and polyols.
Kind of
foamLength(cm) Width (cm) Height (cm)
Final
height
(cm)
Volume of
block (m3)
Height
reduce (cm)
Volume of
waste (m3)
Net volume
of curved
waste (m3)
Proportion
waste
Ν25Μ 202 204 92 88 3,79 4 0,16 0,12 3,17%
Ν 25 202 204 90 85 3,71 5 0,2 0,16 4,31%
Ν 25Φ 220 204 93 87 4,17 6 0,26 0,22 5,27%
Ν 30 200 204 94 88 3,84 6 0,23 0,19 4,95%
Ν30Μ 220 204 95 89 4,26 6 0,23 0,19 4,46%
Ν35 200 204 99 94 4,04 5 0,2 0,16 3,96%
Ν 40 200 207 95 90 3,93 5 0,2 0,16 4,07%
Ν40Μ 200 207 97 92 4,02 5 0,2 0,16 3,98%
Mean value 3,97 5,25 0,21 0,17 4,27%
Table 1: Dimensional and waste characteristics of blocks
Source (own)

In figure 10 it is presented the model of produced block, the curve wasted part and the
final block that is prepared for further processing.
Figure 10: Right and isometric view of block and top removed
Source (own)
4.1.2 European prices of raw material in 2018
The price of TDI was doubled comparing 2018 indicator to previous years. As it is one
of the basic material for producing PU foam it affects the price of the final products.
Price of Toluene Isocyanate, as it can be observed in figure11, exceeded 3.20 euro per
kilo in February, maximizing its price in April reaching 3.40 euro per kilo. After May
it started descending periodically every month by around 0.30 euro per kilo. It reached
the foregoing price nearly 1.80 euro per kilo. It was the first time in Europe the last 30
years that TDI reached so high prices due to functional problems of supplier industries
and the closing of one supplier industry. As there was high demand for chemicals, this
demand could not be covered by European suppliers. Additionally, it is important to
mention that suppliers of chemicals are mostly multinational companies with high
negotiating power. Small and medium companies struggle to get a competitive price
for chemicals in comparison to big competitors that can make contracts for fixed prices
of raw materials and be able to control manufacturing costs.
To be more accurate in the calculation of TDI wasted cost it was also considered, the
ordering point based on the safety stock of raw material. By the moment an order is
placed it takes 40 days to deliver raw material. Factors such as customs clearance and
strikes in ports may affect delivery time.

Figure 11: Fluctuation of TDI price in Europe for year 2018
Source (ICIS, 2018)
The diagram of figure 12 shows the fluctuation of the second basic raw material used
for flexible polyurethane foam. The most common polyols used for manufacturing of
flexible PUF are dipropylene glycol and glycerol containing less number of hydroxyl
groups, two and three respectively. A specific type of polyol is used for soft foam and
another one for harder foam. The price of polyols in Europe for year 2018 did not
fluctuate dramatically remaining almost between 1.70 and 1.85 euro per kilo.
Considering the graph of figure price of polyol was selected to be equal to 1.80 for the
calculations.

Figure 12: Fluctuation of polyol price in Europe for year 2018
Source (ICIS, 2018)
4.1.3 Cost calculation of raw material waste
By knowing the volume of produced foam per month as well as the consumption of
raw materials it was found the required amount of TDI and polyol required per cubic
meter. Additionally it was calculated the volume of wasted foam and converted to raw
material waste. As the prices of raw material are calculated in kilos and the data that
elicited are measured in kilos it was necessary to find the density of TDI and polyols
to calculate the final cost.

Months of year 2018
Consumption
of TDI per m3
of PUF
Volume of
wasted PUF
(m3)
TDI wasted
(m3)
TDI's weight
(kg)
Cost of TDI
(euro)Volume of block
January 0,009 80,436 0,715 864,617 2.593,85 € 3,95 m3
February 0,009 37,757 0,334 403,693 1.291,82 € Volume of waste/block
March 0,009 77,283 0,693 838,136 2.765,85 € 0,17 m3
April 0,008 38,803 0,326 394,293 1.340,60 € Density of TDI
May 0,009 67,432 0,608 735,104 2.499,35 € 1,21 kg/l
June 0,009 57,331 0,498 601,998 1.926,39 €
July 0,008 101,927 0,857 1037,160 3.215,20 €
August 0,009 37,064 0,319 385,831 1.196,08 €
September 0,009 40,064 0,365 442,140 1.237,99 €
October 0,009 70,518 0,631 763,902 1.986,15 €
November 0,008 38,239 0,320 387,752 930,61 €
December 0,009 75,118 0,659 796,793 1.673,27 €
Summary 721,973 6,323 7651,420 22.657,14 €
Table 2: Calculating waste cost of TDI
Source (own)
Months of year 2018
Consumption
of polyols per
m3 of PUF
Volume of
wasted PUF
(m3)
Polyols
wasted (m3)
Polyol's
weight (kg)
Cost of polyol
(euro)Volume of block
January 0,017 80,436 1,398 1439,654 2.591,38 € 3,95
February 0,020 37,757 0,739 761,175 1.370,12 € Volume of waste/block
March 0,020 77,283 1,550 1596,203 2.873,16 € 0,17
April 0,016 38,803 0,635 654,253 1.177,66 € Density of polyol
May 0,019 67,432 1,288 1326,327 2.387,39 € 1,03 kg/l
June 0,018 57,331 1,018 1048,206 1.886,77 €
July 0,018 101,927 1,806 1860,298 3.348,54 €
August 0,019 37,064 0,718 739,809 1.331,66 €
September 0,020 40,064 0,795 819,255 1.474,66 €
October 0,020 70,518 1,412 1454,438 2.617,99 €
November 0,017 38,239 0,639 658,132 1.184,64 €
December 0,019 75,118 1,458 1501,791 2.703,22 €
Summary 0,018637636 721,973 13,456 13859,542 24.947,18 €
Table 3: Calculating waste cost of polyols
Source (own)
4.1.4 Trolley material failure
Due to physical fatigue of employees as well as the characteristics of the trolley used
for block transferring from the end of the conveyor to the curing area some blocks are
deformed permanently. Specifically, when the block is loaded on the one axis trolley
it falls towards the handling leverage and compressed. The following figure provides
a 3D model of the trolley that is used and the deformation of the block. As a key

performance indicator it would be the number of blocks that deform per production
day. In figure 13 it is rendered the model of the trolley used for the transferring of
blocks as well as the falling of block on the leverage that deforms permanently the
block.
Figure 13: Right and isometric view of trolley and loaded block
Source (own)
This deformation contributes to the creation of foam waste. When the time comes to
process this part the operator decides how to handle it in order to fit it in the desired
dimensions of the ordered part. If it does not fit it stays in stock for another order.
Additionally keeping waste of this part at low levels depends on the operators
experience, envisioning and computational skills.

4.2 Results and recommendations
Although that at first glance a percentage of 4% of waste seems low and not important.
Considering that price of TDI was fluctuating and high, price of polyols was constant
it calculated that cost of TDI waste for year 2018 reached 22.657,14 euros.
Additionally, the cost of polyols wasted computed that reached 24.947,18 euros.
Figure 14 presents the current model of the machine plant. In order to improve the
shape of manufactured block aiming to save raw material and increase its quality it is
proposed the addition of some parts in the existing machine as it is presented in figure
15. By installing horizontal turning cylinders at the top of the flowing tunnel on
specific spots the top face will be squared shaped. It is important to highlight that paper
is added at the top such as both at right and left side of block. In more detail, the aim
of adding the cylinders is not to press the block. In its expansion it won’s take the
shape of swelling bread. It should expand towards the corners too by interfering in
flow of raw materials as it is still liquid at the expansion process.
Figure 14: Current model of machine
Source (own)

Figure 15: Addition of rollers on the top part of machine
Source (own)
Furthermore, another proposal for the avoidance of block’s bottom deformation due to
the wrinkling of paper it could be the addition of more horizontal cylinders at the end
of the machine. The rolling of block becomes smoother and deformation is prevented
increasing quality. Besides quality, there is no need for operator standing by the block
that is loaded on the trolley to remove the bottom paper. By this improvement the
operator is released of this process and becomes available for another.
The possibility for block deformation during loading of blocks to trolley at the
production stage increases due to the physical fatigue of employees. In order to
eliminate this risk that results in decrease of quality, creation of waste and
considerations about the way these blocks should be handled it is proposed the
improved trolley of figure 16. By adding a rectangle wooden piece at the edge of the
trolley’s loading surface the block is impeded to fall on the leverage and be deformed.

Figure 16: Views of improved trolley
Source (own)
Considering the whole layout of the industry aiming to reduce production, waiting,
transportation and motion waste a new layout is proposed as presented in figure 17.
The proposal is based on the types of waste found at the observation stage and they
were mentioned in subchapter 3.3.5 page 14. To facilitate the comprehension of the
processes there has been made a caption at the right side of the proposed layout.
In the new layout the old machine is replaced with a new production machine that
manufactures via the use of block molding. By this way there is no need for keeping
stock for special qualities with low demand. The red arrows showing the path of
manufactured blocks that are transferred for curing. Yellow arrow presenting the
transferring of cured blocks to stock, the blue arrows represent the processed products
and the black the final packaged products.

Figure 17: Improved layout and flow
Source (own)
After curing they move to the inventory. By adding a conveyor line connecting
inventory to cutting processes department it is eliminated the move of forklift truck in
the heart of the industry preventing safety issues and reducing time of transformation.
Relocating the cutting processes as well as the sewing processes close to the exit were
completed orders loaded for delivery it is reduced a significant number of moves inside
the industry. The prior sewing processes department becomes the “Product exhibition”
department were samples of final products are exhibited for the customers.
Furthermore, as there is possibility for producing single blocks of different quality, a
department for testing new qualities of foam next to the new machine gives a
competitive advantage to improve quality of foam. The new machine gives the
opportunity to expand in a new market field besides flexible polyurethane foam
products and manufacture polyester foam products.
Additionally, wasted foam of cutting processes remains at the processing area,
collected and introduced into the filler machine and packaged as a product. Concerning
inventory control it should introduced a bar code system integrated in the ERP system.
Besides, training of employees for efficient cutting as well as for CAM software and
lean principles should be introduced as a formal activity. Another proposal for
reducing time and motion waste of employees is related with communication issues
due to the area size of the industry. Intercommunication between employees improves
the working efficiency. It could be solved by providing VHF wireless transceivers to
the employees and the offices. Unnecessary move of office employees and operators
prevention releases time that could be used for training of employees.

Due to the fact that commercial final products have more value than semifinal products
it should be seriously considered to produce mattresses pillows and other products
addressed for sectors related to clinical products and hospitality.
Another factor that affects costs of production is energy consumption for keeping
temperature of raw material constant at 25o C. As it is presented in the layout the area
of raw material storage should be reduced as there is no need for keeping temperature
constant for the whole room. The room’s volume should be halved in order to reduce
the consumption of electricity for cooling or heating.
Prioritization of improvements is based on cost, easiness of application and time
utilization. Furthermore, changes follow a sequence that does not affect industry’s
operations in a way that influences operations.
Prioritizing improvements
1. Improving trolley
2. Intercommunication devices
3. Adding extra rollers in the production machine
4. Adding top cylinders in the production machine
5. Introducing electronic inventory control
6. Training of employees for efficient/special cutting
7. Buy the new block molding machine
8. Buying of conveyor line
9. Build the new area of sewing department
10. Creating product exhibition department
11. New product development department/Testing new qualities
12. Change the whole layout.
Chapter 5 Conclusion
5.1 Limitations
In order to identify specific spots for introducing cylinders on the top of machine it is
required to analyze the phases of foam’s expansion. Regarding the block deformation
caused by trolley’s leverage it was not possible to measure the rate of defects as there
were not sufficient number of tests during the production phase. Furthermore,
suggesting specific layout for cutting machines needs more circumstantial observation

for a long period as the products are customized and produced with make to order
strategy. Lack of time was a limitation that could not be surpassed.
5.2 Future work
The specific case study could be proceeded in order to synchronize the use of cutting
machines. A techno-economic analysis in relation to energy efficiency could be
conducted from an engineer perspective. By knowing the energy consumption it would
have interest to examine the possibility for energy autonomy, possibility to produce
electricity for the company’s needs and reduce the energy consumption of raw material
space. Additionally, the reconsideration of marketing plan along with the sales
strategy, the company’s core values, the division of labor and the possibility for adding
more shifts and hiring new specialized employees should be studied in deep. The future
objective aims to reinforce business activity and support the propositions of the
presented dissertation’s outcome in order to make it feasible.
References