recycling economic information study update 2009€¦ · recycling in 2007 against the economic...
TRANSCRIPT

Recycling Economic Information Study Update: Delaware, Maine, Massachusetts, New York, and Pennsylvania FINAL REPORT February, 2009 Prepared for: Prepared by:
and M i d A t l a n t i c S o l i d W a s t e C O N S U L T A N T S
Northeast Recycling Council, Inc. February 2009 ©

This page is intentionally left blank.

Northeast Recycling Council, Inc. Recycling Economic Information Study Update
Final Report to Northeast Recycling Council, Inc. Recycling Economic Information Study Update NERC February 2009 ©
TABLE OF CONTENTS
EXECUTIVE SUMMARY . . . . . . . . . . . . . . . . . . . . . . . . . . . . . . . . . . .ES-1 Overview …….…………………………………………..………………………………..ES-1
Summary of Direct Economic Impacts…………………..…………………..…………ES-3 Establishments…………..……………………………………………………..…………ES-4 Employment………………………………………………………………………………. ES-5 Payroll……………………………………………………………………………………... ES-6 Gross Receipts…………………………………………………………………………… ES-7 Indirect and Induced Effects……………………………………………………………. ES-8
PART I. Background and Methodology ………………………………. 1
Introduction………………………….………………..…………..………………………. 1 Historical Background…………………………….…………….…………………..…… 2 Modifications to the 2000 Methodology……………………………………………..…. 5 Comparison to the 2000 Report…………………………….………………………..… 7 Research and Survey Methodology………………………………………………….… 8 Survey Method…………………………………………………………………………… 11 Modeling………………………………………………………………………………...… 12 Supporting Data and Base Year…………………………………………………...…… 13 Study Limitations……………………………………………………………………….… 13
The Recycling Industry Sector by Sector……………………………………..…… 15
The Recycling Industries………….………..……………………………………….… 16
Sector 1 - Public Collection.....……………………………………..………..… 16 Sector 2 - Private Collection...………………………………..……...………… 17 Sector 3 - Compost and Misc Organics Producers……………………..…… 18 Sector 4 - Materials Recovery Facilities……………………….……………… 18 Sector 5 - Recyclable Material Wholesalers…….………………….………… 18 Sector 14 - Plastic Reclaimers………………………………….……………… 19
The Recycling Reliant Industries…….. …………..………………………………… 19 Sector 6 - Glass Container Manufacturers…………………………………… 19
Sector 7 - Glass Product Producers…………………………………...……… 20 Sector 8 - Nonferrous Secondary Smelting and Refining Mills…………..… 20 Sector 9 - Nonferrous Product Producers…………………………………..… 21 Sectors 10 and 18 - Nonferrous and Ferrous Foundries………………….… 21 Sectors 11 - Pulp and Paper Mills……………………………………………... 22 Sector 12 - Paper-based Product Manufacturers……………………….…… 22 Sector 13 - Pavement Mix Producers………………………………….……… 23 Sector 15 - Plastic Product Manufacturers……………………………..…… 24 Sector 16 - Rubber Product Manufacturers…………………………...……… 24 Sector 17 - Iron and Steel Mills………………………………………………… 25 Sector 18 - Ferrous Foundries…………………………………………………. 26 Sector 19 - Other Recycling Processors……………………………………… 26

Northeast Recycling Council, Inc. Recycling Economic Information Study Update
Final Report to Northeast Recycling Council, Inc. Recycling Economic Information Study Update NERC February 2009 ©
Reuse and Remanufacturing Industries………………………………………….… 27 Sector 20 - Computer and Electronic Appliance Demanufacturers……...… 27 Sector 21 - Motor Vehicle Parts (used)……………………………..………… 27 Sector 22 - Retail Used Merchandise Sales………………………..………… 28 Sector 23 - Tire Retreaders…………………………………………..………… 28 Sector 24 - Wood Reuse………………………………….………….………… 29 Sector 25 - Materials Exchanges……………………………………………… 29 Sector 26 - Other Reuse…………………………………………………...…… 30 PART II. Results and Comparison …………………………………..… 31 Results by Sector and State……………………………………………………..…… 31 Comparison of Relative Size of Recycling and Recycling Reliant Industry.. 34 Comparison with 2000 Report…………………………………………………...…… 35 Recommendations for Future Studies……………………………………………… 36 PART III. Indirect and Induced Impacts..……………………………… 38 Introduction……………………………………………………………………………… 38 Input/Output Modeling Process and Limitations…………………………….…… 38 Input/Output Multipliers……………………………………………………….… 39 Initial (Direct), Indirect, and Induced Effects…………………………..……… 40 Modeling System………………………………………………………………… 41 Limitations………………………………………………………………...……… 42 Effect on State and Federal Government Tax Revenues…………………… 44 Results……………………………………………………………………………….…… 44 APPENDICES..…………………………………………………………..… A-1 Appendix A - Detailed Reporting Form, All States.………………………….…… A-2 Three-Tiered Approach to Data Presentation..…………………….………… A-2 Appendix B - Sector NAICS Code Assignments and Research Methodology. A-20

Northeast Recycling Council, Inc. Recycling Economic Information Study Update
Final Report to Northeast Recycling Council, Inc. Page ES - 1 Recycling Economic Information Study Update NERC February 2009 ©
EXECUTIVE SUMMARY
Overview Recycling has significant environmental benefits, replacing virgin materials with secondary materials, and thus avoiding the mining, transport, and processing energy inputs and environmental impacts. As the impacts of climate change become increasingly well documented, the environmental benefits of recycling become all that more important to a sustainable materials management policy. Recycling can also have significant economic impacts, replacing materials often mined and manufactured outside of the region with materials collected and processed within the region. For this reason, the Northeast Recycling Council, Inc. (NERC) contracted with DSM Environmental Services, Inc. (DSM) and subcontractor MSW Consultants (MSW), collectively referred to as the Project Team, to research the contribution of recycling and reuse industries to the economy in the states of Delaware, Maine, Massachusetts, New York, and Pennsylvania (the Participant States). This research is intended to provide state officials and NERC with an updated ability to communicate the economic value of the recycling industry in their states as well as compare results for 2007 (Study Update) against findings in the original Recycling Economic Information (REI) report published in 2000 (2000 Report). The 2000 Report was based primarily on Economic Census data from 1992, updated in some cases to 1997. This Study Update is based on 2002 Economic Census data, updated in some cases to 2007. Therefore, this Study Update represents the economic status of the recycling industry ten years after the 2000 Report. The Project Team attempted to follow the methodology developed by NERC and the United States Environmental Protection Agency to define direct economic impacts, analyzing and reporting on the same sectors of the economy, and gathering data on the same economic measurements from recycling and reuse industries in the Participant States sponsoring this research. Data were gathered on total employment, total payroll, and gross receipts for each recycling and reuse industry. There were, however, several significant changes to the methodology used to estimate the direct economic impacts between the 2000 Report and this Study Update designed to more accurately report the economic impacts for 2007. These changes are:
• This Study Update divides the direct economic data into three categories of economic activity instead of two. The first category includes all activities associated with the collection and processing of recyclables to make them available for use in a new industrial process. These industries were labeled “supply side” activities in the 2000 Report and are now explicitly labeled the “recycling industry.” This Study Update reports economic data for the recycling industry separate from economic data for the industries that purchase secondary materials from the recycling industry. These industries were labeled “demand side” activities in the 2000 Report and were reported as the “recycling industry” in the 2000 Report. These demand side industries are now separately reported as “recycling reliant” industries for the Study Update to reflect the fact that, for example,

Northeast Recycling Council, Inc. Recycling Economic Information Study Update
Final Report to Northeast Recycling Council, Inc. Page ES - 2 Recycling Economic Information Study Update NERC February 2009 ©
a paper mill would commonly be thought of as part of the paper industry, which relies on a mix of recycled and virgin materials. The third category remains the same as in the 2000 Report, and includes all reuse and remanufacturing industries.
• Most industries can use virgin material, recycled material, or a mix of virgin and recycled
materials. It is unreasonable to assume, for example that all employees (and all revenues) from a pulp mill that purchases recycled fiber and pulp wood are related to recycling, ignoring the forest products economy that is also contributing to the input to the pulp mill. For that reason it was decided for this Study Update to allocate recycling economic activity to that portion of the mill that uses recycled materials. For example, if a pulp mill uses an estimated average of 25 percent recycled fiber, then 25 percent of employment, payroll, and gross receipts is allocated to recycling.
This Study Update also reports on the indirect and induced economic impacts of the recycling industry on a sector-by-sector basis. However, unlike the 2000 Report, the indirect and induced effects are not added to the direct economic impacts to calculate the total impact of the recycling, recycling reliant, and reuse and remanufacturing industries. That is because the Project Team believes that this is not an appropriate use of an Input/Output analysis in that it results in significant double counting when all of the industries are summed. Instead, the indirect and induced impacts are reported for each sector for use by the Participant States to estimate the impact of a change in economic activity in any one of the sectors reported on in this Study Update. As stated above, one of the goals of the Study Update was to compare the economic impact of recycling in 2007 against the economic impact of recycling in 1997. However, during development of the Study Update it became clear that it is difficult to compare the two studies for the following two reasons:
• The U.S. Census Bureau changed industry classifications in 1997, making it difficult to compare time series data between 1992 (the economic census data used in the 2000 Report) and 2002 (the economic census data used in this Study Update).
• There have been significant changes in the methodology between the 2000 Report and
this Study Update. While these changes in methodology are designed to more accurately estimate the economic contribution of the recycling industry to the five Participant States, in most cases these changes reduce the estimated economic impact when compared to the 2000 Report.
Northeast Recycling Council, Inc. Recycling Economic Information Study Update
Final Report to Northeast Recycling Council, Inc. Page ES - 3 Recycling Economic Information Study Update NERC February 2009 ©
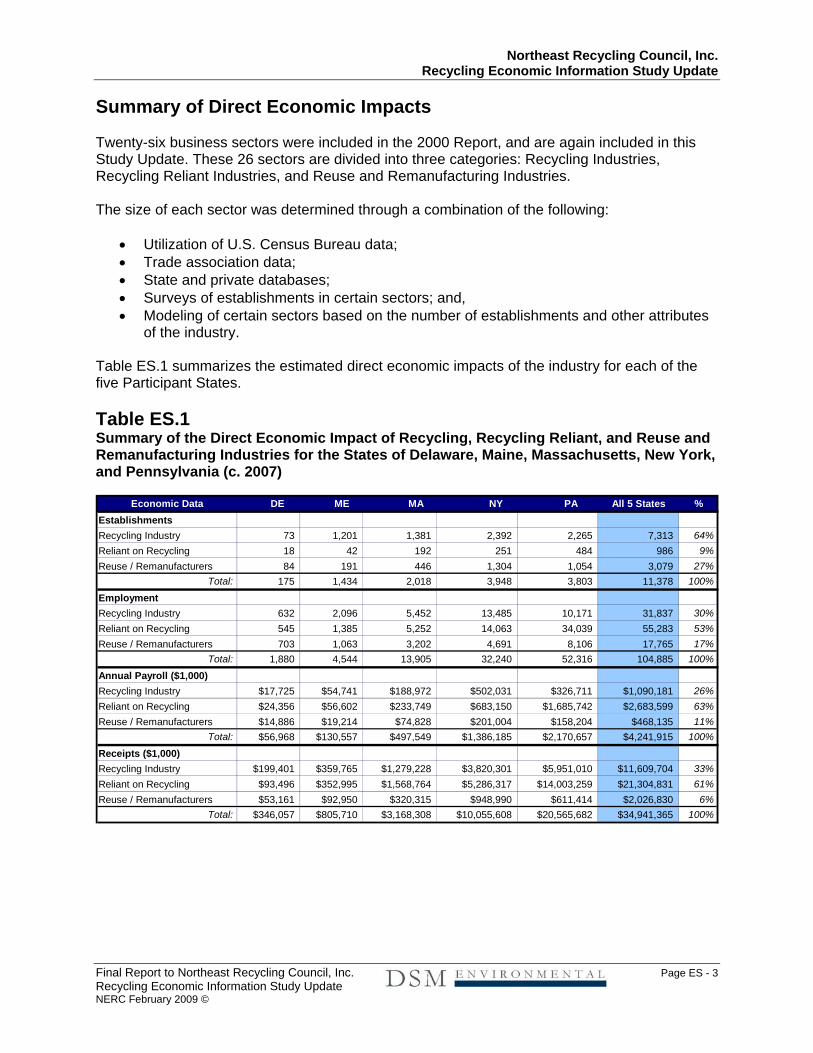
Summary of Direct Economic Impacts Twenty-six business sectors were included in the 2000 Report, and are again included in this Study Update. These 26 sectors are divided into three categories: Recycling Industries, Recycling Reliant Industries, and Reuse and Remanufacturing Industries. The size of each sector was determined through a combination of the following:
• Utilization of U.S. Census Bureau data; • Trade association data; • State and private databases; • Surveys of establishments in certain sectors; and, • Modeling of certain sectors based on the number of establishments and other attributes
of the industry. Table ES.1 summarizes the estimated direct economic impacts of the industry for each of the five Participant States. Table ES.1 Summary of the Direct Economic Impact of Recycling, Recycling Reliant, and Reuse and Remanufacturing Industries for the States of Delaware, Maine, Massachusetts, New York, and Pennsylvania (c. 2007)
Economic Data DE ME MA NY PA All 5 States %EstablishmentsRecycling Industry 73 1,201 1,381 2,392 2,265 7,313 64%Reliant on Recycling 18 42 192 251 484 986 9%Reuse / Remanufacturers 84 191 446 1,304 1,054 3,079 27%
Total: 175 1,434 2,018 3,948 3,803 11,378 100%
EmploymentRecycling Industry 632 2,096 5,452 13,485 10,171 31,837 30%Reliant on Recycling 545 1,385 5,252 14,063 34,039 55,283 53%Reuse / Remanufacturers 703 1,063 3,202 4,691 8,106 17,765 17%
Total: 1,880 4,544 13,905 32,240 52,316 104,885 100%
Annual Payroll ($1,000)Recycling Industry $17,725 $54,741 $188,972 $502,031 $326,711 $1,090,181 26%Reliant on Recycling $24,356 $56,602 $233,749 $683,150 $1,685,742 $2,683,599 63%Reuse / Remanufacturers $14,886 $19,214 $74,828 $201,004 $158,204 $468,135 11%
Total: $56,968 $130,557 $497,549 $1,386,185 $2,170,657 $4,241,915 100%
Receipts ($1,000)Recycling Industry $199,401 $359,765 $1,279,228 $3,820,301 $5,951,010 $11,609,704 33%Reliant on Recycling $93,496 $352,995 $1,568,764 $5,286,317 $14,003,259 $21,304,831 61%Reuse / Remanufacturers $53,161 $92,950 $320,315 $948,990 $611,414 $2,026,830 6%
Total: $346,057 $805,710 $3,168,308 $10,055,608 $20,565,682 $34,941,365 100%

Northeast Recycling Council, Inc. Recycling Economic Information Study Update
Final Report to Northeast Recycling Council, Inc. Page ES - 4 Recycling Economic Information Study Update NERC February 2009 ©
Establishments A total of 11,378 establishments are involved in recycling, or the use of recycled materials, in the five Participant States. As Figure ES.1, below, illustrates, 64 percent (7,313 establishments) of the total establishment are in the recycling industries, with another 27 percent in reuse and remanufacturing. Only 9 percent of establishments are recycling reliant industries. This is consistent with the pyramid that one would expect, with many smaller collection, processing, and wholesaling operations feeding a few larger recycling reliant industries.
Figure ES.1
Total EstablishmentsIn All Five Participant States
Recycling Industry(Supply side)
64%
Reuse / Remanufacturers
27%
Recycling Reliant(Demand side)
9%
3,079
9867,313

Northeast Recycling Council, Inc. Recycling Economic Information Study Update
Final Report to Northeast Recycling Council, Inc. Page ES - 5 Recycling Economic Information Study Update NERC February 2009 ©
Employment The 11,378 establishments employed an estimated 104,885 people in the five Participant States (Figure ES.2). Interestingly, employment does not track establishments, with only 30 percent of total jobs in the recycling industries (31,837 jobs), 53 percent of jobs in the recycling reliant industries (55,283 jobs), and 17 percent (17,765 jobs) in reuse and remanufacturing. This is primarily because of the small number of full time equivalent employees working at the large number of small composting, drop-off, and bottle bill redemption facilities. Figure ES.2
Total Employment In The Five Participant States
Recycling Industry(Supply side)
30%
Recycling Reliant(Demand side)
53%
Reuse / Remanufacturers
17%
17,765
31,837
55,283

Northeast Recycling Council, Inc. Recycling Economic Information Study Update
Final Report to Northeast Recycling Council, Inc. Page ES - 6 Recycling Economic Information Study Update NERC February 2009 ©
Payroll The 104,885 jobs provided $4.2 billion dollars in annual payroll, with payroll roughly paralleling the employment distribution among recycling industries, recycling reliant industries, and the reuse and remanufacturing industries. (Employee pay was slightly higher in recycling reliant industries reflecting higher pay manufacturing jobs.)
Figure ES.3 Total Annual Payroll ($1,000) In The Five Participant States
Recycling Reliant(Demand side)
63%
Recycling Industry(Supply side)
26%
Reuse / Remanufacturers
11%
$486,135
$1,090,181
$2,683,599

Northeast Recycling Council, Inc. Recycling Economic Information Study Update
Final Report to Northeast Recycling Council, Inc. Page ES - 7 Recycling Economic Information Study Update NERC February 2009 ©
Gross Receipts A total of $35 billion (rounded) in gross receipts was generated by the recycling, recycling reliant, and reuse and remanufacturing industries. Thirty-three percent of gross receipts are generated by the recycling industries, with 61 percent generated by the recycling reliant industries. Only six percent of gross receipts are generated by the reuse and remanufacturing industries, which tend to deal in lower value materials, but may have significant environmental benefits.
Figure ES.4
Gross Receipts in the Five Participant States
Recycling Reliant(Demand side)
61%
Recycling Industry(Supply side)
33%
Reuse / Remanufacturers 6%
$2,0
26,8
30
$21,304,831
$11,609,704

Northeast Recycling Council, Inc. Recycling Economic Information Study Update
Final Report to Northeast Recycling Council, Inc. Page ES - 8 Recycling Economic Information Study Update NERC February 2009 ©
Indirect and Induced Effects As stated above, this Study Update reports indirect and induced effects for each of the 26 sectors. These indirect and induced effects were estimated using the IMPLAN model. As described in the 2000 Report: “Indirect Effects measure the value of additional economic demands that the direct economic activity places on the supplying industries in the region. When firms produce goods or conduct business, they must make many purchases. Some of these are from suppliers in the area. Some are not. Public utilities, communications systems, fuel, wholesale goods and services, manufactured goods, financial and legal services, raw and processed commodities and a variety of professional services are necessary to produce the gross receipts estimated from the direct economic impacts.” “Induced effects accrue when workers in the direct and indirect industries spend their earnings on goods and services in the region. Induced effects can also be called household effects, and the terms are often used interchangeably. When workers in the direct and indirect industries purchase goods and services for household consumption, they, in turn, stimulate another layer of the economy. Most induced activity accrues to retail, services and finance, insurance and housing spending. Because employment is stimulated in these industries as well, their demands for inputs increase, yielding an additional round of indirect purchases and additional rounds of induced activity. The I/O models solve for these iterative rounds of transactions until all of the possible inter-industrial transactions have been accumulated.” The correct use of the Input/Output analysis is for estimating the total economic impact of a change in a single firm, or industrial sector. Thus, totals for multiple sectors, and the sum of all indirect and induced effects are not reported in this Study Update.

Northeast Recycling Council, Inc. Recycling Economic Information Study Update
Final Report to Northeast Recycling Council, Inc. Page 1 Recycling Economic Information Study Update NERC February 2009 ©
PART I. Background and Methodology
Introduction Recycling has significant environmental benefits, replacing virgin materials with secondary materials, and thus avoiding the mining, transport, and processing energy inputs and environmental impacts. As the impacts of climate change become increasingly well documented, the environmental benefits of recycling and reuse become all that more important to a sustainable materials management policy. What is less well known is that recycling can also have significant economic impacts, replacing materials often mined and manufactured outside of the region with materials collected and processed within the region. For this reason, the Northeast Recycling Council, Inc. (NERC), contracted with DSM Environmental Services, Inc. (DSM) and subcontractor MSW Consultants (MSW), collectively referred to as the Project Team, to research the contribution of recycling and reuse industries to the economy in the states of Delaware, Maine, Massachusetts, New York, and Pennsylvania (the Participant States). This research is intended to provide state officials and NERC with an updated ability to communicate the economic value of the recycling industry in their states as well as compare results for 2007 against findings in the original Recycling Economic Information (REI) report published in 2000 (2000 Report). This Final Report presents both the direct economic impacts, as well as a discussion of indirect and induced impacts, which are estimated based on the direct impacts. The Project Team followed the methodology developed by NERC and the United States Environmental Protection Agency (U.S. EPA)1 to define direct economic impacts, analyzing and reporting on the same sectors of the economy, and gathering data on the same economic measurements from recycling and reuse industries in the five NERC member states sponsoring this research. Data were gathered on total employment, total payroll, and gross receipts for each recycling and reuse industry. Employment included all employees (jobs) in the recycling and reuse industries (allocated for use of recycled versus virgin materials as described in detail below), from the factory worker to the administrator, and is reported as full time equivalent jobs. Payroll represents total taxable wages for each employee counted. Gross receipts represent total sales revenue for each recycling and reuse industry. The economic activities included in the recycling and reuse industries were specifically defined by the U.S. EPA and NERC prior to the 2000 Report, and were broadly grouped as follows:
• Collection, processing, and wholesaling of recyclable materials including paper, metals, glass, plastics, textiles, and electronics;
• Processing/composting and sale of organic materials including leaf and yard waste,
brush and tree trunks, food waste, and biosolids;
1 In 1997, the U.S. EPA sponsored a study administered by NERC to develop methodology and estimate costs for gathering economic information on the recycling and reuse industries.

Northeast Recycling Council, Inc. Recycling Economic Information Study Update
Final Report to Northeast Recycling Council, Inc. Page 2 Recycling Economic Information Study Update NERC February 2009 ©
• Reclamation of processed materials to prepare them for end use (e.g. granulating plastics, cleaning up cullet);
• Manufacturing first stage products from recycled scrap including, but not limited to paper
rolls, metal ingots, billet or rods, metal castings, plastic lumber, sheet or shapes, and glass containers2;
• Wholesale reuse businesses, such as materials exchange services and used motor
vehicle parts sales; and, • Retail reuse businesses, such as used clothing, electronics, furniture, wood, and building
supply stores.
Detailed descriptions of each sector within these broad categories are provided in this report, after a description of the study methodology. Historical Background Significant discussion among recycling industry stakeholders in the 1990’s led to the definition of the “recycling industry” used in this report. This began with the 1994 report, Value Added to Recyclable Materials in the Northeast (Roy F. Weston) prepared under contract to the U.S. Department of Commerce, Economic Development Administration.3 The discussion of what industries to include, and at what level, continued with the NERC report to the U.S. EPA, Recommendations for Conducting a Study of the U.S. Recycling and Reuse Industries (1997), and finally concluded with the NERC study prepared by R.W. Beck and published in 2000 (2000 Report). The 2000 Report covered six NERC member states4, and was Phase 1 of a two-phase project, that culminated in the U.S. Recycling Economic Information Study (published in July 2001) that made estimates for the nation as a whole. The final recycling industry definition in the 2000 Report included:
• All “supply side” activities that resulted in collecting, recovering, and preparing materials for recycling or products for resale; and,
• All “demand side” activities up to the first point at which the recovered material or
product for reuse competes against the primary or virgin equivalent materials.
In other words, measurement of recycling economic activity was to stop at the primary manufacturing stage, or the last point before fabrication. This excluded any value added after first product manufacturing. In the case of paper, this was at the paper mill, where a roll of paper was manufactured with pulp made in whole or part from recycled paper. While it included molded paper products, such as egg cartons, it excluded any conversion activities, such as envelopes or container making. In the case of ferrous or nonferrous operations, this included the steps after smelting and refining 2 “First stage” refers to the first product produced from recycled materials, such as a roll or paper, sheet of plastic, glass bottle, or metal billet. 3 U.S. Department of Commerce. Project Number: 99-06-07358. 4 Delaware, Massachusetts, New Jersey, New York, Pennsylvania, and Vermont.

Northeast Recycling Council, Inc. Recycling Economic Information Study Update
Final Report to Northeast Recycling Council, Inc. Page 3 Recycling Economic Information Study Update NERC February 2009 ©
to produce primary forms of the product. In addition, the definition of recycling activities was to exclude:
• Activities involving incineration or use of recovered materials as fuel; and, • Activities of non-business entities involved in education, advocacy, or other activities that
do not directly support or add value to the recovered materials or used products.
Table 1 below, reproduces Table 2.1 Business Category Definitions that was included in the 2000 Report. These same business categories (referred to as “sectors” in this report) are included in this 2007 Study Update. Table 1 Sector Definitions
Sector Definition
RECYCLING AND RECYCLING RELIANT INDUSTRIES: Categories 1 - 19
1. Municipal Residential Curbside and Drop-Off Collection
Recyclables collection from curbside and drop-off collection programs using government employees
2. Private Residential and Commercial Collection
Private sector collection of recyclables, including contract collection on behalf of municipalities, cardboard and mixed paper collection from businesses, and collection of beverage containers under the separate bottle redemption handling systems in Maine, Massachusetts, and New York.
3. Compost and Miscellaneous Organics Producers
Establishments that produce compost, mulch, bark, or bedding from yard and wood waste, biosolids, or other organics
4. Materials Recovery Facilities (MRFs) Establishments that process commingled or recovered materials, usually from curbside/drop-off collection or recyclables separated from solid waste
5. Recyclable Material Wholesalers
Paper stock dealers, scrap metal processors, and other establishments that sort, remove contaminants, and densify recovered materials including wholesalers of recovered electronics, textiles, and plastics
6. Glass Container Manufacturing Plants Establishments that produce finished glass containers
7. Glass Product Producers (other recycled uses)
Establishments that produce glass products other than containers, such as fiberglass, abrasives, or other products
8. Nonferrous Secondary Smelting and Refining Mills Recycling and alloying of nonferrous metals into primary shapes including billets, ingots, and other basic shapes
9. Nonferrous Product Producers The production of nonferrous primary products through extrusion, rolling, or drawing processes
10. Nonferrous Foundries Produce castings from nonferrous metals
11. Paper and Paperboard Mills/Deinked Market Pulp Producers
Produce paper and paperboard products from recovered paper or market pulp and/or deink recovered paper and sell pulp

Northeast Recycling Council, Inc. Recycling Economic Information Study Update
Final Report to Northeast Recycling Council, Inc. Page 4 Recycling Economic Information Study Update NERC February 2009 ©
12. Paper-Based Product Manufacturers Produce cellulose-based products from recovered paper or paperboard (e.g., cellulose insulation, hydro-seeding, molded fiber trays)
13. Pavement Mix Producers (asphalt and aggregate)
The production of asphalt paving mix from Recycled Asphalt Pavement (RAP)
14. Plastics Reclaimers Transform recovered plastics into raw materials (recycled feedstock) such as flake or pellet ready for remanufacture
15. Plastics Product Manufacturers Transform recovered plastics directly into products (e.g., plastic lumber) or convert a recycled plastic flake or pellet into an intermediate or end product
16. Rubber Product Manufacturers Manufacture products using crumb rubber or cut rubber shapes and stampings as feedstock
17. Steel Mills
Produce iron and steel slabs, billets, bar, plate, and sheet from scrap and/or raw materials including upstream preparation and downstream stamping and cutting
18. Iron and Steel Foundries Produce cast iron or steel products
19. Other Recycling Processors/Manufacturers Processors and manufacturers not elsewhere classified, using ash, sludge, engineering application of tires, or other recyclable materials
REUSE AND REMANUFACTURING INDUSTRY: Categories 20 – 26
20. Computer and Electronic Appliance Demanufacturers
Sort, grade, dismantle, and/or rebuild used electronic appliances
21. Motor Vehicle Parts (used) Clean, sort, inspect, remanufacture, wholesale, and retail used automobile parts
22. Retail Used Merchandise Sales Retail thrift stores, antique shops, reuse centers, and other shops dedicated to selling used merchandise, including building materials
23. Tire Retreaders Remove old tread from worn tires and add new tread
24. Wood Reuse Process used wood for reuse (e.g., pallet rebuilders, construction materials)
25. Materials Exchange Services Facilitate the reuse of products and materials by commercial and industrial establishments
26. Other Reuse Other reuse or remanufacturing, not elsewhere classified
It should be noted that the 1994 Roy F. Weston report methodology was modified significantly in the 2000 Report. Two important differences between the 1994 Report and the 2000 Report include:
• The 1994 Report estimated the value added associated with using recyclables instead of virgin materials, while the 2000 Report used gross receipts. Using gross receipts double counts economic activity because it ignores the purchase cost of the recycled material, which represents the gross receipts of the supply side activity providing the scrap material. For this reason, one cannot compare total recycling economic activity as a

Northeast Recycling Council, Inc. Recycling Economic Information Study Update
Final Report to Northeast Recycling Council, Inc. Page 5 Recycling Economic Information Study Update NERC February 2009 ©
percent of Gross Domestic Product (GDP) for a Participant State, because GDP is based on value added calculations.
• The 1994 report estimated economic activity for demand side activities based on the
tons of scrap used per employee – in essence allocating employment and receipts based on the percent of scrap consumed. The 2000 Report assumed that most economic activity at a plant that used recycled material as an input could be allocated to recycling.
Subsequent to publication of the 2000 Report there were criticisms of the report published in influential trade magazines questioning the scope of the activities included, and the methodology for counting total economic activity. The Project Team has attempted to include the same list of business categories included in the 2000 Report, but has modified the scope of the activity counted within some of those business categories to attempt to address the criticisms of the 2000 methodology. These modifications are described below. MODIFICATIONS TO THE 2000 METHODOLOGY Two significant modifications to the 2000 Methodology were proposed by the Project Team and reviewed with the Participant States during the initial project kickoff meeting, and have been followed in this report. The third revision to the methodology occurred during the analysis of the economic data. Each is discussed below.
1) Division of Economic Data Between Recycling Activities and Industries that Rely on Recycled Materials (Recycling Reliant Industries)
This report explicitly divides the direct economic data into three categories of economic activity (see Table 4, below, for a detailed list by category). The first category includes all activities associated with the collection and processing of recyclables to make them available for use in a new industrial process. These industries were labeled “supply side” activities in the 2000 Report and are now explicitly labeled the “recycling industry.” The recycling industry is separated in this report from industries that purchase secondary materials from the recycling industry. These industries were labeled “demand side” activities in the 2000 Report and are now labeled as “recycling reliant” industries. That is because a paper mill is first and foremost part of the paper industry and a glass factory is part of the glass industry. Both paper and glass can be produced without using secondary materials, but often use a mix of secondary materials purchased from the recycling industry, as well as virgin materials. The third category remains the same as in the 2000 Report and includes all reuse and remanufacturing industries. The reason for this division is to allow the Participant States to quantify the “recycling industry” – those activities that collect and broker recyclables, sort into compatible materials and sort out contaminants, and process the sorted material to the point where they can be used in a manufacturing activity; and then to quantify the size of the industry which relies on these recycled materials as input into the production process.
2) Allocation of Employment, Payroll, and Revenues within the Industries Which Rely on Recyclables
Most industries can use virgin material, recycled material, or a mix of virgin and recycled materials. It is unreasonable to assume, for example that all employees (and all revenues) from

Northeast Recycling Council, Inc. Recycling Economic Information Study Update
Final Report to Northeast Recycling Council, Inc. Page 6 Recycling Economic Information Study Update NERC February 2009 ©
a pulp mill that purchases recycled fiber and pulp wood are related to recycling, ignoring the forest products economy that is also contributing to the input to the pulp mill. As stated above, one of the criticisms of the 2000 Report was that the estimated direct economic impact did not explicitly account for this issue. For that reason it was decided for this Study Update, to allocate recycling economic activity to that portion of the mill that uses recycled materials. For example, if a pulp mill uses an estimated average of 25 percent recycled fiber, then 25 percent of employment, payroll, and gross receipts is allocated to recycling. While it is understood that the relationship between use of recycled material and employment and revenue is not a direct link, it is a reasonable assumption given the level of data available to conduct this analysis. It should be noted that this change in allocation resulted in declines in reported economic activity associated with recycling over that reported in the 2000 Report. As such, it is difficult to directly compare the results of the current study with those of the 2000 Report. 3) Iron and Steel The iron and steel industry is different from industries that manufacture paper, plastic, and glass in that many modern steel mills cannot produce iron and steel without scrap.5 This was noted in the 2000 Report, which as a consequence counted all economic activity associated with iron and steel production, including making steel and shapes and forming tube and pipe. This report continues to count downstream activities as recycling related, but modifies the 2000 methodology to allocate employment, payroll, and gross receipts based on the underlying types of furnaces operating in each state and the national average scrap consumption by furnace type. According to research performed by the Steel Recycling Institute (SRI), electric arc furnaces run on a very high charge of scrap (83 percent scrap on average in 2006), while basic oxygen furnaces run on a much lower charge of scrap (averaging 29 percent in 2006). The Project Team relied on the SRI to provide data on the mix of electric arc and basic oxygen furnaces operating in each state in 2007 and then allocated employment, payroll, and gross revenues based on the throughput of each and the agreed upon percentage. While in theory, this change in methodology should have significantly reduced recycling economic impact for the iron and steel industry in Pennsylvania, which has a significant amount of basic oxygen capacity, the significant increase in the value of steel in recent years coupled with increased economic activity in this sector results in similar economic values for Pennsylvania. These results demonstrate that even though only 47 percent of total economic activity is allocated to recycling (based on the mix of electric arc and basic oxygen furnaces operating in Pennsylvania), scrap metal recycling plays a very important economic role in Pennsylvania.
5 This is primarily the case for steel mills using electric arc furnaces.

Northeast Recycling Council, Inc. Recycling Economic Information Study Update
Final Report to Northeast Recycling Council, Inc. Page 7 Recycling Economic Information Study Update NERC February 2009 ©
COMPARISON WITH THE 2000 REPORT The Request for Proposals for this Recycling Economic Information Study Update states: “The third goal is to compare the results of this new study with the REI Study. Therefore
the participant states expect the new report to be presented in a form that makes it readily comparable to the REI Study.”
Unfortunately, despite this goal there are three primary issues that make a direct comparison difficult. First, as discussed above, changes have been made to the methodology, especially with respect to the economic analysis of the recycling reliant, or demand side, industries. These changes make a direct comparison between the 2000 Report and this Study Update difficult for those demand side industries most affected by the change in methodology – especially paper, plastic, and steel. Second, according to the U.S. Census Bureau: “The implementation of NAICS in 1997 caused major disruptions in the availability of comparable information across time periods. In recent history, the SIC system was updated three times (in 1967, 1972, and 1987) and each time a significant number of new industries was introduced in the existing framework. What was different for 1997 was that the whole framework was changed. While data from nearly half of the SICs in use in 1992 can (be) derived from the 1997 NAICS industries, a substantial number of SIC industries cannot be much more than approximated under NAICS….NAICS time series can go forward from 1997, but they cannot generally go backward to earlier years, because many NAICS categories require information that was not collected in 1992 and earlier censuses.” A close reading of the 2000 Report indicates that the majority of the census data used was SIC data (not NAICS data) meaning that it was either from the 1992 census, or updated to the most recent year available which would have been 1995 or 1996 (depending on the census data) because, just as in 2008 (when the 2007 census data are not available requiring use of 2002 data, updated in some cases to 2005 or 2006), the 1997 census data had not been published at the time the 2000 Report was being undertaken.6 Third, there were literally hundreds of manipulations of data necessary to estimate the economic information contained in the 2000 Report. While the Project Team has attempted to follow a similar methodology, there are many cases where data that were not available for the 2000 Report are now available (in part because of the change in the NAICS categories), but other data are not available requiring new manipulations. These manipulations of data for both studies introduce a lot of “noise,” for a lack of a better term, to the data which makes direct comparisons very difficult. For all of these reasons the reader is cautioned that this report can not readily address the third goal of the Participant States. While it is hoped that the NAICS industrial categorizations will remain in place going forward, it is better to view this report as a stand alone document that
6 Note that for sectors where economic census data were not used, or could be updated by use of industry data, the data year was 2007, just as it was 1997 in some cases by R.W. Beck.

Northeast Recycling Council, Inc. Recycling Economic Information Study Update
Final Report to Northeast Recycling Council, Inc. Page 8 Recycling Economic Information Study Update NERC February 2009 ©
provides a rough approximation of the size of the supply and demand side industries providing and relying on recyclables in each Participant State. An attempt has been made in the sector-by-sector description and at the end of this report to provide general information on the change in the industry since the 2000 Report, but this general information is not necessarily informed by a comparison of economic data from the two reports. Research and Survey Methodology The Project Team attempted to compile, and accurately classify, recycling activity in each sector and in each Participant State, including or counting only known recycling industries, as defined in the original REI methodology report (1997). Our data development and survey approach included the following steps. First, the Project Team sought to develop comprehensive databases of recycling businesses, by sector, in each state. The Project Team collected and merged contact lists from a myriad of sources, including state recycling market listings and databases, trade organization member lists, state economic development office business listings by NAICS code, and published and purchased directories. The Project Team then carefully reviewed the listings for duplication, and performed limited research to correctly code each listing, with the goal of creating a single database of recycling businesses for each state coded by sector. This was critical since often material brokers are listed as an end user with an address in one state but may represent or supply an end user in a different state. Second, the Project Team reviewed and compiled available government economic and throughput data on each sector. The types of government economic data used for the study included:
• The United States Economic Census is conducted every five years in the years ending with ‘2 and ‘7, with the most recent data available from 2002. The U.S. Census Bureau mails the majority of larger employers a survey, concentrating particularly on manufacturers, and a sample of establishments are surveyed in the construction and retail sectors. Compliance is mandatory, and response rates are reported to be over 80%. However some data are not published due to a small sample size and/or federal disclosure laws. In smaller states, such as Delaware and Maine, this makes the economic census harder to use. Readers of the report tables will see a “D” for certain sectors where the Project Team has compiled data but is not reporting it in that sector (it is accounted for in the totals) because the data represent one or two firms and disclosure of the data would reveal economic data specific to a firm.
• County Business Patterns (CBP) is a supplemental set of economic data on
employment and wages. Essentially additional payroll data is collected through other sources and reported on what is known as “multi-unit companies” (those with more than one location). These data are matched to the data in the Business Registry by use of Employer Identification Numbers (EINs) and other identifying information to update the Business Registry (formerly called the Standard Statistical Establishment List). The most recent year of CBP data is 2006 with both 2005 and 2006 data used in this report.

Northeast Recycling Council, Inc. Recycling Economic Information Study Update
Final Report to Northeast Recycling Council, Inc. Page 9 Recycling Economic Information Study Update NERC February 2009 ©
• The Annual Survey of Manufacturers (ASM) is an annual survey undertaken by the
U.S. Census Bureau of a subset of manufacturers. A weighting factor is applied to determine how large a sample, and from which NAICS code, surveys should be conducted each year. As in the case of the economic census, businesses are mandated by law to complete the survey form. Data are reported in less detail than the Economic Census, with many 4, 5, and 6 digit NAICS codes and some state level data omitted. Therefore, while data from some industries, such as iron and steel mills, glass container manufacturing, foundries (ferrous and nonferrous are grouped together), and pulp, paper and paperboard mills are available for 2006, some are not available at the state level for this study because they are either too small or the data are not disclosed due to the small number of establishments in that state.
• The Bureau of Labor Statistics (BLS) provides quarterly and annual employment
statistics by state and occupation, which can be used to supplement suppressed data from the economic census and/or to research average wages in a state or occupation. For example, BLS data are available on refuse and recyclable materials collection workers.
• Product Line Information is also compiled by the U.S. Census Bureau by product type
and can be reviewed for recycling industries to help identify in which sector to place these recycling industries.
• The United States Geological Survey Metals Yearbook provides an annual review of
the mineral and material industries of the United States and foreign countries, and contains statistical data on materials and minerals including economic and technical trends and development. While some data are available at the state level, national data for nonferrous scrap recovery were used for this study.
Third, the Project Team contacted all active trade organizations representing recycling industries in the United States. A list of contacts made to trade organizations and to other government experts (including the different sections of the Census Bureau) and that provided input to this study are shown in Table 2.

Northeast Recycling Council, Inc. Recycling Economic Information Study Update
Final Report to Northeast Recycling Council, Inc. Page 10 Recycling Economic Information Study Update NERC February 2009 ©
Table 2 Government, Industry, and Organization Resources to Project Team

Northeast Recycling Council, Inc. Recycling Economic Information Study Update
Final Report to Northeast Recycling Council, Inc. Page 11 Recycling Economic Information Study Update NERC February 2009 ©
Fourth, for sectors where existing data were unavailable or insufficient, the Project Team surveyed establishments on a state-by-state basis based on the lists compiled from the sources described above. The survey data were used to either define economic activity for that sector, or to provide partial data to complement existing economic census information where data were suppressed on a statewide basis. A discussion of the sectors surveyed and the survey method follows. Finally, the Project Team gathered critical data to model economic activity to estimate the size of the public and private recycling collection industries in each state. The approach is described below. SURVEY METHOD The survey instrument was designed based on the original NERC REI Study survey (2000 Report). Using advances in desktop application software, the Project Team also generated an electronic, interactive survey form which could be emailed to targeted establishments and returned electronically. The survey form could be viewed and downloaded from a web page, or printed and faxed if the respondent preferred. The web page also contained information about the project and an introductory letter from NERC. The Project Team conducted surveys in the sectors shown in Table 3 below. Table 3 Sectors Surveyed by Project Team
Sector Name
1 • Drop-off Recycling (all states) • Curbside (Pennsylvania)
3 Organics Recycling 6 Glass Container Manufacturers 7 Glass Product Manufacturers 12 Paper-based Product Manufacturers 13 Pavement Mix Producers (asphalt and aggregate) (1) 14 Plastic Reclaimers 15 Plastic Product Manufacturers 16 Rubber Product Manufacturers 19 Other Recycling Processors/Manufacturers 20 Computer and Electronic Appliance Demanufacturers 24 Wood Reuse 25 Materials Exchange Services 26 Other Reuse
(1) In all states but Delaware, industry data were used to update census data. In Delaware, survey data were used. In each sector, the Project Team developed a comprehensive database of establishments. The database was populated state-by-state using a number of sources including industry trade association membership lists, recycling organization lists, state recycling market lists, published lists, and internet research. Establishments were coded by sector and targeted for contact, as well as recoded during the survey process if necessary.

Northeast Recycling Council, Inc. Recycling Economic Information Study Update
Final Report to Northeast Recycling Council, Inc. Page 12 Recycling Economic Information Study Update NERC February 2009 ©
The Project Team attempted to reach each listed establishment in the surveyed categories by telephone first. Establishments were ultimately contacted and surveyed via a combination of mail, email, and telephone calls. Mail and email contacts were mailed or emailed a survey form along with an introductory letter. If a response was not received within a designated time period, Project Team surveyors attempted to follow up by telephone. The Project Team attempted to contact all listed establishments in each sector unless collected survey responses for that sector reached a point where meaningful extrapolations could be made for the rest of the establishments.7 Overall, 760 establishments were contacted of the 2,257 identified for contact. A total of 320 surveys were completed, or 14 percent of those targeted for the survey. In some sectors for some states, where there was a small sample size for that sector, all establishments in the sector were successfully surveyed and the data aggregated for complete reporting. In the majority of cases, however, sector-wide data were estimated on a state-by-state basis by applying average data from surveyed establishments across the five participant states. On average, 34 percent of those confirmed establishments in each sector were surveyed. Where survey response rates were low in a sector, industry sources and other data were sought to confirm or supplement data. It should be noted that surveying business sectors to estimate economic activity is a weak link in this report. In many cases it is simply impossible to obtain sufficient participation from individual establishments concerning their economic activity to accurately estimate economic activity for that sector. Only the U.S. Census Bureau, which has the legal authority to require full reporting, is capable of obtaining sufficient data. As such, should the Participant States desire to continue to update this study going forward, contacts should be made with the U.S. Census Bureau to encourage further disaggregation and reporting of specific industries listed in Table 3. MODELING Two critical areas of recycling economic activity were modeled by the Project Team to estimate the number of employees and gross revenues – Sector 1 (Municipal Residential Curbside and Drop-Off Collection), and Sector 2 (Private Residential and Commercial Collection). In both cases the number of establishments was obtained for each state and employee payrolls estimated based on the economic census data. However, the number of employees and gross revenues were estimated based on modeling and Bureau of Labor Statistics data. To model municipal collection activity, the Project Team collected data on the number of households served and/or the tons of material collected. The Project Team used the tonnage and household count to estimate truck and labor requirements in each state based on detailed cost spreadsheets that the Project Team has developed over the years to provide cost estimates to municipalities associated with adding or expanding curbside collection of recyclables. To model commercial collection activity, the Project Team collected data on tons of material recycled by material type in each state. Collection costs were again modeled based on
7 Because of the difficulty in obtaining enough surveys to develop quality data, in some cases it was necessary to extrapolate from completed surveys based on our best professional judgment and any other data available to the Project Team. In other cases, the Project Team was able to conduct sufficient surveys so that the data started to trend around similar answers, in which case the Project Team would move on to another sector where there were fewer surveys and wider gaps between the survey data.

Northeast Recycling Council, Inc. Recycling Economic Information Study Update
Final Report to Northeast Recycling Council, Inc. Page 13 Recycling Economic Information Study Update NERC February 2009 ©
truck and labor requirements using data that the Project Team has gathered on commercial collection costs. Finally for beverage container redemption activity, included in Sector 2, the Project Team used the handling fees collected in each state as a surrogate for actual costs to manage beverage containers based on the assumption that the handling fee accurately represents beverage container handling costs net of material revenues and escheats. The Project Team is comfortable that the Sector 1 data are relatively accurate because: (1) data on the number of establishments are maintained by the public sector and therefore are relatively readily available; and (2) Project Team members have extensive experience estimating costs for this sector. Modeling of private commercial collection is much more difficult. Modeling is driven by the Project Team’s best estimate of tons of commercial recyclables, as reported to the Project Team by state officials. However, with few exceptions, the states do not compile complete data on commercial recycling activity, and the private sector is not required to report. In addition, pricing of collection is negotiated between myriad private entities and is almost never reported. As such, estimates of private commercial collection should be viewed as rough estimates based on best professional judgment. SUPPORTING DATA AND BASE YEAR For many sectors (as described in the footnotes to the spreadsheets, Part II, below), the Project Team used a combination of approaches to finalize the economic estimates, including census data, county business patterns (CBP) data, economic data from trade organizations, economic data on individual businesses from business databases, tonnage and program information from State agencies, and direct surveying of individual firms to develop total numbers for each sector by state. Work on compiling databases and surveying firms began in January 2008 and was finalized in early July 2008, with the majority of the information gathered from April through June 2008. While the base year for much of the data was calendar year 2007, the most recent census data available was from 2002. Whenever possible, 2002 census data were updated to reflect current conditions. This was especially the case for revenue derived from materials sales, which have increased dramatically since 2002.8 Study Limitations While the Project Team believes that this study accurately portrays the magnitude of the recycling industry in each state, the following limitations must be taken into account when reviewing and using the economic data contained in this report. First, both industry data and industry purchased databases that could be helpful to this study at the national level are often not helpful at the state level because company financial data are not 8 2007 material prices were used for this Study Update. Subsequent to completion of the direct economic impact analysis prices for secondary material have fallen dramatically, illustrating the need to move to a value added reporting format for future updates to this study.

Northeast Recycling Council, Inc. Recycling Economic Information Study Update
Final Report to Northeast Recycling Council, Inc. Page 14 Recycling Economic Information Study Update NERC February 2009 ©
always specific to a location (e.g. state). For some industries, the Project Team had to be more reliant on census data, which is developed on an establishment or single location basis, and on survey data. Second, it was often the case that state and national databases mixed brokers with recycling reliant firms, and it was difficult to separate these two activities unless a telephone survey was successfully completed to properly designate each listing. Third, wherever possible the Project Team relied on economic census data, which was last published for calendar year 2002, and which is now five years old.9 In addition, in a number of cases the economic census data were not reported at the state level because of the limited number of firms in that NAICS code and associated disclosure issues. This made it necessary to use national or regional data and extrapolate to the state level. To compensate for economic disclosure problems and outdated data available from the economic census, the Project Team used industry (trade association) data and estimates whenever available, instead of census data. In some cases, this provided more recent data, and allowed the Project Team to allocate economic data based on the throughput of recycled versus virgin material. Fourth, there are some critical sectors where economic census data and trade association data are not available (e.g. the plastics and glass industry), making it necessary to rely on limited survey data. The results are likely to be less reliable because it is extremely difficult to obtain survey data on sensitive economic information. In most cases it took a significant effort to reach a knowledgeable person by telephone, and many firms were reluctant, or refused to divulge economic data. As a consequence, survey responses were lower than hoped for in some categories, leading to potential underreporting in some cases of recycling activity or potential over reporting when a small sample size included a large establishment. For example, glass product and paper product manufacturers were difficult to identify, or when identified, refused to be surveyed. Therefore extrapolating this data from one business to another had to be done even though businesses are not homogenous in this sector. Fifth, in order to increase the willingness of businesses to report economic data, survey data were gathered in ranges for employment, payroll, and gross receipts. While in some cases the business owner reported actual figures, most surveys produced data from a range. The Project Team used the midpoint of each range from which to compile the data.10 Sixth, the Project Team reported data only from plastic product manufacturers (they were called “plastic converters” in the 2000 Report) known to use recycled resins. This is a significant departure from the 2000 Report which assumed a much wider use of recycled resin use in new plastic products than data available to the Project Team appear to indicate. This significantly lowers the reported economic activity for this sector. Seventh, first stage products are sometimes converted into final stage products (e.g. envelopes, plastic bottles, or metal parts) at the same facility, and isolating the costs of production of the first stage product is difficult if not impossible for some facilities.
9 It is important to note that the 2000 Report relied primarily on 1992 economic census data (in some cases updated to 1996) so the data reported for this Study Update (which relied on the 2002 census with updates to 2006 in some cases) are ten years newer then the data used in the previous report. 10 The midpoint of the range was used in the 2000 Report, and is used here as well. No attempt has been made to conduct statistical analysis of the survey data, instead relying on the midpoint as a reasonable assumption.

Northeast Recycling Council, Inc. Recycling Economic Information Study Update
Final Report to Northeast Recycling Council, Inc. Page 15 Recycling Economic Information Study Update NERC February 2009 ©
Finally, there is no question that tonnage data are double, triple, or quadruple counted in this report, as they were in the 2000 Report. Given that this is an economic study, it may be that eliminating the reporting of tonnage data should be considered because there is no way for the various industries to avoid double counting of tonnage as it moves up the supply chain. THE RECYCLING INDUSTRY SECTOR BY SECTOR Table 4 lists the 26 sectors for which economic information were collected for this report. Table 4 divides the sectors into the three overarching categories: Recycling Industries (supply side), Recycling Reliant Industries (demand side), and Reuse and Remanufacturing Industries. Following Table 4 is a more detailed description of each sector. Table 4 Categorization of Included Sectors
RECYCLING INDUSTRIES (Supply Side) Sector Description
1 Government Staffed Residential Collection 2 Private Staffed Recycling Collection 3 Compost/Organics Processor 4 Materials Recovery Facilities 5 Recyclables Material Wholesalers
14 Plastics Reclaimers RECYCLING RELIANT INDUSTRIES (Demand Side)
6 Glass Container Manufacturing Plants 7 Glass Product Producers 8 Nonferrous Secondary Smelting and Refining Mills 9 Nonferrous Product Producers
10 Nonferrous Foundries 11 Paper and Paperboard Mills/Deinked Market Pulp Producers 12 Paper-based Product Manufacturers 13 Pavement Mix Producers (asphalt and aggregate) 15 Plastics Product Manufacturers 16 Rubber Product Manufacturers 17 Steel Mills 18 Iron and Steel Foundries 19 Other Recycling Processors/Manufacturers
REUSE AND REMANUFACTURING 20 Computer and Electronic Appliance Demanufacturers 21 Motor Vehicle Parts (used) 22 Retail Used Merchandise Sales 23 Tire Retreaders 24 Wood Reuse 25 Materials Exchange Services 26 Other Reuse

Northeast Recycling Council, Inc. Recycling Economic Information Study Update
Final Report to Northeast Recycling Council, Inc. Page 16 Recycling Economic Information Study Update NERC February 2009 ©
RECYCLING INDUSTRIES Sector 1: Public Collection Municipal curbside and drop-off recycling collection programs are extensive in the NERC states and an important first step in the municipal recycling process. They also are a large and often overlooked contributor to the recycling economy. With employment in New York City alone of over 6,000 sanitation workers performing the ever important job of collecting refuse and recyclables from city streets, and about 20 percent of these workers dedicated to recycling, the payroll (and operating costs) of these collection workers is high. When recyclable materials increase in value, more materials may be picked up in recycling trucks instead of refuse trucks, further increasing jobs in recycling collection. In the states of Massachusetts, New York, and Pennsylvania, curbside recycling collection is provided to more than half of the population parallel to the refuse collection service. While parallel curbside collection of recycling is expanding in Maine and Delaware, an extensive system of drop-off recycling locations are also available to residents of these states, as well as to residents of the more rural areas of the other Participant States. In Maine, both refuse and recycling can be dropped off at municipal and regional/county transfer stations and drop-off centers maintained by public officials (or in some cases under contract to private entities). In contrast, the Delaware Solid Waste Authority has long maintained an extensive system of recycling drop-offs open 24/7 at convenient locations. However, Delaware households are transitioning to curbside collection services, with a large jump in the population with curbside service in both 2006 and 2007. For this study, residential recycling collection was accounted for under Public Collection (Sector 1) or Private Collection (Sector 2). Public collection encompasses municipal curbside and drop-off recycling collection programs offered through local governments, including towns, cities, villages, counties and solid waste districts or authorities. The programs are staffed by public employees. Sector 1 excludes programs offered through local government but under contract to a private entity, which are accounted for under Sector 2, Private Collection. In each state, the Project Team collected or was provided with data on the type of collection program offered in municipalities (drop-off, municipal curbside, or subscription curbside service) and the number of households or total population served by the program. In most cases the Project Team was also provided with recycling tonnage data by municipality. Using the household counts, the Project Team was able to estimate curbside collection labor and trucks necessary to service the population. The Project Team then modeled total costs based on the trucks and labor necessary, including capital and operating costs. The Project Team then used data reported in the County Business Patterns (2005) and Bureau of Labor Statistics (2006) to determine the average pay of recycling collection workers, and to estimate total payroll based on the modeled labor requirements in each state.

Northeast Recycling Council, Inc. Recycling Economic Information Study Update
Final Report to Northeast Recycling Council, Inc. Page 17 Recycling Economic Information Study Update NERC February 2009 ©
Sector 2: Private Collection This sector encompasses those private businesses engaged in the collection of recyclables from residents and businesses through a direct contract with the municipality (to service residents) or the generator. This includes private subscription residential recycling collection service and all commercial recycling collection. These recycling haulers collect mixed recyclables from households or businesses (delivering them to materials recycling facilities for sorting as described in Sector 4), or specific materials such as corrugated, mixed paper, and metals, and in some cases plastics, electronics, or glass. The Project Team estimated employment, payroll, and gross receipts from these recycling haulers using three approaches:
• For municipal contracted collection, the Project Team estimated payroll and operating costs based on the number of households served, estimated route sizes, and truck operating and maintenance costs using recent Project Team collection cost models. The Project Team used 2005 County Business Patterns and 2006 Bureau of Labor Statistics wage data for collection workers to validate estimated labor costs.
• For residential subscription recycling, the Project Team estimated the number of
subscription customers (customers who must sign up and pay for separate collection of recyclables) in each state based on data from state agencies on which communities relied on subscription curbside service. Based on these population counts, the Project Team assumed 15 percent of households offered the recycling service subscribed. Using this information, the Project Team then modeled subscription recycling costs based on route sizes and truck operating and maintenance costs, similar to the modeling done for municipal recycling.
• For commercial recycling costs, the Project Team either gathered existing tonnage
data on quantities of cardboard and mixed paper collected for recycling from the commercial sector, or made estimates based on other state data. Data were available in Delaware, Maine, Massachusetts, and Pennsylvania, and extrapolated for New York State. Using the tonnage data and the tonnage by source (as available), the Project Team made estimates of the amount of material that was collected by private haulers as opposed to brokered directly from the commercial generator to the end user. With these tonnage estimates, the Project Team was able to estimate the number of trucks necessary to collect material and the truck operating costs, including labor (based on collection models the Project Team had developed for other projects).
• Finally, beverage container redemption activity was also included in this sector for the
States of Maine, Massachusetts, and New York. The handling fee paid to redemption centers multiplied by the total containers redeemed was used to estimate gross receipts. Total establishments were provided by State officials and employment and payroll were estimated based on Project Team work on redemption center operating costs in Vermont and Massachusetts.

Northeast Recycling Council, Inc. Recycling Economic Information Study Update
Final Report to Northeast Recycling Council, Inc. Page 18 Recycling Economic Information Study Update NERC February 2009 ©
Sector 3: Compost and Miscellaneous Organics Producers Compost is produced by municipal and private facilities that accept, handle and process leaf and yard waste, brush and tree trimmings, food waste and biosolids to material specifications. Composting facilities handle and process material using a combination of low technology windrow composting, and higher technology in-vessel systems. While facilities that handle biosolids, animal wastes, and food waste on a large scale utilize more sophisticated composting processes to control orders and material curing time, yard waste (grass, leaves and brush) and wood wastes (branches, limbs, trunks and ground untreated wood) are often composted through simple methods utilizing less equipment, labor, and expense. The Project Team surveyed public and private composting facilities by telephone to determine the average cost of operations, annual throughput, and annual employment and payroll costs to estimate total economic activity in each state. The averages were then applied to facility counts by facility type (e.g. municipal, private, and biosolids composting facilities) to develop total estimates of employment, payroll, and gross receipts. This sector also includes facilities that produce mulch, bark, and other soil amendments in addition to compost. For example, a grinding operation that ground wood waste for use as landscaping materials or mulch was part of the survey and accounted for in the total activity for each state. Sector 4: Materials Recovery Facilities Materials recovery facilities (MRFs) are processing facilities that handle mixed and separated recycled materials but that have the capacity to mechanically sort as well as process materials for sale to end markets. MRFs add value to recycling by allowing municipalities and private haulers to collect material commingled, making collection more efficient, and then deliver mixed materials to the MRF which cleans, separates, and densifies materials for transport to specific end markets. The Project Team purchased a commercially available database of MRFs to obtain data on the number of establishments, employment, throughput, and average material revenues, and used economic census data to estimate payroll for reported employment in each state. Sector 5: Recyclable Material Wholesalers This sector encompasses those businesses that are primarily engaged in the “merchant wholesale distribution of automotive scrap, industrial scrap, and other recyclable materials11.” This includes establishments who wholesale and distribute scrap iron and steel, paper and paperboard scrap (paper stock dealers),
11 NAICS code 423930 Recyclable Material Merchant Wholesalers description.

Northeast Recycling Council, Inc. Recycling Economic Information Study Update
Final Report to Northeast Recycling Council, Inc. Page 19 Recycling Economic Information Study Update NERC February 2009 ©
and recovered nonferrous metals, textiles, glass, plastics, rubber, and oil. These businesses primarily handle material processed elsewhere, such as corrugated from grocery and large retail outlets. However, wholesalers may also consolidate loads, and may reprocess material to increase value by removing contaminants from lower grade materials. NAICS code 423930 was assigned to Recyclable Material Merchant Wholesalers for the 1997 economic census reassigned from SIC code 5093. The Project Team used the economic census data as a starting point, but then worked with the Institute of Scrap Recycling Industries (ISRI) to adjust figures to reflect 2007 receipts. The Iron Age #1 Composite Prices from 2002 to 2007 were reviewed and gross receipts were adjusted upward to reflect the increase for 2007. The Project Team also used more recent data from the Paper Stock Report to update corrugated, newsprint, and sorted office paper prices to reflect the significant increase in prices subsequent to the 2002 census. For the other recyclables materials merchant wholesalers (e.g. textiles, glass, plastics, rubber, and oil), the Project Team used the 2002 census figures because the breakdown by material could not be determined by the census data from which to equitably apply changes in prices from 2002 to 2007. Sector 14: Plastics Reclaimers Plastics reclaimers take post-industrial and post-consumer plastics and process them to prepare them for end-use in a manufacturing facility. Plastic reclaimers are separate from establishments who broker, sort, or bale plastic material, or manufacture an end product, which are included in Sectors 29, 4 or 5, and 15, respectively. Reclaimers often specialize in a single commodity resins such as polyethylene or polypropylene, or in engineering or other specialty resins. Depending on the needs of the end-user, processes at reclaimers may include grinding into flake, washing, colorizing, or adding other additives, compounding, remixing, and/or extruding into pellets. The material is then sold to manufacturers who make end products. The Project Team surveyed plastics reclaimers over the telephone to determine the average cost of operations, the typical size and throughput, annual employment, and payroll costs to estimate total economic activity in each state. The averages were then applied to facility counts in each state to develop total estimates of employment, payroll, and gross receipts for each state. RECYCLING RELIANT INDUSTRIES Sector 6: Glass Container Manufacturers This sector is comprised of manufacturers of glass containers for liquor, beer, wine, other beverages, and food. The manufacturers use a portion of recycled glass cullet along with virgin raw materials in their production. The Project Team surveyed by telephone glass

Northeast Recycling Council, Inc. Recycling Economic Information Study Update
Final Report to Northeast Recycling Council, Inc. Page 20 Recycling Economic Information Study Update NERC February 2009 ©
container manufacturing facilities in each state to estimate average cullet throughput, annual employment, and payroll costs, and gross receipts. There are no plants in Maine or Delaware. Because survey data were limited from Pennsylvania plants, data from Massachusetts and New York plants were used to estimate the values for this sector for Pennsylvania. The use of recycled material at the surveyed establishments ranged from 50 to 80 percent, and therefore total estimates of employment, payroll, and gross receipts are reduced by the percentage cullet used to account for only that activity involving recycled material (e.g. cullet).12 Sector 7: Glass Product Producers This sector encompasses manufacturers (other than glass container manufacturers, which are covered in Sector 6) which use recycled glass to produce a product. Establishments preparing glass for other manufacturers (glass beneficiation plants) are not included in this sector, but in Sector 5. Examples of Sector 7 manufacturers include those producing fiberglass, sandblasting materials, industrial beads (e.g. for reflective paint), countertops, specialty glass, and artists using recycled glass in their artwork. The Project Team surveyed glass product producers to develop estimates of the average size of facilities, and then applied the averages to facility counts to estimate total employment, payroll, and gross receipts. Sector 8: Nonferrous Secondary Smelting and Refining Mills
Nonferrous metals (those that do not contain iron) are used in a wide variety of manufactured products, including beverage cans, electronics, automobiles, and household appliances. Secondary manufacturers smelt (chemically reduce), refine, and sometimes blend nonferrous scrap along with metals recovered from shaping and trimming during primary metal production and fabrication processes. The most common nonferrous metals recovered domestically are aluminum, lead, copper, and zinc followed by chromium, nickel, and magnesium.13
Aluminum is the most widely used nonferrous metal. It is used by container and packaging manufacturers as well as in the transportation, construction, and electrical sectors. Copper is used in power, lighting, and communications transmissions. While the domestic use of lead has decreased in most products, lead’s primary use is in storage batteries for automobile ignition starters, and uninterruptible and standby power supplies (necessary for computers, emergency lighting, and telephones). Finally, zinc is primarily used to galvanize products found in the automobile, steel, and construction industries, but secondary zinc is often used to produce brass and bronze or blended for alloys.
Data used to estimate the value of the nonferrous smelting and refining operations came primarily from the economic census, with input from the Aluminum Association and USGS metal experts. The NAICS codes used by the economic census separates out secondary smelting and refining mills by metal type, for aluminum (331314), and copper (331423), but groups the rest of
12 It is unclear whether economic data for glass container manufacturers was prorated based on the percent of cullet use in the 2000 Report. 13 USGS: 2005.

Northeast Recycling Council, Inc. Recycling Economic Information Study Update
Final Report to Northeast Recycling Council, Inc. Page 21 Recycling Economic Information Study Update NERC February 2009 ©
nonferrous metals into NAICS 331492, as Secondary Smelting, Refining, and Alloying of Nonferrous Metals. Sector 9: Nonferrous Product Producers The nonferrous product producers sector encompasses manufacturers that produce primary products or shapes from nonferrous scrap, including bar plate, sheet, strip, and tube. This sector excludes secondary smelting and refining activity (see Sector 8 above) but includes the following activities:
• Aluminum sheet, plate, and foil manufacturing, including flat, rolling or continuous casting sheet, plate, foil, and welded tube from purchased aluminum and/or recovering aluminum from scrap and flat rolling or continuous casting sheet, plate, foil, and welded tube in integrated mills.
• Aluminum extruded product manufacturing includes rolling, drawing, and/or
extruding shapes in integrated mills. • Other aluminum rolling and drawing includes extruding aluminum bar, pipe, and tube
blooms, or extruding or drawing tube from purchased aluminum and/or recovering aluminum from scrap and extruding bar, pipe, and tube blooms in integrated mills.
• Copper rolling, drawing and extruding includes rolling, drawing, and/or extruding
shapes (except bare or insulated copper communication or energy wire) from purchased copper and/or recovering copper from scrap and rolling, drawing, and/or extruding shapes (except bare or insulated copper communication or energy wire) in integrated mills.
• Nonferrous metals (other than copper and aluminum) includes rolling, drawing,
and/or extruding shapes from purchased nonferrous metals and/or recovering nonferrous metals from scrap and rolling, drawing, and/or extruding shapes in integrated mills.
Sectors 10 and 18: Nonferrous and Ferrous Foundries Ferrous and nonferrous foundries specialize in melting and casting metals into specific shapes that are used in automobiles, plumbing fixtures, trains, airplanes, and other equipment. A wide variety of casting processes (utilizing molds made of sand, metal dies, and ceramics) and metal choices can be combined to serve characteristics of the final product. While all metals can be cast, the most predominant are iron, aluminum, steel, and copper-base alloys. According to the American Foundry Society (AFS), over 14 million tons of castings were produced in the U.S. in 2007, valued at $32.3 billion. After China, the U.S. is the world's second-largest producer of castings, followed by Japan, Russia, Germany, and India. There are currently 2,336 operations representing 220,000 jobs in the U.S. (80 percent of which are small businesses with less than 100 employees) down from 3,300 operations in 1990. According to the AFS, this decrease is due to increased foreign competition, regulatory burdens, and some attempts over the past decade to position the U.S. more toward a service economy.

Northeast Recycling Council, Inc. Recycling Economic Information Study Update
Final Report to Northeast Recycling Council, Inc. Page 22 Recycling Economic Information Study Update NERC February 2009 ©
Nonferrous casting is primarily done with aluminum and copper (roughly 70 – 80 percent by weight according to experts at the AFS), with magnesium representing a large percentage of the remainder. Economic data on both ferrous and nonferrous foundries were obtained primarily from economic census data with input from technical experts from the American Foundry Society, the Pennsylvania Foundry Society, and the Nonferrous Founders Society to allocate scrap percentages. Sector 11: Pulp and Paper Mills According to the American Forest and Paper Association (AF&PA), nearly 80 percent of all paper mills in the United States use recovered paper. The mills use it to make everything from newspapers and corrugated boxes to paperboard packaging and office paper. The AF&PA defines “recovery” as paper that is recycled at domestic mills, exported, or used to make new non-paper products. Paper that is recovered but not utilized is not counted. According to the AF&PA, 56 percent of the paper consumed in the U.S. was recovered for recycling in 2007 (or 360 pounds per capita). The industry has set the goal to recover 60 percent of the paper consumed in the U.S. by 2012. Recovered paper consumption by mills in the study region ranged from an estimated low of 7 percent (rounded) in Maine to an estimated high of 86 percent (rounded) for Massachusetts in 2006. To be considered a recycling industry for purposes of this study, the methodology measured activity at the first stage of manufacturing only. For paper, this was at the mill where a roll of paper was made, and excluded any conversion of paper to products such as containers or envelopes, even if they had some or all recycled content. The Annual Survey of Manufacturers’ 2006 data were used to develop the base economic data for this sector. Employment, payroll and gross receipts for NAICS code 3221 (pulp, paper, and paperboard mills) were then adjusted to represent the percent of recycled scrap paper used, on average, in each state compared to virgin pulp. Sector 12: Paper-based Product Manufacturers This sector encompasses manufacturers (other than paper mills, which are covered in Sector 11) that use recycled paper to produce a product. Examples of Sector 12 manufacturers include those producing cellulose insulation, hydro-seeding mulch, pressed paperboard and molded fiber (e.g. food service trays, egg cartons, tableware, berry baskets), construction paperboard (e.g. for poured concrete spacers), and masking tape backing. The Project Team surveyed manufacturers over the telephone to determine throughput and percentage of recycled paper used, annual employment, and payroll costs, and gross revenues to estimate total economic activity in each state. Data from surveys in Maine, Massachusetts, and New York were used to estimate survey data for Pennsylvania where only a limited survey sample was obtained. Sector 13: Pavement Mix Producers (asphalt and aggregate) This category includes the use of recycled asphalt and aggregate. Recycled asphalt pavement (RAP) consists of old asphalt pavement milled and ground into aggregate. RAP can substitute

Northeast Recycling Council, Inc. Recycling Economic Information Study Update
Final Report to Northeast Recycling Council, Inc. Page 23 Recycling Economic Information Study Update NERC February 2009 ©
for a portion of aggregate required in bituminous concrete (i.e. asphalt pavement) in both the base course and surface course. The advantages of using RAP include savings on purchasing new aggregate and the use of less liquid asphalt per ton - an increasing advantage as liquid asphalt prices rise when petroleum prices increase. Most new hot-mix plants have installed the equipment necessary to use RAP in their product, whereas older plants often do not have the capability. The amount of RAP used in pavement varies, often limited by state or bid specifications to 20 or 30 percent of total aggregate, yet it has been used upwards of 40 percent in base course applications. Another limitation is imposed by air emission requirements - as the percentage of RAP rises, emissions of air pollutants can increase. Typical RAP Specification Limits on State Highway Projects
State Base Course Surface Course New York 30% 20% Massachusetts 40% 10% Maine 15% 15% Delaware Limitation in air pollution control Pennsylvania 15% 15%
Other recycled materials such as pulverized glass and asphalt shingles also can be used in asphalt paving. Very little of this is reportedly being done in the Participant States. Crushed concrete can be used for sub-base aggregate in road building. It is cost-effective and technically suitable to reuse old concrete roads on-site and in-place by “rubblizing” the old concrete and laying new base course and surface course over the material. New York State has many concrete roads which are being reconstructed in this manner. Maine has also completed some in-place reclamation projects. Massachusetts and Delaware have each completed some in-place projects, but have had mixed results and therefore this practice is limited. The 2000 Report does not specifically address the recycling of concrete. The tonnages reported would indicate that concrete was not included although footnote 40 to the tables states that it is based on NERC web site data for asphalt/concrete. For purposes of this study the Project Team has made the assumption that concrete is not included. Although industry groups such as the Asphalt Recycling and Reclaiming Association and state departments of transportation do not collect definitive data on tons of RAP used, the Project Team was able to generate reasonable estimates based on speaking with knowledgeable experts at those organizations in each state. State industry and/or Department of Transportation officials were able to produce relatively accurate counts of plants which are RAP-capable in their respective state for the establishment count. The Project Team then applied a state-wide average of RAP usage to economic census data to estimate employment, receipts, and tonnage for each state. Payroll was estimated using state payroll averages for each state.

Northeast Recycling Council, Inc. Recycling Economic Information Study Update
Final Report to Northeast Recycling Council, Inc. Page 24 Recycling Economic Information Study Update NERC February 2009 ©
Sector 15: Plastic Product Manufacturers The 2000 Report used the term “Plastic Converters” for Sector 15, and included “Establishments which produce intermediate plastic products (e.g. molded products and components, sheet and fiber) using recycled pellets or granulated plastic as a feedstock.” The correct definition of a “plastic converter” is “[a] manufacturer who uses raw materials such as plastic resins and films, paper, foil, cellophane, adhesives and inks to create rigid or flexible packages or packaging materials that are then sold to organizations who package products therein.”14 The Project Team has changed the title of Sector 15 to “Plastic Product Manufacturers” to more closely represent this industry, which essentially purchases recycled plastic flake, granulate, and/or pellets; for use in the production of new plastic products. Most of the establishments use post-industrial plastic scrap which has been processed by a plastics reclaimer or grinder. A few are using post-consumer resins (PCR), and others are reclaiming material themselves before manufacturing. Only establishments that are purchasing or receiving recycled materials from external sources are included (those recovering only their own scrap back into their process are excluded). Examples of Sector 15 manufacturers include manufacturers of plastic lumber and furniture, swimming pools, battery casings, crates, paint trays, razors and toothbrushes, washers, fluorescent light bulb covers, and packaging inserts. In most cases the recycled plastic resin is mixed with virgin resins to produce the final product. Therefore, as is the case with paper, steel, and glass product manufacturing, economic activity is allocated to represent the average recycled resin content of the products manufactured The Project Team surveyed from the list of plastics manufacturers known to use recycled resins to determine the percent of recycled resin used, size and throughput, annual employment and payroll costs, and gross receipts. The averages were then applied to establishment counts of manufacturers known to use recycled resin (from state and trade association databases) to develop total estimates of employment, payroll, and gross receipts in each state. Sector 16: Rubber Product Manufacturers Recycled rubber product manufacturers produce a wide array of products from whole scrap tires, buffings, crumb rubber, and ground rubber materials. The Recycling Research Institute reports that in 2007, total national consumption of recycled tires in ground rubber markets was 51 million tires. Of this total, 62 percent was estimated to be consumed for the manufacture of molded products or surface/ground covers, with the remaining 38 percent consumed as rubber modified asphalt or tire/automotive uses. The target population of rubber manufacturing businesses was obtained from the Recycling Research Institute’s Scrap Tire and Rubber 2008 User’s Directory, which was also cited by a representative of the Rubber Manufacturing Association as being the best source of companies that utilize recycled rubber for manufacture of other products. The range of products into which recycled rubber is manufactured is quite diverse. Companies found in the five states included in this study were reported to manufacture flooring and surface applications (indoor and outdoor), block rubber products for a range of building applications,
14 Osborn, K. and W. Jenkins, Plastic Films: Technology and Packaging Applications, Technomic Publishing Company, Lancaster, PA, 1992, p 239.

Northeast Recycling Council, Inc. Recycling Economic Information Study Update
Final Report to Northeast Recycling Council, Inc. Page 25 Recycling Economic Information Study Update NERC February 2009 ©
pavers and mats for landscaping, rubber mulches, and a wide range of specialized molded rubber (sometimes composite) products. The Project Team surveys of this category specifically excluded companies that perform grinding, reprocessing, and reclaiming of rubber products for use in tire-derived fuel and civil engineering applications (assuming these companies are better classified as wholesalers). It also excluded companies that collect, distribute, or broker ground rubber materials including buffings and rubber dust because these companies are included in Sector 5. Sector 17: Iron and Steel Mills Steel (an alloy of iron and carbon) is produced in mills that rely on scrap metal to produce new steel. In fact, as discussed in the section Modifications to 2000 Methodology, above, it is no longer possible to produce steel in some steel mills in the United States without scrap as one of the inputs. In 2006, over 73 million tons of U.S. generated steel scrap were recycled or exported for recycling. Depending on the mill capacity, furnace type, and available scrap supply, different quantities of scrap metal are used. In general, however, input to U.S. mills employing electric arc furnaces averaged roughly 82.8 percent ferrous scrap in 2006 to produce products such as structural beams and steel plates. In contrast, input to basic oxygen furnaces averaged roughly 28.9 percent ferrous scrap in 2006 to produce products such as automotive fenders, and food and product packaging (e.g. food cans and steel drums).15 Using these average scrap percentages by furnace type and data from the Steel Recycling Institute (SRI) on the capacity of each mill located in the NERC states, the Project Team worked with the SRI to estimate total scrap throughput at steel mills in each NERC state. Scrap usage at mills were totaled for each state to enable employment, payroll, and gross receipt data to be allocated to recycling activity based on resultant estimated scrap use. The Project Team used the Annual Survey of Manufacturer’s economic data (2006) to determine how current industry derived data compared to the 2000 Report, which relied primarily on census data. The NAICS code 33111 “Iron and Steel Mills and Ferroalloy Manufacturing” data was used and comprises establishments “primarily engaged in one or more of the following manufacturing activities:
• Direct reduction of iron ore; • Pig iron in molten or solid form; • Converting pig iron into steel; • Ferroalloys; • Making steel; • Making steel and shapes (e.g., bar, plate, rod, sheet, strip, and wire); and • Making steel and forming pipe and tube.”16
Employment and payroll data were estimated for each state with guidance from SRI. National employment and payroll figures from a National Iron and Steel Industries 2006 survey of the industry were used to estimate employment and payroll in each state. 15 Steel Recycling Institute. The Inherent Recycled Content of Today’s Steel. 2006. 16 U.S. Economic Census definition for NAICS code 33111.

Northeast Recycling Council, Inc. Recycling Economic Information Study Update
Final Report to Northeast Recycling Council, Inc. Page 26 Recycling Economic Information Study Update NERC February 2009 ©
The primary information source used to ascertain employment, payroll, and gross receipts for the 2000 Report was the 1995 Standard Statistical Establishments List, SIC code 3312, adjusted to 95 percent of total reported value to account for downstream conversion. In contrast, this study relied on data provided by the SRI on actual mill capacity and estimated scrap usage at steel producing mills as the basis for recycling employment, payroll, and gross receipts. While these adjustments to the methodology should have significantly reduced reported economic values, the significant increase in the value of steel in 2006, as reflected in the 2006 Annual Survey of Manufacturer’s data for each state virtually made up for the reduced activity reported in this study. Sector 18: Ferrous Foundries See description of Sectors 10 and 18: Nonferrous and Ferrous Foundries, above. Sector 19: Other Recycling Processors This is the first of two catch-all categories in the study (Sector 26, Other Reuse, is the other). Establishments engaged in recycling that did not fall into any other recycling category are classified here. In some cases, it was possible to define and identify lists of companies that potentially fall in this category. By definition, this category includes:
• Fluorescent lamp and mercury recyclers; • Gypsum drywall recycling; • Carpet recyclers; • Waste oil recycling; and • Textile (rags) recycling.
The acquisition of comprehensive lists for such a diverse array of niche recyclers was relatively challenging. While some trade associations exist that address one or more of these functions, none of these associations are as mature (and therefore as informative) when compared to most of the other recycling business categories included in the study. Additionally, response rates on direct surveys of the businesses in this category were low. Many of the businesses that were identified in the preliminary research phase were ultimately not found to be in business (e.g. number disconnected, different business at that number). With one exception (industrial textile recycler), responses were received only from smaller, specialized companies (a used oil filter recycler and a lamp recycler). As a consequence the Project Team believes that the results undercount the contribution from these recyclers, both from the industries that were specifically defined to be in this category, as well as other businesses – potentially many other businesses – that were never even identified for surveying that could lay claim to some recycling process. REUSE AND REMANUFACTURING INDUSTRIES Sector 20: Computer and Electronic Appliance Demanufacturers The computer and electronic recycling and recovery industry has evolved significantly in recent years. Recovery of electronic waste (e-waste) falls into two categories. The first involves

Northeast Recycling Council, Inc. Recycling Economic Information Study Update
Final Report to Northeast Recycling Council, Inc. Page 27 Recycling Economic Information Study Update NERC February 2009 ©
recovery of the component parts of e-waste, through dismantling, sorting, grading, and recycling. The second involves the reuse of electronics through a process of remanufacture (with unusable components subsequently shipped downstream for further processing and recovery). The 2000 Report categorized all establishments that handled electronics for remanufacture or recycling here. The Project Team performed extensive research and held multiple discussions with e-waste recycling industry stakeholders – primarily ISRI – and U.S. Census Bureau staff specializing in relevant NAICS codes. Based on these discussions, it is the Project Team’s understanding that establishments that are strictly engaged in the recovery of the recyclable metals and plastics that are found in electronic waste are classified, for business census purposes, under Recyclable Material Wholesalers (Sector 5). This was in fact confirmed through further research by the Project Team as many of the establishments identified by the International Association of Electronics Recyclers (IAER) turned out to be wholesalers who dealt with e-scrap as one of many commodities targeted. Wholesalers who handled electronic waste along with other ferrous and nonferrous metals (and potentially other commodities) were therefore not included in this category, but rather are believed to have been captured in Sector 5 data. The companies in this category were instead primarily focused on demanufacture, remanufacture, and/or reuse of computers and electronics as the primary focus of their business, with a meaningful portion of the business being remanufacture/asset recovery. They did not branch into recovery of other non-computer/non-electronic scrap materials. These establishments included corporate computer asset recovery business units of larger companies, but primarily consist of smaller remanufacture/recovery businesses targeting a specific niche market (either geographical or business niche such as computer recovery for schools). The Project Team surveyed these businesses and used the survey data to estimate economic activity. Sector 21: Motor Vehicle Parts (used) This sector is primarily covered under NAICS code 423140 - Motor Vehicle Parts (Used) Merchant Wholesalers. It comprises establishments “primarily engaged in the merchant wholesale distribution of used motor vehicle parts (except used tires and tubes) and establishments primarily engaged in dismantling motor vehicles for the purpose of selling the parts.” Scrap automobiles had record recovery in 2006 (104 percent) the last year data were available.17 Motor vehicle parts are first removed and sold for reuse (or in some cases the high metal value) before the vehicle is crushed and processed as scrap metal use in new metal production. The Project Team used the County Business Patterns (2005) under NAICS 423140 for employment and payroll data to report on this sector and relied on census data (2002) for gross receipts by state. However, to directly compare this sector with the 2000 Report data, there is a need to add in economic data from the retailing of used motor vehicle parts, which was included in the original
17 USGS, Iron and Steel Scrap, Mineral Commodity Summaries. January, 2008. Recovery of greater than 100 percent simply means that more scrap automobile tonnage was recovered in 2007 then the amount of steel used to produce new automobiles. This is due in part to the historically high price for automotive scrap in 2007.

Northeast Recycling Council, Inc. Recycling Economic Information Study Update
Final Report to Northeast Recycling Council, Inc. Page 28 Recycling Economic Information Study Update NERC February 2009 ©
SIC code 5015, Motor Vehicle Parts Used. To do so, the Project Team obtained unpublished data from the Census Bureau in order to determine that the 9 percent (rounded) of NAICS code for automotive parts and accessories stores were classified as “used.” This percentage was applied to the NAICS code 441310 in each state to account for used retail sales in each state, and enable a direct comparison to be made. Sector 22: Retail Used Merchandise Sales This sector is covered under NAICS code 453310 - Used Merchandise Stores – and comprises “establishments primarily engaged in retailing used merchandise, antiques, and secondhand goods (except motor vehicles, such as automobiles, RVs, motorcycles, and boats; motor vehicle parts; tires; and mobile homes).” The Project Team was able to confirm, after significant discussion with the U.S. Census Bureau, that this new NAICS code captures not only antique stores (and historic documents), used apparel stores, used clothing, used book dealers, used household appliance stores, thrift stores and used sporting good stores, but also brick dealers, building materials, flea markets, used furniture stores, salvage stores, secondhand stores, and a few others. In addition, it includes not-for-profits as well as for profit businesses which means that the Salvation Army, Goodwill, and used building materials stores are all included, assuming that they have anyone on the payroll. One difference between the 2000 Report (based on 1992 SIC codes) and the current study (based on 2002 NAICS code) is that pawn shops were included in the SIC code 5932 (which was used for Sector 22 in the 2000 Report) and are not captured in the new NAICS codes. Instead, pawn shops are now coded as financial institutions. The Project Team used employment and payroll data in each state from 2006 County Business Patterns and used 2002 economic census data for gross receipts in this sector for each of the NERC states. Sector 23: Tire Retreaders This sector is covered under NAICS code 326212 Tire Retreaders, which comprises “establishments primarily engaged in retreading or rebuilding tires.” Retreads are made from tires that are worn yet otherwise structurally sound or that have a good foundation. The first step in retreading is inspection, then buffing (where the remaining tread is removed), then preparing the casing, and applying the new tread. (Photo Source: Tire Retread Information Bureau) The Project Team contacted the Tire Retread Information Bureau (TRIB) for establishment counts by participant state. However TRIB did not have industry economic data by state, therefore the Project Team turned to the CBP (2006) and Census (2002) for employment, payroll, and gross receipts.

Northeast Recycling Council, Inc. Recycling Economic Information Study Update
Final Report to Northeast Recycling Council, Inc. Page 29 Recycling Economic Information Study Update NERC February 2009 ©
Sector 24: Wood Reuse This category consists of all establishments that accept clean wood, primarily wood pallets and possibly some dimensional lumber, and either remanufacture pallets and/or chip clean wood to create a saleable product other than wood chips for fuel. The universe of companies was identified primarily from the National Wood Pallet and Container Association, and supplemented by state recycler lists. The intent of the Project Team was to place all wood ground to produce mulch and as a bulking agent for compost in Sector 3, although it is possible that some of the ground wood produced by companies in this sector also goes into mulch – primarily colored mulches. This category does not include companies that grind wood for use as fuel, nor specialty antique wood product recovery companies, which were generally included under the Other Reuse category, and are described in more detail below. Sector 25: Materials Exchanges The Materials Exchanges category included any business or entity that provided either a physical or virtual market where generators of used materials (industrial, construction-related, residential durable goods, etc.) and potential users of such products could facilitate a transaction to reuse otherwise end-of-life materials. The Project Team identified materials exchanges through the U.S. EPA website and state websites, as well as several private/non-profit organizations that have compiled lists of Materials Exchanges. Materials Exchanges spanned several niches, including those specializing in industrial waste materials, construction/demolition/renovation/deconstruction, industry-specific materials (such as arts/crafts), and college or community warehouses. At least several of the Exchanges were strictly virtual and required little or no day-to-day maintenance. At least one Exchange was found to be temporarily non-operational, although with the expectation of resuming operations in the future. As a consequence of these virtual and minimally operating exchanges, the economic contributions from these establishments as measured by payroll and gross receipts are among the lowest of all recycling/reuse industry businesses. The volume of reused/recycled materials may have been much larger, although few of the establishments could quantify the weight of materials for which transactions occurred. Sector 26: Other Reuse This is the second catch-all category, intended to capture all businesses that either purchase or otherwise obtain used materials, equipment, or merchandise for repairing, cleaning, or otherwise putting back into use. As with the Other Recycling category, there are no trade associations dedicated to reuse businesses. Therefore the Project Team’s ability to identify such businesses was limited to their inclusion on one of the state recycling directories consulted

Northeast Recycling Council, Inc. Recycling Economic Information Study Update
Final Report to Northeast Recycling Council, Inc. Page 30 Recycling Economic Information Study Update NERC February 2009 ©
at the outset of the project, or in some cases as a result of businesses that were thought to be in other categories getting reclassified into Other Reuse. Survey respondents included a specialty used tire reseller, a barn recovery/reuse company (that manufactured the recovered wood and other barn materials into specialty furniture), a homeless shelter that had developed a reuse program to fund its operations, artists who use recycled materials in their work, and a shipbuilding venture that highlights reuse/recycling opportunities for scrap metal. All of these businesses were found to be small, so to the extent one or more of the non-responsive companies in this list were larger, the Project Team’s projections of the economic contribution of this sector would be low.

Northeast Recycling Council, Inc. Recycling Economic Information Study Update
Final Report to Northeast Recycling Council, Inc. Page 31 Recycling Economic Information Study Update NERC February 2009 ©
PART II. Results and Comparison
Results by Sector and State The detailed results for industries identified in each Participant State, and the economic activity attributed to recycling, are shown in Appendix A – Detailed Reporting Form, All NERC States. Also in Appendix A are footnotes that explain the data source for each sector, and any differences between state data sources. The detailed results presented in Appendix A are summarized by Participant State and shown below in Table 5. Table 5 has been reproduced to match Table ES-1 of the 2000 Report for comparison purposes. Note that in reading Table 5, the data for establishments and employment are actual, while the reported data for tons, payroll, and gross receipts are all in 1,000s. Table 5 Summary of Recycling Direct Economic Impacts, By State Note: “D” represents non-disclosure of data by the U.S. Census Bureau and/or the Project Team to protect confidential information due to a limited number of firms.
A. Business Category B. Data Type DE ME MA NY PA All 5 statesRECYCLING AND RECYCLING RELIANT INDUSTRIES:
1 Municipal Residential Establishments (#) 2 194 334 860 1,068 2,458 Curbside and Drop-Off Employment (#) 47 300 431 1,555 1,326 3,658 Collection Annual Payroll ($1,000) 1,221 8,749 21,162 109,094 47,115 187,341
Receipts ($1,000) 8,543 23,818 54,542 268,841 53,316 409,060 Throughput (1,000 tons) 43 98 276 714 686 1,817
2 Private Residential and Establishments (#) 21 880 597 879 287 2,665 Commercial Collection Employment (#) 19 868 1,284 2,749 1,207 6,127
Annual Payroll ($1,000) 870 19,968 36,139 71,712 44,927 173,617 Receipts ($1,000) 4,444 38,162 81,442 140,529 115,216 379,792 Throughput (1,000 tons) 87 252 908 2,316 1,619 5,182
3 Compost and Misc. Establishments (#) 28 85 267 137 446 963 Organics Producers Employment (#) 217 474 1,408 767 1,278 4,144
Annual Payroll ($1,000) 5,635 10,612 39,776 22,518 26,255 104,796 Receipts ($1,000) 20,003 37,023 111,906 66,083 88,590 323,605 Throughput (1,000 tons) 512 436 1,376 1,216 955 4,495
4 Materials Recovery Establishments (#) 2 6 10 41 48 107 Facilities (MRFs) Employment (#) 26 34 286 1,244 870 2,460
Annual Payroll ($1,000) 528 722 11,497 40,979 28,684 82,411 Receipts ($1,000) 2,913 3,895 33,221 166,810 50,859 257,698 Throughput (1,000 tons) 61 81 604 2,229 1,004 3,979
5 Recyclable Material Establishments (#) 19 36 154 455 397 1,061 Wholesalers Employment (#) 248 421 1,753 6,732 5,126 14,280
Annual Payroll ($1,000) 7,446 14,690 66,161 240,056 166,087 494,440 Receipts ($1,000) 154,498 256,868 874,083 3,009,357 5,504,777 9,799,584 Throughput (1,000 tons) 148 - - - 2,011 2,159
6 Glass Container Establishments (#) - - 1 2 5 8 Manufacturing Plants Employment (#) - - (D) 303 871 1,173
Annual Payroll ($1,000) - - (D) 16,500 61,127 77,627 Receipts ($1,000) - - (D) 67,375 183,946 251,321 Throughput (1,000 tons) - - (D) 151 686 837
Estimates of Total Recycling
(continued)

Northeast Recycling Council, Inc. Recycling Economic Information Study Update
Final Report to Northeast Recycling Council, Inc. Page 32 Recycling Economic Information Study Update NERC February 2009 ©
A. Business Category B. Data Type DE ME MA NY PA All 5 statesRECYCLING AND RECYCLING RELIANT INDUSTRIES:
7 Glass Product Producers Establishments (#) 1 - 2 7 2 12 (other recycled uses) Employment (#) (D) - 11 283 153 447
Annual Payroll ($1,000) (D) - 525 14,140 6,504 21,169 Receipts ($1,000) (D) - 525 56,788 24,313 81,626 Throughput (1,000 tons) (D) - 66 42 9 117
8 Nonferrous Secondary Establishments (#) - - 9 25 46 80 Smelting and Refining Employment (#) - - 554 953 2,610 4,116 Mills Annual Payroll ($1,000) - - 30,419 39,473 100,188 170,079
Receipts ($1,000) - - 186,106 349,038 741,938 1,277,082 Throughput (1,000 tons) - - - - - -
9 Nonferrous Product Establishments (#) - 1 11 27 38 76 Producers Employment (#) - 182 433 2,378 3,265 6,259
Annual Payroll ($1,000) - 5,938 15,672 112,884 143,736 278,230 Receipts ($1,000) - 42,672 260,500 1,150,437 955,835 2,409,443 Throughput (1,000 tons) - - - - - -
10 Nonferrous Foundries Establishments (#) - 5 37 53 77 172 Employment (#) - 19 612 1,864 4,469 6,964 Annual Payroll ($1,000) - 675 22,990 90,060 187,340 301,065 Receipts ($1,000) - 3,445 89,110 365,180 494,475 952,210 Throughput (1,000 tons) - - - - - -
11 Paper and Paperboard Establishments (#) - 6 15 25 22 68 Mills / Deinked Market Employment (#) - 438 2,089 3,767 2,319 8,613 Pulp Producers Annual Payroll ($1,000) - 24,972 106,018 206,411 143,977 481,378
Receipts ($1,000) - 197,111 732,442 1,699,767 2,106,234 4,735,554 Throughput (1,000 tons) - 317 513 1,991 847 3,668
12 Paper-Based Product Establishments (#) - 2 1 3 6 12 Manufacturers Employment (#) - 465 (D) 318 900 1,683
Annual Payroll ($1,000) - 17,438 (D) 6,650 31,995 56,083 Receipts ($1,000) - 63,875 (D) 47,563 156,644 268,082 Throughput (1,000 tons) - 93 (D) 75 229 397
13 Pavement Mix Producers Establishments (#) 7 23 44 18 86 178 (asphalt and aggregate) Employment (#) 180 168 210 200 376 1,134
Annual Payroll ($1,000) 2,400 4,754 9,473 9,029 13,062 38,719 Receipts ($1,000) 24,750 2,667 61,200 150,000 234,000 472,617 Throughput (1,000 tons) 512 148 1,020 2,200 3,900 7,780
14 Plastics Reclaimers Establishments (#) 1 - 19 20 19 59 Employment (#) (D) - 290 440 364 1,094 Annual Payroll ($1,000) (D) - 14,237 17,671 13,643 45,550 Receipts ($1,000) (D) - 124,033 168,681 138,252 430,966 Throughput (1,000 tons) (D) - 122 225 186 533
15 Plastic Product Manufacturers Establishments (#) 4 3 27 36 19 89 Employment (#) 22 105 620 1,059 1,110 2,916 Annual Payroll ($1,000) 550 2,569 19,371 29,804 29,989 82,283 Receipts ($1,000) 9,900 41,920 134,728 194,825 241,861 623,234 Throughput (1,000 tons) 2 15 77 149 111 354
16 Rubber Product Establishments (#) 1 - 13 12 34 60 Manufacturers Employment (#) (D) - 151 143 400 694
Annual Payroll ($1,000) (D) - 4,581 4,352 12,139 21,072 Receipts ($1,000) (D) - 17,317 16,451 45,889 79,657 Throughput (1,000 tons) (D) - 20 19 52 90
17 Steel Mills Establishments (#) 1 - - 12 58 71 Employment (#) (D) - - 1,969 11,886 13,856 Annual Payroll ($1,000) (D) - - 120,754 728,795 849,549 Receipts ($1,000) (D) - - 1,078,156 8,167,198 9,245,354 Throughput (1,000 tons) (D) - - 1,232 2,909 4,141
Estimates of Total Recycling
(continued)

Northeast Recycling Council, Inc. Recycling Economic Information Study Update
Final Report to Northeast Recycling Council, Inc. Page 33 Recycling Economic Information Study Update NERC February 2009 ©
A. Business Category B. Data Type DE ME MA NY PA All 5 statesRECYCLING AND RECYCLING RELIANT INDUSTRIES:
18 Iron and Steel Foundries Establishments (#) - 2 20 17 73 112 Employment (#) - 7 414 642 5,450 6,513 Annual Payroll ($1,000) - 256 16,650 24,030 215,640 256,576 Receipts ($1,000) - 1,305 56,430 79,020 611,550 748,305 Throughput (1,000 tons) - - - - - -
19 Other Recycling Establishments (#) 4 - 11 15 18 48 Processors / Employment (#) 19 - 134 185 230 568 Manufacturers Annual Payroll ($1,000) 256 - 6,563 9,063 11,250 27,132
Receipts ($1,000) 546 - 22,969 31,719 39,375 94,609 Throughput (1,000 tons) 3 - - - - 3
RECYCLING Establishments (#) 91 1,243 1,572 2,644 2,749 8,299 SUBTOTALS Employment (#) 1,177 3,481 10,703 27,549 44,210 87,120
Annual Payroll ($1,000) 42,081 111,343 422,721 1,185,181 2,012,453 3,773,780 Receipts ($1,000) 292,897 712,760 2,847,993 9,106,618 19,954,268 32,914,535
REUSE AND REMANUFACTURING INDUSTRY: Categories 20-2620 Computer and Electronic Establishments (#) - 1 9 10 7 27
Appliance Employment (#) - (D) 121 148 103 372 Demanufacturers Annual Payroll ($1,000) - (D) 1,884 2,305 1,604 5,793
Receipts ($1,000) - (D) 11,052 13,518 9,408 33,978 Throughput (1,000 tons) - - - - - -
21 Motor Vehicle Parts Establishments (#) 19 40 117 295 270 741 (used) Employment (#) 162 263 894 2,076 1,889 5,284
Annual Payroll ($1,000) 3,719 4,503 26,357 51,252 43,239 129,069 Receipts ($1,000) 17,862 32,508 105,171 244,662 238,144 638,347 Throughput (1,000 tons) - - - - - -
22 Retail Used Merchandise Establishments (#) 56 137 303 959 670 2,125 Sales Employment (#) 459 651 1,919 1,919 4,834 9,782
Annual Payroll ($1,000) 7,425 9,977 37,865 129,862 69,839 254,968 Receipts ($1,000) 21,352 50,172 155,099 569,026 241,088 1,036,737 Throughput (1,000 tons) - - - - - -
23 Tire Retreaders Establishments (#) 1 9 8 24 76 118 Employment (#) (D) 100 60 175 646 981 Annual Payroll ($1,000) (D) 3,424 1,794 5,233 22,116 32,567 Receipts ($1,000) (D) 5,802 28,259 84,754 56,205 175,020 Throughput (1,000 tons) (D) - - - - -
24 Wood Reuse Establishments (#) 8 1 7 12 19 47 Employment (#) 72 (D) 204 365 577 1,218 Annual Payroll ($1,000) 3,400 (D) 6,848 12,252 19,368 41,868 Receipts ($1,000) 10,200 (D) 20,584 36,830 58,221 125,835 Throughput (1,000 tons) 38 - - - - 38
25 Materials Exchange Establishments (#) - 2 2 2 2 8 Services Employment (#) - 3 4 4 4 15
Annual Payroll ($1,000) - 60 80 50 50 240 Receipts ($1,000) - 113 150 100 100 463 Throughput (1,000 tons) - - - - - -
26 Other Reuse Establishments (#) - 1 - 2 10 13 Employment (#) - (D) - 4 53 57 Annual Payroll ($1,000) - (D) - 50 1,988 2,038 Receipts ($1,000) - (D) - 100 8,248 8,348 Throughput (1,000 tons) - - - - - -
REUSE AND Establishments (#) 84 191 446 1,304 1,054 3,079 REMANUFACTURING Employment (#) 703 1,063 3,202 4,691 8,106 17,765 SUBTOTALS Annual Payroll ($1,000) 14,886 19,214 74,828 201,004 158,204 468,135
Receipts ($1,000) 53,161 92,950 320,315 948,990 611,414 2,026,830
GRAND TOTALS Establishments (#) 175 1,434 2,018 3,948 3,803 11,378 Recycling, Reuse, & Employment (#) 1,880 4,544 13,905 32,240 52,316 104,885 Remanufacturing Annual Payroll ($1,000) 56,968 130,557 497,549 1,386,185 2,170,657 4,241,915
Receipts ($1,000) 346,057 805,710 3,168,308 10,055,608 20,565,682 34,941,365
Estimates of Total Recycling

Northeast Recycling Council, Inc. Recycling Economic Information Study Update
Final Report to Northeast Recycling Council, Inc. Page 34 Recycling Economic Information Study Update NERC February 2009 ©
COMPARISON OF RELATIVE SIZE OF THE RECYCLING INDUSTRY (SUPPLY SIDE) AND RECYCLING RELIANT (DEMAND SIDE) INDUSTRIES Table 6, below, summarizes the number of establishments, total employment, payroll, and gross receipts for the Recycling Industries (Supply Side), Recycling Reliant Industries (Demand Side) and the Reuse and Remanufacturing Industries. As would be expected, the Recycling Industries comprise the bulk of establishments (63 percent), followed by Reuse and Remanufacturing Industries. Recycling Reliant industries comprise a relatively small percent of total establishments (9 percent) but are the largest employer (53 percent), and are the largest source of payroll and gross receipts (63 and 61 percent, respectively). Table 6 Comparison of Recycling, Recycling Reliant, and Reuse and Remanufacturing Industries (Establishments, Employment, Payroll, and Gross Receipts)
Economic Data DE ME MA NY PA All 5 States %EstablishmentsRecycling Industry 73 1,201 1,381 2,392 2,265 7,313 64%Reliant on Recycling 18 42 192 251 484 986 9%Reuse / Remanufacturers 84 191 446 1,304 1,054 3,079 27%
Total: 175 1,434 2,018 3,948 3,803 11,378 100%
EmploymentRecycling Industry 632 2,096 5,452 13,485 10,171 31,837 30%Reliant on Recycling 545 1,385 5,252 14,063 34,039 55,283 53%Reuse / Remanufacturers 703 1,063 3,202 4,691 8,106 17,765 17%
Total: 1,880 4,544 13,905 32,240 52,316 104,885 100%
Annual Payroll ($1,000)Recycling Industry $17,725 $54,741 $188,972 $502,031 $326,711 $1,090,181 26%Reliant on Recycling $24,356 $56,602 $233,749 $683,150 $1,685,742 $2,683,599 63%Reuse / Remanufacturers $14,886 $19,214 $74,828 $201,004 $158,204 $468,135 11%
Total: $56,968 $130,557 $497,549 $1,386,185 $2,170,657 $4,241,915 100%
Receipts ($1,000)Recycling Industry $199,401 $359,765 $1,279,228 $3,820,301 $5,951,010 $11,609,704 33%Reliant on Recycling $93,496 $352,995 $1,568,764 $5,286,317 $14,003,259 $21,304,831 61%Reuse / Remanufacturers $53,161 $92,950 $320,315 $948,990 $611,414 $2,026,830 6%
Total: $346,057 $805,710 $3,168,308 $10,055,608 $20,565,682 $34,941,365 100%

Northeast Recycling Council, Inc. Recycling Economic Information Study Update
Final Report to Northeast Recycling Council, Inc. Page 35 Recycling Economic Information Study Update NERC February 2009 ©
Comparison with 2000 Report As discussed above, it is difficult to draw direct comparisons between the economic data presented in the 2000 Report and this Study Update for three primary reasons:
• Materials values have changed significantly. The year that materials’ prices were based on for the 2000 Report is not known. In 2007 (the year used for material prices for this Study Update), materials prices were at an historic high.
• There have been significant changes in methodology between the two reports.
• The differences between business classifications under SIC versus NAICS do not allow
for direct time series comparisons between pre-1997 economic census data and post-1997 data. The 2000 Report is based primarily on 1992 economic census data, or updates to the 1992 data through 1996. It is therefore, pre-1997 data, whereas this report is based on the 2002 economic census and/or updates through 2006.
Given these caveats concerning direct comparisons, some general comparisons can be made based on a review of the data and the Project Team’s professional observations of the recycling industry. Impact of Export - There has been concern by the Participant States that the increase in export of secondary materials, and the decline in manufacturing in the United States, would adversely impact on the Recycling Reliant Industries. A general observation is that the Recycling Reliant Industries have not shrunk as significantly as one would have expected. This is due, in part, to the resurgence in steel production over the past ten years. The one exception is clearly Sector 11 (Paper and Paperboard Mills) where the number of mills using recycled paper has shrunk from 118 to 68 over the past ten years. This is the result of the closure of a number of older mills in the Northeast, with production shifting to newer mills in the Southeast and in Canada, combined with the increased demand, and price, for lower quality secondary fiber by newer mills in Asia with the capacity to process more highly contaminated feedstock. Conversely, if exports of recycled materials had not increased and new demand had been met through increased manufacturing capacity in the Northeast, there would have been greater growth than actually occurred. Jobs - As would be expected the number of jobs reported in this Study Update are about one-half of those reported in the 2000 Report, this despite the fact that jobs in the recycling collection industry have increased over the 2000 Report due both to the methodology used in this update, and to increased numbers of recycling collection programs. While it is plausible that some job loss is due to increased mechanization and productivity, it is likely that the largest single factor affecting the numbers reported in this study is the change in methodology which allocates employment based on the percent of secondary material used in the Recycling Reliant Industries, rather than a reflection of actual job loss. Municipal and Private Collection - In general, for both municipal and private collection programs, employment and payroll are up significantly. This is probably due to a combination of new investment in recycling collection programs and a more aggressive attempt by the Project Team to quantify collection costs and revenues.

Northeast Recycling Council, Inc. Recycling Economic Information Study Update
Final Report to Northeast Recycling Council, Inc. Page 36 Recycling Economic Information Study Update NERC February 2009 ©
Organics - As with recyclables collection, organics management is up across the board. In this case it is probably due to investments by state and local governments, coupled with significant investments by the private sector driven by yard waste bans and increased demand for compost and mulch.18 Materials Recovery Facilities - In general this area has remained relatively stable. While there has been some growth, it is not significant except for in New York. The Project Team relied on a purchased data base which we believe to be accurate, and does not have an explanation for the apparent growth in MRFs in New York State. Plastics Manufacturing - There are significant declines in the figures reported in this sector, but that is due to a significant change in methodology, not to a decline in the amount of PCR resin actually used. The Project Team believes that the use of PCR resin has increased in the past ten years as more manufacturers’ source recycled resin; especially as virgin resin prices increased in the past several years. The 2000 Report assumed 84 percent of “converters” used recycled PCR, and did not adjust down for virgin resin use. The Project Team assumed most plastic manufacturers do not use recycled PCR resin, and instead built data from surveys of known PCR users and allocated economic data based on the percent of PCR resin used. The Project Team believes this to be a much more accurate portrayal of the actual economic activity associated with recycled plastic resin use. Pavement Mix Producers - There are large increases over the previous study. This is probably due to better data combined with an increased use of recycled asphalt in the past ten years as RAP has become accepted by highway engineers and highway specifications have allowed an increase in the percent RAP in new asphalt paving. Steel Mills - The number of establishments has held steady in New York and Pennsylvania. Employment is down but payroll is up slightly. Gross receipts are way up due to much higher commodity prices. Higher steel prices mask the change in methodology which would otherwise have reported significantly reduced gross receipts. Reuse and Remanufacturing - It is difficult to obtain accurate data on this sector. Therefore the estimate of economic activity is based primarily on survey data. However, even a significant increase in the number of establishments would not impact total economic activity appreciably because of low wages and gross receipts. Data from the economic census has been reduced significantly because pawn shops are no longer counted in the reuse retail merchandise industry. Recommendations for Future Studies RETURN TO VALUE ADDED CALCULATION The Project Team believes that a more accurate assessment of the contribution of the recycling and recycling reliant industry to the economy of the Northeast would be based on a value added assessment for the demand side industries. This is the approach that was taken in the 1994 Report. In essence, this would subtract the input price for recycled scrap when calculating receipts. 18 The increased investment has included new investments in biomass boilers capable of burning ground C&D wood. These establishments are not included in this Study Update, but should be considered for inclusion in future studies.

Northeast Recycling Council, Inc. Recycling Economic Information Study Update
Final Report to Northeast Recycling Council, Inc. Page 37 Recycling Economic Information Study Update NERC February 2009 ©
A return to value added calculations for the demand side industries would provide benefits in two areas. First, it would allow an estimation of the role of the recycling industry as a percent of GDP. Second, and more importantly, it would allow future comparisons of the recycling industry that are not masked by large changes in commodity values – because these commodity values would be incorporated into the input price for the demand side industries. Because gross receipts were used in the 2000 Report, and are reported in this report, the next update should report both gross receipts and value added data to ease the transition to value added reporting. CONDUCT UPDATES IN SYNC WITH RELEASE OF MOST RECENT ECONOMIC CENSUS DATA Both the 2000 Report and this Study Update were forced to use relatively old Economic Census data because the most recent census data were not yet available. The Economic Census is currently conducted in the second and seventh year of each ten year period, but is typically not released for 18 months to two years after completion of the survey. BE EXPLICIT ABOUT THE YEAR IN WHICH THE MATERIALS VALUES ARE REPORTED Because of the wide variations in commodity prices, it is critical that the year used for the materials prices is explicitly reported in the report, together with a graph of recycled materials prices for that year as compared to historical prices, including prices in the past report year. However, it should be noted that this is inherently difficult because the most recent year may only be used for those sectors where census data are not available, leading to more then one year used in each Study Update. CONTINUE TO ALLOCATE BASED ON RECYCLED MATERIAL INPUT The Project Team believes that it is critical that future reports continue to allocate employment, payroll, and receipts based on the percent of input of recycled material to the demand side industries. MAINTAIN STATE-WIDE DATABASES The Project Team was hampered by the lack of quality databases of recycling industries and demand side industries. The database developed during this report should be maintained and updated periodically by each Participant State to assure continuity in future updates and reduce the cost of compiling the updates. CONSIDER REPORTING REQUIREMENTS Participating states should consider introducing legislation requiring that all brokers, processors, and demand side users report annually on quantities of recyclables handled by material type. This reporting requirement would not only improve the accuracy of the Recycling Economic Information Studies, but also of state recycling rate calculations.

Northeast Recycling Council, Inc. Recycling Economic Information Study Update
Final Report to Northeast Recycling Council, Inc. Page 38 Recycling Economic Information Study Update NERC February 2009 ©
PART III. Indirect and Induced Impacts
Introduction As in the 2000 Report, the Project Team has estimated indirect and induced economic impacts associated with the direct economic activity reported for each sector in Table 5, above. The estimates were completed for each participant state by Dr. Steven Deller at the University of Wisconsin using the IMPLAN model19 and the direct economic coefficients reported in Table 5. Because this report was prepared to provide an update of the 2000 Report, the description of Input/Output models, and the use and limitation of the results have been excerpted from the 2000 Report,20 from a detailed article on IMPLAN,21 and from a report prepared by Steven Deller.22 Input/Output Modeling Process and Limitations The most common and widely accepted methodology for measuring the total economic impact of a firm or industry in a given geographic area is Input/Output (I/O) analysis. I/O analysis is a mathematical model developed by Wassily Leontief (1905 – 1999) to express relationships between sectors of an economy in a chosen geographic area.23 I/O models are used descriptively to show the relative importance to the economy of a business, industry, or sector (e.g., paper production), or to predict the economic impact on a region from alternative actions (e.g., construction of a new paper mill, expanding the existing paper mill, or closing the existing mill). An I/O model details the sales and purchases of goods and services between all sectors of the economy in a geographic area for a given period of time. The activities of all economic agents (industry, government, households) are divided into production sectors. The transactions between the sectors are measured in terms of dollars and segmented into two broad categories: non-basic, which includes transactions between local industries, households, and other institutions, and basic transactions between industries, households, and other institutions outside the economy being modeled (i.e., imports). One can think of an I/O model as a large spreadsheet of the economy. Figure 1, below, presents a simplified example of an I/O model for a paper mill located in one of the Participant States, purchasing some of its inputs from recycling industries, households, and the transport and engineering sectors within the region, and purchasing other inputs from outside of the region. The columns represent purchasing agents in the economy. For example, the MRF in
19 http://www.economics.nrcs.usda.gov/technical/implan/implanmodel.html 20Final Report, Recycling Economic Information Study, Prepared for the Northeast Recycling Council, R.W. Beck, June 2000, pages 5.1 – 5.5. 21 The Numbers Factory, Twin Cities Business Newsletter, February, 2008, Sara Aase. 22 Study of the Impact of Cooperatives on the US Economy, Draft Report, Steven Deller, University of Wisconsin/Extension, Madison, WI. 23 Leontief won the Nobel Memorial Prize in Economic Sciences for his development of this model.

Northeast Recycling Council, Inc. Recycling Economic Information Study Update
Final Report to Northeast Recycling Council, Inc. Page 39 Recycling Economic Information Study Update NERC February 2009 ©
Figure 1 purchases commingled waste paper from private and government collection programs and from brokers within the region, and also imports some waste paper from outside of the region. The MRF also purchases labor from households in the region, and services (e.g., engineering, equipment repair, fuel) from within the region and outside of the region. The greater the amount of purchases made from within the region, the larger the multipliers. The greater the purchase of imports from outside of the region, the lower the multipliers. The rows of the spreadsheet represent agents that are selling in the economy. These agents include industries selling goods and services to other industries, households selling labor to the industries in the region, and governments, and consumers outside of the region purchasing the outputs of the industries within the region. The latter represents exports out of the economy. Within the terminology of input-output modeling, this “spreadsheet of the economy” is referred to as a transactions table.
Figure 1
Simplified I/O Table (For Illustration Purposes Only)
Production Sectors Final Demand Total/OutputProcessingSectors Collection Broker MRF Transport Mill Services HH Exports
Collection 0 10 20 1 2 1 34
Broker 0 5 2 0 30 0 10 90 137
MRF 0 0 0 0 10 10 0 70 90
Transport 20 10 15 2 10 5 5 30 97
Mill 0 0 1 0 0 2 1 200 204
Services 30 10 10 20 25 10 15 15 135
HH (Labor) 30 20 30 20 40 15 10 20 185
Imports 20 10 10 10 25 10 20 0 105
Total/Inputs 100 55 68 52 140 52 61 425 953 INPUT-OUTPUT MULTIPLIERS Using linear algebra to manipulate the matrix represented in Figure 1, it is possible to compute a unique multiplier for each sector in the economy. These multipliers can be used to estimate the economic impact of changes in the local economy associated with a change in one sector of the economy. In addition, the multipliers can be used to identify the degree of structural interdependence between different sectors of the economy.

Northeast Recycling Council, Inc. Recycling Economic Information Study Update
Final Report to Northeast Recycling Council, Inc. Page 40 Recycling Economic Information Study Update NERC February 2009 ©
INITIAL (DIRECT), INDIRECT, AND INDUCED EFFECTS The construction of the multipliers allows the user to decompose the multiplier effect into three parts: the initial (or direct) impact, the indirect, and the induced effects. The direct economic activity of each recycling, recycling reliant and remanufacturing and reuse sector was estimated in Part II of this Study Update, and is presented in Table 5, above. In order to produce outputs (the direct economic activity), the firm or industry must purchase inputs. The inputs take two forms: (1) purchases from other businesses, and (2) labor. Purchases from other businesses within the region being modeled create what is referred to as the indirect effect; labor spending income within the region being modeled create the induced effect. As the 2000 Report states24: “Indirect Effects measure the value of additional economic demands that the direct firms place on the supplying industries in the region. When firms produce goods or conduct business or when public entities provide public goods or services, they must make many purchases. Some of these are from suppliers in the area. Some are not. Public utilities, communications systems, fuel, wholesale goods and services, manufactured goods, financial and legal services, raw and processed commodities and a variety of professional services are necessary to produce the direct values described above.” “Induced effects accrue when workers in the direct and indirect industries spend their earnings on goods and services in the region. Induced effects can also be called household effects, and the terms are often used interchangeably. When workers in the direct and indirect industries purchase goods and services for household consumption, they, in turn, stimulate another layer of the economy. Most induced activity accrues to retail, services and finance, insurance and housing spending. Because employment is stimulated in these industries as well, their demands for inputs increase, yielding an additional round of indirect purchases and additional rounds of induced activity. The I/O models solve for these iterative rounds of transactions until all of the possible inter-industrial transactions have been accumulated.” “Total economic effects are the sum of direct, indirect, and induced effects. The term multiplier or multiplier effect is frequently used when referring to the economic effects or economic impacts. There are different kinds of multipliers – this study reports two types. The Type I multiplier identifies the value of direct and indirect purchases from its suppliers in the region – relative to the value of only the direct transactions. The Type II multiplier identifies the value of all economic transactions (direct, indirect, and induced) that are stimulated in the economy by an industry under study, including the personal spending of employees throughout the supply chain whose economic activity is apportioned to the industry, relative to the value of only the direct transactions.” The relationship of direct to indirect, and to induced, effects is shown on the next page in Figure 2.
24 Recycling Economic Information Study, R.W. Beck, Inc., June, 2000, page 5-5.

Northeast Recycling Council, Inc. Recycling Economic Information Study Update
Final Report to Northeast Recycling Council, Inc. Page 41 Recycling Economic Information Study Update NERC February 2009 ©
Figure 2
Relationship of Direct, Indirect, and Induced Effects
Ideally, estimates of what percent of a firm (or industry’s) inputs are purchased locally, and at what cost, are developed from local industry surveys. However, these surveys are costly, time consuming, and often difficult to complete because of the confidential nature of the business data which must be collected. As a consequence, most I/O analyses are completed using national or regional industrial surveys, with the assumption being made that the local industries behave in a similar way. While the majority of economic transactions for much of the recycling and especially reuse industry continue to occur within the local region, it should be noted that several of the sectors included in this analysis rely on recyclable commodities that can and are purchased throughout the national and even global economy (e.g., steel mills). No attempt was made in this study to develop state and industry-specific estimates of local versus imported inputs; rather, I/O model defaults were used. MODELING SYSTEM The input-output modeling system used in this report is the IMPLAN Model, originally developed by the USDA Forest Service. It is currently one of the most widely used I/O models in the United States. To accommodate demand for the model, the Forest Service privatized IMPLAN which is now operated by the Minnesota IMPLAN Group (MIG). In addition to updating and improving the databases and software, MIG holds regular training sessions, biannual user conferences and maintains a collection of hundreds of papers that make use of IMPLAN. MIG annually updates the model using aggregated production, employment and trade data from local, regional, and national sources, including the U.S. Census Bureau County Business Patterns report and the U.S. Bureau of Labor Statistics annual report called Covered Employment and Wages.
Direct Effects: Specific Industry
Indirect Effects: Supplying Industries
Induced Effects: Household Spending by
Direct and Indirect Workers

Northeast Recycling Council, Inc. Recycling Economic Information Study Update
Final Report to Northeast Recycling Council, Inc. Page 42 Recycling Economic Information Study Update NERC February 2009 ©
LIMITATIONS There are five important limitations to the use of the IMPLAN model (or any other I/O model) which must be recognized by the Participant States when reporting total economic impacts from the recycling, recycling reliant, and reuse and remanufacturing industries. First and foremost, the sum of indirect and induced economic activity across all sectors cannot be added to the sum of direct economic activity across all sectors in Table 5 to make statements about the total economic impact of the “recycling industry” in a state. That is because the indirect and induced estimates for the recycling reliant industries include inputs from the recycling industries supplying the recycled material, which has already been accounted for in Table 5 (direct impacts). Therefore summing the indirect and induced impacts, together with the direct economic activity, results in significant double counting. The illustrative transaction table presented above (figure 1) clearly demonstrates, for example, that the paper mill is purchasing services, either directly or indirectly from the collection company (or municipality), the broker (or wholesaler) and the MRF, which have already been accounted for in Table 5. The 2000 Report draws a similar conclusion when it states25: “Economic values are most accurate at the (individual) business category level. Summing totals by groups of recycling or reuse activity for the state as a whole (as has been done in the tables) results in some degree of duplicated accounting of economic activity. This is true for any set of industrial assessments in any output modeling scenario – it is not a problem with recycling per se, nor with this study, but arises simply because of the many business categories that are included in this study (emphasis added)… A large portion of the raw commodity processor’s (or supply side industries) direct sales is already reflected in the finished good (or demand side) industry’s input purchases.” “Based on other modeling experience, it is believed that aggregation bias may have inflated the subtotals and totals by up to 15 percent, and possibly higher.” It is the Project Team’s believe that the doubling counting, when summing all sectors, may be significantly greater then 15 percent, and as such this Study Update does not sum the indirect and induced effects with the direct economic impacts, instead simply reporting the induced and indirect effects for each sector for use by the Participant States in assessing future changes in any recycling or recycling reliant sector.
25 Ibid, page 5-17.
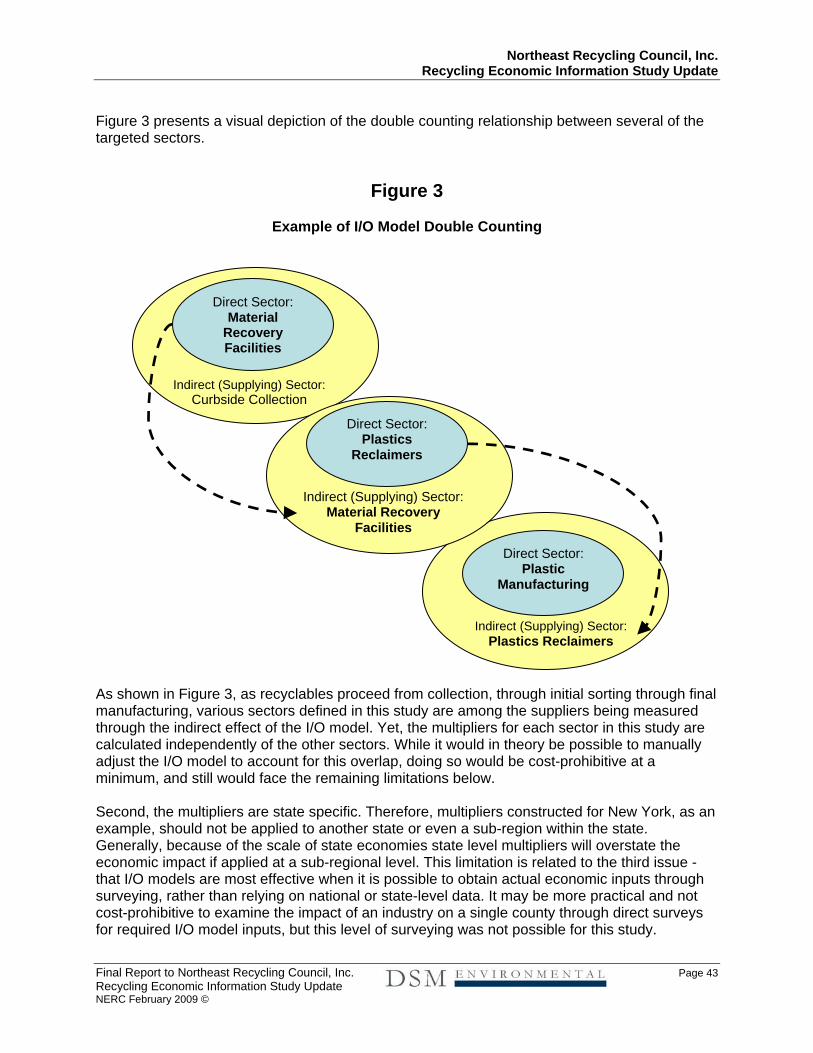
Northeast Recycling Council, Inc. Recycling Economic Information Study Update
Final Report to Northeast Recycling Council, Inc. Page 43 Recycling Economic Information Study Update NERC February 2009 ©
Figure 3 presents a visual depiction of the double counting relationship between several of the targeted sectors.
Figure 3
Example of I/O Model Double Counting
As shown in Figure 3, as recyclables proceed from collection, through initial sorting through final manufacturing, various sectors defined in this study are among the suppliers being measured through the indirect effect of the I/O model. Yet, the multipliers for each sector in this study are calculated independently of the other sectors. While it would in theory be possible to manually adjust the I/O model to account for this overlap, doing so would be cost-prohibitive at a minimum, and still would face the remaining limitations below. Second, the multipliers are state specific. Therefore, multipliers constructed for New York, as an example, should not be applied to another state or even a sub-region within the state. Generally, because of the scale of state economies state level multipliers will overstate the economic impact if applied at a sub-regional level. This limitation is related to the third issue - that I/O models are most effective when it is possible to obtain actual economic inputs through surveying, rather than relying on national or state-level data. It may be more practical and not cost-prohibitive to examine the impact of an industry on a single county through direct surveys for required I/O model inputs, but this level of surveying was not possible for this study.
Direct Sector: Plastic
Manufacturing
Indirect (Supplying) Sector: Plastics Reclaimers
Direct Sector: Material
Recovery Facilities
Indirect (Supplying) Sector: Curbside Collection
Direct Sector: Plastics
Reclaimers
Indirect (Supplying) Sector:Material Recovery
Facilities
Northeast Recycling Council, Inc. Recycling Economic Information Study Update
Final Report to Northeast Recycling Council, Inc. Page 44 Recycling Economic Information Study Update NERC February 2009 ©
Third, the I/O coefficients used in the IMPLAN model are based in part on U.S. Census data, including the County Business Pattern data. However, as the Project Team learned during development of the direct economic impact data, County Business Pattern data are often suppressed, even at the state level because of confidentiality issues. Therefore, the multipliers used in the IMPLAN model may be based on national (or multi-state) data, which make it difficult to apply to state or regional data. Fourth, the extent of imports and exports is critical to the size of the multipliers – the greater the extent of import and export, the lower the multiplier effect. Data on imports and exports of recyclable materials to/from the recycling reliant industries were not collected as part of this study. While this limitation may not have been as important to the results of the 2000 Report, it can be reasonably asserted that the recycling industry in 2008 has become much more a part of the global commodities market and that imports and exports play a greater role in recycling among the Participant States in this study. Therefore it is difficult to know whether the multipliers used are of the correct magnitude – other than to judge their relative size compared to typical multipliers. Fifth, and finally, while IMPLAN has developed multipliers for over 500 sectors of the economy, these sectors do not necessarily include all of the sectors used in this report. For example, while the Census Bureau has reasonably captured the “tire retread” industry, there are no precise industry sectors for “plastics manufacturers that use secondary resin as a feedstock” or “other recycling processors and manufacturers.” For this reason it was necessary to first attempt to match the recycling sectors to the closest sector for which IMPLAN had multipliers, and then to manipulate the multipliers where they appeared to be out of the range of the expected values. EFFECT ON STATE AND FEDERAL GOVERNMENT TAX REVENUES Because of the double counting issues associated with application of the I/O analysis to the direct economic impacts, no assessment of government revenues has been made as part of this analysis. In general, the 2000 Report showed “own-source” state government revenues equal to roughly 4 to 4.5 percent of total gross receipts. Assuming that some double counting was occurring in the 2000 Report, it is likely that a Participant State could assume own-source government revenues in the range of 3 – 3.5 percent of gross receipts as a reasonable estimate of government revenues generated by recycling, recycling reliant, and reuse and remanufacturing industries. Results Three tables are presented for each of the Participant State. Multipliers, and the resulting indirect, induced, and total impacts for each sector are presented, divided into a table for the recycling industries, a table for the recycling reliant industries, and a table for the reuse and remanufacturing industries. No totals for groups of industries are presented to eliminate double counting of the results. These tables can be used by the Participant States to evaluate the potential impacts of changes in any sector on the regional economy of the state in which it is located. For example, the Commonwealth of Massachusetts could assess the total economic impact associated with the construction of a new single stream MRF (Sector 4) if data were available on expected employment, payroll, and gross receipts for the new MRF by using the indirect and

Northeast Recycling Council, Inc. Recycling Economic Information Study Update
Final Report to Northeast Recycling Council, Inc. Page 45 Recycling Economic Information Study Update NERC February 2009 ©
induced multipliers to estimate the total economic impact of operating the new MRF. Similarly, Pennsylvania could assess the total economic impact of closure of a steel mill in a region using data on the mill’s employment, payroll, and receipts, and the indirect and induced multipliers. It should be noted that the multipliers run off of the direct impacts in the far left column, which are taken directly from the far right column of Table 5 (Part II) for each state and each sector. Table 7.1a Delaware Indirect and Induced Impacts Sector # and Description Data Type DE MULTIPLIERS IMPACTS
RECYCLING INDUSTRY: DIRECT IMPACTS Indirect Induced
Indirect + Induced Indirect Induced
Indirect + Induced Total
1 Municipal Residential Establishments (#) 2 Curbside and Drop-Off Employment (#) 47 0.3929 0.3274 0.7204 18 15 34 81 Collection Annual Payroll ($1,000) 1,221 0.3623 0.2411 0.6034 442 294 737 1,958
Receipts ($1,000) 8,543 0.3031 0.2112 0.5143 2,589 1,804 4,394 12,937 2 Private Residential and Establishments (#) 21
Commercial Collection Employment (#) 19 0.3929 0.3274 0.7204 7 6 14 33 Annual Payroll ($1,000) 870 0.3623 0.2411 0.6034 315 210 525 1,396 Receipts ($1,000) 4,444 0.3031 0.2112 0.5143 1,347 939 2,285 6,729
3 Compost and Misc. Establishments (#) 28 Organics Producers Employment (#) 217 0.0046 0.0964 0.1010 1 21 22 239
Annual Payroll ($1,000) 5,635 0.0148 0.1851 0.1999 83 1,043 1,126 6,761 Receipts ($1,000) 20,003 0.0425 0.5486 0.5911 851 10,973 11,824 31,826
4 Materials Recovery Establishments (#) 2 Facilities (MRFs) Employment (#) 26 0.3929 0.3274 0.7204 10 9 19 45
Annual Payroll ($1,000) 528 0.3623 0.2411 0.6034 191 127 319 846 Receipts ($1,000) 2,913 0.3031 0.2112 0.5143 883 615 1,498 4,411
5 Recyclable Material Establishments (#) 19 Wholesalers Employment (#) 248 0.3334 0.4527 0.7861 83 112 195 443
Annual Payroll ($1,000) 7,446 0.2016 0.2126 0.4141 1,501 1,583 3,084 10,530 Receipts ($1,000) 154,498 0.2055 0.2507 0.4562 31,752 38,733 70,486 224,984
14 Plastics Reclaimers Establishments (#) 1 Employment (#) (D)Annual Payroll ($1,000) (D)Receipts ($1,000) (D)

Northeast Recycling Council, Inc. Recycling Economic Information Study Update
Final Report to Northeast Recycling Council, Inc. Page 46 Recycling Economic Information Study Update NERC February 2009 ©
Table 7.1b Delaware Indirect and Induced Impacts Sector # and Description Data Type DE MULTIPLIERS IMPACTS
RECYCLING RELIANT INDUSTRIES: DIRECT IMPACTS Indirect Induced
Indirect + Induced Indirect Induced
Indirect + Induced TOTAL
6 Glass Container Establishments (#) - Manufacturing Plants Employment (#) -
Annual Payroll ($1,000) - Receipts ($1,000) -
7 Glass Product Producers Establishments (#) 1 (other recycled uses) Employment (#) (D)
Annual Payroll ($1,000) (D)Receipts ($1,000) (D)
8 Nonferrous Secondary Establishments (#) - Smelting and Refining Employment (#) - Mills Annual Payroll ($1,000) -
Receipts ($1,000) - 9 Nonferrous Product Establishments (#) -
Producers Employment (#) - Annual Payroll ($1,000) - Receipts ($1,000) -
10 Nonferrous Foundries Establishments (#) - Employment (#) - Annual Payroll ($1,000) - Receipts ($1,000) -
11 Paper and Paperboard Establishments (#) - Mills / Deinked Market Employment (#) - Pulp Producers Annual Payroll ($1,000) -
Receipts ($1,000) - 12 Paper-Based Product Establishments (#) -
Manufacturers Employment (#) - Annual Payroll ($1,000) - Receipts ($1,000) -
13 Pavement Mix Producers Establishments (#) 7 (asphalt and aggregate) Employment (#) 180 0.3567 0.5833 0.9400 64 105 169 349
Annual Payroll ($1,000) 2,400 0.2712 0.2245 0.4957 651 539 1,190 3,590 Receipts ($1,000) 24,750 0.4691 0.1444 0.6136 11,611 3,575 15,186 39,936
15 Plastic Product Manufacturers Establishments (#) 4 Employment (#) 22 0.3858 0.5086 0.8944 8 11 19 41 Annual Payroll ($1,000) 550 0.2843 0.2260 0.5104 156 124 281 831 Receipts ($1,000) 9,900 0.2142 0.1393 0.3536 2,121 1,379 3,500 13,400
16 Rubber Product Establishments (#) 1 Manufacturers Employment (#) (D)
Annual Payroll ($1,000) (D)Receipts ($1,000) (D)
17 Steel Mills Establishments (#) 1 Employment (#) (D)Annual Payroll ($1,000) (D)Receipts ($1,000) (D)
18 Iron and Steel Foundries Establishments (#) - Employment (#) - Annual Payroll ($1,000) - Receipts ($1,000) -
19 Other Recycling Establishments (#) 4 Processors / Employment (#) 19 0.3929 0.3274 0.7204 7 6 14 33 Manufacturers Annual Payroll ($1,000) 256 0.3623 0.2411 0.6034 93 62 154 410
Receipts ($1,000) 546 0.3031 0.2112 0.5143 165 115 281 827

Northeast Recycling Council, Inc. Recycling Economic Information Study Update
Final Report to Northeast Recycling Council, Inc. Page 47 Recycling Economic Information Study Update NERC February 2009 ©
Table 7.1c Delaware Indirect and Induced Impacts Sector # and Description Data Type DE MULTIPLIERS IMPACTS
REUSE AND REMANUFACTURING INDUSTRIES: DIRECT IMPACTS Indirect Induced
Indirect + Induced Indirect Induced
Indirect + Induced TOTAL
20 Computer and Electronic Establishments (#) - Appliance Employment (#) - Demanufacturers Annual Payroll ($1,000) -
Receipts ($1,000) -
21 Motor Vehicle Parts Establishments (#) 19 (used) Employment (#) 162 0.1675 0.2545 0.4220 27 41 68 230
Annual Payroll ($1,000) 3,719 0.1533 0.2035 0.3568 570 757 1,327 5,046 Receipts ($1,000) 17,862 0.2195 0.3003 0.5198 3,921 5,365 9,285 27,147
22 Retail Used Merchandise Establishments (#) 56 Sales Employment (#) 459 0.0670 0.1123 0.1793 31 52 82 541
Annual Payroll ($1,000) 7,425 0.1382 0.2057 0.3439 1,026 1,527 2,554 9,979 Receipts ($1,000) 21,352 0.1952 0.2992 0.4944 4,167 6,389 10,556 31,908
23 Tire Retreaders Establishments (#) 1 Employment (#) (D)Annual Payroll ($1,000) (D)Receipts ($1,000) (D)
24 Wood Reuse Establishments (#) 8 Employment (#) 72 0.4804 0.4724 0.9528 35 34 69 141 Annual Payroll ($1,000) 3,400 0.4102 0.2515 0.6617 1,395 855 2,250 5,650 Receipts ($1,000) 10,200 0.3014 0.1333 0.4348 3,075 1,360 4,435 14,635
25 Materials Exchange Establishments (#) - Services Employment (#) -
Annual Payroll ($1,000) - Receipts ($1,000) -
26 Other Reuse Establishments (#) - Employment (#) - Annual Payroll ($1,000) - Receipts ($1,000) -

Northeast Recycling Council, Inc. Recycling Economic Information Study Update
Final Report to Northeast Recycling Council, Inc. Page 48 Recycling Economic Information Study Update NERC February 2009 ©
Table 7.2a Maine Indirect and Induced Impacts Sector # and Description Data Type ME MULTIPLIERS IMPACTS
RECYCLING INDUSTRY: DIRECT IMPACTS Indirect Induced
Indirect + Induced Indirect Induced
Indirect + Induced Total
1 Municipal Residential Establishments (#) 194 Curbside and Drop-Off Employment (#) 300 0.4724 0.3588 0.8312 142 107 249 549 Collection Annual Payroll ($1,000) 8,749 0.4687 0.3133 0.7819 4,100 2,741 6,841 15,589
Receipts ($1,000) 23,818 0.3590 0.2358 0.5948 8,550 5,616 14,166 37,984 2 Private Residential and Establishments (#) 880
Commercial Collection Employment (#) 868 0.4724 0.3588 0.8312 410 312 722 1,590 Annual Payroll ($1,000) 19,968 0.4687 0.3133 0.7819 9,358 6,255 15,614 35,582 Receipts ($1,000) 38,162 0.3590 0.2358 0.5948 13,699 8,999 22,698 60,860
3 Compost and Misc. Establishments (#) 85 Organics Producers Employment (#) 474 0.0108 0.1295 0.1402 5 61 66 540
Annual Payroll ($1,000) 10,612 0.0185 0.2190 0.2375 196 2,324 2,520 13,133 Receipts ($1,000) 37,023 0.0678 0.6521 0.7199 2,510 24,144 26,654 63,677
4 Materials Recovery Establishments (#) 6 Facilities (MRFs) Employment (#) 34 0.4724 0.3588 0.8312 16 12 28 61
Annual Payroll ($1,000) 722 0.4687 0.3133 0.7819 338 226 565 1,287 Receipts ($1,000) 3,895 0.3590 0.2358 0.5948 1,398 918 2,317 6,212
5 Recyclable Material Establishments (#) 36 Wholesalers Employment (#) 421 0.3085 0.4468 0.7553 130 188 318 739
Annual Payroll ($1,000) 14,690 0.2190 0.2598 0.4787 3,216 3,816 7,033 21,723 Receipts ($1,000) 256,868 0.2295 0.3015 0.5311 58,964 77,457 136,420 393,289
14 Plastics Reclaimers Establishments (#) - Employment (#) - Annual Payroll ($1,000) - Receipts ($1,000) -

Northeast Recycling Council, Inc. Recycling Economic Information Study Update
Final Report to Northeast Recycling Council, Inc. Page 49 Recycling Economic Information Study Update NERC February 2009 ©
Table 7.2b Maine Indirect and Induced Impacts Sector # and Description Data Type ME MULTIPLIERS IMPACTS
RECYCLING RELIANT INDUSTRIES: DIRECT IMPACTS Indirect Induced
Indirect + Induced Indirect Induced
Indirect + Induced TOTAL
6 Glass Container Establishments (#) - Manufacturing Plants Employment (#) -
Annual Payroll ($1,000) - Receipts ($1,000) -
7 Glass Product Producers Establishments (#) - (other recycled uses) Employment (#) -
Annual Payroll ($1,000) - Receipts ($1,000) -
8 Nonferrous Secondary Establishments (#) - Smelting and Refining Employment (#) - Mills Annual Payroll ($1,000) -
Receipts ($1,000) - 9 Nonferrous Product Establishments (#) 1
Producers Employment (#) 182 0.3821 0.7198 1.1019 70 131 201 383 Annual Payroll ($1,000) 5,938 0.2044 0.2667 0.4711 1,214 1,584 2,797 8,736 Receipts ($1,000) 42,672 0.2176 0.3061 0.5236 9,283 13,060 22,344 65,015
10 Nonferrous Foundries Establishments (#) 5 Employment (#) 19 0.3821 0.7198 1.1019 7 14 21 40 Annual Payroll ($1,000) 675 0.2044 0.2667 0.4711 138 180 318 994 Receipts ($1,000) 3,445 0.2176 0.3061 0.5236 749 1,054 1,804 5,249
11 Paper and Paperboard Establishments (#) 6 Mills / Deinked Market Employment (#) 438 0.5797 0.6695 1.2492 254 293 547 985 Pulp Producers Annual Payroll ($1,000) 24,972 0.3365 0.2882 0.6248 8,403 7,198 15,601 40,573
Receipts ($1,000) 197,111 0.2276 0.1964 0.4240 44,855 38,711 83,566 280,677 12 Paper-Based Product Establishments (#) 2
Manufacturers Employment (#) 465 0.5797 0.6695 1.2492 270 311 581 1,046 Annual Payroll ($1,000) 17,438 0.3365 0.2882 0.6248 5,868 5,026 10,894 28,332 Receipts ($1,000) 63,875 0.2276 0.1964 0.4240 14,536 12,545 27,080 90,955
13 Pavement Mix Producers Establishments (#) 23 (asphalt and aggregate) Employment (#) 168 0.4608 0.8638 1.3246 77 145 223 391
Annual Payroll ($1,000) 4,754 0.2292 0.2720 0.5012 1,089 1,293 2,383 7,137 Receipts ($1,000) 2,667 0.2635 0.1642 0.4278 703 438 1,141 3,808
15 Plastic Product Manufacturers Establishments (#) 3 Employment (#) 105 0.4384 0.5265 0.9649 46 55 101 207 Annual Payroll ($1,000) 2,569 0.3135 0.2791 0.5926 805 717 1,522 4,091 Receipts ($1,000) 41,920 0.1749 0.1389 0.3138 7,330 5,822 13,153 55,073
16 Rubber Product Establishments (#) - Manufacturers Employment (#) -
Annual Payroll ($1,000) - Receipts ($1,000) -
17 Steel Mills Establishments (#) - Employment (#) - Annual Payroll ($1,000) - Receipts ($1,000) -
18 Iron and Steel Foundries Establishments (#) 2 Employment (#) 7 0.4601 0.8637 1.3239 3 6 10 17 Annual Payroll ($1,000) 256 0.1918 0.2659 0.4577 49 68 117 373 Receipts ($1,000) 1,305 0.2164 0.3048 0.5212 282 398 680 1,985
19 Other Recycling Establishments (#) - Processors / Employment (#) - Manufacturers Annual Payroll ($1,000) -
Receipts ($1,000) -

Northeast Recycling Council, Inc. Recycling Economic Information Study Update
Final Report to Northeast Recycling Council, Inc. Page 50 Recycling Economic Information Study Update NERC February 2009 ©
Table 7.2c Maine Indirect and Induced Impacts Sector # and Description Data Type ME MULTIPLIERS IMPACTS
REUSE AND REMANUFACTURING INDUSTRIES: DIRECT IMPACTS Indirect Induced
Indirect + Induced Indirect Induced
Indirect + Induced TOTAL
20 Computer and Electronic Establishments (#) 1 Appliance Employment (#) (D)Demanufacturers Annual Payroll ($1,000) (D)
Receipts ($1,000) (D)21 Motor Vehicle Parts Establishments (#) 40
(used) Employment (#) 263 0.3085 0.4468 0.7553 81 117 198 461 Annual Payroll ($1,000) 4,503 0.2190 0.2598 0.4787 986 1,170 2,156 6,659 Receipts ($1,000) 32,508 0.2295 0.3015 0.5311 7,462 9,802 17,265 49,772
22 Retail Used Merchandise Establishments (#) 137 Sales Employment (#) 651 0.0595 0.1131 0.1727 39 74 112 763
Annual Payroll ($1,000) 9,977 0.1369 0.2453 0.3822 1,365 2,448 3,813 13,790 Receipts ($1,000) 50,172 0.2010 0.3613 0.5624 10,086 18,128 28,215 78,387
23 Tire Retreaders Establishments (#) 9 Employment (#) 100 0.5345 0.3948 0.9292 53 39 93 193 Annual Payroll ($1,000) 3,424 0.6402 0.3489 0.9892 2,192 1,195 3,386 6,810 Receipts ($1,000) 5,802 0.2490 0.1299 0.3789 1,444 754 2,198 8,000
24 Wood Reuse Establishments (#) 1 Employment (#) (D)Annual Payroll ($1,000) (D)Receipts ($1,000) (D)
25 Materials Exchange Establishments (#) 2 Services Employment (#) 3 0.3962 0.3483 0.7445 1 1 2 5
Annual Payroll ($1,000) 60 0.3242 0.2855 0.6097 19 17 37 97 Receipts ($1,000) 113 0.1374 0.1233 0.2607 15 14 29 142
26 Other Reuse Establishments (#) 1 Employment (#) (D)Annual Payroll ($1,000) (D)Receipts ($1,000) (D)

Northeast Recycling Council, Inc. Recycling Economic Information Study Update
Final Report to Northeast Recycling Council, Inc. Page 51 Recycling Economic Information Study Update NERC February 2009 ©
Table 7.3a Massachusetts Indirect and Induced Impacts Sector # and Description Data Type MA MULTIPLIERS IMPACTS
RECYCLING INDUSTRY: Indirect InducedIndirect + Induced Indirect Induced
Indirect + Induced Total
1 Municipal Residential Establishments (#) 334 Curbside and Drop-Off Employment (#) 431 0.5732 0.4945 1.0677 247 213 460 891 Collection Annual Payroll ($1,000) 21,162 0.5261 0.3536 0.8797 11,133 7,483 18,616 39,779
Receipts ($1,000) 54,542 0.4297 0.3094 0.7391 23,438 16,874 40,312 94,854 2 Private Residential and Establishments (#) 597
Commercial Collection Employment (#) 1,284 0.5732 0.4945 1.0677 736 635 1,371 2,656 Annual Payroll ($1,000) 36,139 0.5261 0.3536 0.8797 19,012 12,778 31,791 67,929 Receipts ($1,000) 81,442 0.4297 0.3094 0.7391 34,997 25,197 60,194 141,636
3 Compost and Misc. Establishments (#) 267 Organics Producers Employment (#) 1,408 0.0091 0.2060 0.2151 13 290 303 1,710
Annual Payroll ($1,000) 39,776 0.0142 0.2354 0.2497 567 9,365 9,931 49,707 Receipts ($1,000) 111,906 0.0370 0.6825 0.7195 4,141 76,373 80,514 192,420
4 Materials Recovery Establishments (#) 10 Facilities (MRFs) Employment (#) 286 0.5732 0.4945 1.0677 164 141 305 591
Annual Payroll ($1,000) 11,497 0.5261 0.3536 0.8797 6,049 4,065 10,114 21,611 Receipts ($1,000) 33,221 0.4297 0.3094 0.7391 14,276 10,278 24,554 57,775
5 Recyclable Material Establishments (#) 154 Wholesalers Employment (#) 1,753 0.4541 0.5732 1.0273 796 1,005 1,801 3,554
Annual Payroll ($1,000) 66,161 0.3306 0.3081 0.6387 21,872 20,387 42,259 108,420 Receipts ($1,000) 874,083 0.3103 0.3371 0.6474 271,242 294,625 565,867 1,439,950
14 Plastics Reclaimers Establishments (#) 19 Employment (#) 290 1.0676 0.8543 1.9219 310 248 557 847 Annual Payroll ($1,000) 14,237 0.9935 0.4643 1.4578 14,144 6,610 20,754 34,990 Receipts ($1,000) 124,033 0.4901 0.2256 0.7158 60,793 27,986 88,779 212,811

Northeast Recycling Council, Inc. Recycling Economic Information Study Update
Final Report to Northeast Recycling Council, Inc. Page 52 Recycling Economic Information Study Update NERC February 2009 ©
Table 7.3b Massachusetts Indirect and Induced Impacts Sector # and Description Data Type MA MULTIPLIERS IMPACTS
RECYCLING RELIANT INDUSTRIES: DIRECT IMPACTS Indirect Induced
Indirect + Induced Indirect Induced
Indirect + Induced TOTAL
6 Glass Container Establishments (#) 1 Manufacturing Plants Employment (#) (D)
Annual Payroll ($1,000) (D)Receipts ($1,000) (D)
7 Glass Product Producers Establishments (#) 2 (other recycled uses) Employment (#) 11 0.6394 0.6287 1.2681 7 7 14 25
Annual Payroll ($1,000) 525 0.5880 0.3768 0.9648 309 198 507 1,032 Receipts ($1,000) 525 0.4196 0.2526 0.6722 220 133 353 878
8 Nonferrous Secondary Establishments (#) 9 Smelting and Refining Employment (#) 554 0.4152 0.4926 0.9077 230 273 503 1,057 Mills Annual Payroll ($1,000) 30,419 0.4105 0.3381 0.7486 12,486 10,285 22,771 53,190
Receipts ($1,000) 186,106 0.3550 0.3058 0.6608 66,066 56,907 122,974 309,080 9 Nonferrous Product Establishments (#) 11
Producers Employment (#) 433 0.4152 0.4926 0.9077 180 213 393 826 Annual Payroll ($1,000) 15,672 0.4105 0.3381 0.7486 6,433 5,299 11,732 27,403 Receipts ($1,000) 260,500 0.3550 0.3058 0.6608 92,475 79,656 172,131 432,630
10 Nonferrous Foundries Establishments (#) 37 Employment (#) 612 0.4152 0.4926 0.9077 254 302 556 1,168 Annual Payroll ($1,000) 22,990 0.4105 0.3381 0.7486 9,437 7,773 17,210 40,200 Receipts ($1,000) 89,110 0.3550 0.3058 0.6608 31,633 27,248 58,881 147,991
11 Paper and Paperboard Establishments (#) 15 Mills / Deinked Market Employment (#) 2,089 0.5918 0.5376 1.1294 1,236 1,123 2,359 4,448 Pulp Producers Annual Payroll ($1,000) 106,018 0.6210 0.3759 0.9969 65,836 39,856 105,692 211,710
Receipts ($1,000) 732,442 0.3391 0.2137 0.5529 248,404 156,530 404,934 1,137,37612 Paper-Based Product Establishments (#) 1
Manufacturers Employment (#) (D)Annual Payroll ($1,000) (D)Receipts ($1,000) (D)
13 Pavement Mix Producers Establishments (#) 44 (asphalt and aggregate) Employment (#) 210 0.6416 1.2566 1.8982 135 264 399 609
Annual Payroll ($1,000) 9,473 0.2528 0.2989 0.5517 2,395 2,831 5,226 14,699 Receipts ($1,000) 61,200 0.1845 0.1986 0.3831 11,292 12,156 23,447 84,647
15 Plastic Product Manufacturers Establishments (#) 27 Employment (#) 620 0.4986 0.5285 1.0271 309 328 637 1,257 Annual Payroll ($1,000) 19,371 0.4873 0.3435 0.8307 9,439 6,653 16,092 35,463 Receipts ($1,000) 134,728 0.2829 0.1734 0.4563 38,119 23,361 61,479 196,207
16 Rubber Product Establishments (#) 13 Manufacturers Employment (#) 151 0.5757 0.4939 1.0696 87 75 162 313
Annual Payroll ($1,000) 4,581 0.6825 0.3888 1.0713 3,126 1,781 4,907 9,488 Receipts ($1,000) 17,317 0.3306 0.1818 0.5124 5,726 3,148 8,873 26,190
17 Steel Mills Establishments (#) - Employment (#) - Annual Payroll ($1,000) - Receipts ($1,000) -
18 Iron and Steel Foundries Establishments (#) 20 Employment (#) 414 0.4756 0.6523 1.1280 197 270 467 881 Annual Payroll ($1,000) 16,650 0.3732 0.3445 0.7177 6,213 5,736 11,949 28,599 Receipts ($1,000) 56,430 0.3380 0.3293 0.6673 19,075 18,583 37,658 94,088
19 Other Recycling Establishments (#) 11 Processors / Employment (#) 134 0.5732 0.4945 1.0677 77 66 143 277 Manufacturers Annual Payroll ($1,000) 6,563 0.5261 0.3536 0.8797 3,453 2,321 5,773 12,336
Receipts ($1,000) 22,969 0.4297 0.3094 0.7391 9,870 7,106 16,976 39,945

Northeast Recycling Council, Inc. Recycling Economic Information Study Update
Final Report to Northeast Recycling Council, Inc. Page 53 Recycling Economic Information Study Update NERC February 2009 ©
Table 7.3c Massachusetts Indirect and Induced Impacts Sector # and Description Data Type MA MULTIPLIERS IMPACTS
REUSE AND REMANUFACTURING INDUSTRIES: DIRECT IMPACTS Indirect Induced
Indirect + Induced Indirect Induced
Indirect + Induced TOTAL
20 Computer and Electronic Establishments (#) 9 Appliance Employment (#) 121 0.5732 0.4945 1.0677 69 60 129 250 Demanufacturers Annual Payroll ($1,000) 1,884 0.5261 0.3536 0.8797 991 666 1,657 3,541
Receipts ($1,000) 11,052 0.4297 0.3094 0.7391 4,749 3,419 8,168 19,220 21 Motor Vehicle Parts Establishments (#) 117
(used) Employment (#) 894 0.1981 0.3101 0.5082 177 277 454 1,348 Annual Payroll ($1,000) 26,357 0.2248 0.2834 0.5082 5,924 7,470 13,394 39,750 Receipts ($1,000) 105,171 0.2920 0.3860 0.6780 30,712 40,593 71,306 176,477
22 Retail Used Merchandise Establishments (#) 303 Sales Employment (#) 1,919 0.0824 0.1369 0.2193 158 263 421 2,340
Annual Payroll ($1,000) 37,865 0.2085 0.2830 0.4916 7,897 10,717 18,614 56,479 Receipts ($1,000) 155,099 0.2652 0.3773 0.6424 41,127 58,515 99,642 254,741
23 Tire Retreaders Establishments (#) 8 Employment (#) 60 0.5757 0.4939 1.0696 35 30 64 124 Annual Payroll ($1,000) 1,794 0.6825 0.3888 1.0713 1,224 697 1,922 3,716 Receipts ($1,000) 28,259 0.3306 0.1818 0.5124 9,343 5,137 14,480 42,739
24 Wood Reuse Establishments (#) 7 Employment (#) 204 0.6268 0.5008 1.1276 128 102 230 434 Annual Payroll ($1,000) 6,848 0.5748 0.3662 0.9410 3,936 2,508 6,444 13,292 Receipts ($1,000) 20,584 0.3234 0.1690 0.4924 6,657 3,479 10,135 30,719
25 Materials Exchange Establishments (#) 2 Services Employment (#) 4 0.7675 0.5886 1.3561 3 2 5 9
Annual Payroll ($1,000) 80 0.5644 0.3665 0.9309 45 29 74 154 Receipts ($1,000) 150 0.1968 0.1433 0.3401 30 21 51 201
26 Other Reuse Establishments (#) - Employment (#) - Annual Payroll ($1,000) - Receipts ($1,000) -

Northeast Recycling Council, Inc. Recycling Economic Information Study Update
Final Report to Northeast Recycling Council, Inc. Page 54 Recycling Economic Information Study Update NERC February 2009 ©
Table 7.4a New York Indirect and Induced Impacts Sector # and Description Data Type NY MULTIPLIERS IMPACTS
RECYCLING INDUSTRY: DIRECT IMPACTS Indirect Induced
Indirect + Induced Indirect Induced
Indirect + Induced Total
1 Municipal Residential Establishments (#) 860 Curbside and Drop-Off Employment (#) 1,555 0.5047 0.3762 0.8809 785 585 1,369 2,924 Collection Annual Payroll ($1,000) 109,094 0.5351 0.3098 0.8449 58,380 33,795 92,175 201,269
Receipts ($1,000) 268,841 0.4263 0.2696 0.6959 114,608 72,472 187,081 455,921 2 Private Residential and Establishments (#) 879
Commercial Collection Employment (#) 3,798 0.5047 0.3762 0.8809 1,917 1,429 3,346 7,143 Annual Payroll ($1,000) 93,529 0.5351 0.3098 0.8449 50,051 28,974 79,024 172,554 Receipts ($1,000) 178,145 0.4263 0.2696 0.6959 75,944 48,023 123,967 302,111
3 Compost and Misc. Establishments (#) 137 Organics Producers Employment (#) 767 0.0077 0.1040 0.1117 6 80 86 853
Annual Payroll ($1,000) 22,518 0.0204 0.2112 0.2316 460 4,756 5,216 27,734 Receipts ($1,000) 66,083 0.0559 0.6027 0.6586 3,697 39,826 43,524 109,607
4 Materials Recovery Establishments (#) 41 Facilities (MRFs) Employment (#) 1,244 0.5047 0.3762 0.8809 628 468 1,096 2,340
Annual Payroll ($1,000) 40,979 0.5351 0.3098 0.8449 21,929 12,695 34,624 75,604 Receipts ($1,000) 166,810 0.4263 0.2696 0.6959 71,112 44,967 116,079 282,889
5 Recyclable Material Establishments (#) 455 Wholesalers Employment (#) 6,732 0.3865 0.4399 0.8264 2,602 2,961 5,563 12,294
Annual Payroll ($1,000) 240,056 0.3362 0.2693 0.6055 80,697 64,656 145,353 385,409 Receipts ($1,000) 3,009,357 0.3129 0.2995 0.6124 941,652 901,426 1,843,078 4,852,434
14 Plastics Reclaimers Establishments (#) 20 Employment (#) 440 1.0397 0.8040 1.8436 457 354 811 1,250 Annual Payroll ($1,000) 17,671 0.8080 0.3648 1.1728 14,278 6,447 20,725 38,396 Receipts ($1,000) 168,681 0.4825 0.2142 0.6966 81,387 36,124 117,511 286,192

Northeast Recycling Council, Inc. Recycling Economic Information Study Update
Final Report to Northeast Recycling Council, Inc. Page 55 Recycling Economic Information Study Update NERC February 2009 ©
Table 7.4b New York Indirect and Induced Impacts Sector # and Description Data Type NY MULTIPLIERS IMPACTS
RECYCLING RELIANT INDUSTRIES: DIRECT IMPACTS Indirect Induced
Indirect + Induced Indirect Induced
Indirect + Induced TOTAL
6 Glass Container Establishments (#) 2 Manufacturing Plants Employment (#) 303 0.6057 0.4953 1.1010 183 150 333 636
Annual Payroll ($1,000) 16,500 0.6084 0.3273 0.9357 10,039 5,400 15,440 31,940 Receipts ($1,000) 67,375 0.4358 0.2213 0.6571 29,360 14,913 44,272 111,647
7 Glass Product Producers Establishments (#) 7 (other recycled uses) Employment (#) 283 0.6057 0.4953 1.1010 171 140 311 594
Annual Payroll ($1,000) 14,140 0.6084 0.3273 0.9357 8,603 4,628 13,231 27,371 Receipts ($1,000) 56,788 0.4358 0.2213 0.6571 24,746 12,569 37,315 94,103
8 Nonferrous Secondary Establishments (#) 25 Smelting and Refining Employment (#) 953 2.0174 1.1336 3.1510 1,922 1,080 3,002 3,955 Mills Annual Payroll ($1,000) 39,473 2.1355 0.7717 2.9071 84,293 30,460 114,752 154,225
Receipts ($1,000) 349,038 0.4232 0.1589 0.5821 147,715 55,465 203,180 552,218 9 Nonferrous Product Establishments (#) 27
Producers Employment (#) 2,378 0.3944 0.4310 0.8253 938 1,025 1,963 4,341 Annual Payroll ($1,000) 112,884 0.3743 0.2794 0.6537 42,247 31,540 73,788 186,672 Receipts ($1,000) 1,150,437 0.3505 0.2764 0.6269 403,228 318,013 721,241 1,871,678
10 Nonferrous Foundries Establishments (#) 53 Employment (#) 1,864 0.3944 0.4310 0.8253 735 803 1,539 3,403 Annual Payroll ($1,000) 90,060 0.3743 0.2794 0.6537 33,705 25,163 58,869 148,929 Receipts ($1,000) 365,180 0.3505 0.2764 0.6269 127,996 100,946 228,942 594,122
11 Paper and Paperboard Establishments (#) 25 Mills / Deinked Market Employment (#) 3,767 0.5387 0.5228 1.0615 2,029 1,969 3,999 7,766 Pulp Producers Annual Payroll ($1,000) 206,411 0.4673 0.3015 0.7688 96,463 62,231 158,694 365,105
Receipts ($1,000) 1,699,767 0.3036 0.2119 0.5155 515,969 360,225 876,194 2,575,961 12 Paper-Based Product Establishments (#) 3
Manufacturers Employment (#) 318 0.5387 0.5228 1.0615 171 166 338 656 Annual Payroll ($1,000) 6,650 0.4673 0.3015 0.7688 3,108 2,005 5,113 11,763 Receipts ($1,000) 47,563 0.3036 0.2119 0.5155 14,438 10,080 24,517 72,080
13 Pavement Mix Producers Establishments (#) 18 (asphalt and aggregate) Employment (#) 200 0.1710 0.2311 0.4021 34 46 80 280
Annual Payroll ($1,000) 9,029 0.1954 0.2658 0.4612 1,764 2,400 4,164 13,194 Receipts ($1,000) 150,000 0.1466 0.1963 0.3430 21,992 29,452 51,444 201,444
15 Plastic Product Manufacturers Establishments (#) 36 Employment (#) 1,059 0.4262 0.3511 0.7773 451 372 823 1,882 Annual Payroll ($1,000) 29,804 0.5842 0.3191 0.9033 17,410 9,512 26,922 56,726 Receipts ($1,000) 194,825 0.2840 0.1375 0.4215 55,337 26,787 82,125 276,950
16 Rubber Product Establishments (#) 12 Manufacturers Employment (#) 143 0.5126 0.3945 0.9071 73 56 130 273
Annual Payroll ($1,000) 4,352 0.6679 0.3357 1.0036 2,907 1,461 4,368 8,720 Receipts ($1,000) 16,451 0.3232 0.1586 0.4818 5,317 2,609 7,925 24,376
17 Steel Mills Establishments (#) 12 Employment (#) 1,969 1.9531 0.9862 2.9393 3,846 1,942 5,789 7,758 Annual Payroll ($1,000) 120,754 1.7415 0.5873 2.3288 210,296 70,914 281,210 401,964 Receipts ($1,000) 1,078,156 0.4463 0.1490 0.5954 481,233 160,666 641,899 1,720,055
18 Iron and Steel Foundries Establishments (#) 17 Employment (#) 642 0.4057 0.3755 0.7812 260 241 501 1,143 Annual Payroll ($1,000) 24,030 0.5227 0.3160 0.8387 12,561 7,592 20,154 44,184 Receipts ($1,000) 79,020 0.3849 0.2511 0.6360 30,411 19,842 50,253 129,273
19 Other Recycling Establishments (#) 15 Processors / Employment (#) 185 0.5047 0.3762 0.8809 93 70 163 348 Manufacturers Annual Payroll ($1,000) 9,063 0.5351 0.3098 0.8449 4,850 2,808 7,657 16,720
Receipts ($1,000) 31,719 0.4263 0.2696 0.6959 13,522 8,551 22,073 53,792
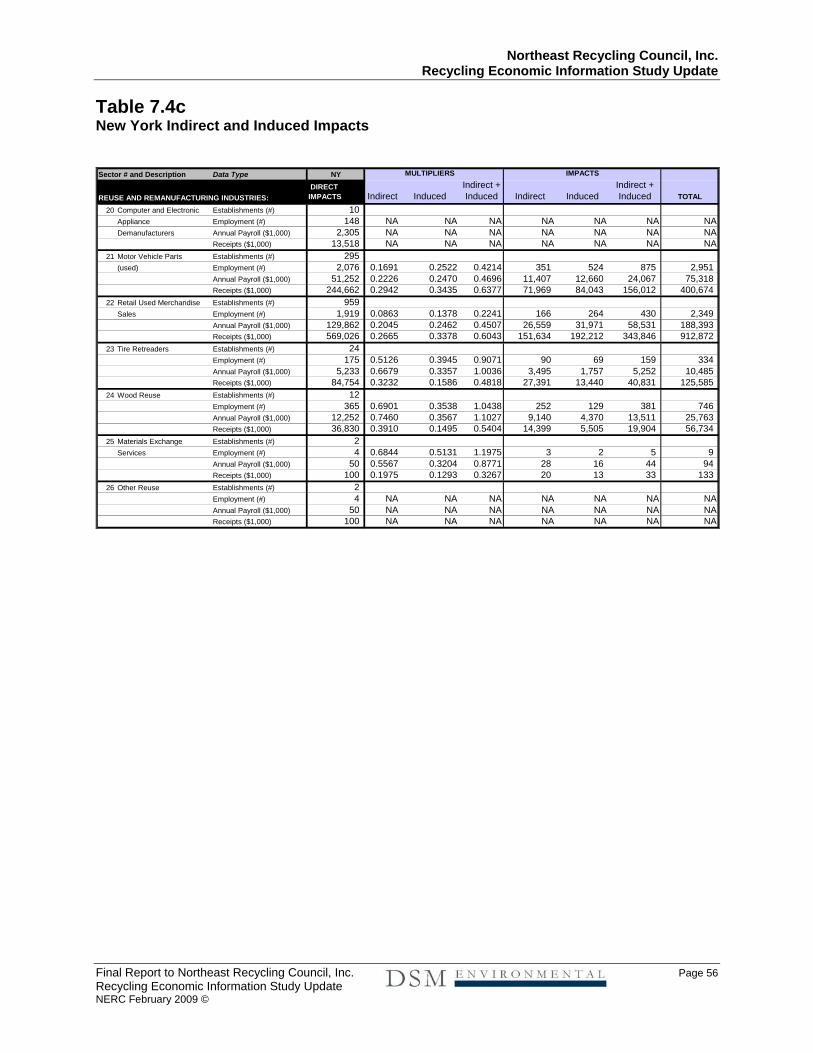
Northeast Recycling Council, Inc. Recycling Economic Information Study Update
Final Report to Northeast Recycling Council, Inc. Page 56 Recycling Economic Information Study Update NERC February 2009 ©
Table 7.4c New York Indirect and Induced Impacts Sector # and Description Data Type NY MULTIPLIERS IMPACTS
REUSE AND REMANUFACTURING INDUSTRIES: DIRECT IMPACTS Indirect Induced
Indirect + Induced Indirect Induced
Indirect + Induced TOTAL
20 Computer and Electronic Establishments (#) 10 Appliance Employment (#) 148 NA NA NA NA NA NA NADemanufacturers Annual Payroll ($1,000) 2,305 NA NA NA NA NA NA NA
Receipts ($1,000) 13,518 NA NA NA NA NA NA NA21 Motor Vehicle Parts Establishments (#) 295
(used) Employment (#) 2,076 0.1691 0.2522 0.4214 351 524 875 2,951 Annual Payroll ($1,000) 51,252 0.2226 0.2470 0.4696 11,407 12,660 24,067 75,318 Receipts ($1,000) 244,662 0.2942 0.3435 0.6377 71,969 84,043 156,012 400,674
22 Retail Used Merchandise Establishments (#) 959 Sales Employment (#) 1,919 0.0863 0.1378 0.2241 166 264 430 2,349
Annual Payroll ($1,000) 129,862 0.2045 0.2462 0.4507 26,559 31,971 58,531 188,393 Receipts ($1,000) 569,026 0.2665 0.3378 0.6043 151,634 192,212 343,846 912,872
23 Tire Retreaders Establishments (#) 24 Employment (#) 175 0.5126 0.3945 0.9071 90 69 159 334 Annual Payroll ($1,000) 5,233 0.6679 0.3357 1.0036 3,495 1,757 5,252 10,485 Receipts ($1,000) 84,754 0.3232 0.1586 0.4818 27,391 13,440 40,831 125,585
24 Wood Reuse Establishments (#) 12 Employment (#) 365 0.6901 0.3538 1.0438 252 129 381 746 Annual Payroll ($1,000) 12,252 0.7460 0.3567 1.1027 9,140 4,370 13,511 25,763 Receipts ($1,000) 36,830 0.3910 0.1495 0.5404 14,399 5,505 19,904 56,734
25 Materials Exchange Establishments (#) 2 Services Employment (#) 4 0.6844 0.5131 1.1975 3 2 5 9
Annual Payroll ($1,000) 50 0.5567 0.3204 0.8771 28 16 44 94 Receipts ($1,000) 100 0.1975 0.1293 0.3267 20 13 33 133
26 Other Reuse Establishments (#) 2 Employment (#) 4 NA NA NA NA NA NA NAAnnual Payroll ($1,000) 50 NA NA NA NA NA NA NAReceipts ($1,000) 100 NA NA NA NA NA NA NA

Northeast Recycling Council, Inc. Recycling Economic Information Study Update
Final Report to Northeast Recycling Council, Inc. Page 57 Recycling Economic Information Study Update NERC February 2009 ©
Table 7.5a Pennsylvania Indirect and Induced Impacts Sector # and Description Data Type PA MULTIPLIERS IMPACTS
RECYCLING INDUSTRY: DIRECT IMPACTS Indirect Induced
Indirect + Induced Indirect Induced
Indirect + Induced TOTAL
1 Municipal Residential Establishments (#) 1,068 Curbside and Drop-Off Employment (#) 1,326 0.6114 0.5074 1.1189 811 673 1,484 2,810 Collection Annual Payroll ($1,000) 47,115 0.5783 0.3751 0.9534 27,246 17,673 44,918 92,034
Receipts ($1,000) 53,316 0.4849 0.3399 0.8249 25,855 18,125 43,980 97,296 2 Private Residential and Establishments (#) 287
Commercial Collection Employment (#) 1,207 0.6114 0.5074 1.1189 738 612 1,350 2,557 Annual Payroll ($1,000) 44,927 0.5783 0.3751 0.9534 25,980 16,852 42,832 87,759 Receipts ($1,000) 115,216 0.4849 0.3399 0.8249 55,873 39,167 95,041 210,256
3 Compost and Misc. Establishments (#) 446 Organics Producers Employment (#) 1,278 0.0105 0.1496 0.1601 13 191 205 1,483
Annual Payroll ($1,000) 26,255 0.0229 0.2462 0.2691 602 6,465 7,066 33,321 Receipts ($1,000) 88,590 0.0701 0.7650 0.8350 6,209 67,767 73,976 162,566
4 Materials Recovery Establishments (#) 48 Facilities (MRFs) Employment (#) 870 0.6114 0.5074 1.1189 532 441 973 1,843
Annual Payroll ($1,000) 28,684 0.5783 0.3751 0.9534 16,587 10,759 27,346 56,030 Receipts ($1,000) 50,859 0.4849 0.3399 0.8249 24,664 17,289 41,953 92,811
5 Recyclable Material Establishments (#) 397 Wholesalers Employment (#) 5,126 0.4410 0.5752 1.0162 2,261 2,948 5,209 10,335
Annual Payroll ($1,000) 166,087 0.3346 0.3168 0.6514 55,566 52,618 108,184 274,272 Receipts ($1,000) 5,504,777 0.3344 0.3821 0.7165 1,840,572 2,103,541 3,944,112 9,448,890
14 Plastics Reclaimers Establishments (#) 19 Employment (#) 364 1.2544 1.2237 2.4781 457 445 902 1,266 Annual Payroll ($1,000) 13,643 0.8495 0.4432 1.2927 11,589 6,047 17,636 31,278 Receipts ($1,000) 138,252 0.5782 0.2840 0.8622 79,942 39,265 119,206 257,459

Northeast Recycling Council, Inc. Recycling Economic Information Study Update
Final Report to Northeast Recycling Council, Inc. Page 58 Recycling Economic Information Study Update NERC February 2009 ©
Table 7.5b Pennsylvania Indirect and Induced Impacts Sector # and Description Data Type PA MULTIPLIERS IMPACTS
RECYCLING RELIANT INDUSTRIES: DIRECT IMPACTS Indirect Induced
Indirect + Induced Indirect Induced
Indirect + Induced TOTAL
6 Glass Container Establishments (#) 5 Manufacturing Plants Employment (#) 871 0.7410 0.7360 1.4770 645 641 1,286 2,156
Annual Payroll ($1,000) 61,127 0.7376 0.4155 1.1531 45,089 25,397 70,487 131,614 Receipts ($1,000) 183,946 0.4701 0.2856 0.7557 86,478 52,526 139,004 322,950
7 Glass Product Producers Establishments (#) 2 (other recycled uses) Employment (#) 153 0.7410 0.7360 1.4770 113 113 226 379
Annual Payroll ($1,000) 6,504 0.7376 0.4155 1.1531 4,798 2,702 7,500 14,004 Receipts ($1,000) 24,313 0.4701 0.2856 0.7557 11,430 6,943 18,373 42,686
8 Nonferrous Secondary Establishments (#) 46 Smelting and Refining Employment (#) 2,610 0.4812 0.5986 1.0798 1,256 1,562 2,818 5,428 Mills Annual Payroll ($1,000) 100,188 0.3775 0.3453 0.7227 37,817 34,590 72,408 172,595
Receipts ($1,000) 741,938 0.3879 0.3335 0.7214 287,784 247,434 535,218 1,277,156 9 Nonferrous Product Establishments (#) 38
Producers Employment (#) 3,265 0.4812 0.5986 1.0798 1,571 1,955 3,526 6,791 Annual Payroll ($1,000) 143,736 0.3775 0.3453 0.7227 54,255 49,626 103,881 247,616 Receipts ($1,000) 955,835 0.3879 0.3335 0.7214 370,750 318,768 689,518 1,645,353
10 Nonferrous Foundries Establishments (#) 77 Employment (#) 4,469 0.4812 0.5986 1.0798 2,150 2,675 4,826 9,294 Annual Payroll ($1,000) 187,340 0.3775 0.3453 0.7227 70,714 64,680 135,395 322,735 Receipts ($1,000) 494,475 0.3879 0.3335 0.7214 191,797 164,906 356,703 851,178
11 Paper and Paperboard Establishments (#) 22 Mills / Deinked Market Employment (#) 2,319 0.6723 0.6560 1.3284 1,559 1,521 3,080 5,399 Pulp Producers Annual Payroll ($1,000) 143,977 0.5836 0.3768 0.9604 84,023 54,248 138,270 282,247
Receipts ($1,000) 2,106,234 0.3518 0.2445 0.5963 740,920 514,987 1,255,907 3,362,141 12 Paper-Based Product Establishments (#) 6
Manufacturers Employment (#) 900 0.6723 0.6560 1.3284 605 590 1,196 2,096 Annual Payroll ($1,000) 31,995 0.5836 0.3768 0.9604 18,672 12,055 30,727 62,722 Receipts ($1,000) 156,644 0.3518 0.2445 0.5963 55,103 38,300 93,404 250,048
13 Pavement Mix Producers Establishments (#) 86 (asphalt and aggregate) Employment (#) 376 0.6769 0.9538 1.6307 255 359 613 989
Annual Payroll ($1,000) 13,062 0.4571 0.3496 0.8067 5,971 4,566 10,537 23,599 Receipts ($1,000) 234,000 0.5104 0.2310 0.7414 119,431 54,056 173,487 407,487
15 Plastic Product Manufacturers Establishments (#) 19 Employment (#) 1,110 0.5530 0.5797 1.1327 614 643 1,257 2,367 Annual Payroll ($1,000) 29,989 0.5347 0.3652 0.8999 16,035 10,953 26,989 56,978 Receipts ($1,000) 241,861 0.3159 0.1892 0.5051 76,393 45,769 122,161 364,022
16 Rubber Product Establishments (#) 34 Manufacturers Employment (#) 400 0.6583 0.6545 1.3128 263 262 525 925
Annual Payroll ($1,000) 12,139 0.5710 0.3734 0.9443 6,931 4,532 11,463 23,602 Receipts ($1,000) 45,889 0.3336 0.2134 0.5470 15,308 9,794 25,102 70,991
17 Steel Mills Establishments (#) 58 Employment (#) 11,886 2.5883 1.7237 4.3120 30,765 20,488 51,253 63,139 Annual Payroll ($1,000) 728,795 1.3845 0.5966 1.9811 1,009,015 434,775 1,443,790 2,172,585 Receipts ($1,000) 8,167,198 0.5022 0.2108 0.7130 4,101,469 1,721,457 5,822,926 13,990,124
18 Iron and Steel Foundries Establishments (#) 73 Employment (#) 5,450 0.5243 0.6375 1.1617 2,857 3,474 6,332 11,782 Annual Payroll ($1,000) 215,640 0.4268 0.3484 0.7752 92,027 75,134 167,160 382,800 Receipts ($1,000) 611,550 0.3895 0.3378 0.7272 238,174 206,565 444,739 1,056,289
19 Other Recycling Establishments (#) 18 Processors / Employment (#) 230 0.6114 0.5074 1.1189 141 117 257 487 Manufacturers Annual Payroll ($1,000) 11,250 0.5783 0.3751 0.9534 6,506 4,220 10,725 21,975
Receipts ($1,000) 39,375 0.4849 0.3399 0.8249 19,095 13,385 32,480 71,855

Northeast Recycling Council, Inc. Recycling Economic Information Study Update
Final Report to Northeast Recycling Council, Inc. Page 59 Recycling Economic Information Study Update NERC February 2009 ©
Table 7.5c Pennsylvania Indirect and Induced Impacts Sector # and Description Data Type PA MULTIPLIERS IMPACTS
REUSE AND REMANUFACTURING INDUSTRIES: DIRECT IMPACTS Indirect Induced
Indirect + Induced Indirect Induced
Indirect + Induced TOTAL
20 Computer and Electronic Establishments (#) 7 Appliance Employment (#) 103 0.2091 0.3207 0.5298 22 33 55 158 Demanufacturers Annual Payroll ($1,000) 1,604 0.2391 0.2945 0.5336 384 472 856 2,460
Receipts ($1,000) 9,408 0.3296 0.4363 0.7659 3,101 4,105 7,206 16,614 21 Motor Vehicle Parts Establishments (#) 270
(used) Employment (#) 1,889 0.2091 0.3207 0.5298 395 606 1,001 2,890 Annual Payroll ($1,000) 43,239 0.2391 0.2945 0.5336 10,338 12,735 23,073 66,312 Receipts ($1,000) 238,144 0.3296 0.4363 0.7659 78,499 103,906 182,404 420,548
22 Retail Used Merchandise Establishments (#) 670 Sales Employment (#) 4,834 0.0720 0.1248 0.1969 348 603 952 5,786
Annual Payroll ($1,000) 69,839 0.2040 0.2890 0.4930 14,246 20,181 34,427 104,266 Receipts ($1,000) 241,088 0.2841 0.4325 0.7166 68,491 104,277 172,768 413,856
23 Tire Retreaders Establishments (#) 76 Employment (#) 646 0.6583 0.6545 1.3128 425 423 848 1,494 Annual Payroll ($1,000) 22,116 0.5710 0.3734 0.9443 12,627 8,257 20,885 43,001 Receipts ($1,000) 56,205 0.3336 0.2134 0.5470 18,749 11,996 30,745 86,950
24 Wood Reuse Establishments (#) 19 Employment (#) 577 0.8192 0.5640 1.3832 473 325 798 1,375 Annual Payroll ($1,000) 19,368 0.8014 0.4302 1.2316 15,521 8,332 23,853 43,221 Receipts ($1,000) 58,221 0.4765 0.2019 0.6784 27,745 11,753 39,498 97,719
25 Materials Exchange Establishments (#) 2 Services Employment (#) 4 0.6249 0.5119 1.1368 2 2 5 9
Annual Payroll ($1,000) 50 0.5109 0.3625 0.8734 26 18 44 94 Receipts ($1,000) 100 0.2004 0.1591 0.3596 20 16 36 136
26 Other Reuse Establishments (#) 10 Employment (#) 53 0.6583 0.6545 1.3128 35 35 70 123 Annual Payroll ($1,000) 1,988 0.5710 0.3734 0.9443 1,135 742 1,877 3,865 Receipts ($1,000) 8,248 0.3336 0.2134 0.5470 2,751 1,760 4,512 12,760

Northeast Recycling Council, Inc. Recycling Economic Information Study Update
Final Report to Northeast Recycling Council, Inc. Page 60 Recycling Economic Information Study Update NERC February 2009 ©
This page is intentionally left blank.

Northeast Recycling Council, Inc. Recycling Economic Information Study Update
Final Report to Northeast Recycling Council, Inc. Recycling Economic Information Study Update NERC February 2009 ©
A-1
APPENDICES
A: Detailed Reporting Form, All States B: Sector NAICS Code Assignments and Research Methodology

Northeast Recycling Council, Inc. Recycling Economic Information Study Update
Final Report to Northeast Recycling Council, Inc. Recycling Economic information Study Update NERC February 2009 ©
A-2
APPENDIX A: Detailed Reporting Form, All States
Detailed State-by-State tables are included in this Appendix and present the data sources used for each sector in each Participant State. These tables follow the same three-tier reporting format included in the 2000 Report. A summary of the three tiers is excerpted from the 2000 Report and included here for reference. Following this summary is a glossary of abbreviations for use in interpreting the data in the Tables. Three-Tiered Approach to Data Presentation26 Three facts about recycling and reuse business complicate recycling economic information studies and have led to inconsistency in past efforts:
1. Most establishments involved in recycling and reuse are part of industries in which many establishments do not recycle or reuse recovered materials or products at all;
2. Some establishments involved in recycling or reuse are also involved in non-recycling activities not intended to be covered in this study; and
3. Many recycling manufacturers use less than 100 percent recycled feedstock and/or adjust the percentage of recycled feedstock throughout the year.
Past studies have handled each of these challenges differently. In an effort to exclude non-recycling activities, some studies relied on survey respondents to estimate recycling activities. Other studies have targeted all facilities involved in recycling and did not attempt to adjust the statistics to account for non-recycling activities. Various industry and recycling experts have criticized both approaches. To overcome these challenges, both the 2000 Report, and this Study Update, report three tiers of statistics. The goals of this approach are:
• To report statistics on recycling and reuse-related businesses as they actually exist in the economy (i.e., as part of the industries and establishments that do not always involve recycling); and,
• To derive conservative estimates for the amount of economic activity that can
“reasonably” be attributed exclusively to recycling. The three tiers of statistics are described below.
TIER ONE – Statistics on All Industry Establishments Tier One statistics are reported only for certain business categories where data are available from a source that included all establishments in the category, even though some of them may not do any recycling. This information typically comes from Economic Census data by NAICS code. For example, data for all paper mills in a given state will be shown even though some of those establishments do not utilize recovered paper.
26 Excerpted from the Final Report: Recycling Economic Information Study, Prepared for the Northeast Recycling Council, R.W. Beck, June 2000.

Northeast Recycling Council, Inc. Recycling Economic Information Study Update
Final Report to Northeast Recycling Council, Inc. Recycling Economic information Study Update NERC February 2009 ©
A-3
TIER TWO – Statistics on Establishments Involved in Recycling Like Tier One, Tier Two statistics are only reported for certain business categories where data are available from a source that aggregated data for recycling and non-recycling establishments. The data covers only those establishments that have some involvement in recycling, and attempts to exclude data on establishments with no recycling activities. Although all of these establishments perform some amount of recycling or reuse activity, they may also perform non-recycling activities not covered in this report. For example, information on all paper mills that utilize recovered paper would be included here, even though some of these establishments may also be involved in non-covered activities like production of wood pulp. TIER THREE – Statistics on Covered Recycling Activities Tier Three statistics are the heart of this study and are reported for all business categories. They are estimates of the portion of economic activity in Tier One or Tier Two that can be reasonably attributed to the recycling activities covered in the study. Most Tier Three estimates are derived from survey results in which respondents, or in some cases trade organizations representing the industry are asked to identify what percentage of their facility’s activities involve use of recycled materials. The exact approach used for each sector is documented in detail in the description of the sector, or in the detailed table footnotes. Additionally, Tier Three statistics are reported in two columns, depending on whether the establishments in the sector are “100 percent dependent on recycling,” or simply “undertaking recycling activities.” Those establishments that are dependent on recycling have 100 percent of employment and revenues derived from recycling activities; while those are “undertaking recycling activities” have only a portion of economic activity derived from recycling. Glossary to the Data Tables Descriptions of the column headings used in the detailed state data tables are outlined in Table A.1 below. These follow the same format as used in the 2000 Report. Table A.2 presents a list of abbreviations used in the data tables.

Northeast Recycling Council, Inc. Recycling Economic Information Study Update
Final Report to Northeast Recycling Council, Inc. Recycling Economic information Study Update NERC February 2009 ©
A-4
Table A.1 Definitions of Column Headings in the Detailed Data Tables
Description
A. Business Category For a completed description of business category definitions (e.g. Sectors), refer to Table 1 of the report.
B. Data Type
Establishments (#) A single physical location of a company or government. A company or government may have multiple establishments (e.g. physical locations).
Employment (#) Total number of employees for all establishments in that category
Annual Payroll ($1,000) Total annual payroll for all employees in each category, reported in thousands of dollars.
Receipts ($1,000) Total annual estimated receipts for all establishments in a category, reported in thousands of dollars.
Throughput (1,000 tons)
Where data available, total tons of materials processed is estimated, reported in thousands of tons. Note that subtotals and grand totals for throughput are not shown due to the potential for triple counting of material by adding tons of the same material at three different stages - collection, processing and end use.
C. Total Statistics on All Industry Establishments
Combined statistics on Tier One establishments where data was available and collected.
D.Total Statistics on Establishments Undertaking Some Recycling or Reuse Activities
Subset of Column C and reports statistics for those establishments with some portion of operations in covered recycling activities.
E.Statistics on Employees Undertaking Recycling or Reuse Activities
Subset of Column D and reports total recycling related statistics (e.g. employment, payroll and gross receipts) for establishments with less than 100 percent of operations involved in recycling or reuse-related activities.
F. Statistics on Establishments 100% Recycling or Reuse-Dependent
Presents estimates for establishments with 100 percent of operations dependent on recycling or reuse.
Column Header
Table A.2 Symbols and Abbreviations Used in the Detailed Data Tables
Symbols and Abbreviations: n = # Refers to number of surveys conducted to develop estimates.
(D) Indicates data was suppressed to follow disclosure agreements. Figures suppressed have been aggregated and reported in all totals.
Census U.S. Economic Census (2002, the most recent at the date of report publication) CBP County Business Patterns (2006, or the most recent available) BLS Bureau of Labor Statistics (2006, most recent available for limited sectors) AISI American Iron and Steel Institute ASM Annual Survey of Manufacturers (2006) AFS American Foundry Society AFandPA American Forest and Paper Association GAA Government Advisory Associates, MRF Database 2006 GPI Glass Packaging Institute ISRI Institute of Scrap Recycling Industries NAIM North American Insulation Manufacturers Association NAICS North American Industry Classification System SRI Steel Recycling Institute RR Resource Recycling Magazine TRIB Tire Retread Information Bureau USGS United States Geological Survey

Northeast Recycling Council, Inc. Recycling Economic Information Study Update
Final Report to Northeast Recycling Council, Inc. Recycling Economic information Study Update NERC February 2009 ©
A-5

Northeast Recycling Council, Inc. Recycling Economic Information Study Update
Final Report to Northeast Recycling Council, Inc. Recycling Economic information Study Update NERC February 2009 ©
A-6

Northeast Recycling Council, Inc. Recycling Economic Information Study Update
Final Report to Northeast Recycling Council, Inc. Recycling Economic information Study Update NERC February 2009 ©
A-7

Northeast Recycling Council, Inc. Recycling Economic Information Study Update
Final Report to Northeast Recycling Council, Inc. Recycling Economic information Study Update NERC February 2009 ©
A-8

Northeast Recycling Council, Inc. Recycling Economic Information Study Update
Final Report to Northeast Recycling Council, Inc. Recycling Economic information Study Update NERC February 2009 ©
A-9

Northeast Recycling Council, Inc. Recycling Economic Information Study Update
Final Report to Northeast Recycling Council, Inc. Recycling Economic information Study Update NERC February 2009 ©
A-10

Northeast Recycling Council, Inc. Recycling Economic Information Study Update
Final Report to Northeast Recycling Council, Inc. Recycling Economic information Study Update NERC February 2009 ©
A-11

Northeast Recycling Council, Inc. Recycling Economic Information Study Update
Final Report to Northeast Recycling Council, Inc. Recycling Economic information Study Update NERC February 2009 ©
A-12

Northeast Recycling Council, Inc. Recycling Economic Information Study Update
Final Report to Northeast Recycling Council, Inc. Recycling Economic information Study Update NERC February 2009 ©
A-13

Northeast Recycling Council, Inc. Recycling Economic Information Study Update
Final Report to Northeast Recycling Council, Inc. Recycling Economic information Study Update NERC February 2009 ©
A-14

Northeast Recycling Council, Inc. Recycling Economic Information Study Update
Final Report to Northeast Recycling Council, Inc. Recycling Economic information Study Update NERC February 2009 ©
A-15

Northeast Recycling Council, Inc. Recycling Economic Information Study Update
Final Report to Northeast Recycling Council, Inc. Recycling Economic information Study Update NERC February 2009 ©
A-16

Northeast Recycling Council, Inc. Recycling Economic Information Study Update
Final Report to Northeast Recycling Council, Inc. Recycling Economic information Study Update NERC February 2009 ©
A-17

Northeast Recycling Council, Inc. Recycling Economic Information Study Update
Final Report to Northeast Recycling Council, Inc. Recycling Economic information Study Update NERC February 2009 ©
A-18
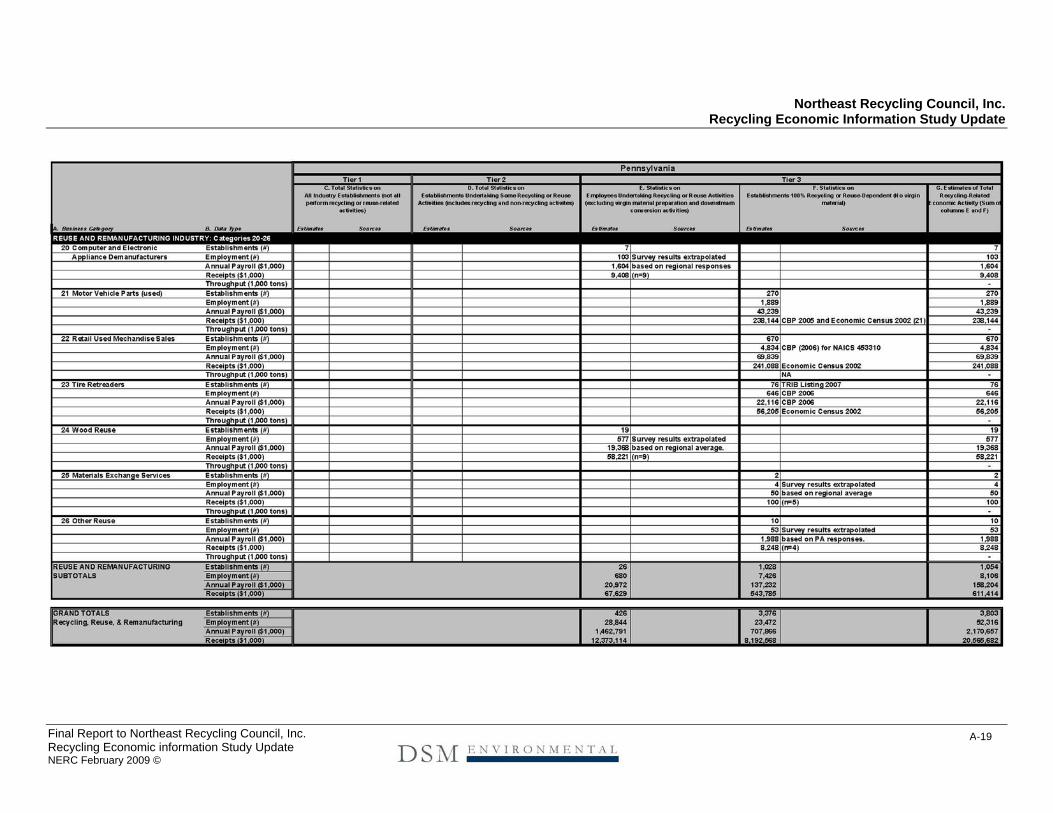
Northeast Recycling Council, Inc. Recycling Economic Information Study Update
Final Report to Northeast Recycling Council, Inc. Recycling Economic information Study Update NERC February 2009 ©
A-19

Northeast Recycling Council, Inc. Recycling Economic Information Study Update
Final Report to Northeast Recycling Council, Inc. Recycling Economic information Study Update NERC February 2009 ©
A-20
APPENDIX B: Sector NAICS Code Assignments and Research Methodology
SectorNAICS Code Assignments Methodology
1 Government Staffed Residential Collection 562111
Survey drop-offs in all states and curbside programs in PA. Modeling of curbside collection using state maintained data on tons collected, program type and households served in all other states.
2Private Staffed Collection: Residential, Commercial and Redemption
562111
Modeling of costs using County Business Patterns (CBP) data on collection establishments and average wages (excluding redemption), use of state maintained data on tons collected (by material type for commercial), households served, and cost modeling. Sta
3 Compost/organics Processors 325311, 325314 Survey by type of composting (e.g. leaf and yard waste, commercial food waste and other organics, biosolids)
4 Materials Recovery Facilities 56292 GAA database with payroll data from Economic Census (2002) and CBP (2005)
5 Recyclables Material Wholesalers 42393 Economic Census data (2002) updated based on 2007 material values by wholesaler type for metals and paper
14 Plastics Reclaimers 325991 Survey
6 Glass Container Manufacturing Plants 327213 Survey
7 Glass Product Producers 327211, 327212, 327993 Survey
8 Nonferrous Secondary Smelting and Refining Mills 331314, 331423, 331492 Economic Census data (2002) with industry input for recycled content
9 Nonferrous Product Producers 331315, 331316, 331319, 331421, 331, 491 Economic Census data (2002) with industry input for recycled content
10 Nonferrous Foundries 33152 Economic Census data (2002) supplemented by industry input on scrap percentage and industry size
11Paper and Paperboard Mills/Deinkled Market Pulp Producers
3221 Economic Census and ASM data (2006) with industry data on % recovered paper use
12 Paper-based Product Manufacturers 322215, 322299 Survey
13 Pavement Mix Producers (asphalt and aggregate) 324121 Economic Census (2002), industry data and survey (DE only)
14 Plastics Reclaimers 325991 Survey
15 Plastic Product Manufacturers 32611, 32612, 326160, 32619 Survey
16 Rubber Product Manufacturers 326299 Survey17 Steel Mills 33111 Industry data coupled with ASM (2006) data
18 Iron and Steel Foundries 33151 Economic Census data (2002) supplemented by industry input on scrap percentage use and industry size
19 Other Recycling Processors/Manufacturers Varies Survey
20 Computer and Electronic Appliance Demanufacturers N/A Survey
21 Motor Vehicle Parts (used) 423140 2005 CBP data for 423140 and Economic Census data (2002) for 441310 adjusted for used retail merchandise sales
22 Retail Used Merchandise Sales 453310 and 4413105 County Business Patterns (2006)
23 Tire Retreaders 326212 Economic Census data (2002) with industry input on number of establishments
24 Wood Reuse 321920, 321219 Survey25 Material Exchange Services N/A Survey26 Other Reuse Survey
REC
YCLI
NG
IND
UST
RIE
S (S
uppl
y Si
de)
REC
YCLI
NG
REL
IAN
T IN
DU
STR
IES
(Dem
and
Side
)R
EUSE
/ R
EMA
NU
FAC
TUR
ING