recs_2015_koperna
TRANSCRIPT

11
Prepared for:
RECS
Prepared by:
George J. Koperna, Jr., Vice President
Advanced Resources International, Inc.
June 10, 2015
University of Alabama at Birmingham
Storage, Integrity, Monitoring and the
SECARB Storage Project

22
Disclaimer
This presentation is based upon work supported by the Department of Energy
National Energy Technology Laboratory under DE-FC26-05NT42590 and was
prepared as an account of work sponsored by an agency of the United States
Government. Neither the United States Government nor any agency thereof,
nor any of their employees, makes any warranty, express or implied, or
assumes any legal liability or responsibility for the accuracy, completeness, or
usefulness of any information, apparatus, product, or process disclosed, or
represents that its use would not infringe privately owned rights. Reference
herein to any specific commercial product, process, or service by trade name,
trademark, manufacturer, or otherwise does not necessarily constitute or imply
its endorsement, recommendation, or favoring by the United States
Government or any agency thereof. The views and opinions of authors
expressed herein do not necessarily state or reflect those of the United States
Government or any agency thereof.

3
Background

4
SECARB Phase III Projects

5
Storage Overview
The CO2 capture unit at Alabama Power’s(Southern Co.) Plant Barry became operationalin 3Q 2011.
A newly built 12 mile CO2 pipeline from PlantBarry to the Citronelle Dome was completed in4Q 2011.
A characterization well was drilled in 1Q 2011to confirm geology.
Injection wells were drilled in 3Q 2011.
114k metric tons were injected into the Paluxyformation beginning in the 3Q 2012.
Injection operations were terminated September 3Q 2014
3 years of post-injection monitoring.
Project Schedule and Milestones
6
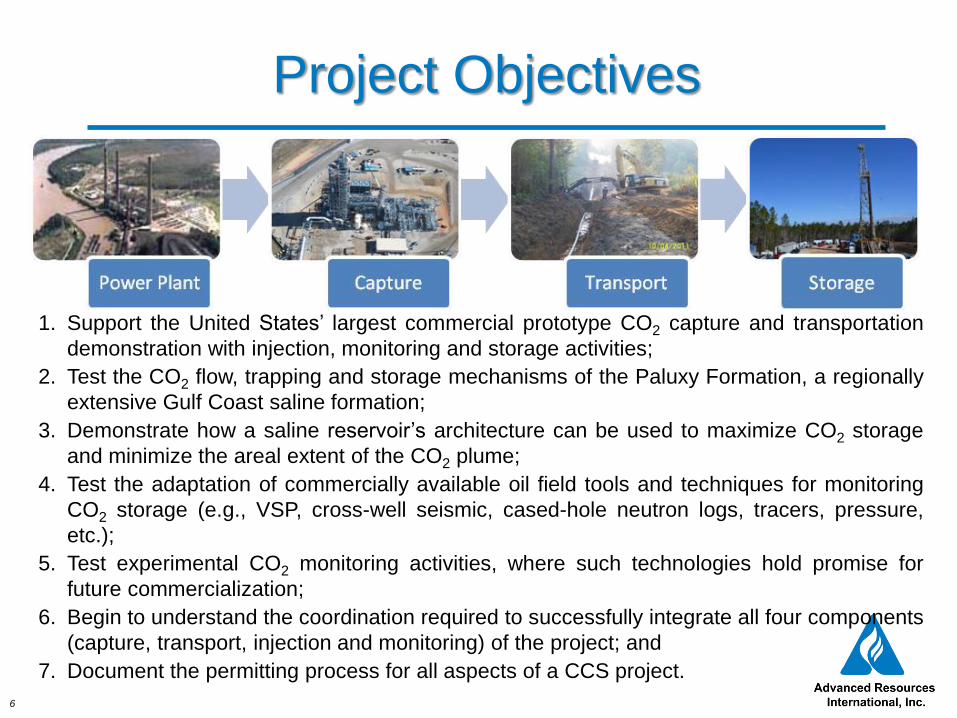
Project Objectives
1. Support the United States’ largest commercial prototype CO2 capture and transportation
demonstration with injection, monitoring and storage activities;
2. Test the CO2 flow, trapping and storage mechanisms of the Paluxy Formation, a regionally
extensive Gulf Coast saline formation;
3. Demonstrate how a saline reservoir’s architecture can be used to maximize CO2 storage
and minimize the areal extent of the CO2 plume;
4. Test the adaptation of commercially available oil field tools and techniques for monitoring
CO2 storage (e.g., VSP, cross-well seismic, cased-hole neutron logs, tracers, pressure,
etc.);
5. Test experimental CO2 monitoring activities, where such technologies hold promise for
future commercialization;
6. Begin to understand the coordination required to successfully integrate all four components
(capture, transport, injection and monitoring) of the project; and
7. Document the permitting process for all aspects of a CCS project.
7
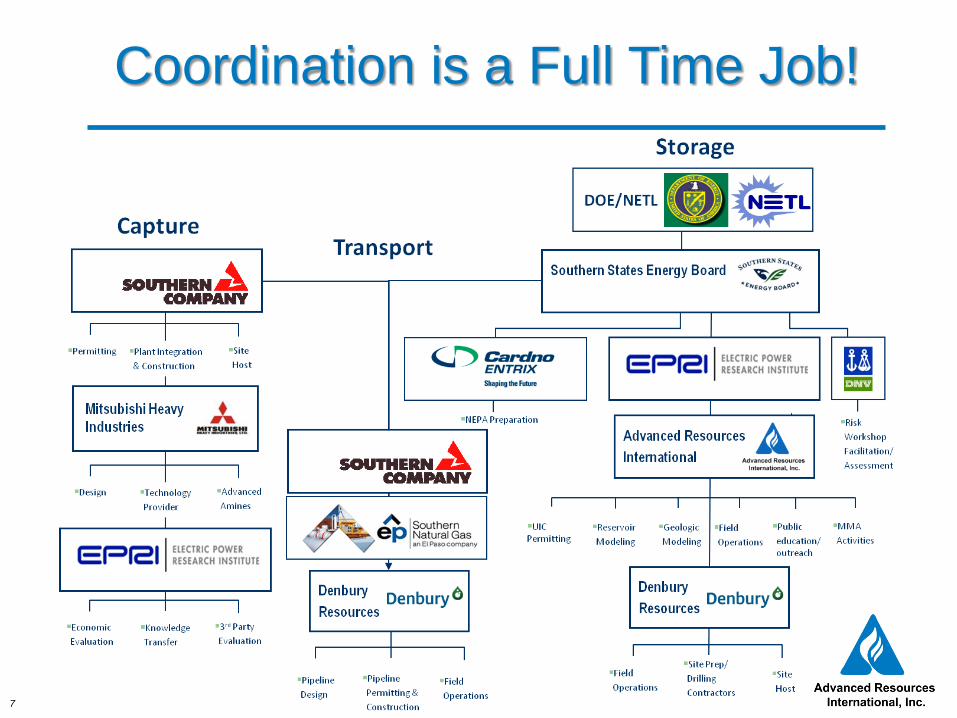
Coordination is a Full Time Job!

8
Geology
9
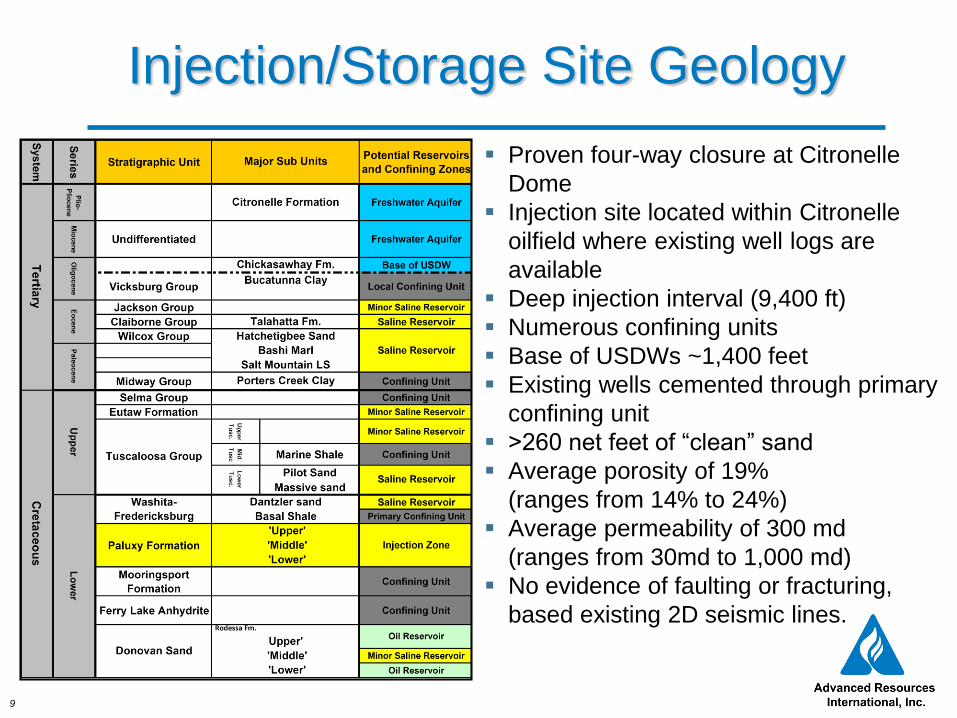
Injection/Storage Site Geology
Proven four-way closure at Citronelle
Dome
Injection site located within Citronelle
oilfield where existing well logs are
available
Deep injection interval (9,400 ft)
Numerous confining units
Base of USDWs ~1,400 feet
Existing wells cemented through primary
confining unit
>260 net feet of “clean” sand
Average porosity of 19%
(ranges from 14% to 24%)
Average permeability of 300 md
(ranges from 30md to 1,000 md)
No evidence of faulting or fracturing,
based existing 2D seismic lines.
10
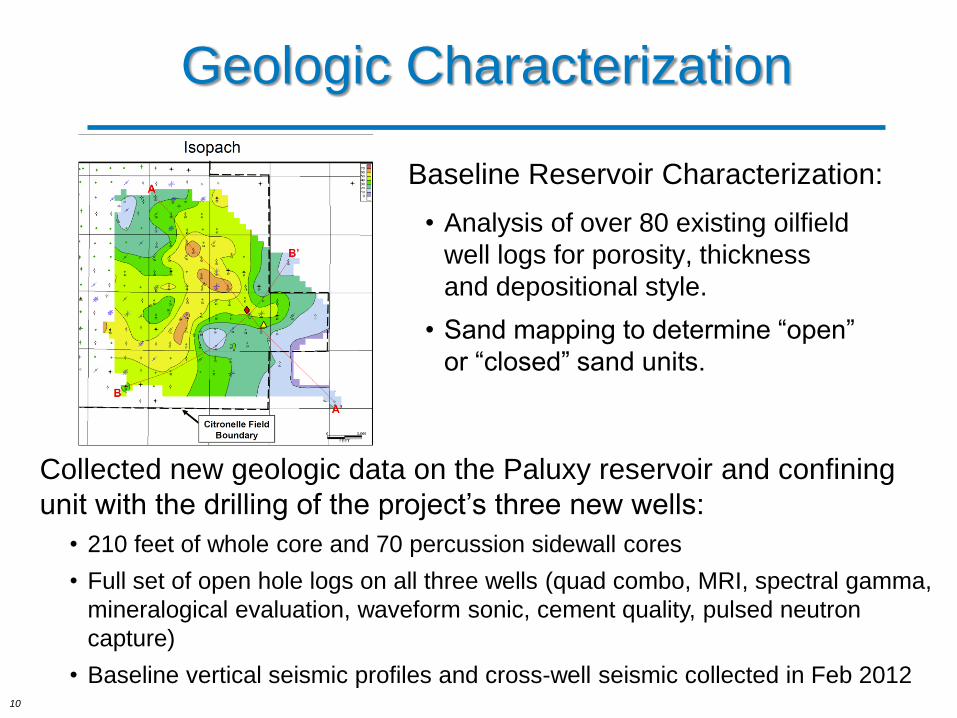
Collected new geologic data on the Paluxy reservoir and confining
unit with the drilling of the project’s three new wells:
• 210 feet of whole core and 70 percussion sidewall cores
• Full set of open hole logs on all three wells (quad combo, MRI, spectral gamma,
mineralogical evaluation, waveform sonic, cement quality, pulsed neutron
capture)
• Baseline vertical seismic profiles and cross-well seismic collected in Feb 2012
• Analysis of over 80 existing oilfield
well logs for porosity, thickness
and depositional style.
• Sand mapping to determine “open”
or “closed” sand units.
Baseline Reservoir Characterization:
Geologic Characterization
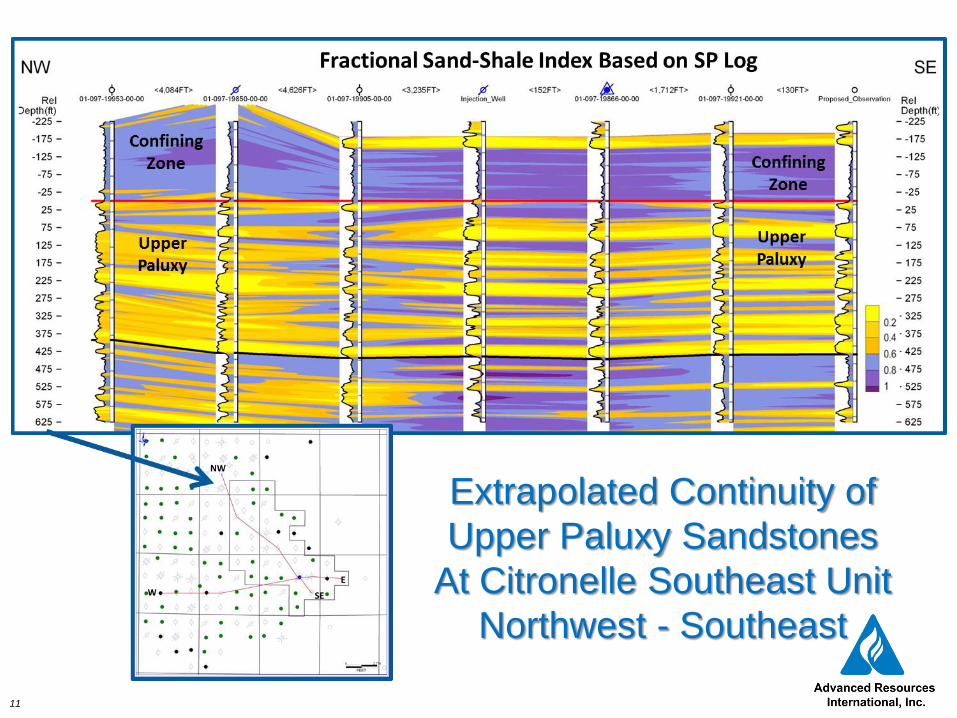
11
Extrapolated Continuity of
Upper Paluxy Sandstones
At Citronelle Southeast Unit
Northwest - Southeast

12
Paluxy Sandstone Section of the D-9-7#2 core (9,598 to 9,607ft)
• Fine to medium coarse-grained
fluvial sandstones.
• Grains are sub-round, moderately
well sorted, predominately quartz.
• Occasional clay pebble
conglomerate and rip-up clasts at
base of fluvial channel
sequences.
• Burrowed to bioturbated
sandstone at top of channel
sequences.
• Mottled red-brown to light gray.
• Sandstone permeability generally
correlates to grain size.
680
mD
1.6
Darcy
1.8
Darcy
600
mD
1
Darcy
730
mD
1.1
Darcy
860
mD
0.27
mD
279
mD

13
Shale Rock Properties (D-9-9#2)
•CO2 Adsorption Isotherm Test
•TOC
Shale Sample sent to UAB ‘s Caprock Laboratory for Analysis
7.76%
0.002
mD
8.62%
0.008
mD
8.56%
0.004
mD
8.96%
0.011
mD
7.76%
0.004
mD
7.43%
0.06 mD
7.23%
(Perm n/a)
8.99%
0.006
mD
Paluxy
Mudstone D-9-9 #2
Core: 9,424’ - 9,434’• Low permeability mudstones
provide local confining layers and flow baffles between reservoir sandstones.

14
Permitting

15
Permitting Outline
National Environmental Protection Act (NEPA)
Alabama Historical Commission
U.S. Fish and Wildlife
U.S. Army Corps of Engineers
Alabama Department of Environmental Management
(ADEM)
16
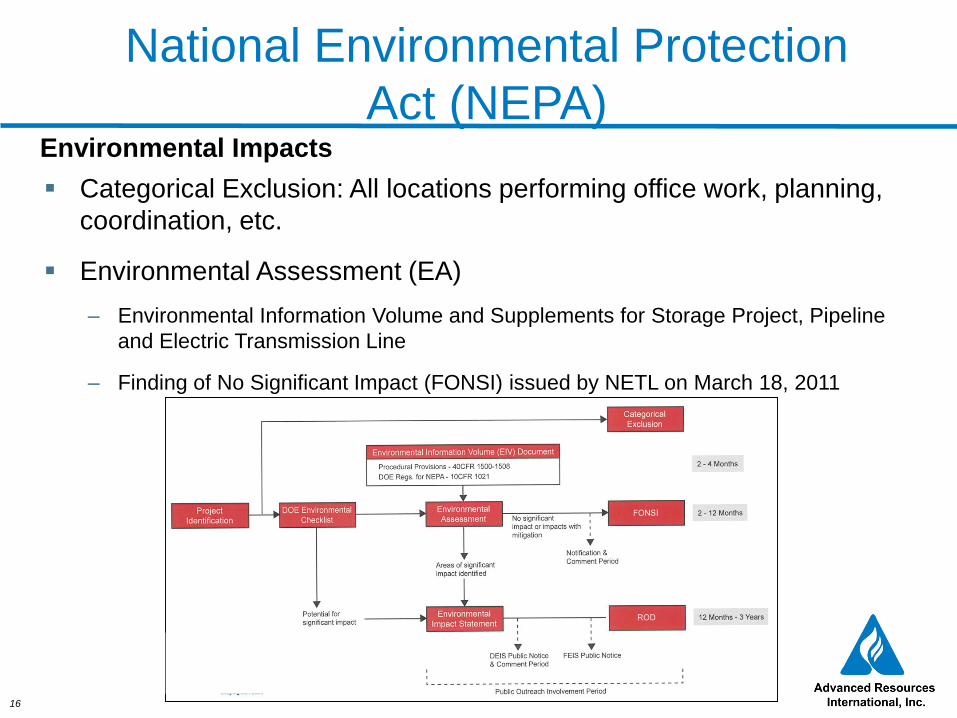
National Environmental Protection
Act (NEPA)
Categorical Exclusion: All locations performing office work, planning,
coordination, etc.
Environmental Assessment (EA)
– Environmental Information Volume and Supplements for Storage Project, Pipeline
and Electric Transmission Line
– Finding of No Significant Impact (FONSI) issued by NETL on March 18, 2011
Environmental Impacts

17
Alabama Historical Commission
2 cultural resources assessments
4 archaeological sites discovered in the
Transmission Line survey, though not
eligible under the National Register of
Historic Places
– no further investigations warranted
No cultural resources were discovered
– no further investigations warranted
Following review of EA, “…agree with
the EA as it pertains to no effect to
National Register eligible cultural
resources” by State Historic
Preservation Officer, April 2011

18
U.S. Fish and Wildlife
U.S. Fish and Wildlife permit and NEPA compliance mandate the protection of
threatened and endangered species
– Potential impacts to an threatened species and its habitat (Gopher Tortoise)
– Over 100 tortoise burrows encountered long pipeline easement, over 30
actively inhabited gopher tortoise burrows
– Directional drilling under tortoise burrows/colonies less expensive than
temporary relocation (would have cost $2MM for relocation of all turtles)
– Burrows identified at or near most well sites
– Avoid drilling/monitoring activities in proximity to burrows
19
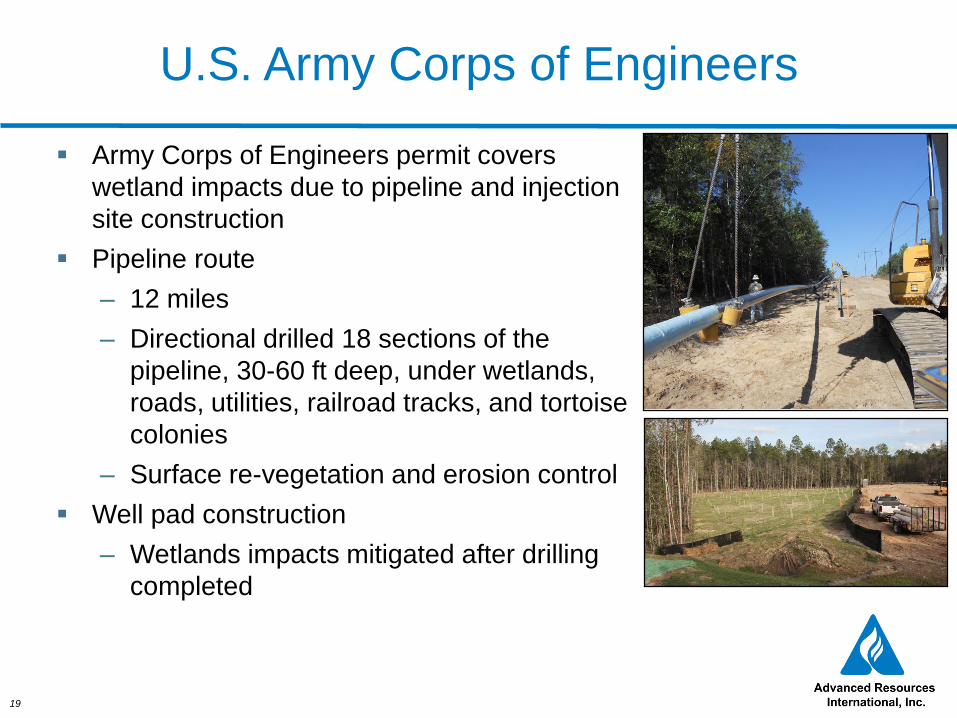
U.S. Army Corps of Engineers
Army Corps of Engineers permit covers
wetland impacts due to pipeline and injection
site construction
Pipeline route
– 12 miles
– Directional drilled 18 sections of the
pipeline, 30-60 ft deep, under wetlands,
roads, utilities, railroad tracks, and tortoise
colonies
– Surface re-vegetation and erosion control
Well pad construction
– Wetlands impacts mitigated after drilling
completed

20
EPA UIC Class V Permit
A Class V Experimental Well permit was sought for the following reasons
– Short duration of injection (3 years) and modest volumes of CO2
– Characterization and modeling of “stacked” CO2 storage
– CO2 Injection Under “real world” operating conditions
– Demonstration of experimental monitoring tools and methods
After comments by EPA, most Class VI (CO2 sequestration well) standards were applied
– Injection Area of Review (AOR) determined by modeling and monitoring results
– Extensive deep, shallow and surface CO2 monitoring
– Injection stream monitoring
– Periodically updated Corrective Action Plan
– Site closure based on USDW non-endangerment demonstration (5-yr renewal)
– Pressurized annulus throughout injection (+/- 200 psig)
Class V Experimental injection permit was awarded in November 2011, eleven months after initial draft application
Permission to operate issued in August 2012

21
Monitoring
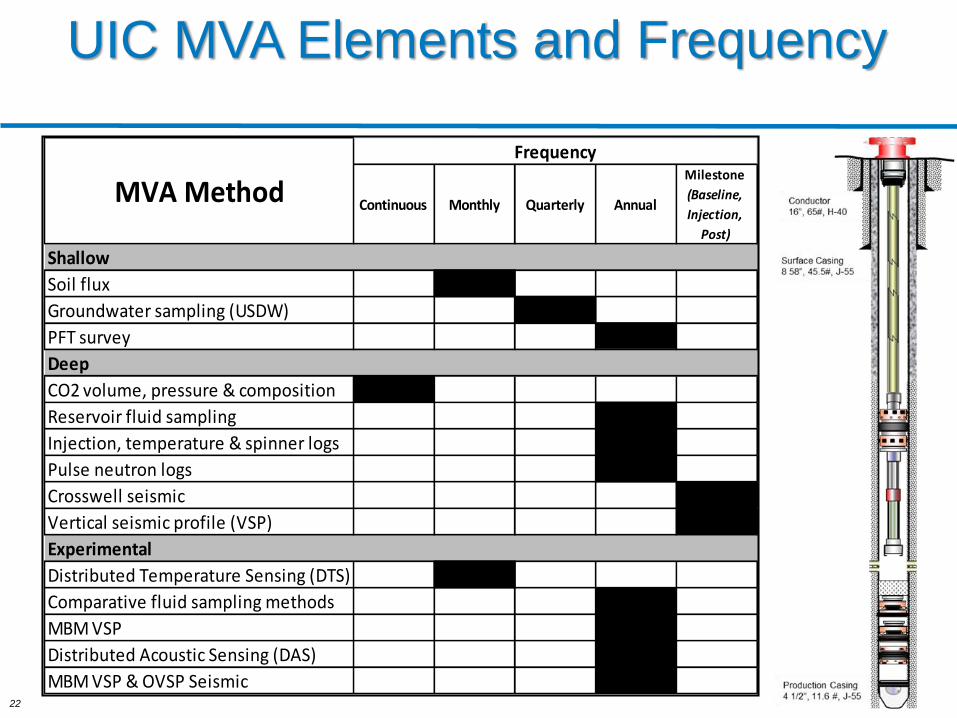
22
UIC MVA Elements and Frequency
Continuous Monthly Quarterly Annual
Milestone
(Baseline,
Injection,
Post)
Shallow
Soil flux
Groundwater sampling (USDW)
PFT survey
Deep
CO2 volume, pressure & composition
Reservoir fluid sampling
Injection, temperature & spinner logs
Pulse neutron logs
Crosswell seismic
Vertical seismic profile (VSP)
Experimental
Distributed Temperature Sensing (DTS)
Comparative fluid sampling methods
MBM VSP
Distributed Acoustic Sensing (DAS)
MBM VSP & OVSP Seismic
MVA Method
Frequency

23
CO2 Injection and Storage Site
CO2 Monitoring, Verification and
Accounting
• One new injector (D-9-7 #2)
• Two new deep observation
wells (D-9-8 #2 & D-9-9 #2)
• Two in-zone & above zone
monitoring wells (Citronelle
wells D-4-13 & D-4-14)
• One PNC logging well (D-9-11)
• 12 soil flux monitoring
locations
• PFT monitoring on nine well
pads

24
Shallow MVA
Inoculation
Well/Sample AUG 2012 JUN 2013 NOV 2013
D-9-1 ND ND ND
D-9-2 ND ND ND
D-9-3 ND ND ND
D-9-6 ND ND ND
D-9-7-1 ND ND ND
D-9-8 Invalid Data ND ND
D-9-9 ND ND ND
D-9-10 Invalid Data ND ND
D-9-11 ND ND NDAir Blank 1 ND NST NST
System Blank ND ND
Testing
Soil Flux Sampling Results
USDW Groundwater Sampling
3 - Background Monitoring Events:
January 2012 (N=1) through July 2012
(N=3)
10 - Injection Period Monitoring Events:
November 2012 (N=4) through February
2015 (N=13)
Background anomalies of Mn, Fe, and Cl
above UIC permit discharge limits.
To evaluate the potential exceedance of
regulatory standard (e.g., UIC permit
discharge limit), the EPA GW Unified
Guidance recommends statistical
comparisons (“value to value” comparison
to standard and evaluation of changes
between baseline and monitoring)
Quarterly testing to continue throughout the
PISC
PFT Survey
25
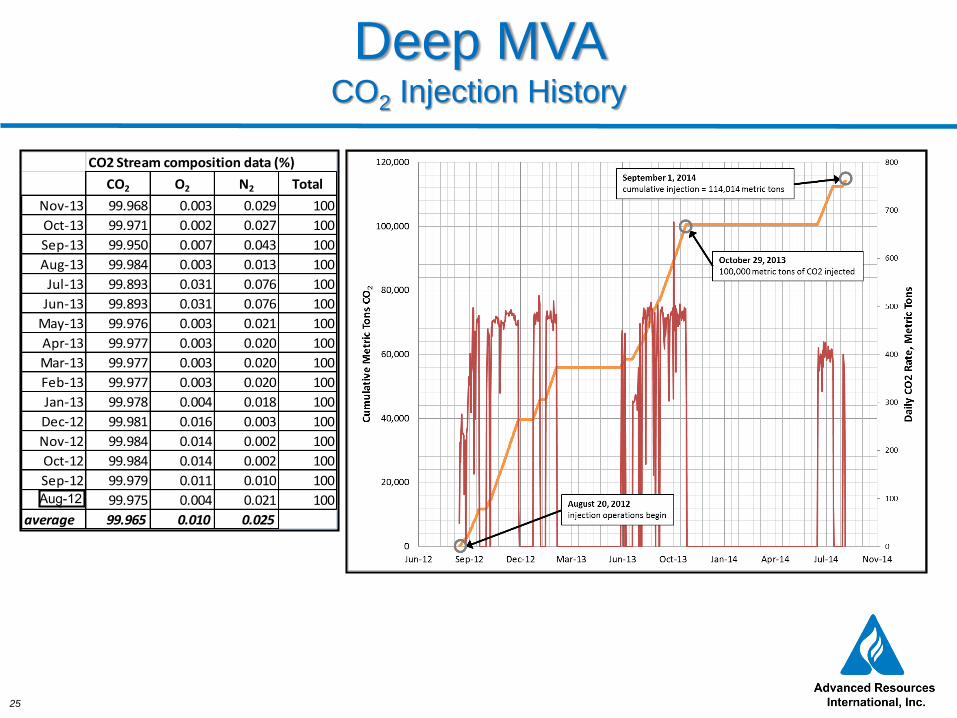
Deep MVA CO2 Injection History
CO2 Stream composition data (%)
CO2 O2 N2 Total
Nov-13 99.968 0.003 0.029 100
Oct-13 99.971 0.002 0.027 100
Sep-13 99.950 0.007 0.043 100
Aug-13 99.984 0.003 0.013 100
Jul-13 99.893 0.031 0.076 100
Jun-13 99.893 0.031 0.076 100
May-13 99.976 0.003 0.021 100
Apr-13 99.977 0.003 0.020 100
Mar-13 99.977 0.003 0.020 100
Feb-13 99.977 0.003 0.020 100
Jan-13 99.978 0.004 0.018 100
Dec-12 99.981 0.016 0.003 100
Nov-12 99.984 0.014 0.002 100
Oct-12 99.984 0.014 0.002 100
Sep-12 99.979 0.011 0.010 100
Aug-13 99.975 0.004 0.021 100
average 99.965 0.010 0.025
Aug-12

26
Deep MVA
D-9-8#2 Downhole Pressure
D9-8#2
D4-14In Zone
D4-13Above
Confinement
CO2 Injected
The system, as expected, is getting
more compressible with continued
injection. As a result, the pressure
transient travel time between the
injection and observation wells
continues to grow.
27
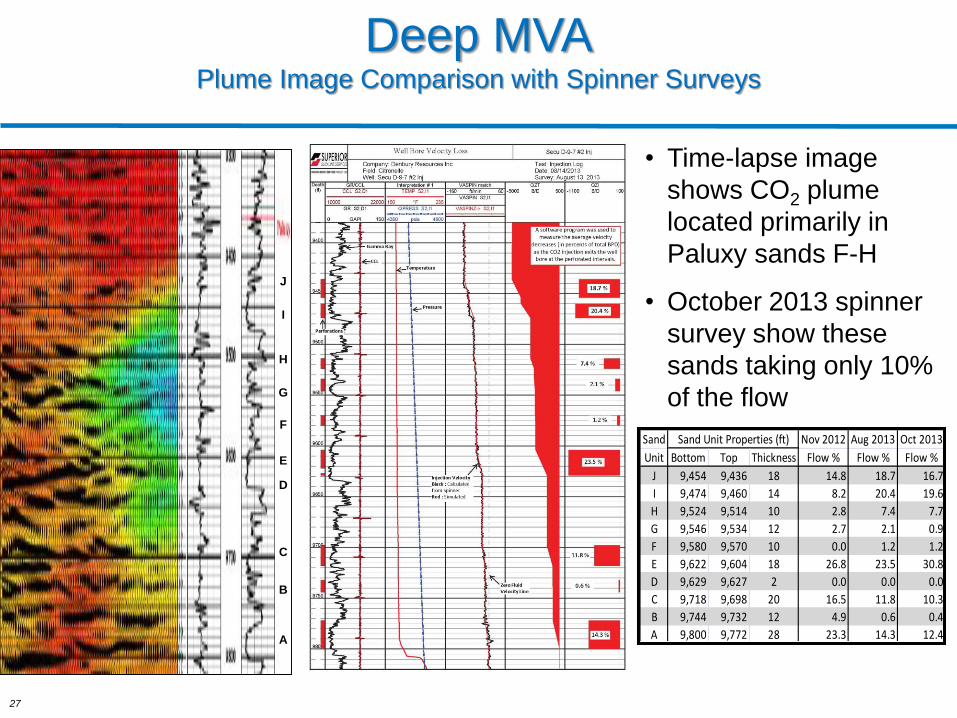
Deep MVAPlume Image Comparison with Spinner Surveys
Sand Nov 2012 Aug 2013 Oct 2013
Unit Bottom Top Thickness Flow % Flow % Flow %
J 9,454 9,436 18 14.8 18.7 16.7
I 9,474 9,460 14 8.2 20.4 19.6
H 9,524 9,514 10 2.8 7.4 7.7
G 9,546 9,534 12 2.7 2.1 0.9
F 9,580 9,570 10 0.0 1.2 1.2
E 9,622 9,604 18 26.8 23.5 30.8
D 9,629 9,627 2 0.0 0.0 0.0
C 9,718 9,698 20 16.5 11.8 10.3
B 9,744 9,732 12 4.9 0.6 0.4
A 9,800 9,772 28 23.3 14.3 12.4
Sand Unit Properties (ft)
A
B
C
D
E
F
G
H
I
J
• Time-lapse image
shows CO2 plume
located primarily in
Paluxy sands F-H
• October 2013 spinner
survey show these
sands taking only 10%
of the flow
28
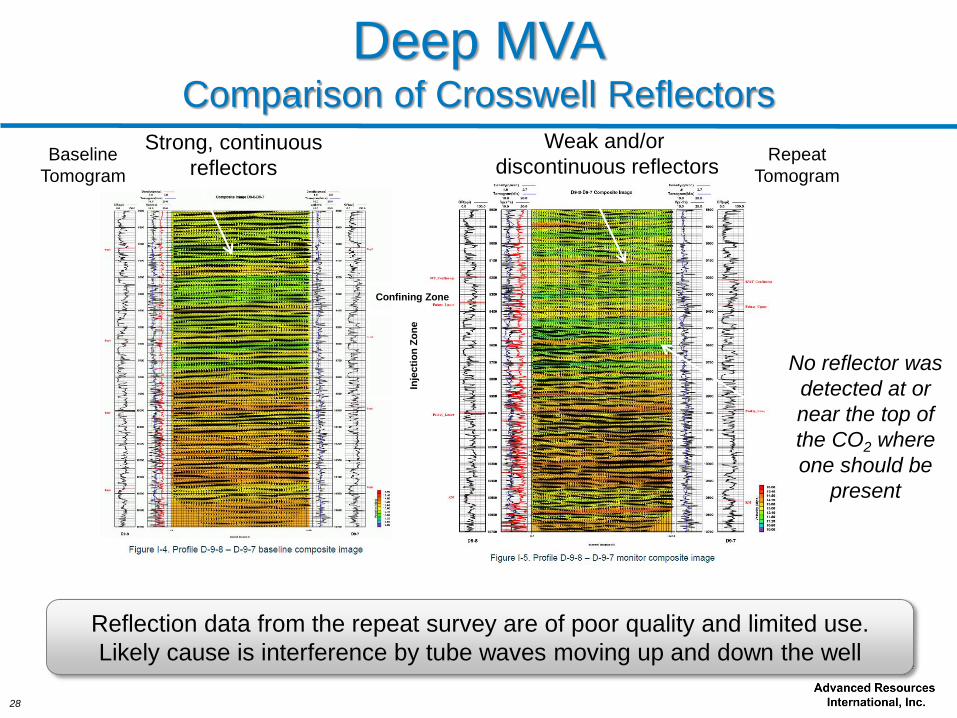
Deep MVAComparison of Crosswell Reflectors
Reflection data from the repeat survey are of poor quality and limited use.
Likely cause is interference by tube waves moving up and down the well
Inje
cti
on
Zo
ne
Confining Zone
Strong, continuous
reflectors
Weak and/or
discontinuous reflectors
No reflector was
detected at or
near the top of
the CO2 where
one should be
present
Repeat
Tomogram
Baseline
Tomogram

29
Time-Lapse Differencing Using the
Baseline and Repeat Velocity Tomograms
Inje
cti
on
Zo
ne
Confining Zone
Pixelized difference tomography results without seismic
reflection overlay showing positive velocity differences
in warm colors and negative differences in cool colors
• First arrivals from repeat survey
were of sufficient quality to
produce a velocity difference
image (right) showing regions
where seismic velocity has
changed over time
• Time-lapse difference image
indicates a decrease in seismic
velocity in the upper injection
zone of up to 3%, suggesting an
increase in CO2 saturation
More importantly, no negative velocity
anomalies are observed in or above
the confining unit…implying no
detectable leakage out of inj. zone
No significant negative
velocity anomalies
Decrease in velocity
(negative anomaly)

30
MBM Geophone Array: Baseline VSP,
OVSP and Walkaway
Map of
VSP
shot
points
Next Step:
Resolution Comparison
• Crosswell ~ 10 feet
• Full VSP ~ 25 – 30 feet
• MBM VSP~ 50 feet
• Establish “fence post”
• Collect time lapse
seismic events
• Collaborative analysis of
varying resolutions

31
MBM Design: Flat-Pack & Geophone
32
Reservoir Modeling

33
Elevation and thickness maps
generated using Petra software
based on available logs
– Divided the interval
between the various sand
flow units and their
associated shaly
interburden units
– Layers further subdivided
to adequately represent
the injection well
perforations and
heterogeneity
• Grid blocks are 400’ by 400’
(before refinement)
52 layers
Model 3D View
Note: Vertical to Horizontal Ratio Exaggeration of 10
Injector
D9-7#2
Monitoring Wells (D4-
13, D4-14 and D9-
8#2)Monitoring
Well D9-8#2

34
Perforation Data
Depth from
Model
Thickness
from Model
Model
Layer
Perforated
Layer
9460 A1 9420.1 7.93 6
9460 A2 9428.0 7.93 7
9460 A3 9436.0 7.93 8 X
9460 B 9443.9 9.5 9 X
9460 C 9453.4 7.7 10
9460 D 9461.1 11.8 11 X
9460 E 9472.9 9.6 12
Interburden 9460 to
95209482.5 22.9 13
9520 A1 9505.4 7.45 14
9520 A2 9512.9 7.45 15 X
9520 B1 9520.3 4.5 16 X
9520 B2 9524.8 4.5 17
9520 C 9529.3 4.1 18
Interburden 9520 to
95409533.4 3.3 19
9540 A 9536.7 5 20 X
9540 B1 9541.7 5.6 21 X
9540 B2 9547.3 5.6 22
9540 C 9552.9 4.4 23
Interburden 9540 to
95709557.3 12.5 24
9570 Top 9569.8 6.2 25 X
9570 B 9576 8.7 26
9570 C 9584.7 4.1 27
Interburden 9570 to
96209588.8 8.6 28
9620 A1 9597.4 5.5 29
9620 A2 9602.9 5.5 30 X
9620 B 9608.4 8.3 31 X
9620 C1 9616.7 4.2 32 X
9620 C2 9620.9 4.2 33
9620 C3 9625.2 4.2 34 X
9620 D 9629.4 8.7 35
9620 E 9638.1 5.7 36
Interburden 9620 to
96709643.8 16.4 37
9670 9660.2 27.3 38
Interburden 9670-9710 9687.5 12.6 39
9710 A 9700.1 18 40 X
9710 B 9718.1 3.2 41
9710 C 9721.3 5.1 42
Interburden 9710 to
97409726.4 6.8 43
9740 A 9733.2 6.7 44 X
9740 B 9739.9 4 45 X
9740 C 9743.9 16.3 46
Interburden 9740 to
98009760.2 20.6 47
9800 A 9780.8 4.6 48 X
9800 B 9785.4 4.7 49 X
9800 C 9790.1 13.3 50 X
9800 D 9803.4 9.6 51
9800 E 9813.0 52
Sand
Name
Perforated
Intervals (ft)
Total Perf
Footage
94609436 - 9454,
9460 -947428
9520 9514 -9524 10
9540 9534 - 9546 12
9570 9570 - 9580 10
96209604 - 9622,
9627 - 962920
9670 N/A N/A
9710 9698 - 9718 20
9740 9732 - 9744 12
9800 9772 - 9800 28
9840 N/A N/A
9900 N/A N/A
9970 N/A N/A
10030 N/A N/A
10040 N/A N/A
10100 N/A N/A
10130 N/A N/A
10310 N/A N/A
10370 N/A N/A
10400 N/A N/A
10470 N/A N/A
10500 N/A N/A
Perforated intervals
respected in the model

35
Permeability and
porosity values from
core plugs were
available for sand
packages 9570 and
9620 at the D 9-7#2
(injector) and for sand
package 9460 at the D
9-8#2 well.
When no core data
were present, density-
neutron porosity and
their equivalent
permeability values
(determined by cross-
plots) were used.
Permeability and Porosity
LayerPerforated
Layer
Model
Porosity
Model
Permeability
9460 A1 0.178 14.1
9460 A2 0.195 56.9
9460 A3 X 0.169 12.5
9460 B X 0.190 45.0
9460 C X 0.200 187.5
9460 D X 0.208 37.6
9460 E 0.212 40.1
9520 A1 0.185 1.2
9520 A2 X 0.185 1.2
9520 B1 X 0.217 17.2
9520 B2 0.217 17.2
9520 C 0.170 0.7
9540 A X 0.208 18.9
9540 B1 X 0.195 4.4
9540 B2 0.195 4.4
9540 C 0.161 0.5
9570 Top X 0.150 1.3
9570 B 0.130 1.6
9570 C 0.150 1.9
Interburden 9460 to 9520
Interburden 9520 to 9540
Interburden 9540 to 9570
LayerPerforated
Layer
Model
Porosity
Model
Permeability
9620 A1 0.218 67.1
9620 A2 X 0.193 48.1
9620 B X 0.193 48.1
9620 C1 X 0.193 48.1
9620 C2 0.210 493.8
9620 C3 X 0.183 87.5
9620 D 0.200 66.9
9620 E 0.167 35.6
9670 0.170 3.3
9710 A X 0.191 28.8
9710 B 0.195 20.0
9710 C 0.180 16.5
9740 A X 0.179 7.0
9740 B X 0.200 23.6
9740 C 0.191 14.4
9800 A X 0.185 42.0
9800 B X 0.196 76.5
9800 C X 0.175 23.0
9800 D 0.187 47.0
9800 E 0.143 2.4
Interburden 9710 to 9740
Interburden 9740 to 9800
Interburden 9570 to 9620
Interburden 9620 to 9670
Interburden 9670-9710

36
Vertical permeability
measured on 9 samples was
found to be on average 4
times smaller than horizontal
permeability: ratio
implemented in the model.
Directional core data on 7
samples showed an average
horizontal anisotropy of 2 but
with an unknown direction.
Vertical & Directional Permeability
Sample Depth Net Confining Porosity Permeability
Number Stress (psig) (%) Klinkenberg (md)
8H 9577.20 1200.00 17.38 34.71
8V 9577.4 - 1200.00 17.21 17.78
9577.50
28H 9597.35 1200.00 21.62 496.23
28V 9597.45 - 1200.00 22.04 462.93
9597.65
29H 9598.35 1200.00 20.20 74.82
29V 9598.45 - 1200.00 19.90 14.14
9598.70
46H 9614.65 1200.00 20.27 167.32
46V 9615.05 - 1200.00 18.07 32.27
9615.30
49H 9617.65 1200.00 17.71 52.28
49V 9618.1 - 1200.00 16.83 6.98
9618.25
52V 9621.2 - 1200.00 20.83 756.16
9621.35
55V 9624.25 - 1200.00 20.42 535.71
9624.45
59H 9627.65 1200.00 13.70 26.50
59V 9627.8 - 1200.00 20.74 612.96
9628.10
61H 9629.75 1200.00 17.06 223.67
61V 9630.05 - 1200.00 12.37 0.80Note: Vertical to Horizontal Exaggeration Ratio of 15

37
Relative Permeability Curves
0
0.1
0.2
0.3
0.4
0.5
0.6
0.7
0.8
0.9
1
0 0.1 0.2 0.3 0.4 0.5 0.6 0.7 0.8 0.9 1
Kr
Sw
Laboratory versus Simulation Curves
Simulation Krw Simulation Krg Krg Sample 16 (2012) Krw Sample 16 (2012) Krg Sample 36
Krw Sample 36 Krg Sample 16 (2011) Krw Sample 16 (2011) Krg Sample 46 Krw Sample 46

38
Injection Rate Match
0
2,000,000
4,000,000
6,000,000
8,000,000
10,000,000
12,000,000
14,000,000
7/1/2012 7/1/2013 7/1/2014
Gas
Rat
e, s
cfd
CO2 Injection Rate
Simulation Injection Rate Actual Injection Rate

39
Pressure at Monitoring Well D 9-8
4,300
4,320
4,340
4,360
4,380
4,400
4,420
4,440
4,460
4,480
4,500
Pre
ss
ure
, ps
ia
D9-8 Bottom Gauge D9-8 Top Gauge Simulation Data
Until end of injection – September 1st, 2014
4,300
4,320
4,340
4,360
4,380
4,400
4,420
4,440
4,460
4,480
4,500
Pre
ss
ure
, ps
ia
D9-8 Bottom Gauge D9-8 Top Gauge Simulation Data
Until September 1st, 2017

40
Pressure at Monitoring Wells
D 4-13 and D 4-14
4000
4050
4100
4150
4200
4250
4300
4350
4400
4450
4500
Jun-12 Sep-12 Dec-12 Mar-13 Jul-13 Oct-13 Jan-14 May-14 Aug-14
Pres
sure
, psi
a
Date
SECU D4-13/ D4-14 Pressure
D4-13 Top D4-13 Bottom D4-14 Bottom
D4-14 Top D4-13 Simulation D4-14 Simulation
D 4-14 Bot
D 4-13 Top
D 4-14 Simulation
D 4-13 Simulation
D 4-14 Top
D 4-13 Bot
Until end of August 2014
4000
4050
4100
4150
4200
4250
4300
4350
4400
4450
4500
Jun-12 Dec-12 Jul-13 Jan-14 Aug-14 Feb-15 Sep-15 Apr-16 Oct-16 May-17
Pre
ssu
re, p
sia
Date
SECU D4-13/ D4-14 Pressure
D4-13 Top D4-13 Bottom D4-14 Bottom
D4-14 Top D4-13 Simulation D4-14 Simulation
D 4-14 Simulation
D 4-13 Simulation
D 4-14 Bot
D 4-14 Top
D 4-13 Bot
D 4-13 Top
Until end of August 2017
41
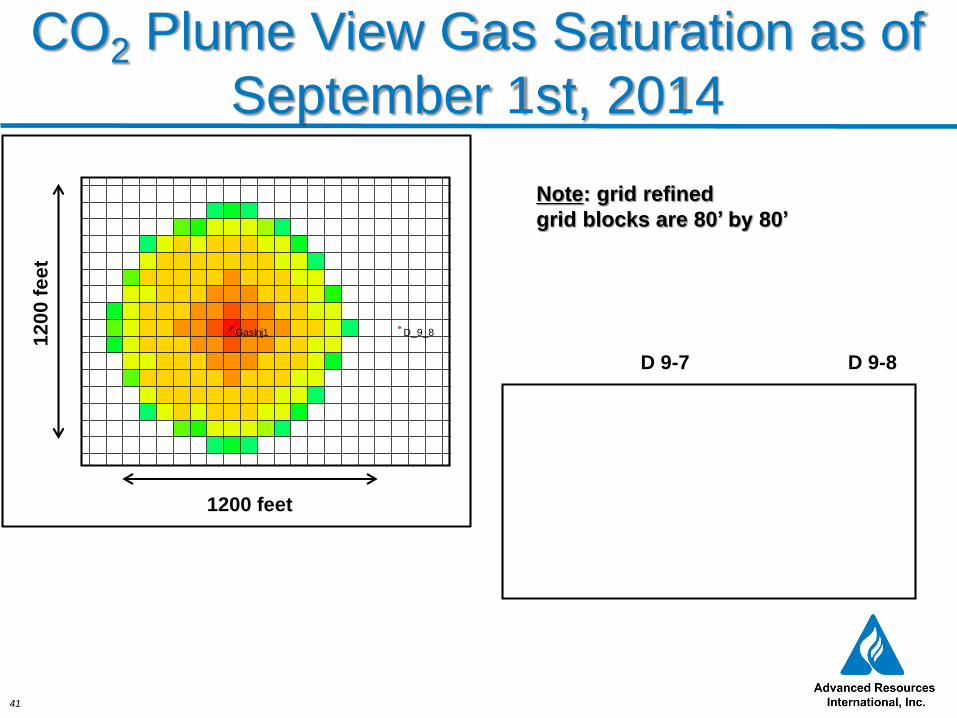
CO2 Plume View Gas Saturation as of
September 1st, 2014
Note: grid refined
grid blocks are 80’ by 80’
D 9-7 D 9-8
12
00
fe
et
1200 feet
D_4_13 D_4_14
D_9_8GasInj1
286,000 287,000
286,000 287,000
38
7,5
00
38
7,7
00
38
7,9
00
38
8,1
00
38
8,3
00
38
8,5
00
38
8,7
00
38
8,9
00
38
9,1
00
38
7,7
00
38
7,9
00
38
8,1
00
38
8,3
00
38
8,5
00
38
8,7
00
38
8,9
00
38
9,1
00
38
9,3
00
0.00 255.00 510.00 feet
0.00 80.00 160.00 meters
File: match_update_fetkovitch20_2-june5.irfUser: anneDate: 6/8/2015
Scale: 1:3943Y/X: 1.00:1Axis Units: ft
0.05
0.13
0.20
0.28
0.35
0.43
0.50
0.58
0.65
0.73
0.80
SECARB Phase 3 - Plant BarryGas Saturation 2014-09-01 K layer: 10
42
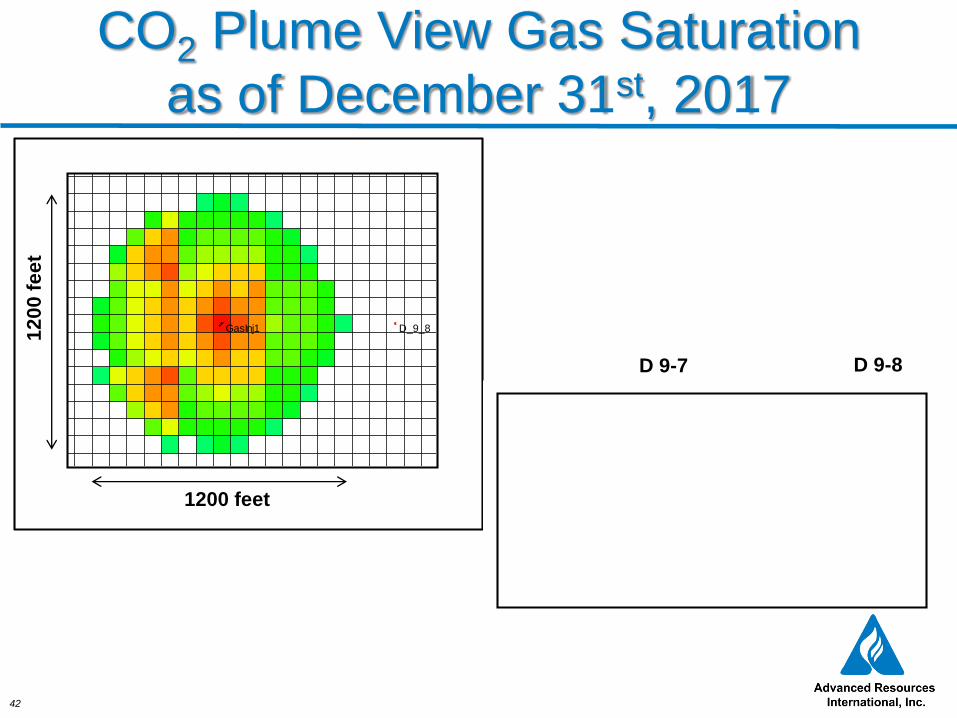
CO2 Plume View Gas Saturation
as of December 31st, 2017
1200 feet
12
00
fe
et
D 9-7 D 9-8
D_4_13 D_4_14
D_9_8GasInj1
286,000 287,000
286,000 287,000
38
7,5
00
38
7,7
00
38
7,9
00
38
8,1
00
38
8,3
00
38
8,5
00
38
8,7
00
38
8,9
00
38
9,1
00
38
7,7
00
38
7,9
00
38
8,1
00
38
8,3
00
38
8,5
00
38
8,7
00
38
8,9
00
38
9,1
00
38
9,3
00
0.00 255.00 510.00 feet
0.00 80.00 160.00 meters
File: match_update_fetkovitch20_2-june5.irfUser: anneDate: 6/8/2015
Scale: 1:3943Y/X: 1.00:1Axis Units: ft
0.05
0.13
0.20
0.28
0.35
0.43
0.50
0.58
0.65
0.73
0.80
SECARB Phase 3 - Plant BarryGas Saturation 2017-12-31 K layer: 10

43
Summary
We have a good capacity, injectivity, and no apparent
formation damage
The injected CO2 volume is accounted for
There is no evidence of CO2 at the off-set monitoring wells
MVA results indicate the CO2 is contained
Data, data, & more data
When deploying non-commercial MVA protocols, redundancy
with more commercial tools is necessary to ensure the data
quality
Every potential storage project is different & MVA should be
site specific in design
Regulators may add to a project’s MVA plan
44
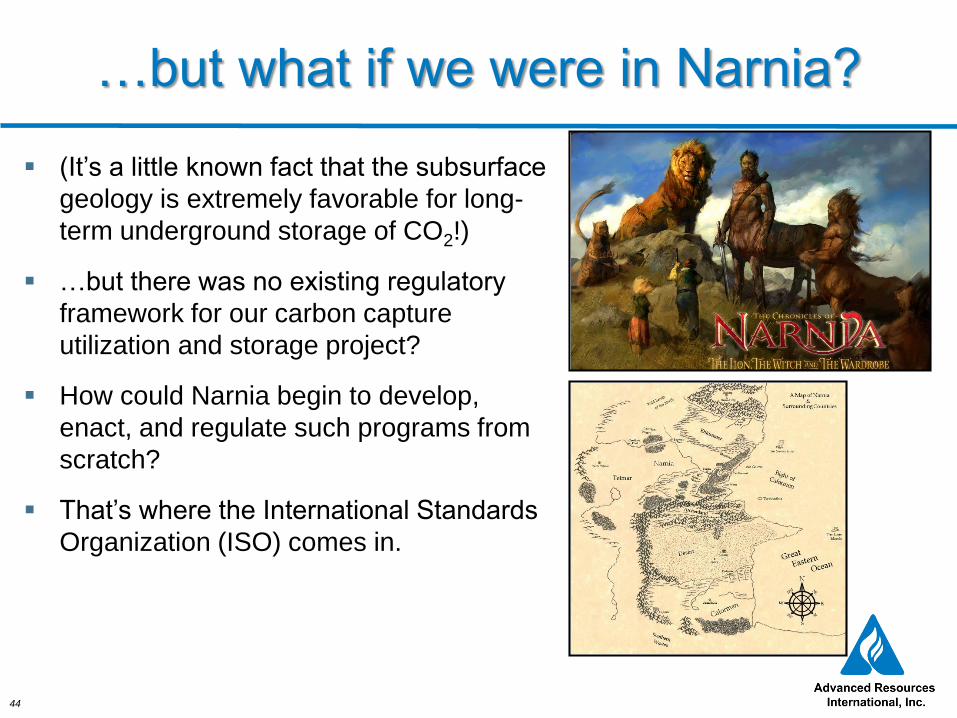
(It’s a little known fact that the subsurface
geology is extremely favorable for long-
term underground storage of CO2!)
…but there was no existing regulatory
framework for our carbon capture
utilization and storage project?
How could Narnia begin to develop,
enact, and regulate such programs from
scratch?
That’s where the International Standards
Organization (ISO) comes in.
…but what if we were in Narnia?

45
What are Standards?
Consensus based
Designed as a rule, guideline
or definition
Revisable and updateable
Voluntary
Standards must fit to purpose:
– Prescriptive based
– Objectives based
– Performance based
– Principles based
– Hybrids
International Standards ISO
Why Standards?
Because they are not laws…
– Standards & regulations can work
together
Not Mandated
Typically initiated by industry…
– And therefore better received and
used by industry because they are
part of the process
Demonstrate regulatory
compliance
Streamline the regulatory process
Harmonize across jurisdictions

46
ISO Standards Development
• ISO does not write standards
• Technical Committees write standards
• P-Member countries approve standards
• Nations adopt ISO standards
• ISO does not influence the technical content
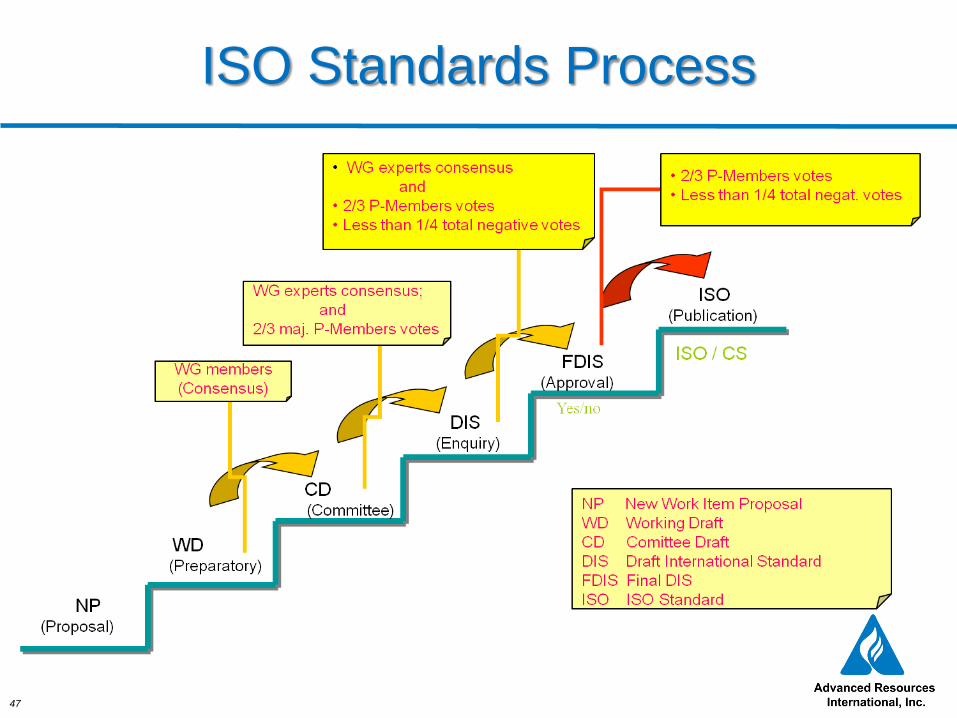
47
ISO Standards Process
48
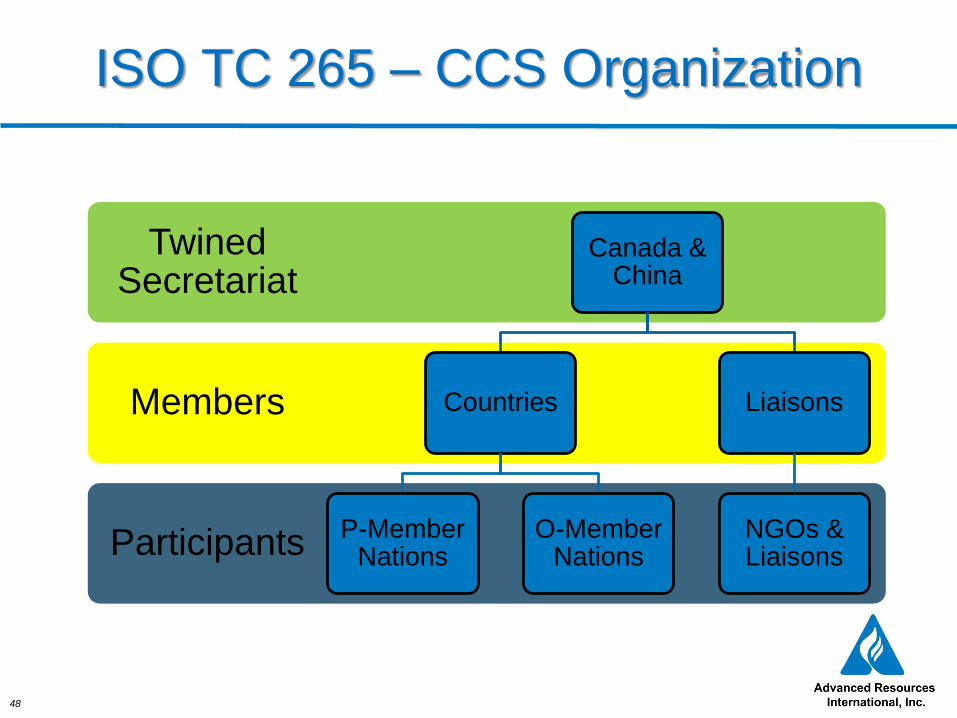
ISO TC 265 – CCS Organization
Participants
Members
Twined Secretariat
Canada & China
Countries
P-Member Nations
O-Member Nations
Liaisons
NGOs & Liaisons
49
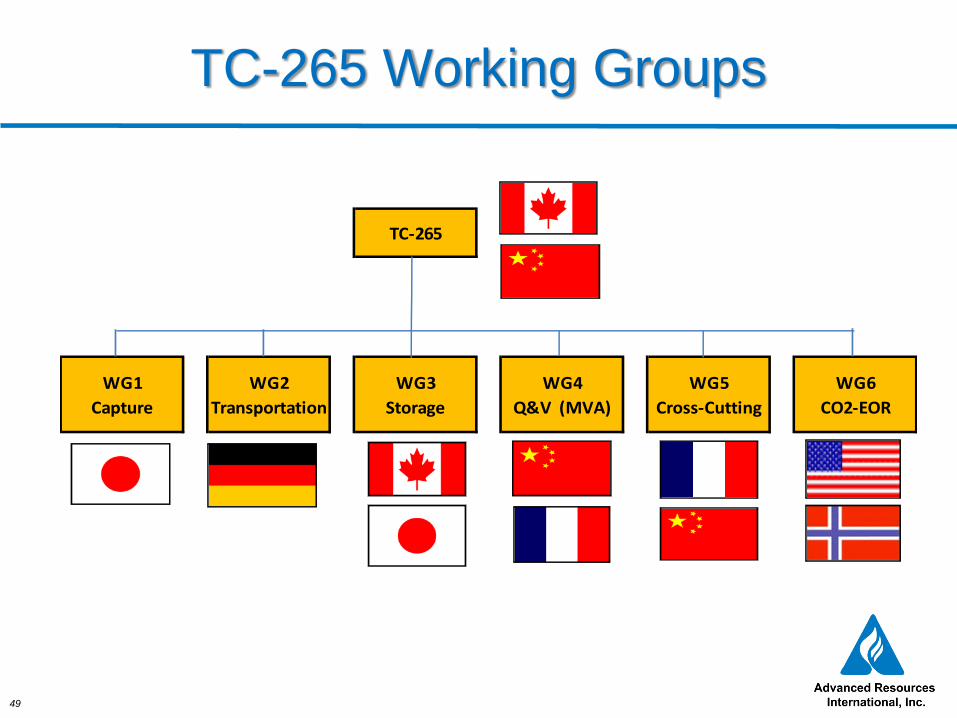
TC-265 Working Groups
TC-265
WG1
Capture
WG2
Transportation
WG3
Storage
WG4
Q&V (MVA)
WG5
Cross-Cutting
WG6
CO2-EOR

50
SECARB Expertise Globally
SECARB Members Richard Esposito, SoCo
Sue Hovorka, UT-BEG
George Koperna, ARI
Shahab Mohaghegh, WVU
Jack Pashin, GSA/OSU
Nino Ripepi, VT
Kimberly Sams Gray, SSEB
Greg Schnacke, Denbury
Mike Surface, Dominion
Steven Carpenter, ARI
~40% of expertise
RCSP Members Andrew Duguid
Jim Ekman
Sarah Forbes
Scott Frailey
Sallie Greenberg
Randall Locke
Sarah Wade
Mark Woods
SECARB + other RCSP
~75% of expertise

51
Thank You!
Washington, DC
4501 Fairfax Drive, Suite 910
Arlington, VA 22203
Phone: (703) 528-8420
Fax: (703) 528-0439
Houston, TX
11931 Wickchester Lane
Suite 200
Houston, TX 77043-4574
Phone: (281) 558-6569
Fax: (281) 558-9202
Cincinnati, OH
1282 Secretariat Court
Batavia, OH 45103
Phone: (513) 460-0360
Knoxville, TN
1202 Kenesaw Ave
Knoxville, TN 37919-7736
Advanced
Resources
Internationalwww.adv-res.com