recruitment & assessment boardoasis.csir.res.in/gum/fupld\mdocs\clc2012\clc2012-dt2704... ·...
TRANSCRIPT

Recruitment & Assessment Board
A CSIR HRM Initiative operational since 2002
To ensure continuous supply of a well motivated highly specified skillful human resource directly required for R&D activities of
CSIR

HRM
• Foundation for excellence for a highly diversified knowledge organisation like CSIR
• Select the best
• Train them
• Put them in the right places
• Career advancement clearly chalked out

11. Career Prospects of Scientists … a scientist is subjected to too many stages for promotion, unlike other
scientific institutions like the IITs …. … the assessments itself are delayed, which adds to the frustration amongst the scientists.
11.1 The Committee feels that if science in India has to progress, the scientists have to be respected and provided proper incentives through faster promotional avenues. … bureaucratic hurdles such as performance assessment should be strictly avoided to attract the best possible talent …The Committee also recommends that the Department should take up the issue regarding improvement in the pay scales of the scientists vigorously with the government to ensure best possible career prospects for them.
Parliamentary Standing Committee on S &T, E & F
April 2010

Need for RAB
• A proposal to Ministry of Finance on revised pay structure and career progression for CSIR scientists vis-a-vis the implementation of 5th Pay Commission.
• Ministry of Finance, Dept. of Expenditure recommends that CSIR modify their Rectt. and Assmt. Pattern/criteria on the DRDO pattern.
• In Oct. 2001 CSIR introduced “CSIR Scientists’ Recruitment & Assessment Promotion Rules 2001 (CSRAP)” for Group IV Scientists on the pattern prevailing at DRDO.
Recruitment and Assessment Board

DS
H
G
F
E II
E I
C
B
Manpower Profile
CSIR – DRDO Comparison
DRDO CSIR 1550
2298
1100
1100
957
365
39
7 0
38
319
979
1017
695
687
687
CSIR has 2691 PhD students

RAB Structure CSIR Society
Governing Body
Director General
Recruitment and Assessment Board
CSIR Hqrs
CSIR Labs
CSIR Complex
AB
PAB
RC MC
Chairman RAB
RAB Office
Administration
Finance
Centres
Technical Divisions
Administration
Finance


RAB’s mandate
• Providing an effective, fair & transparent system of recruitment and assessment acceptable to all stakeholders.
• Attracting the very best talent to CSIR including through global search.
• Ensuring progressive career advancement of CSIR scientists as the highest degree of motivational measure and with an ultimate aim of developing leadership at a younger age.
• Extending the expertise base for external customers, whenever required.
Recruitment and Assessment Board
Powers & Functions of the Board • 1. To review and devise procedure for recruitment and assessment.
• 2. To recommended modifications in the R & A Promotion rules.
• 3. To suggest ways and means to overcome operational difficulties. • 4. Constitution of Assessment Committees • 5. To consider cases of assessment of scientists, who are under cloud and
posthumous cases as per existing CSIR Rules/Procedures. • 6. To discuss and suggest its budgetary and logistic requirements to DG,
CSIR for consideration. • 7. Chairman, RAB may take a decision in the exigencies of work with regard
to recruitment and assessment of scientists.
Recruitment and Assessment Board

Present functions of RAB Sectt.
• Review of R & A Policies.
• Amendments to the provisions of CSRAP Rules.
• Assessment Promotion for B’s to EII’s.
• Constitution of Selection Committees.
• Screening and assessment from F to G.
• Selection of Scientist G’s.
Recruitment and Assessment Board

HR Process

Assessments carried out
Recruitment and Assessment Board
Year B to F F to G
2000-01 616 } 156
2001-02 785
2002-03 924 165
2003-04 897 242
2004-05 996 362
2005-06 863 371
2006-07 751 385
2007-08 642 402
2008-09 360 Phase I 326
Total 6834 2409

Assessment activity during 2007-08
• Yearly no. of Committees constituted.
Level No. of Candidates
assessed Committees constituted
B to F 642 562
F to G 282 57
Recruitment and Assessment Board

Recruitment: The process
A. Through open Advertisement:
Limited role of RAB for multiplicity of subjects.
– Notification for positions. - LAB
– Screening of applications. - LAB
– Constitution of selection committee, and relaxations - RAB, DG
– Conducting interviews. - LAB
– Approval of the proceedings. - RAB
– Issuing offer of selection. - LAB
Staff strength and recruitment pattern is decided by RC.
I. For levels where Director is the Appointing Authority

Recruitment: The process
B. On the BARC School model, CSIR trains BE/B. Tech. degree holders for two years as QHFs, with award of MTech degree – meritorious candidates will be absorbed at Scientist C level.
C. Campus selection at IITs for M. Tech. degree holders have been initiated as ad hoc Sc C’s.
I. For levels where Director is the Appointing Authority

Recruitment: The process
II. For levels where Appointing Authority is VP, CSIR or President, CSIR
RAB is responsible for the selection of Scientist G, OS* & DS*. Directors appointed through search-cum-selection at CSIR Hq.
* Just initiated.

HR Analysis, Planning & Policy

Gr IV Scientists in CSIR as on 1-10-2008
IV(6) 319
IV(1) 687
IV(2) 687
IV(3) 695
IV(4) 1017
IV(5) 979

Gr IV Scientists in CSIR approx. on 1-1-2012
IV(6) 510
IV(1) 311
IV(2) 844
IV(3) 691
IV(4) 782
IV(5) 900
Total: 4038

Position of Gr. IV Scientists as on 1 - 10 - 2008
Lab Gr. IV (1) - B
Gr. IV (2) - C
Gr. IV (3) - EI
Gr. IV (4) - EII
Gr. IV (5) - F
Gr. IV (6) - G Total
AMPRI 5 5 11 12 11 4 48
CBRI 1 11 15 18 21 4 70
CCMB 18 21 8 29 14 9 99
… … … … … … … …
NML 30 28 19 29 22 16 144
NPL 27 26 27 33 59 29 201
SERC 16 10 15 17 24 5 87
TOTAL 687 687 695 1017 979 319 4384

Position of Gr. IV Scientists as reported up to 2012
Lab Gr. IV (1) - B
Gr. IV (2) - C
Gr. IV (3) - EI
Gr. IV (4) - EII
Gr. IV (5) - F
Gr. IV (6) - G Total
AMPRI 0 4 11 8 12 6 41
CBRI 0 1 11 20 17 9 58
CCMB 9 15 19 14 20 17 94
… … … … … … … …
NML 14 31 25 24 24 19 137
NPL 15 46 31 24 36 29 181
SERC 3 23 17 14 18 10 85
URDIP 2 3 0 3 0 0 8
TOTAL 311 844 691 782 900 510 4038

Change in profile of Gr. IV Scientists from 2008 to 2012
Lab 2008 2012 AMPRI 48 41 CBRI 70 58 CCMB 99 94 … … … NML 144 137 NPL 201 181 SERC 87 85 URDIP − 8 TOTAL 4384 4038

Change in HR footprint relative to CSIR total footprint
Lab 2008 2012 Δη
η=X/S η=X/S AMPRI 0.93 0.75 0.18 CBRI 0.83 0.66 0.17 CCMB 0.91 0.95 0.04 … … … … NML 0.93 0.97 0.05 NPL 0.86 0.96 0.11 SERC 0.96 0.93 0.03 TOTAL 1.00 1.00 0.00

Greatest +ve HR footprint change relative to CSIR total footprint

Greatest -ve HR footprint change relative to CSIR total footprint

1
4 3
20 21
7
22
6
13
45 46
42
47
43
2
5
10
26
11
23
12
49
44
48
29
8
18
38
14
41
17
33
9
27
15
24
16
25
28
19
39
31 3230
40
36 3735
0
5
10
15
20
25
30
35
40
45
50
1949 1954 1959 1964 1969
Pay band 37400-67000on 01.02.2009
The Leadership Front
Nominal Roll Rank
Date of birth

1
4 3
20 21
7
22
6
13
45 46
42
47
43
2
5
10
26
11
23
12
49
44
48
29
8
18
38
14
41
17
33
9
27
15
24
16
25
28
19
39
31 3230
40
36 3735
0
5
10
15
20
25
30
35
40
45
50
1949 1954 1959 1964 1969
Pay band 37400-67000on 01.02.2009
The
Missing
Generation
The Leadership Front
Nominal Roll Rank
Date of birth

Performance Evaluation

Performance Ranking of CSIR Laboratories (Paul Ratnasamy’s 4P approach at NCL) A Lab score is assigned to each laboratory, using as parameters, - the performances on basic research (research publications), - applied research (patents, both Indian and foreign), - academic research (number of PhDs produced) and - contract research as well as strategic and societal contributions (ECF, i.e. external cash flow used as a proxy). Lab scores assigned in a rational manner using quantitative data for four parameters– publications (papers), patents, PhDs and ECF.

Methodology For each category (i.e. publications, patents, PhDs or ECF), the performance scores over a trailing period of three years is averaged and divided by the number of scientists in the laboratory, to get a score that is rationalised for the size of the laboratory. Thus from all four categories, each lab will be assigned four scores. These can be represented by a four dimensional vector P = Ai + Bj +Ck +Dl (1) in an imagined four dimensional space spanned by the unit vectors i, j, k and l corresponding to the four categories, namely Publications, Patents, PhDs and ECF. The magnitudes A, B, C and D are the performance values before normalization with respect to the mean.
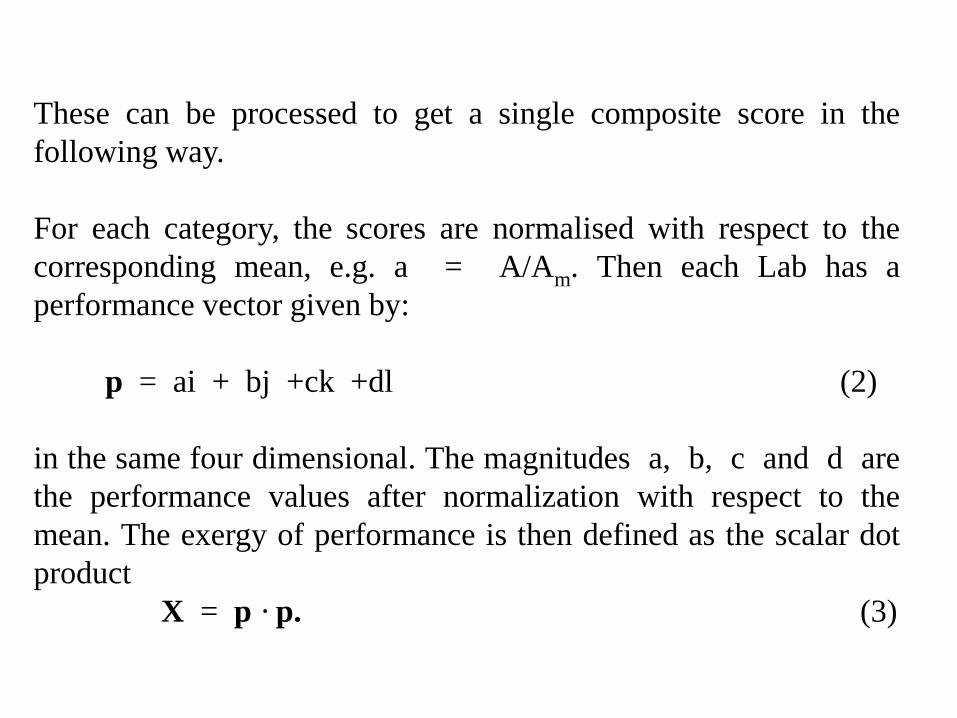
These can be processed to get a single composite score in the following way. For each category, the scores are normalised with respect to the corresponding mean, e.g. a = A/Am. Then each Lab has a performance vector given by: p = ai + bj +ck +dl (2) in the same four dimensional. The magnitudes a, b, c and d are the performance values after normalization with respect to the mean. The exergy of performance is then defined as the scalar dot product X = p · p. (3)

Lab Gr IV Sc
Papers Patents PhDs Paise Papers Patents PhDs Paise X-4P A B C D a b c d
NIIST 75 76.09 2.76 0.22 9.34 6.08 2.66 2.19 1.09 50.07 IICT 209 58.14 2.46 0.36 15.02 4.65 2.37 3.62 1.75 43.37 NCL 234 49.45 1.74 0.30 8.07 3.95 1.68 3.03 0.94 28.50 CSMCRI 92 25.62 4.96 0.07 7.17 2.05 4.80 0.73 0.84 28.43 IICB 77 27.49 1.65 0.45 5.22 2.20 1.59 4.54 0.61 28.31 IGIB 49 30.99 2.86 0.24 18.07 2.48 2.76 2.47 2.11 24.28 CCMB 99 34.21 1.01 0.21 23.34 2.73 0.98 2.07 2.72 20.11 IMT 50 34.83 2.60 0.19 12.49 2.78 2.51 1.95 1.46 19.97 IHBT 46 4.14 2.90 0.15 8.74 0.33 2.80 1.53 1.02 11.34 CDRI 151 15.57 1.24 0.25 9.79 1.24 1.19 2.56 1.14 10.82 IITR 77 25.16 0.09 0.18 7.88 2.01 0.08 1.79 0.92 8.09 NBRI 98 8.33 0.48 0.23 4.25 0.67 0.46 2.30 0.50 6.18 IIIM 65 4.50 1.85 0.09 10.21 0.36 1.78 0.88 1.19 5.50 IIP 78 3.45 1.58 0.03 13.96 0.28 1.53 0.30 1.63 5.15 NIO 171 3.70 0.27 0.05 18.57 0.30 0.26 0.55 2.16 5.14 NGRI 167 2.74 0.70 0.05 17.19 0.22 0.68 0.52 2.00 4.79 CLRI 119 15.97 0.95 0.13 4.16 1.28 0.92 1.33 0.48 4.47 CFTRI 162 10.96 1.48 0.11 2.92 0.88 1.43 1.14 0.34 4.23 NEERI 113 4.27 0.35 0.02 16.67 0.34 0.34 0.24 1.94 4.07 CIMFR 188 0.12 0.35 0.01 16.38 0.01 0.34 0.05 1.91 3.77 NEIST 92 6.80 0.91 0.11 7.68 0.54 0.88 1.13 0.89 3.14 NML 144 3.67 0.86 0.03 7.00 0.29 0.83 0.33 0.82 1.54 IMMT 101 3.77 0.73 0.05 7.19 0.30 0.70 0.47 0.84 1.50 NPL 201 6.84 0.86 0.03 5.45 0.55 0.83 0.30 0.64 1.49 NAL 387 0.80 0.14 0.00 9.90 0.06 0.13 0.03 1.15 1.35 CGCRI 113 6.55 0.53 0.01 7.32 0.52 0.51 0.15 0.85 1.29 CRRI 110 0.11 0.00 0.00 9.50 0.01 0.00 0.00 1.11 1.23 CECRI 131 6.83 0.64 0.06 2.89 0.55 0.61 0.62 0.34 1.17 AMPRI 48 2.91 0.49 0.07 3.22 0.23 0.47 0.70 0.38 0.91 CIMAP 100 1.79 0.73 0.05 2.48 0.14 0.71 0.54 0.29 0.89 SERC 87 0.11 0.00 0.02 7.12 0.01 0.00 0.19 0.83 0.73 CSIO 95 0.37 0.18 0.03 5.92 0.03 0.17 0.32 0.69 0.61 CEERI 93 0.97 0.14 0.01 6.34 0.08 0.14 0.07 0.74 0.58 CBRI 70 2.46 0.19 0.02 5.61 0.20 0.18 0.19 0.65 0.54 CMMACS 26 6.59 0.00 0.00 4.05 0.53 0.00 0.00 0.47 0.50 CMERI 101 0.99 0.50 0.01 4.01 0.08 0.48 0.10 0.47 0.46 NISTADS 43 0.17 0.00 0.01 1.35 0.01 0.00 0.08 0.16 0.03 NISCAIR 66 0.09 0.00 0.00 1.37 0.01 0.00 0.00 0.16 0.03 4384 12.51 1.03 0.10 8.58 1.00 1.00 1.00 1.00 4.00 A=Energy of publications per capita per year as of 2008
B=10* Patents per capita per year
C=PhDs per capita per year D=ECF per capita per year

0.00
0.20
0.40
0.60
0.80
1.00
0.00 0.10 0.20 0.30 0.40 0.50 0.60 0.70 0.80 0.90 1.00
% o
f CSI
R 4P
exe
rgy
% of Gr IV Scientists
CSIR-4P
NIIST
IICT
NCL

0
500
1000
1500
2000
2500
0 100 200 300 400 500
Seco
nd o
rder
indi
cato
r of P
erfo
rman
ce -
qQq
Size of Lab
qQq vs Gr IV Sc
Linear (qQq vs Gr IV Sc)
IICT
NCL
NAL
NIIST
NPL
CSMCRI IICB CCMB
IGIB IMT
Second order indicator for performance vs Size of Lab (i.e. No. of Gr IV Scientists); slope gives quality indicator for Lab.

Lab Filled Sanctioned %Unfilled
CMMACS 27 30 10.00 CMERI 116 130 10.77 IHBT 48 55 12.73 SERC 85 101 15.84 CGCRI 99 121 18.18 CSMCRI 90 111 18.92 NML 137 169 18.93 CCMB 94 116 18.97 NEIST 89 110 19.09 NAL 370 460 19.57 CIMAP 92 115 20.00 NIO 155 200 22.50 IICT 192 250 23.20 CLRI 116 153 24.18 CDRI 148 200 26.00 AMPRI 41 56 26.79 NBRI 82 112 26.79 IMMT 91 125 27.20 NPL 181 254 28.74 NGRI 140 200 30.00 IMT 52 75 30.67 CECRI 120 181 33.70 IGIB 49 75 34.67 NIIST 65 100 35.00 CSIR HQ 76 118 35.59 CSIO 85 135 37.04 CRRI 88 140 37.14 CFTRI 153 251 39.04 CIMFR 161 265 39.25 NEERI 99 165 40.00 NCL 194 325 40.31 IITR 64 110 41.82 CEERI 99 180 45.00
NISTADS 30 55 45.45 IIIM 57 110 48.18 IIP 69 135 48.89 IICB 64 126 49.21
NISCAIR 54 130 58.46 CBRI 58 151 61.59 URDIP 8 TOTAL 4038 5895 31.50 GAP 1857 31.50

Policy: Bold strategies for Indian science Gautam R Desiraju Nature 484, 159-160, 12 April 2012
‘First, provide modest funding to a very large number of small, single-investigator, blue-sky projects — including those in state universities — to achieve a critical density of ideas and a feeling of mass participation and enthusiasm.’

James B Conant
I chose the best. And I left them alone.

Oliver Cromwell
“no one rises so high as he who knows not whither he is going.”