recovery of a top predator mediates negative eutrophic effects on
TRANSCRIPT

Recovery of a top predator mediates negativeeutrophic effects on seagrassBrent B. Hughesa,1, Ron Ebyb, Eric Van Dykeb, M. Tim Tinkera,c, Corina I. Marksd, Kenneth S. Johnsone,and Kerstin Wassona,b
aDepartment of Ecology and Evolutionary Biology, Long Marine Laboratory, University of California, Santa Cruz, CA 95060; bElkhorn Slough NationalEstuarine Research Reserve, Watsonville, CA 95076; cUS Geological Survey, Western Ecological Research Center, Santa Cruz, CA 95060; dSeafloor Mapping Lab,Division of Science and Environmental Policy, California State University, Monterey Bay, Seaside, CA 93955; and eMonterey Bay Aquarium Research Institute,Moss Landing, CA 95039
Edited by Robert T. Paine, University of Washington, Seattle, WA, and approved August 7, 2013 (received for review February 14, 2013)
A fundamental goal of the study of ecology is to determine thedrivers of habitat-forming vegetation, with much emphasis givento the relative importance to vegetation of “bottom-up” forcessuch as the role of nutrients and “top-down” forces such as theinfluence of herbivores and their predators. For coastal vegetation(e.g., kelp, seagrass, marsh, and mangroves) it has been well dem-onstrated that alterations to bottom-up forcing can cause majordisturbances leading to loss of dominant vegetation. One suchprocess is anthropogenic nutrient loading, which can lead to majorchanges in the abundance and species composition of primaryproducers, ultimately affecting important ecosystem services. Incontrast, much less is known about the relative importance ofapex predators on coastal vegetated ecosystems because mosttop predator populations have been depleted or lost completely.Here we provide evidence that an unusual four-level trophic cas-cade applies in one such system, whereby a top predator mitigatesthe bottom-up influences of nutrient loading. In a study of sea-grass beds in an estuarine ecosystem exposed to extreme nutrientloading, we use a combination of a 50-y time series analysis, spa-tial comparisons, and mesocosm and field experiments to demon-strate that sea otters (Enhydra lutris) promote the growth andexpansion of eelgrass (Zostera marina) through a trophic cascade,counteracting the negative effects of agriculturally induced nutri-ent loading. Our results add to a small but growing body of liter-ature illustrating that significant interactions between bottom-upand top-down forces occur, in this case with consequences for theconservation of valued ecosystem services provided by seagrass.
eutrophication | food web | estuary | resilience
Understanding the relative influence of “bottom-up” vs. “top-down” forces on vegetated assemblages has long been an
important conceptual goal of the study of ecology (1–4). As manyvegetated habitats have declined globally in past decades (5–8),with concurrent losses of valued ecosystem services, inves-tigations of drivers of vegetation sustainability have also taken onapplied significance and urgency in conservation science (9, 10).Human activities have altered bottom-up forces, for instance byincreasing nutrient availability (11, 12), and top-down forces,by hunting and fishing of top predators (5, 13). Detecting therelative role of such alterations and interactions between themis critical for supporting key vegetated habitats and their eco-system services.Investigations of bottom-up and top-down forces in a single
system can be challenging. Changes at the top of food webs havebeen demonstrated to affect vegetation in a diversity of ecosys-tems (5, 13–15). However, apex predators have been depleted orlost entirely across most of the natural world (5, 13), includingmany near-shore marine systems (5, 16). It is difficult to un-derstand ecosystem-level effects of an apex predator if it is ex-tremely rare or absent (17). Nearshore systems lacking apexpredators have often undergone conspicuous changes in bottom-up forces resulting from human activities, so attention has focusedon these latter changes, rather than on a potential role for apex
predators or for interactions between top-down and bottom-upchanges to the ecosystems. The few studies that have successfullyinvestigated the relative importance of bottom-up and top-downfactors on dominant vegetation over ecosystem scales have de-termined that strong interactions can occur (3, 18, 19).Seagrasses are a globally distributed group of marine angio-
sperms that provide valued ecosystem services, such as fuelingsecondary production, creation of habitat for many other species(9), shoreline protection, and carbon sequestration from thesurrounding seawater and overlying atmosphere (8, 10). Seagrassbeds have declined in many regions of the world, often becauseof the smothering effects of algal epiphytes that are enhanced bynutrient loading (8, 20, 21). Furthermore, top-down consumercontrol, via mesograzers and small predators, has also beenestablished as an important factor in regulating the interactionbetween seagrass and their algal competitors, especially in ele-vated nutrient loading and eutrophic conditions (16, 22–27).Mediation of competitive interactions between primary pro-ducers is directly controlled by herbivores, which have consis-tently demonstrated preferential consumption of algal epiphytesvs. seagrasses (27–30), thus benefitting rather than harming thedominant primary producer. Additionally, there is strong evi-dence from cage experiments that intermediate predators (suchas fish and crabs) are capable of regulating grazer assemblages inseagrass beds (22, 23, 25, 26), leading to a trophic cascade thatmediates the competition between seagrass and their epiphytes.Seagrass ecosystems thus provide an opportunity to examine bot-tom-up and top-down forces, and the interaction between them.
Significance
Many coastal vegetated ecosystems have declined, affected byhuman alterations to “bottom-up” forces such as nutrientloading from agriculture and by “top-down” forces such asoverfishing of predators. Examining the interactions betweensuch bottom-up and top-down changes is challenging, becausetop predators have disappeared from many of these ecosys-tems. A highly nutrient-loaded estuary in California recentlycolonized by a recovering sea otter population provided anunusual opportunity to examine these interactions. We dem-onstrate that top-down effects of sea otters mitigate negativeeffects of nutrient loading, enhancing growth of seagrass. Graz-ers that remove algae from seagrass are favored by decreasedcrabs resulting from otter predation. Recovery of top predatorscan thus support resilience of coastal vegetated ecosystems.
Author contributions: B.B.H., R.E., E.V.D., M.T.T., C.I.M., K.S.J., and K.W. designed research;B.B.H., R.E., E.V.D., M.T.T., C.I.M., and K.S.J. performed research; B.B.H., E.V.D., M.T.T., C.I.M.,and K.S.J. contributed new reagents/analytic tools; B.B.H., E.V.D., M.T.T., C.I.M., and K.S.J.analyzed data; and B.B.H., R.E., E.V.D., M.T.T., C.I.M., K.S.J., and K.W. wrote the paper.
The authors declare no conflict of interest.
This article is a PNAS Direct Submission.1To whom correspondence should be addressed. E-mail: [email protected].
This article contains supporting information online at www.pnas.org/lookup/suppl/doi:10.1073/pnas.1302805110/-/DCSupplemental.
www.pnas.org/cgi/doi/10.1073/pnas.1302805110 PNAS Early Edition | 1 of 6
ECOLO
GY

Recovery of top predator populations has the potential torestore trophic structure and ecosystem function to degradedecosystems. We found an ideal study system to examine thepotential role of recovering apex predators in mediating bottom-up effects, a nutrient-loaded and eutrophic estuarine ecosystemsupporting eelgrass (Zostera marina) and recovering sea otters(Enhydra lutris). Sea otters are keystone species capable of struc-turing nearshore communities (kelp forests and soft-bottom)through their high predation pressure (31–33). We used a 50-ytime series tracking ecosystem degradation and recolonizationby sea otters, spatial comparisons between sites with varying seaotter predation and nutrient loading, and manipulative mesocosmand field experiments to investigate the interaction between bot-tom-up forces and a recovering top predator population.
Results and DiscussionStudy System and Historical Trends. Elkhorn Slough is a highlynutrient-loaded (Fig. 1 A and B) and eutrophic (34) estuary onthe central coast of California. The adjacent watershed is dom-inated by an agricultural landscape. Annual fertilizer sales in thewatershed region increased from 200 tons nitrogen in the 1930sto 30,000 tons in 2005, which has resulted in an exponential in-crease in nutrient concentrations in Elkhorn Slough through time(P < 0.0005, R2 = 0.90; Fig. 1A and Table S1A). We calculate thatthe current nutrient load to the Elkhorn Slough estuary is 407 kgN·ha−1·y−1 (Table S1B), a load surpassing that of most globalcoastal waters considered highly eutrophic (20, 21, 35).Our time-series analyses revealed remarkable expansion dis-
played by eelgrass in face of extreme nutrient loading (Fig. 1A)and concurrent loss of the adjacent salt marsh (36), which hasbeen demonstrated to buffer the harmful effects of nutrientloading and eutrophication (20). Increases in nutrient concen-trations as early as the 1970s (mean NO3, 16.2 μM) began toexceed baseline levels reported from the 1920s (mean NO3,0.5 μM) (37) and concentrations from adjacent ocean sources(mean NO3, 5.0 μM) (38). Nutrient concentrations more thandoubled from 1971 (mean NO3, 13.1 μM) to 1977 (mean NO3,29.6 μM). This increase in nutrients coincided with declines ineelgrass bed extent from 1965 to 1984 (Fig. 1A). However, theexpected decline in eelgrass has reversed twice during the pastthree decades, in the first instance following initial recoloniza-tion of Elkhorn Slough by sea otters, and in the second instancefollowing a sharp increase in otter abundance after a period oflower numbers. Before sea otters first colonized in 1984, eelgrasswas at an all time low (2 ha), and nutrient concentrations, al-though still high, were an order of magnitude lower than themost recent period of eelgrass recovery (Fig. 1A). The otterdensity following the initial colonization was lower than the morerecent period, yet their effect was probably sufficient to promoteexpansion of eelgrass in lower nutrient conditions, as sea ottersare capable of greatly reducing their prey populations (i.e.,crabs) in short time periods (<3 y) (39). Sea otter densities weresignificantly correlated with extent of eelgrass (P < 0.019, R2 =0.52; Table S1C), and since the initial sea otter recolonization in1984, eelgrass bed extent increased by 600% (Fig. 1A). Ina global context (Fig. 1B), this expansion of eelgrass in the set-ting of severe nutrient loading is anomalous; empirical evidencefrom other estuaries as well as modeling (20, 21, 35) predicts thatElkhorn Slough should have undergone dramatic seagrass loss,not expansion. However, following the most recent period of seaotter decline (2000–2004; Fig. 1A), the relationship betweennutrient loading and seagrass loss was much closer to the modelprediction from estuaries worldwide (Fig. 1B).If a sea otter-driven trophic cascade was contributing to the
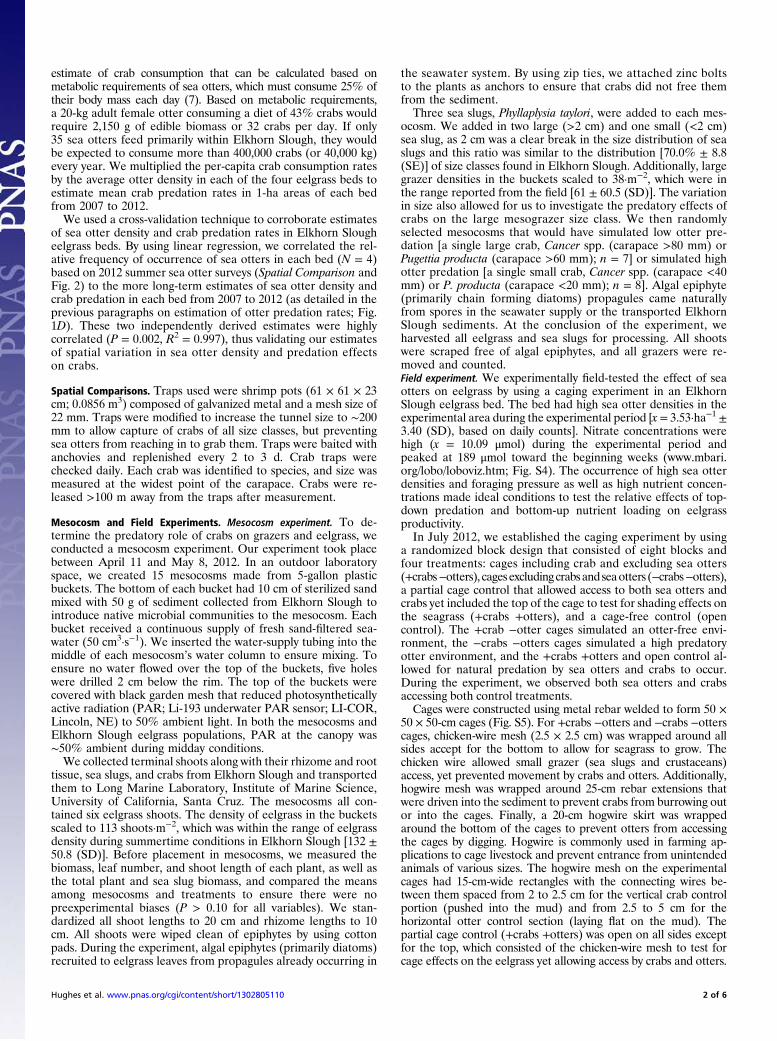
expansion of eelgrass beds, we hypothesized that the most likelytrophic link between otters and mesograzers would be crabs,which are a common prey item for sea otters (40), and are theprimary intermediate predator in sea otter diets. We examinedotter foraging data from the past decade and determined thatcrabs of all species comprised 52% of the total diet of sea ottersforaging on or near eelgrass beds in Elkhorn Slough, with crabs
from the genus Cancer making up 43% of the sea otter diet(Fig. S1). Sea otters are well known to limit populations of theirmacroinvertebrate prey, including crabs (41), and thus we pre-dicted that the expansion of otter populations in the estuaryshould have resulted in negative impacts on crabs. Indeed, wedetected a significant decline in the biomass (P < 0.0005) and
Fig. 1. Historical analysis of nutrients, eelgrass, sea otters, and crabs inElkhorn Slough. (A) Fifty years of eelgrass declines and expansion driven bybottom-up nutrient loading and top-down sea otter-driven trophic cascadeeffects. Nitrate data (N = 28) represent the annual mean, and the solid line isa an exponentially modeled linear function of the entire data series (1971–2011; Table S1A). Sea otter (N = 30) and eelgrass (N = 13) data are repre-sented by dotted lines to visually show trends. (B) Metaanalysis showing therelationship between land-derived nitrogen loads entering estuaries andpercent change of seagrass estimated from areal surveys. Worldwide andWaquoit Bay, MA (an estuary with varying nutrient loading), data areredrawn from Burkholder et al. (21) (with permission from the pub-lisher). Elkhorn Slough data (Table S1B) are not included in the log-linearrelationship (solid lines), but are plotted for periods following sea-otterdecline (2000–2004), and sea-otter recovery (2005–2010) to demonstratedeparture from the model. (C ) Results from crab surveys a decade beforesea otter colonization (1971–1976) and two decades after sea otter coloni-zation (2005–2009; Table S1D; Methods provides a sample size description).(D) Eelgrass bed expansion (2006–2012) at eelgrass beds (n = 4) in ElkhornSlough (calculated as the percent increase in cover of eelgrass as a functionof available eelgrass habitat, measured in hectares; Fig. S3) correlated withestimated sea otter predation on crabs in standardized 1-ha plots (Fig. S2) ineach bed (Table S1E).
2 of 6 | www.pnas.org/cgi/doi/10.1073/pnas.1302805110 Hughes et al.

size of crabs in the estuary (Cancer antennarius, P < 0.0005; andCancer productus, P < 0.0005; Fig. 1C). Sea otters were mostlikely to cause declines in crab populations because sea otterswere expanding during a period when other crab predators,namely sharks and rays, were in a state of decline, in part asa result of overfishing from four decades (1951–1995) of annual“shark derbies” (42). Additionally, leopard sharks (Triakis sem-ifasciata), one of the most abundant top predators in the estuary,experienced a diet shift from crabs before otter colonization tofat innkeeper worms (Urechis caupo) after sea otter colonization,indicating an overall decline in crab availability (43). Further-more, crab harvesting in Elkhorn Slough has declined in the pasttwo decades compared with the 1970s when crab harvesting wascommon (44), and, in 2007, most of the estuary was declareda Marine Protected Area, thus eliminating all crab harvesting inand around the eelgrass beds. The offshore “rock crab” fishery,which includes both C. antennarius and C. productus, is a rel-atively small fishery compared with the much larger Dungenesscrab (Cancer magister) fishery, and yielded only an average of3,000 kg annually from 1960 to 2010 (45) and peaked in 1989when eelgrass was in a period of recovery (Fig. 1A). The de-crease in populations of other top predators and the lack ofoverharvesting of crabs in and around the estuary all suggest thatthe observed decline in Cancer crab biomass and size in ElkhornSlough was a a result of sea otter predation.To more closely examine the potential relationship among
otters, crabs, and eelgrass, we quantified otter predation on crabsin each eelgrass bed in Elkhorn Slough from 2006 to 2012 (SIMethods) and correlated it with eelgrass bed expansion (i.e.,percent increase in eelgrass cover) after recovery from the mostrecent decline (2000–2004) in which >50% of eelgrass was lost.Eelgrass expansion during the ensuing 6-y period was positivelycorrelated with sea otter predation on crabs (P = 0.021, R2 =0.96; Fig. 1D and Figs. S2 and S3).Combining results from historical analyses on the relationship
among otters, crabs, and seagrass with previous published resultson the control of algal epiphytes on seagrass by mesograzers (22–30) generated a hypothesized mechanism by which sea ottersmediate bottom-up effects on seagrass. In our conceptual model,a four-level trophic cascade modulates negative algal epiphyteeffects on eelgrass, with sea otters controlling intermediatepredator crab populations, thereby releasing mesograzers frompredation and enhancing their grazing effects on algal epiphytes(Fig. 2A).
Spatial Comparisons. To examine the importance of sea otters inestuarine eelgrass beds, we compared properties of eelgrass bedsbetween Tomales Bay and Elkhorn Slough, CA, which are sim-ilar in many physical (46) and biological attributes but differ inthe presence of sea otters and nutrient loading. Nitrate con-centrations are lower in Tomales Bay (0–23 μM) (47) than theyare in the eutrophic (34, 48) Elkhorn Slough (10–600 μM).Elkhorn Slough presently supports as many as 120 otters, but seaotters have yet to recolonize Tomales Bay. The reason for thisdifference is historical accident: southern sea otters recoveredfrom a remnant population in central California after near ex-termination from the maritime fur trade industry. The currentnorthern range extent is at Pigeon Point, ∼185 km south ofTomales Bay as the otter swims (49), thus precluding the use ofTomales Bay by sea otters in the present day. However, pre-historic midden site records indicate that sea otters were oncecommon in estuaries along the entire central California coast,including the Tomales Bay region (50).We systematically sampled both estuaries for eelgrass above-
ground and belowground biomass, algal epiphyte load, grazerbiomass and density, and crab biomass and size. Eelgrass beds inElkhorn Slough had significantly lower crab biomass (P = 0.034)and size [for both of the common large crab species, C. anten-narius (P = 0.034) and C. productus (P = 0.009); Fig. 2B] andgreater aboveground eelgrass biomass (P = 0.035) than TomalesBay (Fig. 2E), as predicted for the estuary with otters present
(Table S2). Crab biomass and sizes for Tomales Bay (Fig. 2B)were similar to those for Elkhorn Slough before the otterrecolonization (Fig. 1C), further indicating that otters are con-trolling crab populations in Elkhorn Slough. Eelgrass below-ground biomass, epiphyte loading, grazer biomass, and largemesograzer density (Phyllaplysia taylori and Idotea resecata >2 cm,the size class most likely to be consumed by crabs; Fig. 2 C–E) didnot significantly differ between estuaries between Tomales Bayand Elkhorn Slough, but varied in the direction predicted by ourmodel (Fig. 2A).Remarkably, comparisons between Tomales Bay and Elkhorn
Slough indicated that eelgrass can perform equally, if not better,in nutrient-loaded and eutrophic conditions (34) (Movie S1).High spatial variation of crabs, grazers, epiphytes, and eelgrassabundance characterize Elkhorn Slough, indicating the potentialfor a gradient in the key forcing processes (Fig. 2 B–E). Ouranalyses indicate that sea otters are a key driver of this variation(Table S3). Otter density across eelgrass beds within ElkhornSlough was negatively correlated with crab biomass (P = 0.043,R2 = 0.92) and size (C. antennarius, P = 0.040; R2 = 0.92; and C.productus, P = 0.061, R2 = 0.88; Fig. 2B). Large mesograzerdensity varied positively and significantly (P = 0.041, R2 = 0.92;Fig. 2C) with increased sea otter density. Although the sea otterdensity gradient was not significantly correlated with grazer
Fig. 2. (A) Interaction web of top-down and bottom-up effects in the eel-grass study system. The top predator is the sea otter (E. lutris), the meso-predators are crabs (Cancer spp. and Pugettia producta), the epiphytemesograzers are primarily an isopod (I. resecata) and a sea slug (P. taylori),and algal epiphyte competitors of eelgrass primarily consist of chain-formingdiatoms, and the red alga Smithora naiadum. Solid arrows indicate directeffects, dashed arrows indicate indirect effects, and the plus and minussymbols indicate positive and/or negative effects on trophic guilds and eel-grass condition. C, competitive interaction; T, trophic interaction. (Originalartwork by A.C. Hughes.) (B–E) Survey results testing for the effects of seaotter density on eelgrass bed community properties (Tables S2 and S3).Elkhorn Slough (sea otters present and high nutrients) eelgrass beds (n = 4)are coded in red, and the Tomales Bay reference site (no sea otters, lownutrients) beds (n = 4) are coded in blue. (B) Crab biomass and size structureof two species of Cancer crabs; (C) grazer biomass per shoot and large grazerdensity; (D) algal epiphyte loading; and (E) aboveground and belowgroundeelgrass biomass. DW, dry weight; FW, fresh weight.
Hughes et al. PNAS Early Edition | 3 of 6
ECOLO
GY

biomass (Fig. 2C), the covarying trend was in the predicted di-rection (Fig. 2A). Algal epiphyte loads on seagrass significantlydecreased with increased sea otter density (P = 0.025, R2 = 0.77;Fig. 2D). Finally, eelgrass shoot density (P = 0.003, R2 = 0.99),aboveground biomass (P = 0.012, R2 = 0.98), and belowgroundbiomass (P = 0.013, R2 = 0.97; Fig. 2E) significantly increasedwith higher sea otter density.
Mesocosm and Field Experiments. To test the proposed mecha-nisms underlying the individual links in our ecological model(Fig. 2A), we conducted a series of mesocosm and field experi-ments. The mesocosm experiment supported the postulated foodweb links among crabs, mesograzers, epiphytes, and eelgrass.Mesocosms simulating low otter predation had decreased overallsea slug biomass and increased large (P. taylori >2 cm) sea slugmortality through observed predation by crabs (Fig. 3A), whichled to increased algal epiphyte loads (Fig. 3B) and a net loss ineelgrass biomass and reduced rhizome elongation (Fig. 3C andTable S4). The reduced mortality rate of large sea slugs in thetreatment mimicking high sea otter predation suggested thatsmaller crabs are inefficient predators, thereby releasing meso-grazers from predation and increasing grazing efficiency.We verified the underlying mechanism of the sea otter-driven
trophic cascade effects on eelgrass by using a field cage experi-ment that tested for (i) no sea otter predation (crab inclusion),(ii) simulated sea otter predation (crab and otter exclusion), and(iii) actual sea otter predation (crabs and otters included). After1 mo, grazer biomass and large grazer density (P. taylori andI. resecata >2 cm, the size class most likely to be consumed bycrabs) were significantly greater (Fig. 3D) in the cages with sim-ulated and actual sea otter predation (Table S5). As predicted,algal epiphyte loads were significantly lower (Fig. 3E), and above-ground and belowground eelgrass biomass (Fig. 3F) as well asshoot density (Table S5) was significantly greater in treatmentswith actual and simulated sea otter predation.
ConclusionTaken together, these lines of evidence strongly indicate thatcomplex top-down effects of sea otter predation have resulted in
positive benefits to eelgrass beds, mitigating the effects of con-tinuing and increasing nutrient loading in Elkhorn Slough. Ourfindings add to a growing body of literature in seagrass ecology(22–30) that highlights the importance of consumer controls inregulating the conflict between seagrasses and their algal epi-phytes. In this case, the addition of an apex predator mediatesspecies interactions at the base of the food web and counteractsthe negative effects of anthropogenic nutrient loading. Our find-ings depart from a view of nature built largely around bottom-upcontrol, which has been the dominant predictor in explainingseagrass loss for more than three decades (12, 20, 21, 35, 51, 52).Here we have demonstrated that sea otters initiate a trophic
cascade in estuarine ecosystems superficially similar to that in themore familiar kelp forest model (31, 33): in both cases, increasesin sea otters result in increases in the dominant, habitat-formingcoastal vegetation. However, the mechanism by which sea otterpredation supports vegetated habitat differs fundamentally be-tween kelp forests and estuaries: the estuarine trophic cascadeinvolves four trophic levels, not three. The explanation for thisapparent anomaly lies in two details of the natural history of theestuarine autotrophs and their herbivores: the herbivores pref-erentially feed on epiphytic algae vs. eelgrass, and the epiphyticalgae can harm eelgrass through shading effects in the absence ofherbivory (Fig. 2A). These indirect effects may be particularlypronounced in nutrient-loaded systems, which foster ephemeralalgal growth. More broadly, multilevel trophic cascades involvingindirect effects may be particularly important in systems withstrong alteration of bottom-up controls (3, 16). Our findingshighlight the importance of unraveling the potentially interactivenature of these key ecological processes when assessing thedrivers of vegetated ecosystems.
MethodsHistorical Trends. To detect correlations between eelgrass cover and bottom-up and top-down forces, we synthesized data from a variety of sources. Wedetermined trends in the bottom-up influences on the Elkhorn Slough eel-grass beds by constructing a time series of nutrient concentrations in ElkhornSlough. All samples were collected in the lower part of the estuary adjacent tothe historical and present day distribution of eelgrass and sea otters. Surface
Fig. 3. Results from a 30-d mesocosm experiment (A–C)comparing the effects of simulated low (large crab treat-ment; n = 8) and high (small crab treatment; n = 7) sea otterpredation on (A) net change in grazer biomass and grazermortality, (B) algal epiphyte load, and (C) eelgrass growthand rhizome elongation (Table S4). (D–F) Results from a30-d field cage experiment (Fig. S5) testing for the effects ofsimulated low sea otter predation (i.e., cages including crabsand excluding sea otters; n = 6), simulated high sea otterpredation (i.e., cages excluding crabs and sea otters; n = 8),and actual high sea otter predation (which included (i)partial cage control that allowed access to both sea ottersand crabs yet included the top of the cage to test forshading effects on the seagrass and (ii) cage-free plots; n =16) on (D) grazer biomass and large grazer density, (E) algalepiphyte load, and (F) aboveground and belowgroundeelgrass biomass. Differences in lettering indicates signifi-cant differences based on randomized blocked ANOVA andTukey HSD tests (Table S5). DW, dry weight; FW, freshweight. Error bars are ±1 SEM.
4 of 6 | www.pnas.org/cgi/doi/10.1073/pnas.1302805110 Hughes et al.

water samples were collected monthly by hand and analyzed for nitrate asnitrogen (in micromolars; SI Methods). We modeled the increase in nitrateconcentrations by correlating the year to the mean annual nitrate concen-tration (N = 28) by using regression analysis.
We mapped eelgrass cover in the estuary and quantified change throughtime by interpreting low altitude vertical aerial imagery acquired between1966 and 2012. We only used years (N = 13) through which eelgrass covercould be determined with high confidence based on historical descriptionsand recent ground surveys of distribution (SI Methods). To determine thelong-term trends in sea otter densities in Elkhorn Slough, we used thestandardized biannual census counts from the US Geological Survey (USGS)(www.werc.usgs.gov). This database has summarized sea otter abundance inElkhorn Slough from 1-d surveys in the spring and fall from 1985 to 2012.Sea otters first entered Elkhorn Slough in 1984, so, for this year, we useda study by Kvitek et al. (32) to estimate the number of otter arrivals in theestuary. To determine the relationship between sea otter abundance andeelgrass cover, we used regression analysis by correlating eelgrass cover forall available years during the sea otter expansion period (1984–2012) withthe mean annual sea otter density (N = 10).
We summarized land-derived nutrient loads from 2004 to 2012 andpercent change in eelgrass during the most recent period of sea otter decline(2000–2004) and otter recovery (2005–2012). The nitrate load to ElkhornSlough was determined from hourly measurements of nitrate concentrationand water depth at the Land/Ocean Biogeochemical Observatory L01mooring near the mouth of Elkhorn Slough (53). The volume flux past themooring each hour was determined from the change in water depth and theobserved bathymetry of the system above the mooring. The accuracy ofthese volume fluxes was independently assessed by comparison with a long-term set of Acoustic Doppler Current Profiler data collected at the L01mooring (54). The total nitrate flux was then determined from the volumeflux times the observed nitrate. The nitrate load from terrestrial sources wasestimated as the volume flux times the fraction of any observed nitrateconcentration greater than 30 μM. The 30-μM threshold was chosen becausenitrate in surface waters of Monterey Bay never exceeds this value (55). Thenitrate load from terrestrial sources is a minimum estimate because itignores any nitrate from terrestrial sources when nitrate concentrations areless than 30 μM. However, the load estimated for terrestrial sources is 66%of the total load and cannot be seriously in error because there is alsoa nonnegligible load from ocean sources. The final annual load values werecalculated by dividing nitrogen load (in kilograms) by the total wetland area(in hectares) for Elkhorn Slough (36). Finally, we used the mean nitrogenload from 2004 to represent the most recent period of eelgrass and sea otterdecline, and the mean from 2006 to 2012 to represent the most recent pe-riod of eelgrass and otter recovery for a global comparison with other es-tuaries (20, 21, 35).
We tested for the effects of long-term otter predation on the ElkhornSlough crab population by comparing two time periods: 1971 to 1976 (adecade before otter immigration) and 2005 to 2009 (two decades after otterimmigration). Data were collected from a similar region in the lower part ofthe estuary directly adjacent to the present-day and historical distributions ofeelgrass and sea otters (SI Methods). We calculated crab biomass caught instandardized crab traps by converting the carapace width values of eachcrab to an edible biomass by using a power function (56), and summed upthe total biomass for each trap. To ensure independence among samples, weused the mean crab mass per trap per day [n = 17 (1971–1976), n = 26 (2005–2009)] and mean daily carapace width for the two most abundant crabspecies, C. antennarius [n = 14 (1971–1976), n = 12 (2005–2009)] and C.productus [n = 14 (1971–1976), n = 11 (2005–2009)]. We compared crabbiomass and size among the two time periods by using an independent-samples t test.
We estimated eelgrass bed expansionwithin Elkhorn Slough as the percentchange in eelgrass cover (in hectares) from 2006 to 2012 as a function of otterpredation over the same survey period. Georeferenced aerial imagery fromMay 24, 2006, and May 5, 2012, was used to conduct object-based classifi-cation of the surface area extent of eelgrass beds (Fig. S3). Areas of suitablehabitat for eelgrass were spatially delineated by using high-resolution (2 m)multibeam bathymetry from 2005 and 2011 and aerial Light Detection andRanging (2 m) from 2004 and 2011 to create continuous digital elevationmodels in ArcMap version 10.1 (Environmental Systems Research Institute,Redlands, CA). To measure crab predation by sea otters, we used observa-tional data on sea otter foraging collected between 1999 and 2012 by fieldstaff of the Monterey Bay Aquarium and USGS. This data set comprised>10,000 observed feeding dives recorded from tagged and untagged seaotters feeding in the main channel of Elkhorn Slough. We analyzed thesedata by using a previously described Monte Carlo simulation algorithm for
estimating prey-specific consumption rates from observational data whileaccounting for sampling uncertainty (57). By multiplying the mean estimatedconsumption rate by the average density of otters in each eelgrass bed (Fig.S2), we calculated the rate of crab predation (in crabs per hectare per year) ineach of the four eelgrass beds (SI Methods). Eelgrass bed expansion was cal-culated by subtracting the percent coverage of eelgrass within the availablehabitat in 2006 by the percent coverage of eelgrass within the availablehabitat in 2012 for each of the four eelgrass beds (Fig. S3). We used linearregression to determine the relationship between eelgrass bed expansion asa function of sea otter predation (n = 4).
Spatial Comparisons. To determine eelgrass condition and communitystructure at eelgrass beds with varying sea otter densities, we sampled across100-m transects at the only four large beds in Elkhorn Slough (36° 48′ 45″ N,121° 46′ 10″ W; Fig. S2) and four Tomales Bay beds (38° 11′ 53″ N, 122° 56′30″ W). All transects bisected the central portion of each bed as well as thestandardized 1-ha sea otter foraging/crab survey area (as detailed later; al-though Tomales Bay had no sea otter surveys, as none were present). Elk-horn Slough eelgrass beds were sampled in July and August 2012, andTomales Bay beds were sampled in August 2012. At each bed, we system-atically sampled eelgrass every 10 to 12 m by using 0.50 × 0.50-m quadrats.Within each quadrat (N = 8), we counted all eelgrass shoots and collectedfive shoots along with >7 cm of their rhizome and root material. All shootswere scraped free of algal epiphytes and all grazers were removed andcounted. All grazers, epiphytes, and eelgrass were dried at 60 °C for 24 hand weighed.
We quantified crab densities, biomass, and sizes at Elkhorn Slough andTomales Bay. At Elkhorn Slough, a single crab trap was placed in each of thefour eelgrass beds during the month of July 2012. The same method wasused to sample crabs at the four eelgrass beds in Tomales Bay for 1 wk inAugust 2012. We calculated the catch per unit effort (CPUE) for each dailytrapping effort by converting the carapace width values of each crab toan edible biomass using a power function (56), and summed up the totalbiomass for each CPUE. CPUE was standardized to the total soak time (inhours) for each daily sampling effort. The mean CPUE and mean daily carapacewidth for the two most abundant crab species, C. antennarius and C. productus,were used in the final regression analysis (N = 4; SI Methods).
To determine variation in sea otters among the four beds in ElkhornSlough, we surveyed otter densities in the eelgrass survey beds duringsummer 2012. We counted all otters within each bed at the start of obser-vations and at 15-min intervals. Observation periods were 1 to 2 h and wereperformed weekly to twice weekly at each bed during the study period (May15 to July 29, 2012).
Eelgrass community-dependent variables [CPUE and C. antennarius andC. productus carapace width (in millimeters), grazer biomass (in milligrams percentimeter of shoot), large grazer density (in number per square meter), algalepiphytes (in milligrams per centimeter of shoot), shoot density (in shoots persquare meter), and eelgrass aboveground and belowground biomass (in gramsper square meter)] from beds at Tomales Bay were compared with ElkhornSlough (n = 4) by using an independent-samples t test. We used regressionanalysis to determine the relationship between otter density and the de-pendent variables among beds in Elkhorn Slough (n = 4).
Mesocosm and Field Experiments. To test whether the predicted top-downmechanisms were valid, we conducted a mesocosm experiment. The meso-cosms consisted of transplanted eelgrass and mesograzers with standardizedsizes, densities, and biomass. Mesocosms were subjected to two treatments:small crabs (mimicking crab populations under heavy otter predation) andlarge crabs (mimicking low otter predation; Fig. 1C). We measured responseparameters after 30 d at the various trophic levels, including mesograzer(sea slug) biomass and mortality, epiphyte biomass, and eelgrass biomassand rhizome elongation, which are important indicators of condition andgrowth rates in seagrass (58) (SI Methods). All shoots were scraped free ofalgal epiphytes, and all grazers were removed and counted. All grazers,epiphytes, and eelgrass were dried at 60 °C for 24 h and weighed. We usedan independent-samples t test to determine differences among small (n = 8)and large (n = 7) crab treatments.
We next conducted a field experiment to validate results from the mes-ocosm experiment in a nutrient-loaded estuarine environment (Fig. S4), andto include an actual sea otter predation treatment. By using a randomizedblock design, we placed enclosures (cages) on an eelgrass bed in ElkhornSlough with high sea otter densities, in four different treatments: (i) simu-lated low otter predation (closed cage containing two large crabs), (ii)simulated high otter predation (closed cage without crabs), (iii) actual seaotter predation in the enclosure (cage open to otter and crab predation),
Hughes et al. PNAS Early Edition | 5 of 6
ECOLO
GY

and (iv) actual sea otter predation without an enclosure (to serve as controlfor cage effects; SI Methods and Fig. S5). Eelgrass shoot lengths were stan-dardized and each cage was seeded with 20 large mesograzers. We usedANOVA to test for treatment effects (N = 8) on grazer mass, algal epiphytemass, shoot density, and aboveground and belowground eelgrass biomass,as well as density of large (>2 cm) mesograzers. Finally, we tested for dif-ferences among individual treatments by using a Tukey honestly significantdifference (HSD) test (SI Methods).
ACKNOWLEDGMENTS. We thank J. Estes for his enthusiasm and support ofthis research; P. Raimondi, S. Williams, R. Zimmerman, M. Carr, B. Silliman,B. Lyon, R. Kudela, K. Karr, and A. Miles for comments on the manuscript;
the editor R. Paine and three anonymous reviewers; and S. Abbey, G. Bentall,B. Bulkin, S. Fork, J. Glanz, K. Hanni, S. Legnard, K. Mayer, R. Preisler,P. Osmolovsky, M. Staedler, J. Stewart, M. Subia, and J. Worland for dataand support for this project. This work was supported through a NationalEstuarine Research Reserve Graduate Research Fellowship (to B.B.H.); a grantfrom the University of California, Santa Cruz, Department of Ecology andEvolutionary Biology (to B.B.H.); a grant from National Oceanic and Atmo-spheric Administration’s Estuarine Reserve Division (to E.V.D. and K.W.); theSeafloor Mapping Lab at California State University, Monterey Bay (C.I.M.); theCalifornia Department of Fish and Wildlife; the US Geological Survey’sWestern Ecological Research Center (M.T.T.); and grants from the Davidand Lucile Packard Foundation and the National Science Foundation(to K.S.J.).
1. Hairston NG, Smith FE, Slobodkin LB (1960) Community structure, population control,and competition. Am Nat 94:421–425.
2. Power ME (1992) Top-down and bottom-up forces in food webs: Do plants haveprimacy. Ecology 73:733–746.
3. Silliman BR, van de Koppel J, Bertness MD, Stanton LE, Mendelssohn IA (2005)Drought, snails, and large-scale die-off of southern U.S. salt marshes. Science310(5755):1803–1806.
4. Halpern BS, Cottenie K, Broitman BR (2006) Strong top-down control in southernCalifornia kelp forest ecosystems. Science 312(5777):1230–1232.
5. Jackson JBC, et al. (2001) Historical overfishing and the recent collapse of coastalecosystems. Science 293(5530):629–637.
6. Scheffer M, Carpenter S, Foley JA, Folke C, Walker B (2001) Catastrophic shifts inecosystems. Nature 413(6856):591–596.
7. Lotze HK, et al. (2006) Depletion, degradation, and recovery potential of estuariesand coastal seas. Science 312(5781):1806–1809.
8. Waycott M, et al. (2009) Accelerating loss of seagrasses across the globe threatenscoastal ecosystems. Proc Natl Acad Sci USA 106(30):12377–12381.
9. Bruno JF, Stachowicz JJ, Bertness MD (2003) Inclusion of facilitation into ecologicaltheory. Trends Ecol Evol 18:119–125.
10. Duarte CM, Middelburg JJ, Caraco N (2005) Major role of vegetation on the oceaniccarbon cycle. Biogeosciences 2:1–8.
11. Vitousek PM, et al. (1997) Human alteration of the global nitrogen cycle: sources andconsequences. Ecol Appl 7:737–750.
12. Valiela I, et al. (1997) Macroalgal blooms in shallow estuaries: Controls and eco-physiological and ecosystem consequences. Limnol Oceanogr 42:1105–1118.
13. Estes JA, et al. (2011) Trophic downgrading of planet Earth. Science 333(6040):301–306.
14. Terborgh J, Estes JA, eds (2010) Trophic Cascades: Predators, Prey, and the ChangingDynamics of Nature (Island Press, Washington, DC.).
15. Burkholder DA, Heithaus MR, Fourqurean JW, Wirsing A, Dill LM (2013) Patterns oftop-down control in a seagrass ecosystem: could a roving apex predator induce abehaviour-mediated trophic cascade? J Anim Ecol, 10.1111/1365-2656.12097.
16. Heck KL, Jr., Valentine JF (2007) The primacy of top-down effects in shallow benthicecosystems. Estuaries Coasts 30:371–381.
17. Croll DA, Maron JL, Estes JA, Danner EM, Byrd GV (2005) Introduced predatorstransform subarctic islands from grassland to tundra. Science 307(5717):1959–1961.
18. Silliman BR, Bertness MD (2002) A trophic cascade regulates salt marsh primary pro-duction. Proc Natl Acad Sci USA 99(16):10500–10505.
19. Altieri AH, Bertness MD, Coverdale TC, Herrmann NC, Angelini C (2012) A trophiccascade triggers collapse of a salt-marsh ecosystem with intensive recreational fish-ing. Ecology 93(6):1402–1410.
20. Valiela I, Cole ML (2002) Comparative evidence that salt marshes and mangroves mayprotect seagrass meadows from land-derived nitrogen loads. Ecosystems (N Y) 5:92–102.
21. Burkholder JM, Tomasko DA, Touchette BW (2007) Seagrasses and eutrophication.J Exp Mar Biol Ecol 350:46–72.
22. Heck KL, Jr., Pennock JR, Valentine JF, Coen LD, Sklenar SA (2000) Effects of nutrientenrichment and small predator density on seagrass ecosystems: An experimental as-sessment. Limnol Oceanogr 45:1041–1057.
23. Moksnes P, Gullström M, Tryman K, Baden S (2008) Trophic cascades in a temperateseagrass community. Oikos 117:763–777.
24. Valentine JF, Duffy JE (2006) The central role of grazing in seagrass ecology. Sea-grasses: Biology, Ecology, and Conservation, eds Larkum AWD, Orth RJ, Duarte CM(Springer, Dordrecht, The Netherlands), pp 463–501.
25. Baden S, Boström C, Tobiasson S, Arponen H, Moksnes P (2010) Relative importance oftrophic interactions and nutrient enrichment in seagrass ecosystems: A broad-scalefield experiment in the Baltic-Skagerrak area. Limnol Oceanogr 55:1435–1448.
26. Lewis LS, Anderson TW (2012) Top-down control of epifauna by fishes enhancesseagrass production. Ecology 93(12):2746–2757.
27. Whalen MA, Duffy JE, Grace JB (2013) Temporal shifts in top-down vs. bottom-upcontrol of epiphytic algae in a seagrass ecosystem. Ecology 94(2):510–520.
28. Williams SL, Ruckelshaus MH (1993) Effects of nitrogen availability and herbivory oneelgrass (Zostera marina) and epiphytes. Ecology 74:904–918.
29. Hughes AR, Bando KJ, Rodriguez LF, Williams SL (2004) Relative effects of grazers andnutrients on seagrasses: a meta-analysis approach. Mar Ecol Prog Ser 282:87–99.
30. Duffy JE (2006) Biodiversity and the functioning of seagrass ecosystems.Mar Ecol ProgSer 311:233–250.
31. Estes JA, Palmisano JF (1974) Sea otters: Their role in structuring nearshore commu-nities. Science 185(4156):1058–1060.
32. Kvitek RG, Fukayama AK, Anderson BS, Grimm BK (1988) Sea otter foraging on deep-burrowing bivalves in a California coastal lagoon. Mar Biol 98:157–167.
33. Estes JA, Tinker MT, Williams TM, Doak DF (1998) Killer whale predation on sea otterslinking oceanic and nearshore ecosystems. Science 282(5388):473–476.
34. Hughes BB, Haskins JC, Wasson K, Watson E (2011) Identifying factors that influencethe expression of eutrophication in a central California estuary. Mar Ecol Prog Ser439:31–43.
35. Hauxwell J, Cebrián J, Valiela I (2003) Eelgrass (Zostera marina L.) loss in temperateestuaries: Relationship to land-derived nitrogen loads and effect of light limitationimposed by algae. Mar Ecol Prog Ser 247:59–73.
36. Van Dyke E, Wasson K (2005) Historical ecology of a central California estuary: 150years of habitat change. Estuaries 28:173–189.
37. MacGinitie GE (1935) Aspects of a California marine estuary. AmMidl Nat 16:629–765.38. Chapin TP, et al. (2004) Nitrate sources and sinks in Elkhorn Slough, California: Results
from long-term continuous in situ nitrate analyzers. Estuaries 27:882–894.39. Garshelis DL, Garshelis JA, Kimker AT (1986) Sea otter time budgets and prey rela-
tionships in Alaska. J Wildl Manage 50:637–647.40. Tinker MT, Bentall G, Estes JA (2008) Food limitation leads to behavioral diver-
sification and dietary specialization in sea otters. Proc Natl Acad Sci USA 105(2):560–565.
41. Garshelis DL, Garshelis JA (1984) Movements and management of sea otters in Alaska.J Wildl Manage 48:665–678.
42. Carlisle A, King A, Cailliet GM, Brennan JS (2007) Long-term trends in catch compo-sition from elasmobranch derbies in Elkhorn Slough, California. Mar Fish Rev 69:25–45.
43. Kao JS (2000) Diet, daily ration and gastric evacuation of the leopard shark (Triakissemifasciata). Masters thesis (California State University, Hayward, CA).
44. Nybakken J, Cailliet G, Broenkow W (1977) Ecological and hydrographic studies ofElkhorn Slough, Moss Landing Harbor, and nearshore coastal waters, July 1974–June1976 (Moss Landing Marine Laboratories, Moss Landing, CA).
45. California Department of Fish and Wildlife annual landings report. Available at www.dfg.ca.gov/marine/fishing.asp.
46. Largier JL, Hollibaugh JT, Smith SV (1997) Seasonally hypersaline estuaries in Medi-terranean-climate regions. Estuar Coast Shelf Sci 45:789–797.
47. Kimbro DL, Largier J, Grosholz ED (2009) Coastal oceanographic processes influencethe growth and size of a key estuarine species, the Olympia oyster. Limnol Oceanogr54:1425–1437.
48. Caffrey JM, Hollibaugh JT, Bano N, Haskins J (2010) Effects of upwelling on short-termvariability in microbial and biogeochemical processes in estuarine sediments fromElkhorn Slough, California USA. Aquat Microb Ecol 58:261–271.
49. Tinker MT, Doak DF, Estes JA (2008) Using demography and movement behavior topredict range expansion of the southern sea otter. Ecol Appl 18(7):1781–1794.
50. Broughton JM (1999) Resource Depression and Intensification During the Late Ho-locene, San Francisco Bay (Univ California Press, Berkeley, CA).
51. Sand-Jensen K (1977) Effects of epiphytes on eelgrass photosynthesis. Aquat Bot 3:55–63.
52. Orth RJ, Van Montfrans J (1984) Epiphyte-seagrass relationships with an emphasis onthe role of micrograzing: A review. Aquat Bot 18:43–69.
53. Jannasch HW, et al. (2008) The Land/Ocean Biogeochemical Observatory: A robustnetworked mooring systems for continuously monitoring complex biogeochemicalcycles in estuaries. Limnol Oceanogr Methods 6:263–276.
54. Nidzieko NJ, Monosmith SG (2013) Contrasting seasonal and fortnightly variations inthe circulation of a seasonally inverse estuary, Elkhorn Slough, California. EstuariesCoasts 36:1–17.
55. Johnson KS, Coletti LJ, Chavez FP (2006) Diel nitrate cycles observed with in situsensors predict monthly and annual new production. Deep Sea Res Part I OceanogrRes Pap 53:561–573.
56. Oftedal OT, Ralls K, Tinker MT, Green A (2007) Nutritional Constraints of the SouthernSea Otter in the Monterey National Marine Sanctuary and a comparison to sea otterpopulations at San Nicolas Island, California and Glacier Bay, Alaska. Joint Final Re-port to Monterey Bay National Marine Sanctuary (and Monterey Bay SanctuaryFoundation) and the Marine Mammal Commission (Moss Landing Marine Laborato-ries, Moss Landing, CA).
57. Tinker MT, et al. (2012) Structure and mechanism of diet specialisation: Testingmodels of individual variation in resource use with sea otters. Ecol Lett 15(5):475–483.
58. Palacios S, Zimmerman RC (2007) Response of eelgrass Zostera marina to CO2 en-richment: Possible impacts of climate change and potential for remediation of coastalhabitats. Mar Ecol Prog Ser 344:1–17.
6 of 6 | www.pnas.org/cgi/doi/10.1073/pnas.1302805110 Hughes et al.

Supporting InformationHughes et al. 10.1073/pnas.1302805110SI MethodsAll analyses in this study had α set at 0.10 to avoid type II errors thatfalsely fail to reject the null hypothesis (1) given the challengesof large-scale field sampling and experiments with low replication.All statistics were run by using SPSS software (version 20; IBM,Armonk, NY).
Time Series Analysis. Historical nutrient sources and concentrations. Todetermine trends in the bottom-up influences on the ElkhornSlough eelgrass beds, we constructed a time series of nutrientconcentrations in Elkhorn Slough. Elkhorn Slough is surroundedby a highly agricultural watershed in Monterey County, CA. Thefertilizer in row crops causes nutrient runoff into the countyreceiving waters and ultimately Elkhorn Slough (2). We con-structed the time series from several data sources: fertilizer sales(California Department of Food and Agriculture annual reportson tonnage of nitrogen fertilizer sales, 1930–2005), nitrate datafrom 1970 to 1971 (3), 1974 to 1976 (4), and 1977 from theCalifornia Central Coast Regional Water Quality ControlBoard; and 1989 to 2011 Elkhorn Slough National EstuarineResearch Reserve (ESNERR).Historical eelgrass cover.Wemapped eelgrass cover in the estuary andquantified change through time by interpreting low-altitude verticalaerial imagery acquired between 1966 and 2012 by several agencies,primarily the California Department of Fish and Wildlife. Thephotographs were scanned, georeferenced using ERDAS ImageAnalysis 1.1 (ERDAS/Intergraph, Norcross, GA), and habitatpolygons were manually digitized using ArcView GIS 3.3 (ESRI,Redlands, CA). Precise delineation of eelgrass patches from indi-vidual photographs was challenging for a variety of reasons, in-cluding varied tidal heights and water clarity, the presence of solarglint, and the similar appearance of macroalgae. Therefore, wevisually identified 13 y through which eelgrass cover could be de-termined with high confidence based on historical descriptions andpresent-day ground surveys of distribution. We combined all pol-ygons from each year to characterize the eelgrass extent. Thismethodology produced unequal intervals but allowed us to accu-rately assess trends. Intervals were shorter in the later years whensea otter expansion was occurring as a result of increased quality ofimagery and accuracy of ground truthing.Historical crab densities and sizes. We tested for the effects of long-term otter predation on the Elkhorn Slough crab population bycomparing two time periods: 1971 to 1976 (a decade before otterimmigration) and 2005 to 2009 (two decades after otter immi-gration). The 1970s data set was from a study by Nybakken et al.(4) and the Monterey Bay National Marine Sanctuary’s Sanc-tuary Integrated Monitoring Network, and the 2005 to 2009 dataset was from the ESNERR. We used data from a similar regionin the lower part of the estuary directly adjacent to the present-day and historical distributions of eelgrass and sea otters. Thecrab traps used in the two studies both had >20-cm openings toallow for maximum crab sizes. Crabs from the 1970s were caughtby using standard recreational traps (0.1587 m3) composed ofnylon or wire mesh wrapped around a circular metal frame andbaited with fish, mussels, squid, or shrimp. More recent surveysfrom 2005 to 2009 used smaller sized traps (0.0621 m3) thanthose in the 1970s, were constructed of nylon mesh wrappedaround a rectangular metal frame, and were baited with an-chovies. There were differences in the hours spent crab trapping,2 to 8 h for 1971 to 1976 and 24 h for 2005 to 2009. However, wefound that crab traps from the 1970s generally reached satura-tion in the 2- to 8-h sampling period, and traps from 2005 to 2009
rarely became saturated. Therefore, we did not correct for thedifferences in soak time to avoid any erroneous inflation of datafrom the 1970s that would bias our results. We did standardizecrab traps to 1970s sizes.Otter density and foraging observations for predation correlations witheelgrass bed expansion. To quantify spatial differences in sea otterdensity and predation pressure, we used existing data on sea otterdistribution and abundance available from standardized biannualcensuses conducted by the US Geological Survey Western Eco-logical ResearchCenter and theCaliforniaDepartment of Fish andWildlife (GIS-compliant data from these censuses are available atwww.werc.usgs.gov). Counts have been conducted twice annually(in spring and fall) since 1985, with most of the sea otter habitat inElkhorn Slough counted by pairs of shore-based observersequipped with 10× binoculars and 50× Questar spotting scopes(Questar) and inaccessible areas surveyed by airplane (a Parte-navia single-engine plane with three observers). The location,behavior, and habitat type of every sighted otter was recordedonto detailed maps (1:24,000) and later digitized into a GIS. Eachannual count thus provides a snapshot of sea otter distribution: toaccount for otter mobility, we applied a kernel smoothing algo-rithm to these data to create a sea otter density “surface” withinElkhorn Slough. Specifically, by using the most recent 5 y ofcensus count data (2007–2012), during which period sea otternumbers have been approximately stable, we fit a 2D kerneldensity smoother by using the Spatial Analyst toolbox in ArcGIS10.1 (ESRI), and using a 2.5-km smoothing window. The resultingsurface provided localized estimates of average otter density (i.e.,otters per square kilometer) throughout Elkhorn Slough, and weaveraged these values for each of the four eelgrass beds in stan-dardized 1 ha plots that encompassed both eelgrass communityand crab survey areas in 2012 (Fig. S2).To measure crab predation by sea otters, observational data
were recorded from feeding otters by using high-powered (50–80×) telescopes (Questar). Otters were selected haphazardly fordata collection (i.e., without regard for location, status, or preytype), and ∼10,200 feeding dives (occurring in 248 independentfeeding bouts) were recorded between 1999 and 2012. For eachdive, observers recorded subsurface dive duration, interdivesurface interval, success of the dive (i.e., whether prey werecaptured), prey type (prey were identified to lowest possibletaxonomic level), prey size (estimated relative to the sea otters’paw width), number of prey items consumed, and handling timeper prey item consumed. The resulting data set was analyzedby using a Monte Carlo simulation-based algorithm describedelsewhere (5), which results in bias-corrected estimates of dietcomposition and rate of biomass consumption by species, withassociated measures of uncertainty. The results of this analysisshow that crabs of the genus Cancer were the most commonly con-sumed prey type, making up ∼43% (±2.1%) of the biomass con-sumed by otters in the slough (Fig. S1). A typical sea otterconsumed 4.69 g (±0.26) of edible crab biomass per minute offoraging effort. The mean carapace width of Cancer crabs cap-tured on feeding dives where the prey size could be reliably es-timated was 59.3 mm (N = 1,112 crabs). A power function wasused to convert mean carapace size (in millimeters) to corre-sponding estimates of mean edible biomass (in grams) and totalbiomass per crab [edible biomass = 0.0077 * carapace diameter0.2265
(R2 = 0.97) and edible biomass is 65% of total mass (6)]. Assumingan average of 30% of the time spent feeding, this translates to 2,030 gof crab biomass consumed per day, or 30.0 crabs. This estimate,based on observed feeding behavior, is very close to an independent
Hughes et al. www.pnas.org/cgi/content/short/1302805110 1 of 6
estimate of crab consumption that can be calculated based onmetabolic requirements of sea otters, which must consume 25% oftheir body mass each day (7). Based on metabolic requirements,a 20-kg adult female otter consuming a diet of 43% crabs wouldrequire 2,150 g of edible biomass or 32 crabs per day. If only35 sea otters feed primarily within Elkhorn Slough, they wouldbe expected to consume more than 400,000 crabs (or 40,000 kg)every year. We multiplied the per-capita crab consumption ratesby the average otter density in each of the four eelgrass beds toestimate mean crab predation rates in 1-ha areas of each bedfrom 2007 to 2012.We used a cross-validation technique to corroborate estimates
of sea otter density and crab predation rates in Elkhorn Slougheelgrass beds. By using linear regression, we correlated the rel-ative frequency of occurrence of sea otters in each bed (N = 4)based on 2012 summer sea otter surveys (Spatial Comparison andFig. 2) to the more long-term estimates of sea otter density andcrab predation in each bed from 2007 to 2012 (as detailed in theprevious paragraphs on estimation of otter predation rates; Fig.1D). These two independently derived estimates were highlycorrelated (P = 0.002, R2 = 0.997), thus validating our estimatesof spatial variation in sea otter density and predation effectson crabs.
Spatial Comparisons. Traps used were shrimp pots (61 × 61 × 23cm; 0.0856 m3) composed of galvanized metal and a mesh size of22 mm. Traps were modified to increase the tunnel size to ∼200mm to allow capture of crabs of all size classes, but preventingsea otters from reaching in to grab them. Traps were baited withanchovies and replenished every 2 to 3 d. Crab traps werechecked daily. Each crab was identified to species, and size wasmeasured at the widest point of the carapace. Crabs were re-leased >100 m away from the traps after measurement.
Mesocosm and Field Experiments. Mesocosm experiment. To de-termine the predatory role of crabs on grazers and eelgrass, weconducted a mesocosm experiment. Our experiment took placebetween April 11 and May 8, 2012. In an outdoor laboratoryspace, we created 15 mesocosms made from 5-gallon plasticbuckets. The bottom of each bucket had 10 cm of sterilized sandmixed with 50 g of sediment collected from Elkhorn Slough tointroduce native microbial communities to the mesocosm. Eachbucket received a continuous supply of fresh sand-filtered sea-water (50 cm3·s−1). We inserted the water-supply tubing into themiddle of each mesocosm’s water column to ensure mixing. Toensure no water flowed over the top of the buckets, five holeswere drilled 2 cm below the rim. The top of the buckets werecovered with black garden mesh that reduced photosyntheticallyactive radiation (PAR; Li-193 underwater PAR sensor; LI-COR,Lincoln, NE) to 50% ambient light. In both the mesocosms andElkhorn Slough eelgrass populations, PAR at the canopy was∼50% ambient during midday conditions.We collected terminal shoots along with their rhizome and root
tissue, sea slugs, and crabs from Elkhorn Slough and transportedthem to Long Marine Laboratory, Institute of Marine Science,University of California, Santa Cruz. The mesocosms all con-tained six eelgrass shoots. The density of eelgrass in the bucketsscaled to 113 shoots·m−2, which was within the range of eelgrassdensity during summertime conditions in Elkhorn Slough [132 ±50.8 (SD)]. Before placement in mesocosms, we measured thebiomass, leaf number, and shoot length of each plant, as well asthe total plant and sea slug biomass, and compared the meansamong mesocosms and treatments to ensure there were nopreexperimental biases (P > 0.10 for all variables). We stan-dardized all shoot lengths to 20 cm and rhizome lengths to 10cm. All shoots were wiped clean of epiphytes by using cottonpads. During the experiment, algal epiphytes (primarily diatoms)recruited to eelgrass leaves from propagules already occurring in
the seawater system. By using zip ties, we attached zinc boltsto the plants as anchors to ensure that crabs did not free themfrom the sediment.Three sea slugs, Phyllaplysia taylori, were added to each mes-
ocosm. We added in two large (>2 cm) and one small (<2 cm)sea slug, as 2 cm was a clear break in the size distribution of seaslugs and this ratio was similar to the distribution [70.0% ± 8.8(SE)] of size classes found in Elkhorn Slough. Additionally, largegrazer densities in the buckets scaled to 38·m−2, which were inthe range reported from the field [61 ± 60.5 (SD)]. The variationin size also allowed for us to investigate the predatory effects ofcrabs on the large mesograzer size class. We then randomlyselected mesocosms that would have simulated low otter pre-dation [a single large crab, Cancer spp. (carapace >80 mm) orPugettia producta (carapace >60 mm); n = 7] or simulated highotter predation [a single small crab, Cancer spp. (carapace <40mm) or P. producta (carapace <20 mm); n = 8]. Algal epiphyte(primarily chain forming diatoms) propagules came naturallyfrom spores in the seawater supply or the transported ElkhornSlough sediments. At the conclusion of the experiment, weharvested all eelgrass and sea slugs for processing. All shootswere scraped free of algal epiphytes, and all grazers were re-moved and counted.Field experiment. We experimentally field-tested the effect of seaotters on eelgrass by using a caging experiment in an ElkhornSlough eelgrass bed. The bed had high sea otter densities in theexperimental area during the experimental period [x = 3.53·ha−1 ±3.40 (SD), based on daily counts]. Nitrate concentrations werehigh (x = 10.09 μmol) during the experimental period andpeaked at 189 μmol toward the beginning weeks (www.mbari.org/lobo/loboviz.htm; Fig. S4). The occurrence of high sea otterdensities and foraging pressure as well as high nutrient concen-trations made ideal conditions to test the relative effects of top-down predation and bottom-up nutrient loading on eelgrassproductivity.In July 2012, we established the caging experiment by using
a randomized block design that consisted of eight blocks andfour treatments: cages including crab and excluding sea otters(+crabs−otters), cagesexcludingcrabsandseaotters (−crabs−otters),a partial cage control that allowed access to both sea otters andcrabs yet included the top of the cage to test for shading effects onthe seagrass (+crabs +otters), and a cage-free control (opencontrol). The +crab −otter cages simulated an otter-free envi-ronment, the −crabs −otters cages simulated a high predatoryotter environment, and the +crabs +otters and open control al-lowed for natural predation by sea otters and crabs to occur.During the experiment, we observed both sea otters and crabsaccessing both control treatments.Cages were constructed using metal rebar welded to form 50 ×
50 × 50-cm cages (Fig. S5). For +crabs −otters and −crabs −otterscages, chicken-wire mesh (2.5 × 2.5 cm) was wrapped around allsides accept for the bottom to allow for seagrass to grow. Thechicken wire allowed small grazer (sea slugs and crustaceans)access, yet prevented movement by crabs and otters. Additionally,hogwire mesh was wrapped around 25-cm rebar extensions thatwere driven into the sediment to prevent crabs from burrowing outor into the cages. Finally, a 20-cm hogwire skirt was wrappedaround the bottom of the cages to prevent otters from accessingthe cages by digging. Hogwire is commonly used in farming ap-plications to cage livestock and prevent entrance from unintendedanimals of various sizes. The hogwire mesh on the experimentalcages had 15-cm-wide rectangles with the connecting wires be-tween them spaced from 2 to 2.5 cm for the vertical crab controlportion (pushed into the mud) and from 2.5 to 5 cm for thehorizontal otter control section (laying flat on the mud). Thepartial cage control (+crabs +otters) was open on all sides exceptfor the top, which consisted of the chicken-wire mesh to test forcage effects on the eelgrass yet allowing access by crabs and otters.
Hughes et al. www.pnas.org/cgi/content/short/1302805110 2 of 6

The open control had no cage and therefore permitted access tograzers, crabs, and otters. We measured PAR during high tideduring maximum light attenuation and found only a slight (17%)reduction of PAR in cages vs. open controls. The mean PAR incage treatments was 329.1 μmol photons·m−2·s−1, and was 37%the subsurface PAR; both these values are well within saturatinglight levels for Zostera spp. (8, 9).Before cage installation, eelgrass shoots were standardized in
all treatments by cutting them to 20 cm. This allowed for us tocontrol for grazers by removing the entire population. Wecounted shoots in treatments within blocks to ensure there wereno preexperimental differences (P > 0.10) in shoot densities. A1-m × 1-m buffer zone was created by cutting all the shootssurrounding the experimental 50 × 50-cm area to preventshading by taller bordering shoots. All treatments were spaced 2m apart, and all blocks were spaced 10 m apart along a transectthat bisected the eelgrass bed.After cages were installed, all treatments were seeded with 20
large (>2 cm) sea slugs to standardize the grazer densities. Theother common mesograzer, the isopod crustacean Idotea spp.,are swimmers that readily accessed all treatments (B.B.H., un-published observation), so we did not seed them into the treat-ments. Finally, we added one Cancer spp. (80–100 mm) crab andone P. producta (60–80 mm) crab to each +crabs –otters cage.The crab size was selected based on size selection of otters (Figs.1C and 2B) and size-related grazer predation rates as de-termined by the mesocosm experiment (Fig. 3A). The sizes foreach crab species were in the high range for Elkhorn Slough.Cancer crabs are benthic carnivores, whereas Pugettia are can-opy-dwelling omnivores primarily feeding on algae yet switchingto invertebrates in the absence of algae (10, 11). Mesocosm ex-periments determined that both species of crabs eat sea slugs inseagrass systems and can significantly reduce their densities (Fig.3A). Otter foraging surveys conducted in the eelgrass beds dur-ing the experimental period determined that the crabs constitutea high proportion of total prey consumed (∼45%), 60% Cancerand 40% Pugettia, respectively.The experiment lasted for 1 mo. During that period, we used
self-contained underwater breathing apparatus (SCUBA) to in-
spect cages for crabs, sea slugs, and structural integrity, as well asscrubbing cages to clean off any fouling material twice weekly.There was no evidence of crabs escaping or sea otters enteringcage enclosure treatments during the course of the experiment.We observed otters inhabiting the experimental area dailythroughout the 1-mo experiment and observed otters freely ac-cessing the cages during SCUBA surveys. Two weeks into theexperiment, we added an additional Cancer crab to one of the +crabs −otters cages as a result of a mortality of the originalCancer crab. After 1 mo, we counted all shoots and harvestedfive shoots from all the treatment replicates. All shoots werescraped free of algal epiphytes, and all grazers were removed andcounted. All grazers, epiphytes, and eelgrass were dried at 60 °Cfor 24 h and weighed.We compared grazer (in grams of dry weight per centimeter of
shoot), algal epiphyte (in grams of dry weight per centimeter ofshoot), shoot density (in number of shoots per square meter), andaboveground (shoot density times mean shoot mass, in grams ofdry weight per square meter) and belowground [shoot densitytimes mean (rhizome + root) mass (standardized to 7 cm), ingrams of dry weight per square meter] biomasses, as well as densityof large (>2 cm) mesograzers (in number per square meter), usinga randomized blocked ANOVA (SPSS software, version 19), usingtreatment (fixed) and block (random) as the dependent variables.Total shoot biomass was calculated by multiplying shoot density bythe mean shoot mass for each replicate. Shoots in two of the +crabs −otters replicates had been damaged by the crabs and werenot used in the final analysis for algal epiphytes and eelgrass bio-mass estimates. All other replicates were not disturbed during theexperiment. We tested for the assumption of normality for thedependent variables by using a Kolmogorov–Smirnov test. Toconserve degrees of freedom, we first compared control treatments(+crabs +otters and open control) by using the randomized blockANOVA to determine if there were significant differences. If not,the two treatments were pooled as one control for the final ran-domized blocked ANOVA design. Finally, we compared differencesamong individual treatments by using a Tukey honestly significantdifference test.
1. Underwood AJ (1997) Experiments in Ecology: Their Logical Design and InterpretationUsing Analysis of Variance (Cambridge Univ Press, Cambridge, UK).
2. Hughes BB, Haskins JC, Wasson K, Watson E (2011) Identifying factors that influencethe expression of eutrophication in a central California estuary.Mar Ecol Prog Ser 439:31–43.
3. Smith RE (1973) The Hydrography of Elkhorn Slough, a Shallow California CoastalEmbayment. Contributions from the Moss Landing Marine Laboratories No. 42,Technical Publication 73-2 (Moss Landing Marine Laboratories, Moss Landing, CA).
4. Nybakken J, Cailliet G, Broenkow W (1977) Ecological and Hydrographic Studies ofElkhorn Slough, Moss Landing Harbor, and Nearshore Coastal Waters, July 1974–June1976 (Moss Landing Marine Laboratories, Moss Landing, CA).
5. Tim Tinker M, et al. (2012) Structure and mechanism of diet specialisation: Testingmodels of individual variation in resource use with sea otters. Ecol Lett 15(5):475–483.
6. Oftedal OT, Ralls K, Tinker MT, Green A (2007) Nutritional Constraints of the SouthernSea Otter in the Monterey National Marine Sanctuary and a comparison to sea otter
populations at San Nicolas Island, California and Glacier Bay, Alaska. Joint FinalReport to Monterey Bay National Marine Sanctuary (and Monterey Bay SanctuaryFoundation) and the Marine Mammal Commission (Moss Landing MarineLaboratories, Moss Landing, CA).
7. Costa DP, Kooyman GL (1982) Oxygen consumption, thermoregulation, and the effectof fur oiling and washing on the sea otter, Enhydra lutris. Can J Zool 60:2761–2767.
8. Zimmerman RC, Reguzzoni JL, Alberte RS (1995) Eelgrass (Zostera marina L.)transplants in San Francisco Bay: role of light availability on metabolism, growth andsurvival. Aquat Bot 51:67–86.
9. Zimmerman RC (2006) Light and photosynthesis in seagrass meadows. Seagrasses:Biology, Ecology, and Conservation, eds Larkum AWD, Orth RJ, Duarte CM (Springer,Dordrecht, The Netherlands), pp 303–321.
10. Ricketts EF, Calvin J (1992) Between Pacific Tides (Stanford Univ Press, Stanford, CA).11. Morris RH, Abbott DP, Haderlie EC (1980) Intertidal Invertebrates of California
(Stanford Univ Press, Stanford, CA).
Hughes et al. www.pnas.org/cgi/content/short/1302805110 3 of 6
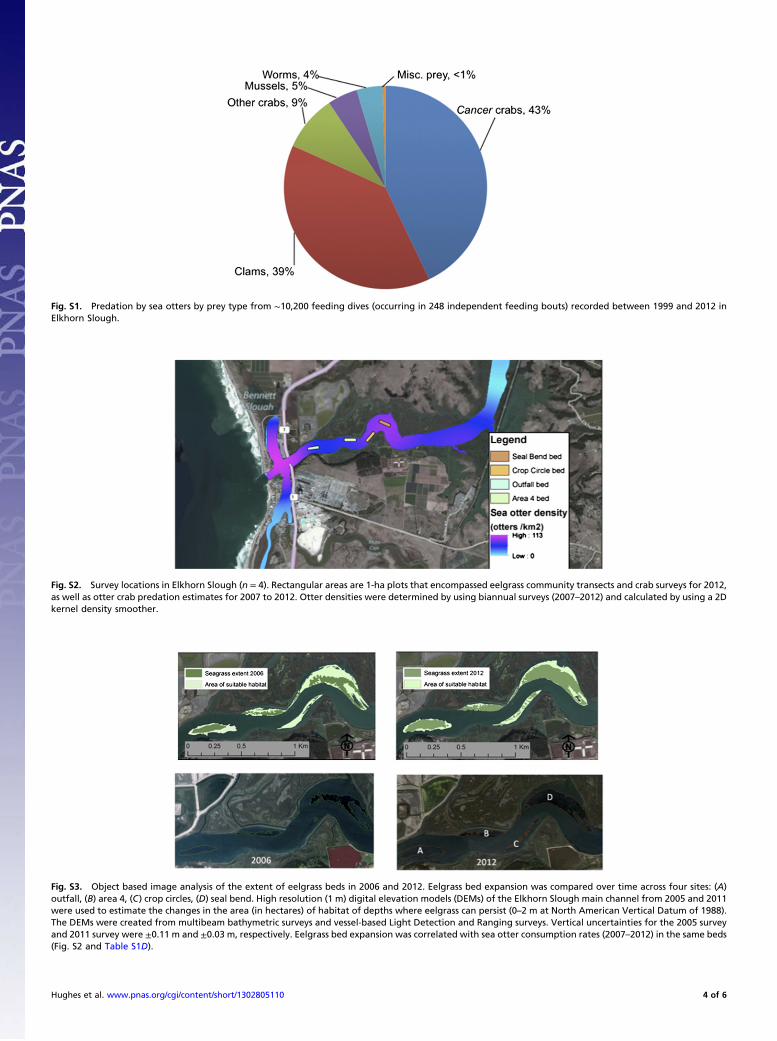
Fig. S1. Predation by sea otters by prey type from ∼10,200 feeding dives (occurring in 248 independent feeding bouts) recorded between 1999 and 2012 inElkhorn Slough.
Fig. S2. Survey locations in Elkhorn Slough (n = 4). Rectangular areas are 1-ha plots that encompassed eelgrass community transects and crab surveys for 2012,as well as otter crab predation estimates for 2007 to 2012. Otter densities were determined by using biannual surveys (2007–2012) and calculated by using a 2Dkernel density smoother.
Fig. S3. Object based image analysis of the extent of eelgrass beds in 2006 and 2012. Eelgrass bed expansion was compared over time across four sites: (A)outfall, (B) area 4, (C) crop circles, (D) seal bend. High resolution (1 m) digital elevation models (DEMs) of the Elkhorn Slough main channel from 2005 and 2011were used to estimate the changes in the area (in hectares) of habitat of depths where eelgrass can persist (0–2 m at North American Vertical Datum of 1988).The DEMs were created from multibeam bathymetric surveys and vessel-based Light Detection and Ranging surveys. Vertical uncertainties for the 2005 surveyand 2011 survey were ±0.11 m and ±0.03 m, respectively. Eelgrass bed expansion was correlated with sea otter consumption rates (2007–2012) in the same beds(Fig. S2 and Table S1D).
Hughes et al. www.pnas.org/cgi/content/short/1302805110 4 of 6

Fig. S4. Nitrate data showing elevated concentrations during the 2012 survey and field experimental period in Elkhorn Slough. Hourly data were collected insitu using an in situ UV spectrophotometer nitrate sensor attached to the Monterey Bay Aquarium Research Institute’s Land/Ocean Biogeochemical Obser-vatory sensor mooring (1).
Fig. S5. Cage experimental design (50 cm × 50 cm × 50 cm), testing for the trophic cascade effects of crabs (+crabs −otters), the simulated trophic cascadeeffects of sea otters (−crabs −otters), and the direct effects of sea otters (partial cage control and open control) on eelgrass communities (grazers and algalepiphytes) and growth (individual and total shoot biomass per cage).
1. Jannasch HW, et al. (2008) The Land/Ocean Biogeochemical Observatory: A robust networked mooring systems for continuously monitoring complex biogeochemical cycles in estuaries.Limnol Oceanogr Methods 6:263–276.
Hughes et al. www.pnas.org/cgi/content/short/1302805110 5 of 6

Movie S1. Underwater video from summer 2012 showing differences in Zostera marina seagrass beds in two California estuaries: Elkhorn Slough (highnutrient concentrations, high sea otter abundance) and Tomales Bay (lower nutrient concentrations, no sea otters). The first video is of an Elkhorn Slougheelgrass bed with high sea otter density, and is characterized by upright vegetation, relatively free of epiphytes, and containing large grazers (sea slugs,P. taylori). The second video is of Tomales Bay (no sea otters), where the eelgrass has extensive epiphyte growth, the leaves are sloughed over and noticeablyshorter, and the bed has notably lower grazer abundances.
Movie S1
Other Supporting Information Files
Table S1 (DOCX)Table S2 (DOCX)Table S3 (DOCX)Table S4 (DOCX)Table S5 (DOCX)
Hughes et al. www.pnas.org/cgi/content/short/1302805110 6 of 6