reconciling projections of colorado river flows -- a joint
TRANSCRIPT

1
Reconciling Projections of Colorado River Flows-- A joint effort of NOAA RISAs and partners --
Three RISAs in Co. Basin
Reconciling Projections of Colorado River Flows-- A joint effort of NOAA RISAs and partners --
RISAs – Regional Integrated Sciences and Assessment Projects
• Nick Graham, Dan Cayan - California Applications Project (CAP)• Dennis Lettenmaier, Andy Wood – Climate Impacts Group (CIG)• Robin Webb, Marty Hoerling, Brad Udall – Western Water Assessment (WWA)(WWA)• Jonathan Overpeck, Holly Hartmann – Climate Assessment for the Southwest (CLIMAS)
… and a large supporting cast…• Kelly Redmond, Western Regional Climate Center –• Chris Milly, Mike Dettinger - USGS• Kevin Werner – NWS Western Region Headquarters• Tom Pagano – USDA-NRCS National Water and Climate Center• Eric Wood - Princeton• Kosta Georgakakos - Hydrologic Research Center• Hugo Hidalgo – Scripps Institute for Oceanography
Lee’s Ferry
The 2000s Southwest Drought
USGS Fact Sheet 2004-3062 (2004)
49%

2
Is the current Southwest drought a once-or-twice-a-century drought like those of the past 500 years …
A Big Question
a harbinger of things to come - a different type of drought that we have not observed before ?
Or…
Efforts to Determine Southwestern Drought Prospects Under Climate Change
• Early Studies - Scenarios– Stockton and Boggess, 1979– Revelle and Waggoner, 1983
• Mid Studies, First GCM Use– Nash and Gleick, 1991, 1993– McCabe and Wolock, 1999 (NAST)– IPCC, 2001
• More Recent Studies– Christensen et al., 2004– Milly et al.,2005, “Global Patterns of trends in runoff”– Christensen and Lettenmaier, 2007– Hoerling and Eischeid, 2007, “Past Peak Water?”– Seager et al, 2007, “Imminent Transition to more arid..”– IPCC, 2007 (Regional Assessments)
Hydrologic Cycle Changes in a Warmer World
Extra Energy Means enhanced hydrologic cycle– Higher temps increase atmosphere moisture holding capacity– Higher temps imply globally increased evaporation– Precipitation must increase globally (but not necessarily regionally)– More intense precipitation - Floods– More intense drying - Drought
• Mid-continental summertime drying• Increased evaporation will increase water demand
– More rain less snow– More rain, less snow– Earlier spring runoff
From: Brad Udall
IPCC 2007 Southwest North America Regional Findings
- Annual mean warming likely to exceed global mean- Western NA warming likely between 2C and 7C at 2100- In Southwest greatest warming in summer- Precipitation likely to decrease in Southwest- Snow season length and depth very likely to decrease
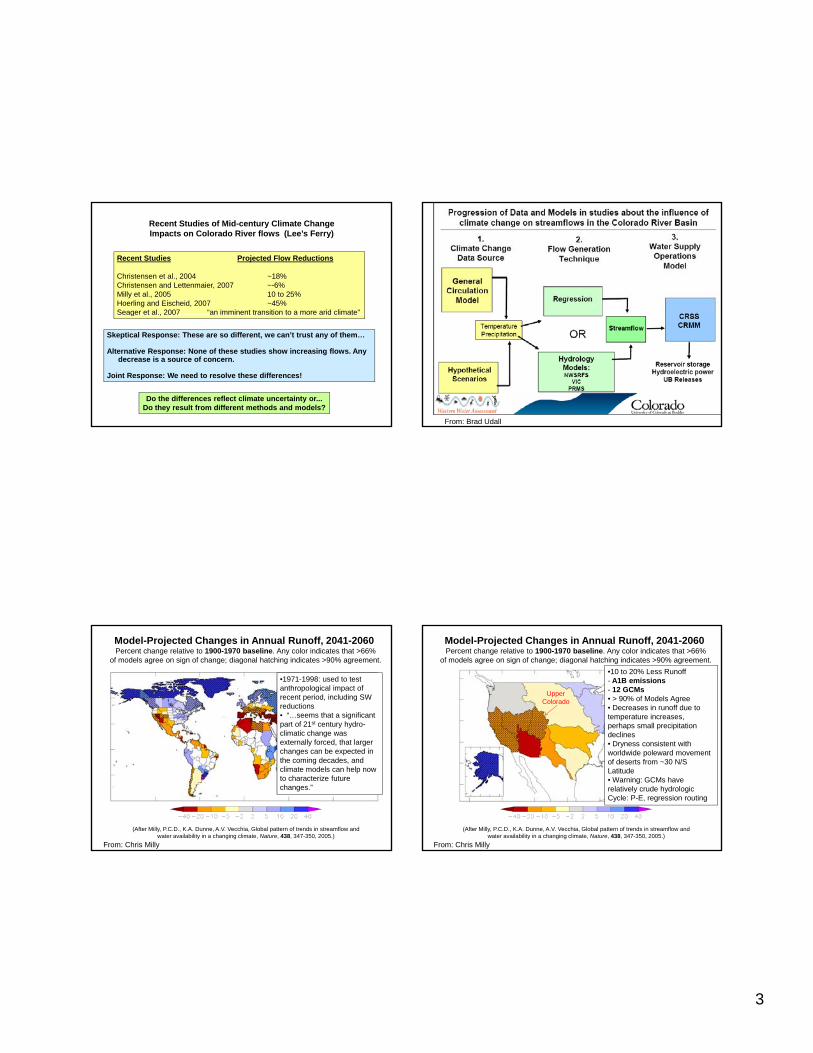
Recent Studies of Mid-century Climate Change Impacts on Colorado River flows (Lee’s Ferry)
Recent Studies Projected Flow Reductions
Christensen et al., 2004 ~18%Christensen and Lettenmaier, 2007 ~-6%Milly et al., 2005 10 to 25%Hoerling and Eischeid, 2007 ~45%Seager et al., 2007 “an imminent transition to a more arid climate”Seager et al., 2007 an imminent transition to a more arid climate
3
Recent Studies of Mid-century Climate Change Impacts on Colorado River flows (Lee’s Ferry)
Recent Studies Projected Flow Reductions
Christensen et al., 2004 ~18%Christensen and Lettenmaier, 2007 ~-6%Milly et al., 2005 10 to 25%Hoerling and Eischeid, 2007 ~45%Seager et al., 2007 “an imminent transition to a more arid climate”
Skeptical Response: These are so different, we can’t trust any of them…
Alternative Response: None of these studies show increasing flows. Any decrease is a source of concern.
Joint Response: We need to resolve these differences!
Seager et al., 2007 an imminent transition to a more arid climate
Do the differences reflect climate uncertainty or... Do they result from different methods and models?
From: Brad Udall
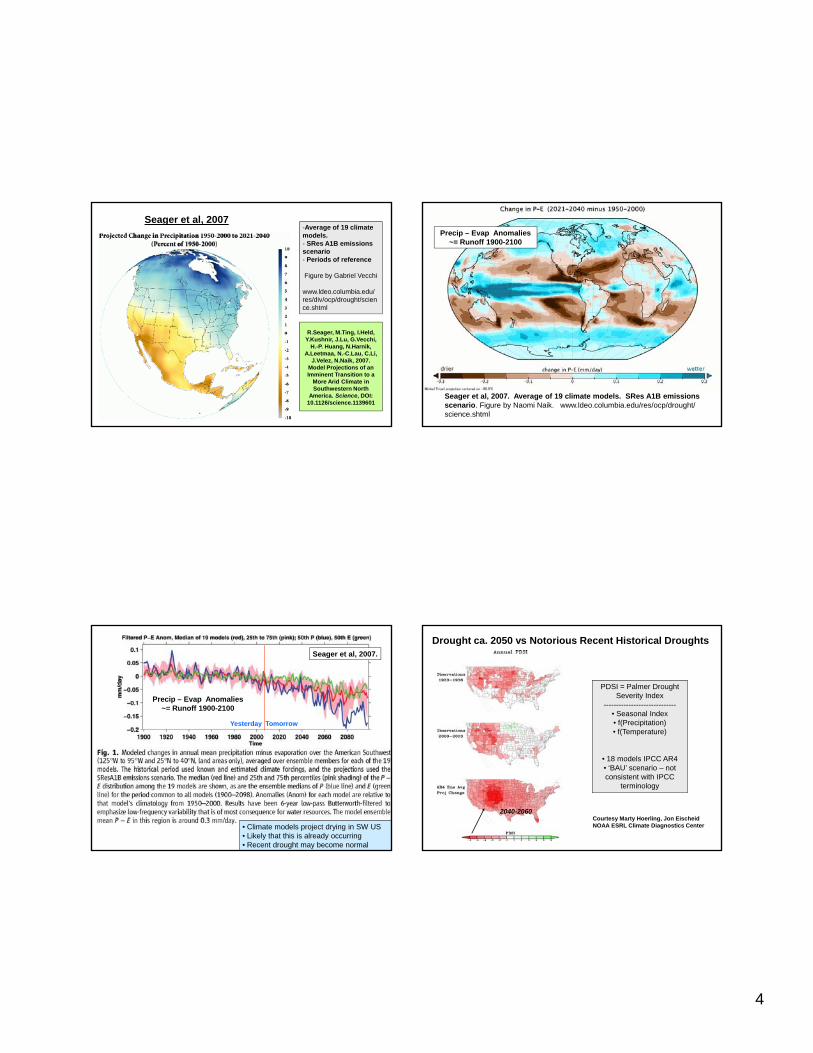
Model-Projected Changes in Annual Runoff, 2041-2060Percent change relative to 1900-1970 baseline. Any color indicates that >66%
of models agree on sign of change; diagonal hatching indicates >90% agreement.
•1971-1998: used to test anthropological impact of recent period, including SW reductions• “…seems that a significant part of 21st century hydro-climatic change was
(After Milly, P.C.D., K.A. Dunne, A.V. Vecchia, Global pattern of trends in streamflow andwater availability in a changing climate, Nature, 438, 347-350, 2005.)
From: Chris Milly
externally forced, that larger changes can be expected in the coming decades, and climate models can help now to characterize future changes.”
Model-Projected Changes in Annual Runoff, 2041-2060Percent change relative to 1900-1970 baseline. Any color indicates that >66%
of models agree on sign of change; diagonal hatching indicates >90% agreement.
Upper Colorado
•10 to 20% Less Runoff - A1B emissions- 12 GCMs• > 90% of Models Agree• Decreases in runoff due totemperature increases,perhaps small precipitationdeclines
(After Milly, P.C.D., K.A. Dunne, A.V. Vecchia, Global pattern of trends in streamflow andwater availability in a changing climate, Nature, 438, 347-350, 2005.)
From: Chris Milly
• Dryness consistent with worldwide poleward movement of deserts from ~30 N/S Latitude• Warning: GCMs haverelatively crude hydrologicCycle: P-E, regression routing
4
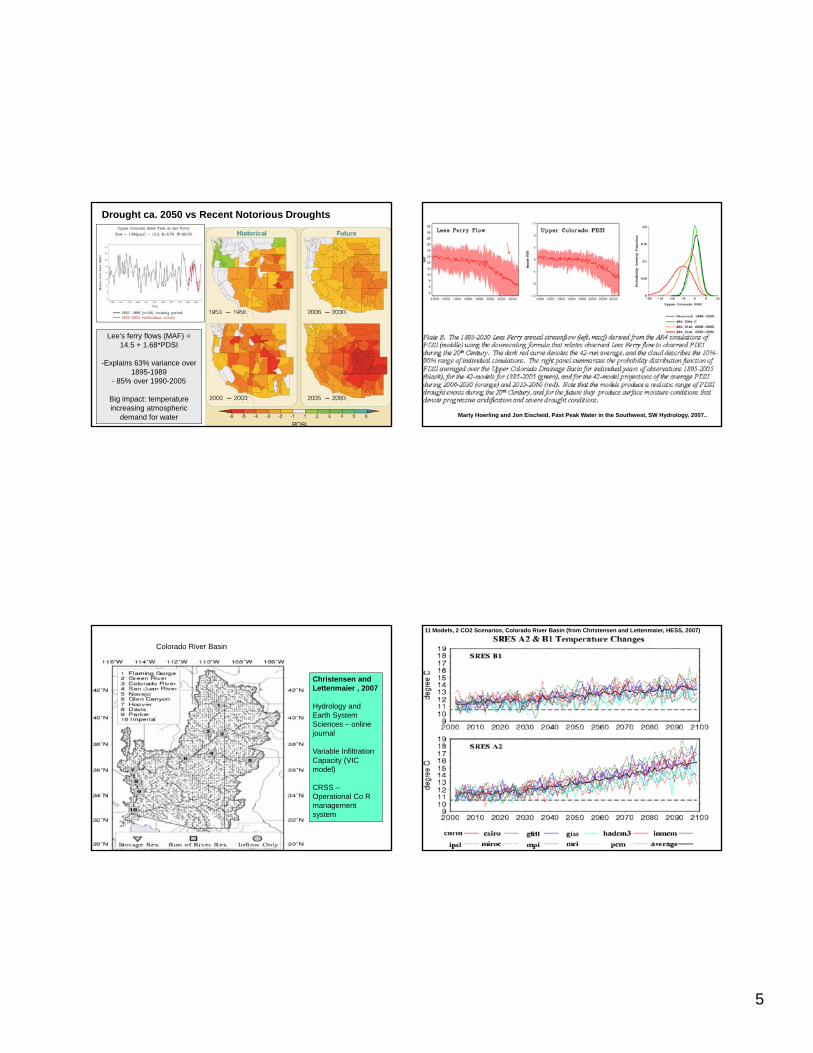
-Average of 19 climate models. - SRes A1B emissions scenario- Periods of reference
Figure by Gabriel Vecchi
www.ldeo.columbia.edu/ res/div/ocp/drought/science.shtml
Seager et al, 2007
R.Seager, M.Ting, I.Held, Y.Kushnir, J.Lu, G.Vecchi,
H.-P. Huang, N.Harnik, A.Leetmaa, N.-C.Lau, C.Li,
J.Velez, N.Naik, 2007. Model Projections of an Imminent Transition to a
More Arid Climate in Southwestern North
America. Science, DOI: 10.1126/science.1139601
Precip – Evap Anomalies~= Runoff 1900-2100
Seager et al, 2007. Average of 19 climate models. SRes A1B emissions scenario. Figure by Naomi Naik. www.ldeo.columbia.edu/res/ocp/drought/science.shtml
Seager et al, 2007.
Yesterday Tomorrow
Precip – Evap Anomalies~= Runoff 1900-2100
• Climate models project drying in SW US• Likely that this is already occurring• Recent drought may become normal
Drought ca. 2050 vs Notorious Recent Historical Droughts
PDSI = Palmer Drought Severity Index
-----------------------------• Seasonal Index• f(Precipitation)• f(Temperature)
2040-2060Courtesy Marty Hoerling, Jon EischeidNOAA ESRL Climate Diagnostics Center
• 18 models IPCC AR4• ‘BAU’ scenario – not consistent with IPCC
terminology
5
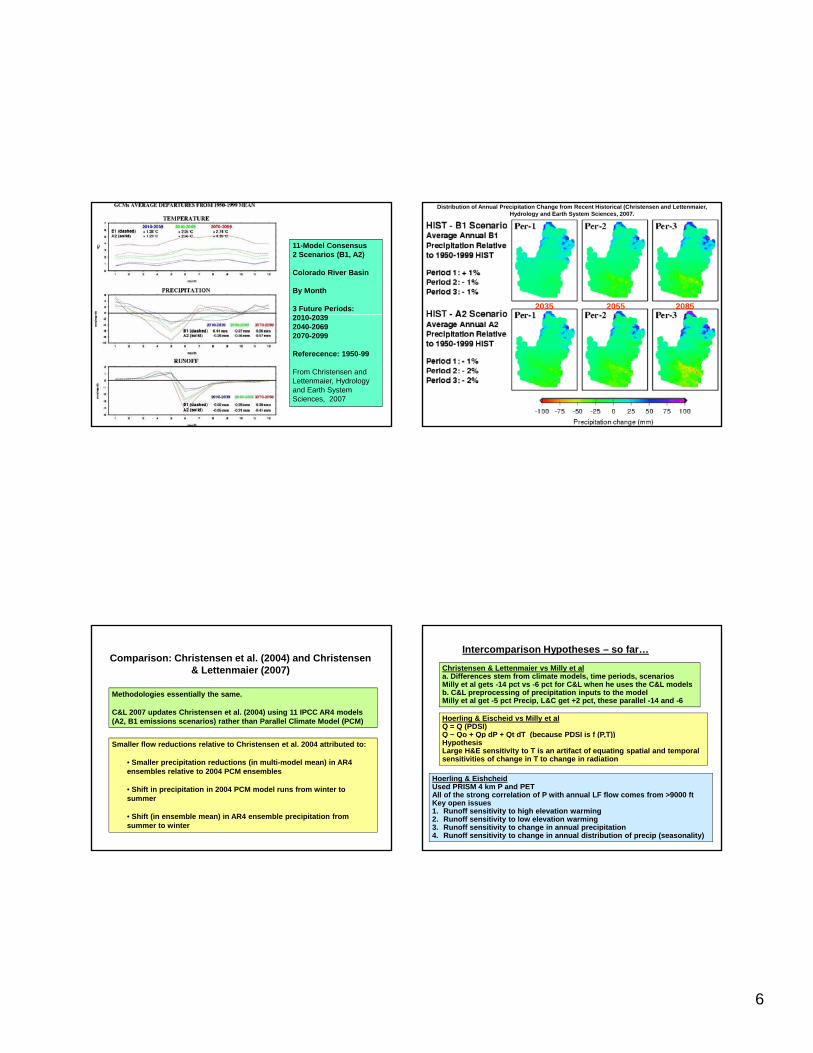
Drought ca. 2050 vs Recent Notorious Droughts
From Hoerling and Eischeid, 2007
Lee’s ferry flows (MAF) = 14.5 + 1.68*PDSI
-Explains 63% variance over 1895-1989
- 85% over 1990-2005
Big impact: temperature increasing atmospheric
demand for water Marty Hoerling and Jon Eischeid, Past Peak Water in the Southwest, SW Hydrology, 2007..
Christensen and Lettenmaier , 2007
Hydrology and Earth System Sciences – online journal
Colorado River Basin
Variable Infiltration Capacity (VIC model)
CRSS –Operational Co R management system
11 Models, 2 CO2 Scenarios, Colorado River Basin (from Christensen and Lettenmaier, HESS, 2007)
6
11-Model Consensus2 Scenarios (B1, A2)
Colorado River Basin
By Month
3 Future Periods: 2010-20392040-20692070-2099
Referecence: 1950-99
From Christensen and Lettenmaier, Hydrology and Earth System Sciences, 2007
Distribution of Annual Precipitation Change from Recent Historical (Christensen and Lettenmaier, Hydrology and Earth System Sciences, 2007.
2035 2055 2085
Methodologies essentially the same.
C&L 2007 updates Christensen et al. (2004) using 11 IPCC AR4 models (A2, B1 emissions scenarios) rather than Parallel Climate Model (PCM)
Comparison: Christensen et al. (2004) and Christensen & Lettenmaier (2007)
Smaller flow reductions relative to Christensen et al. 2004 attributed to:
• Smaller precipitation reductions (in multi-model mean) in AR4 ensembles relative to 2004 PCM ensembles
• Shift in precipitation in 2004 PCM model runs from winter to summer
• Shift (in ensemble mean) in AR4 ensemble precipitation from summer to winter
Intercomparison Hypotheses – so far…
Christensen & Lettenmaier vs Milly et ala. Differences stem from climate models, time periods, scenariosMilly et al gets -14 pct vs -6 pct for C&L when he uses the C&L modelsb. C&L preprocessing of precipitation inputs to the modelMilly et al get -5 pct Precip, L&C get +2 pct, these parallel -14 and -6
Hoerling & Eischeid vs Milly et alQ = Q (PDSI)Q ~ Qo + Qp dP + Qt dT (because PDSI is f (P,T))
Hoerling & EishcheidUsed PRISM 4 km P and PETAll of the strong correlation of P with annual LF flow comes from >9000 ftKey open issues1. Runoff sensitivity to high elevation warming2. Runoff sensitivity to low elevation warming3. Runoff sensitivity to change in annual precipitation4. Runoff sensitivity to change in annual distribution of precip (seasonality)
p ( ( , ))HypothesisLarge H&E sensitivity to T is an artifact of equating spatial and temporal sensitivities of change in T to change in radiation
7
Intercomparison Bottom Line (so far)
The model results agree more when application details agree more… Differences largely reduced.
But … their agreement is based on different processes!
1. Dominated by atmospheric forcing (precipitation, temperature)2. Dominated by land processes
New Hypotheses – Mike Dettinger
Western streamflow responses to warming will be determined almost equally by both meteorological and land-surface (e.g., snowpack) responses
Changes in snowmelt timing can modify water-budget responses to warming, by shifting water availability from seasons of high (and higher) PET into earlier seasons characterized by the same
GCM-derived runoff and ET downplay snow feedbacks to the point where they also overestimate drying associated with warming.
(or less) PET as in historical hydrographs
PDSI does not capture this effect, treats ΔT and ΔP changes interchangeably, and therefore can overestimate drying associated with warming.
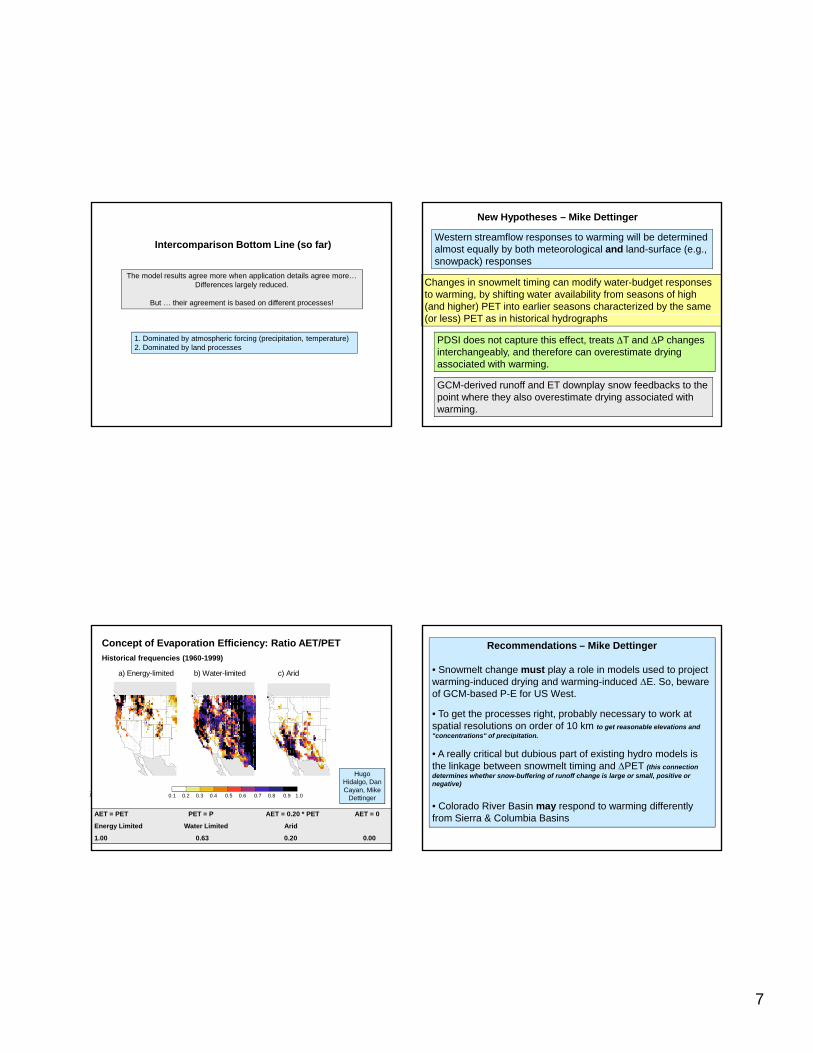
a) Energy-limited b) Water-limited c) Arid
Concept of Evaporation Efficiency: Ratio AET/PET Historical frequencies (1960-1999)
0 10 20 30 40 50 60 70050100
0 10 20 30 40 50 60 70050100
10 20 30 40 50 60 700.1 0.2 0.3 0.4 0.5 0.6 0.7 0.8 0.9 1.0
AET = PET PET = P AET = 0.20 * PET AET = 0
Energy Limited Water Limited Arid
1.00 0.63 0.20 0.00
Hugo Hidalgo, Dan Cayan, Mike
Dettinger
Recommendations – Mike Dettinger
• Snowmelt change must play a role in models used to project warming-induced drying and warming-induced ΔE. So, beware of GCM-based P-E for US West.
• To get the processes right, probably necessary to work at spatial resolutions on order of 10 km to get reasonable elevations and "concentrations" of precipitation.co ce t at o s o p ec p tat o
• A really critical but dubious part of existing hydro models is the linkage between snowmelt timing and ΔPET (this connection determines whether snow-buffering of runoff change is large or small, positive or negative)
• Colorado River Basin may respond to warming differently from Sierra & Columbia Basins

8
SIMULATED CHANGES IN RUNOFF+RECHARGE
Sensitivity of runoff and recharge to climate warming.
A Looming Issue??
IN RUNOFF+RECHARGE under a uniform +3ºC warming
Simulated with the U of WA VIC-hydrologic model: Hidalgo et al, in prep
Mike Dettinger, Sam Earman, Hugo Hidalgo, Dan Cayan
Intercomparison with identical data (1970-1999 for calibration, 2000-2006 for modeling), calibration frequency, etc.
Additional meetings with decision makers – Spring 2008
Assessment of utility of intercomparison for decision makers
Project Plans
Explore approaches for communicating projection uncertainty