recommendations for advanced design mixer … recommendations for advanced design mixer pump...
TRANSCRIPT

PNNL-14443
Recommendations for Advanced Design Mixer Pump Operation in Savannah River Site Tank 18F C. W. Enderlin G. Terrones C. J. Bates B. K. Hatchell B. Adkins October 2003 Prepared for the U.S. Department of Energy under Contract DE-AC06-76RL01830

DISCLAIMER
This report was prepared as an account of work sponsored by an agency of the United States Government. Neither the United States Government nor any agency thereof, nor Battelle Memorial Institute nor any of their employees makes any warranty, express or implied, or assumes any legal liability or responsibility for the accuracy, completeness, or usefulness of any information, apparatus, product, or process disclosed or represents that its use would not infringe privately owned rights. Reference herein to any specific commercial product, process, or service by trade name, trademark, manufacturer, or otherwise does not necessarily constitute or imply its endorsement, recommendation, or favoring by the United States Government or any agency thereof, or Battelle Memorial Institute. The views and opinions of authors expressed herein do not necessarily state or reflect those of the United States Government or any agency thereof.
PACIFIC NORTHWEST NATIONAL LABORATORY
operated by BATTELLE
for the
UNITED STATES DEPARTMENT OF ENERGY under Contract DE-AC06-76RL01830
Printed in the United States of America
Available to DOE and DOE contractors from the Office of Scientific and Technical Information,
P.O. Box 62, Oak Ridge, TN 37831-0062; ph: (865) 576-8401 fax: (865) 576-5728
email: [email protected] Available to the public from the National Technical Information Service,
U.S. Department of Commerce, 5285 Port Royal Rd., Springfield, VA 22161 ph: (800) 553-6847 fax: (703) 605-6900
email: [email protected] online ordering: http://www.ntis.gov/ordering.htm
This document was printed on recycled paper. (8/00)

PNNL-14443
Recommendations for Advanced Design Mixer Pump Operation in Savannah River Site Tank 18F
C. W. Enderlin G. Terrones C. J. Bates B. K. Hatchell B. Adkins(a) October 2003
Prepared for the U.S. Department of Energy under Contract DE-AC06-76RLO 1830 Pacific Northwest National Laboratory Richland, WA 99352 (a) Westinghouse Savannah River Site

iii
Summary Pacific Northwest National Laboratory (PNNL) conducted scaled testing of the advanced design mixer pump (ADMP) retrieval system to be deployed in Savannah River Site (SRS) Tank 18F. The work was performed in the 1/4-scale double shell tank (DST) test facility at PNNL for the U.S. Department of Energy Tanks Focus Area (TFA). The ADMP, which is capable of continuous oscillation with sweep angles up to 180º, is to be installed in the center of the 85.5-ft-diameter tank. The ADMP is to be operated to mobilize the Tank 18F waste and transport it to the vicinity of the Bibo retrieval pump, which is to be placed on a radius of 37.5 ft. The Bibo pump will remove the waste stream from Tank 18F through a retrieval line to Tank 7F until the liquid in Tank 18F is drawn down to a level that precludes operation of the equipment. The solids will be allowed to settle in Tank 7F and then the liquid will be recycled into Tank 18F to be used in another pump-down cycle. Testing was conducted to address technical issues associated with:
• Whether the effective cleaning radius (ECR) of the ADMP in Tank 18F is large enough to reach the tank wall
• What effect the ADMP elevation has on the effectiveness of the jets to mobilize and transport the waste to the vicinity of the retrieval pump
• Whether the ADMP and Bibo retrieval pump combination can effectively retrieve the waste from Tank 18F
• What operating strategy would maximize the waste retrieved and minimize the number of pump-down cycles.
The test program used a waste simulant developed and predicted to contain 35% fast-settling (>1 cm/s) solids by volume. During the test program, SRS revised the waste prediction for Tank 18F, reducing the total volume of solids by 37% and predicting the fast settling solids as composing 4% of the waste volume. A second “sludge” simulant was used to represent the revised estimate for the waste composition. Testing with both simulants demonstrated that the ADMP was capable of mobilizing material in all regions of the tank and transporting the waste inventory to the vicinity of the retrieval pump. Operating strategies for both simulants are provided in the report. However, the impacts on scope and budget created by revising the waste composition during the test program prevented the operating strategies from being optimized. Testing with the fast-settling simulant led to a recommendation that the ADMP nozzle elevation be 23 inches. The Bibo retrieval pump was not adequate for retrieving the fast-settling

iv
solids. The low flow rate relative to that of the ADMP jets and the inlet geometry prohibited particle entrainment into the retrieval pump. Simulated pump-down tests were conducted using the “sludge” simulant. Due to schedule and resource constraints, no waste characterization was performed to support the revised SRS prediction for waste composition. Therefore, uncertainties exist regarding how well this sludge simulant actually represented the Tank 18F waste. The pump-down tests with the sludge simulant retrieved 94% of the waste volume in four pump-down cycles.
v
Acknowledgments The authors gratefully acknowledge the support of PNNL staff who participated in the completion of this project. First, the authors thank Donald Bell for his superior craftsmanship, design experience, long hours, and commitment to excellence, which were crucial to the expedited fabrication of the test setup. His efforts were invaluable to the completion of this project. Second, the authors are indebted to William Combs and Michael White for many late nights burning the midnight oil and grace under pressure.
The authors would also like to thank Pete Gibbons of TFA and Bruce Martin of SRS in securing resources and providing Brannen Adkins to assist in this endeavor. The authors appreciate the patience and assistance of William Bonner and Sheila Bennett in getting this material published. Funding for this work was provided by the Tanks Focus Area, a program established by the U.S. Department of Energy’s Environmental Management Office of Science and Technology to provide technical solutions for remediation and closure of radioactive waste storage tanks.

vii
Acronyms and Nomenclature ∆ρ density difference between particulate and liquid φ mass fraction of solids in the waste heel δp characteristic mean particle diameter ρ liquid density ω angular velocity of ADMP ADMP Advanced design mixer pump D tank diameter D nozzle diameter DAS data acquisition system DOE U.S. Department of Energy DST double shell tank ECR effective cleaning radius FDH full discharge head Fr Froude Number FrM Modified Froude Number Frρ Densimetric Particle Froude Number FTF F-Area Tank Farm g gravitational acceleration h total waste height h1 initial height of liquid above the sludge level h2 initial height of sludge level PNNL Pacific Northwest National Laboratory Re Reynolds Number RPD&E Retrieval Process Development and Enhancement (PNNL) s1 nondimensional waste depth SC South Carolina S.G. specific gravity SRS Savannah River Site TFA Tank Focus Area TNX full tank test facility at SRS U nozzle discharge velocity WRE Waste Removal Engineering WSRC Westinghouse Savannah River Company

ix
Contents
Summary ...........................................................................................................................................iii
Acknowledgments......................................................................................................................................... v
Acronyms and Nomenclature......................................................................................................................vii
1.0 Introduction ........................................................................................................................................ 1.1 1.1 Background................................................................................................................................... 1.1 1.2 Technical Issues ............................................................................................................................ 1.2 1.3 Scope and Objective ..................................................................................................................... 1.2
2.0 Approach ............................................................................................................................................ 2.1 2.1 Scaling .......................................................................................................................................... 2.3
2.1.1 Nozzle Velocity Scaling......................................................................................................... 2.3 2.1.2 Angular Velocity Scaling ....................................................................................................... 2.4
2.2 Test Setup ...................................................................................................................................... 26 2.3 Test Procedure ............................................................................................................................ 2.11
3.0 Zeolite Simulant Testing .................................................................................................................... 3.1 3.1 Test Description............................................................................................................................ 3.1 3.2 Test Results................................................................................................................................... 3.1 3.3 Recommendations from Zeolite Simulant Testing ..................................................................... 3.11
4.0 Pump-Down Tests with Kaolin Clay.................................................................................................. 4.1 4.1 Test Description............................................................................................................................ 4.2 4.2 Test Results................................................................................................................................... 4.5 4.3 Recommendations from Kaolin Clay Tests ................................................................................ 4.26
5.0 Conclusions ........................................................................................................................................ 5.1 5.1 Conclusions from Zeolite Tests .................................................................................................... 5.1 5.2 Conclusions from Kaolin Clay Tests ............................................................................................ 5.1
6.0 References .......................................................................................................................................... 6.1
Appendix: Schematics of ADMP Mockup .............................................................................................. A.1

x
Figures 2.1 ADMP Scaled Mockup and Transfer Pump Mockup ...................................................................... 2.7 2.2 Close-up of Lower Portion of ADMP Mockup Showing Discharge Nozzles.................................. 2.8 2.3 Lower Portion of the Full-Scale ADMP Installed in the SRS Test Facility..................................... 2.8 2.4 Mockup of ADMP Rotational Drive................................................................................................ 2.9 2.5 Paco Pump Skid Installed Outside the 336 Building Test Facility ................................................ 2.10 2.6 Plan View of Test Tank Setup Showing Transfer Pump Relative to ADMP Mockup .................. 2.13 3.1 Solids Topography after 10o of Discrete Positioning and Run Time of 11 min............................... 3.4 3.2 Solids Topography after 90o of Discrete Positioning in 10o Increments with
ADMP Run for 5 min. at each Position ........................................................................................... 3.5 3.3 Solids Topography after 180o of Discrete Positioning in 10o Increments with
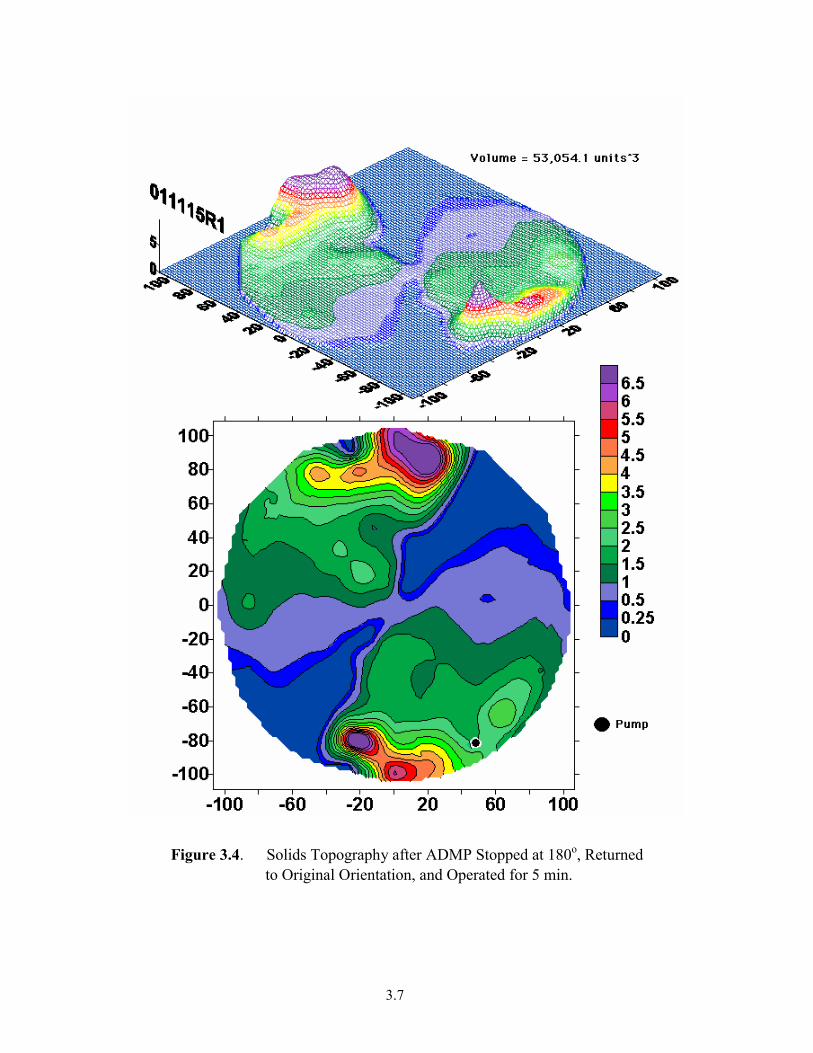
ADMP Run for 5 min. at each Position ........................................................................................... 3.6 3.4 Solids Topography after ADMP Stopped at 180o, Returned to Original
Orientation, and Operated for 5 min. ............................................................................................... 3.7 3.5 Solids Topography Obtained During Second Sweep of ADMP after 30o Discrete .............................
Positioning in 5o Increments with ADMP run for 5 min. at each Position ...................................... 3.8 3.6 Solids Topography Obtained During Second Sweep of ADMP after 70o Discrete
Positioning in 5o Increments with the ADMP Run for 5 min. at each Position ............................... 3.9 4.1 Weight Percent Solids Through Transfer Pump and Mixer Pump Orientation
During First Hour of Cycle 1 Transfer............................................................................................. 4.7 4.2 Weight Percent Solids Through the Transfer Pump and Mixer Pump Orientation
During Second Hour of Cycle 1 Transfer ........................................................................................ 4.7 4.3 Weight Percent Solids Through the Transfer Pump and Mixer Pump Orientation
During Third Hour of Cycle 1 Transfer ........................................................................................... 4.8 4.4 Weight Percent Solids Through the Transfer Pump and Mixer Pump Orientation
During Fourth Hour of Cycle 1 Transfer ......................................................................................... 4.8 4.5 Weight Percent Solids Through the Transfer Pump and Mixer Pump Orientation
During First Hour of Cycle 2 Transfer............................................................................................. 4.9 4.6 Weight Percent Solids Through the Transfer Pump and Mixer Pump Orientation
During Second Hour of Cycle 2 Transfer ........................................................................................ 4.9 4.7 Weight Percent Solids Through the Transfer Pump and Mixer Pump Orientation
During Third Hour of Cycle 2 Transfer ......................................................................................... 4.10 4.8 Weight Percent Solids Through the Transfer Pump and Mixer Pump Orientation
During Fourth Hour of Cycle 2 Transfer ....................................................................................... 4.10 4.9 Weight Percent Solids Through the Transfer Pump and Mixer Pump Orientation
During Fifth Hour of Cycle 2 Transfer .......................................................................................... 4.11 4.10 Weight Percent Solids Through the Transfer Pump and Mixer Pump Orientation
During Sixth Hour of Cycle 2 Transfer.......................................................................................... 4.11 4.11 Weight Percent Solids Through the Transfer Pump and Mixer Pump Orientation
During Seventh Hour of Cycle 2 Transfer ..................................................................................... 4.12

xi
4.12 Weight Percent Solids Through the Transfer Pump and Mixer Pump Orientation During Eighth Hour of Cycle 2 Transfer ....................................................................................... 4.12
4.13 Weight Percent Solids Through the Transfer Pump and Mixer Pump Orientation During First Hour of Cycle 3 Transfer........................................................................................... 4.13
4.14 Weight Percent Solids Through the Transfer Pump and Mixer Pump Orientation During Second Hour of Cycle 3 Transfer ...................................................................................... 4.13
4.15 Weight Percent Solids Through the Transfer Pump and Mixer Pump Orientation During Third Hour of Cycle 3 Transfer ......................................................................................... 4.14
4.16 Weight Percent Solids Through the Transfer Pump and Mixer Pump Orientation During Fourth Hour of Cycle 3 Transfer ....................................................................................... 4.14
4.17 Weight Percent Solids Through the Transfer Pump and Mixer Pump Orientation During Fifth Hour of Cycle 3 Transfer .......................................................................................... 4.15
4.18 Weight Percent Solids Through the Transfer Pump and Mixer Pump Orientation During Sixth Hour of Cycle 3 Transfer.......................................................................................... 4.15
4.19 Waste Topography of Kaolin Clay at the Completion of Cycle 1 ................................................. 4.17 4.20 Waste Topography of Kaolin Clay at the Completion of Cycle 2 ................................................. 4.18 4.21 Photograph of Solids Topography Following Cycle 1 Transfer .................................................... 4.19 4.22 Photograph of Solids Topography Following Cycle 2 Transfer .................................................... 4.19 4.23 Waste Topography of Kaolin Clay at the Completion of Cycle 3 ................................................. 4.20 4.24 Waste Topography of Kaolin Clay after 8 hr of Run Time During Cycle 4 .................................. 4.21 4.25 Waste Topography of Kaolin Clay after 16 hr of Run Time During Cycle 4 ................................ 4.22 4.26 Waste Topography of Kaolin Clay after 24.4 hr of Run Time During Cycle 4 ............................. 4.23 4.27 Waste Topography of Kaolin Clay after 26.8 hr Run Time at Completion of Cycle 4.................. 4.24 4.28 Photograph of Solids Topography Following Cycle 3 Transfer .................................................... 4.25 4.29 Photograph of Solids Topography Following Cycle 4 Transfer. ................................................... 4.25
Tables 2.1 SRS Predictions of Tank 18F Waste Composition............................................................................ 2.2 2.2 Parameters Associated with Mobilization and Retrieval in the Full-Scale
Prototype and the Scaled Model........................................................................................................ 2.6 2.3 Comparison of Selected Dimensionless Numbers Between the Full-Scale
Tank 18F System and the Scaled Test Model of the Retrieval System............................................. 2.6 3.1 Conditions and Results for Stationary Mixer Erosion Tests ............................................................. 3.2 3.2 ECRs Obtained for Continuous Oscillation of ADMP and Comparison of wt% Solids
Passing Through the Retrieval Pump and ADMP............................................................................. 3.3 3.3 Test Sequence Conducted to Obtain Topographies Shown in Figures 3.1–3.6............................... 3.10 4.1 Cycle 1 (11/20/01) Test Description ................................................................................................. 4.2 4.2 Cycle 2 (11/24/01) Test Description ................................................................................................. 4.3 4.3 Cycle 3 (11/26/01) Test Description ................................................................................................. 4.4 4.4 Cycle 4 (12/4–11/01) Test Description ............................................................................................. 4.4

xii
4.5 Results of Waste Transfer Assuming a Sludge Density of 1.48........................................................ 4.5 4.6 Results of Waste Transfer Assuming a Sludge Density of 1.43........................................................ 4.6 4.7 ECR Values Obtained During ADMP Pump-Down Tests with Kaolin Clay ................................. 4.16

1.1
1.0 Introduction
This report documents recommendations for operating the advanced design mixer pump (ADMP) in Tank 18F at the Savannah River Site (SRS). It also presents the results from simulated scaled pump-down tests. The work performed in support of this effort was carried out between August and December 2001 in the 1/4-scale double shell tank (DST) test facility at Pacific Northwest National Laboratory (PNNL). The work was conducted for the U.S. Department of Energy (DOE) Tanks Focus Area (TFA) by the PNNL Retrieval Process Development and Enhancement (RPD&E) program managed by Brian Hatchell. The recommendations detailed in this report were communicated to Eloy Saldivar of SRS in a series of memos and a letter report written between October 2001 and January 2002.
1.1 Background
The Westinghouse Savannah River Company (WSRC) is preparing to mobilize, mix, and transfer the waste solids from Tank 18F into Tank 7F at the SRS in Aiken, SC. Tank 18F is targeted for closure in FY 2004 following heel removal and tank cleaning operations, which began in FY 2002. Tank 18F is a 1.3-million-gallon capacity, single-wall, Type IV waste tank in the F-Area Tank Farm (FTF). The tank is an 85.5-ft-diameter, flat-bottomed, cylindrical carbon steel tank with a domed roof. The walls are roughly 34.5 ft high, and the height at the center is 45.5 ft. There are no cooling coils or internal supports inside the tank.
The total waste volume (salt, sludge, and zeolite) in Tank 18F was estimated as 75,000 gallons in FY 2001 (Lilliston 2001). The heel removal strategy consists of a standard solids mobilization/suspension and batch transfer operation to move the solids from Tank 18F into Tank 7F. The Tank 18F retrieval system consists of a single ADMP deployed through the center riser and a Bibo retrieval pump located in a 24-inch riser at a radius of 35.7 ft from the center of the tank. The ADMP is a long-shafted centrifugal pump with an overall length of about 56 ft. The ADMP will be supported by structural steel laid over the top of the center riser of Tank 18F. The tank is equipped with two horizontally opposed tangential nozzles with a combined flow rate of 10,400 gpm at 55 ft of discharge head. The ADMP is capable of 180-degree continuous oscillation or discrete, incremental positioning, as needed, to reach all locations inside the tank.
Several technical issues regarding the ability of the Tank 18F retrieval system to remove the solids from the tank efficiently have been raised by SRS and PNNL staff. In response to these uncertainties, TFA has tasked PNNL to evaluate the capability of the Tank 18F retrieval system to mobilize the solid waste within the tank and transport it through the retrieval pump. The technical issues are summarized below.

1.2
1.2 Technical Issues
The estimated cleaning radius (ECR) of the ADMP may not be capable of reaching the walls of Tank 18F. Preliminary ECR calculations have been completed by SRS personnel based on Tank 8F sludge data. These calculations show that the ECR exceeds the radius of Tank 18F. Full-scale testing with small amounts of kaolin in the Full-Tank Test Facility (TNX) also showed that the ECR of the ADMP exceeds the radius of the Tank 18F wall. Confirmatory testing based on the current contents and waste topography of Tank 18F (sludge and zeolite) is needed to ensure the success of the Tank 18F Waste Removal Project.
The ability of the ADMP to fully and efficiently suspend and remove the fast-settling solids and sludge from Tank 18F is unknown. The current Tank 18F operating plan estimates that it will take five mixing and transfer cycles to remove the entire contents of the tank. A technical basis is needed to support this assumption. An incorrect assumption has the potential to adversely impact the Tank 18F waste removal schedule and the regulatory schedule to close the tank in FY 2004.
The effect of mixer jet elevation on mixing and solids transport within the tank is unknown. The current design places the suction of the ADMP approximately 6 inches above the tank floor. A technical basis is needed to support this design assumption. Unlike previous waste removal projects, the ADMP will not be equipped with spacer cans (shims) to adjust the elevation of the mixer pump suction during operation.
1.3 Scope and Objective
The ultimate purpose of the scaled operational ADMP tests was to provide recommendations for the operation of the ADMP and to maximize the waste retrieved from Tank 18F in the minimum number of pump-down cycles. One pump-down cycle consists of pumping out a volume of waste (pump down) and adding new or recycled liquid to the tank before the next pump-down cycle begins.
The following objectives were identified for achieving the goal of the operational tests.
• Evaluate the ability of the ADMP to mobilize and transport solid waste within Tank 18F.
• Evaluate the capability of the Tank 18F retrieval system to transport material from the tank via the retrieval pump.
• Evaluate the ECR of the ADMP as a function of nozzle elevation, mixer pump flow rate, pump rotational speed, and waste properties.
• Develop recommendations for the nozzle elevation and operating scenario to be employed in Tank 18F.

2.1
2.0 Approach Scaled testing was performed in the 1/4-scale DST (18.8-ft-diameter tank) at the PNNL Fluid Dynamics Laboratory in the 336 Building at the Hanford Site in southeastern Washington State. Tank 18F at 25.9 m (85 ft) is 4.53 times larger than the 1/4-scale DST test tank (5.7 m or 18.8 ft). A geometrically scaled (1/4.53 of full scale) mockup of the ADMP was installed in the test tank. Mobilization and retrieval scenarios were tested using simulants for removal of the zeolite, sludge, and salt waste in Tank 18F. The operational tests were based on the current plans for full-scale deployment and operation of the ADMP and a Bibo transfer pump in Tank 18F (Lilliston 2001). The mockup of the ADMP duplicated the essential components that govern the fluid flow into and out of the ADMP. Figures A.1 and A.2 in the appendix contain schematics of the scaled ADMP mockup. The internal mechanical components of the pump are not essential to scaling the external (to the mixer pump) fluid flow produced by the ADMP. The essential components included the nozzles, the geometry of the casing at the nozzle exit, the suction inlet, and the external structures below the suction inlet. The strategy applied to meet the objectives of this test plan was based on the approach used previously in the successful scaling analysis applied in developing the Flygt™ Mixer Phase D test program. That analysis was performed in support of the Tank 19F retrieval operations at SRS (Enderlin et al. 2002). This scaling methodology resulted in operations in both the scaled test tank and Tank 19F yielding similar results for waste topography and retrieval rates. The ADMP test program used both simulant development techniques and the simulant recipe used in the Phase D tests (Enderlin et al. 2002). This strategy allows the retrieved solids concentration in the full-scale operation to be predicted based on the scaled test results if the physical properties of the Tank 18F waste match those of the scaled tank simulant. If the Tank 18F waste properties were not fully matched, the results of the scaled tests would provide relative performance for various operating scenarios similar to those encountered at full scale (i.e., the best and worst scenarios at scaled conditions will yield the best and worst performance in Tank 18F). The Buckingham Pi theorem was the basis for deriving the dimensionless parameters that describe the phenomenon occurring within the retrieval tank. The dimensionless parameters were used to establish scaling factors for designing and operating the test system and to determine the values of operating parameters within the test tank. It was assumed that sub-merged turbulent jets with Reynolds numbers greater than 40,000 are similar (Rajaratnam 1976). Tests were designed and executed to obtain data that could provide the following:
• Determining the effect of jet nozzle height on the ECR and the growth rate of the ECR.
• Mapping the change in topography as a function of time for both oscillating and fixed position jets (ADMP).

2.2
• Identifying the critical topography, jet velocity, and angular velocity of the jets that result in peak retrieval rates.
• Developing scenarios using topography data as a function of time to optimize the location of settled particulate, which maximizes the retrieval line concentration.
The initial test effort focused on ADMP operations in Tank 18F assuming the waste had a
high percentage of fast-settling (>1 cm/s) granular particles. The simulant selection was based on the waste composition reported in the Tank 18F Waste Removal Operating Plan (Lilliston 2001). The predicted composition is listed in Table 2.1. The ADMP performance and resulting solids retrieval rate were evaluated as a function of nozzle height, rotation speed, and velocity.
The approach was to evaluate and optimize the individual components of the mobilization and retrieval process. The results would be integrated to determine a complete operational scenario that would maximize the amount of solids retrieved per pump-down cycle. The operational scenario would be validated by testing, and a simulated pump-down sequence would be carried out to predict Tank 18F performance.
Prior to validating an operating scenario, SRS (10/31/2001 email from Brannen Adkins of SRS) revised the estimated waste composition for Tank 18F (see Table 2.1). The revised waste composition reduced the estimated volume of fast settling particles by 92% and estimated the Tank 18F waste consisted of 96% by volume of fine (1 to 10 µm) particle sludge. Therefore, SRS requested that simulant consisting primarily of kaolin clay be used for performing the simulated pump-down tests. The initial scaling and test strategy was developed based on the initial waste composition. Schedule and funding did not allow the issues associated with SRS changes to the waste estimate to be evaluated. Recommendations for operating the ADMP in Tank 18F, assuming a large fraction of granular material (zeolite and salt crystals) exists, are provided in Section 3. However, due to the change in simulant composition, the recommended operating scenario for the original simulant was not evaluated during pump-down tests.
Table 2.1. SRS Predictions of Tank 18F Waste Composition
Constituent Waste Prediction from
Tank 18F Operations Plan(a)
(gal)
Revised SRS Waste Prediction November 2001(b)
(gal) Zeolite 13,000 2,000 Salt 13,000 0 Sludge 49,000 45,000 Total solids Volume 75,000 47,000 (a) Lilliston (2001). (b) Oct. 31, 2001 email from Brannen Adkins (SRS).

2.3
Results of simulated pump-down tests using kaolin clay are provided in Section 4. However, uncertainties exist regarding the applicability of kaolin clay as a simulant, and the results, while useful for evaluating ADMP operations, should not at this time be considered predictions for actual ADMP performance in Tank 18F.
2.1 Scaling
The geometric scaling factor was based on the ratio of the Tank 18F and test tank (1/4-scale DST) diameters, which was 4.53. Geometric similarity was achieved for all critical components between the scaled and Tank 18F setup. The following dimensionless parameters were identified as a result of the scaling analysis: the jet Reynolds number, standard Froude number, the time ratio, the ratio of solids mass retrieved to initial solids mass, the ratio of retrieval line solids concentration to bulk solids concentration within the tank, and the dimensionless settling velocity. In addition, dimensionless parameters are developed for nozzle discharge velocity and ADMP angular velocity scaling. Sections 2.1.1 and 2.1.2 present these additional dimensionless numbers that are critical for determining the operating parameters for the scaled tests. 2.1.1 Nozzle Velocity Scaling
Experimental data on the erosion of cohesionless materials show that the volume of scoured
material is independent of the scale of the model (Ade and Rajaratnam 1998). Furthermore, the dominant dimensionless numbers for cohesionless erosion are the densimetric particle Froude number Frρ and the relative downstream depth s1 defined by
Frρ =U
gδp ∆ρ / ρ
s1 =h1d
where d = Nozzle diameter δp = Characteristic mean particle diameter ∆ρ = Density difference between particulate and liquid ρ = Density of liquid U = Jet nozzle velocity h1 = Initial height of liquid above the sludge level g = Gravitational acceleration. It is expected that the particulate of the simulant will have properties similar to those of the
actual sludge in terms of cohesion characteristics, density, and particle size. Thus, it follows from Frρ that the velocity in the scaled model should be the same as that in the full-scale tank.

2.4
If the densimetric particle Froude number is large enough, particle erosion in cohesionless sludge will take place at a high rate, resulting in complete scouring in the vicinity of the jet nozzle. In this instance, matching the densimetric Froude number in both the scaled and full-scale tanks will not be necessary. This situation is analogous to matching in the scaled and full-scale tanks a very large Reynolds number. When the densimetric Froude number is large, the relevant parameter that must be matched is the standard Froude number, in which a modification to the vertical length scale is made to account for the settled solids layer. The Froude number is
Fr =U2
g φ h2 + 1 −φ( )h1[ ]
where h2 = Initial height of sludge level φ = Mass fraction of solids in the heel. Assuming that there is geometric scaling between the model (indicated by the subscript S) and the prototype (denoted by the subscript F), the velocity in the scaled tank Us is given by
US = φS h2S +(1- φ S ) h1S
φF h2F +(1- φ F ) h1F
UF
if φS = φF and
h2F
h2S
=h1F
h1S
= 4.53
Then US = UF
4.53= 0.47 UF
2.1.2 Angular Velocity Scaling
The relevant scaling parameter is the product of the angular rotation rate of the ADMP and
the residence time. The residence time is defined as that required for the mixer pump to cycle the tank volume (i.e., the time required to drain the tank at the nozzle flow rate). The resulting dimensionless parameter is
N0 =ω h D2
d2U
where D = Tank diameter h = Solid plus liquid level height, total waste height d = Nozzle diameter

2.5
ω = ADMP angular rotation rate U = Jet nozzle velocity.
The geometric-scale factor is 4.53, and if the densimetric particle Froude number is matched, the velocity scale factor is 1 (the jet velocities are the same in the model and the prototype). This provides a bounding condition for the ratio between the full-scale and scaled ADMP angular velocity, which is
ωs =ds DFdF Ds
2hFhs
UsUF
ωF = 4.53ωF
where the subscripts s and F refer to the scaled and full-scale model, respectively. Using the modified Froude number to determine the scaled velocity the jet velocity scales as the inverse of the square root of the geometric scale,
Us =14.53
U F
as defined in Section 2.1.1. The scaled ADMP frequency (angular rotation) is
ωs =ds DFdF Ds
2hFhs
UsUF
ωF = 4.53ω F = 2.13ω F
The ratio of the angular velocity defines how time scales between full-scale and scaled tests. If the modified Froude number is used to determine the scaled velocity, 1 minute of full-scale time would occur in 1/2.13 minutes, or 23.7 seconds. Table 2.2 presents values of key parameters for both Tank 18F and the test setup. Table 2.3 contains calculated values for the various Froude numbers and the jet Reynolds number.

2.6
Table 2.2. Parameters Associated with Mobilization and Retrieval in the Full-Scale Prototype and the Scaled Model
Parameter Description Symbol Full Scale Model Tank diameter D 25.9 m 5.71 m Nozzle diameter d 0.152 m 0.034 m Initial Liquid elevation hliquid 1.98 m 0.43 m Initial solids layer depth h2 0.54 m 0.08 to 0.12 m Radial location of the retrieval pump rretrieval 10.9 m 2.4 m Characteristic mean particle diameter δP 7x10⁻⁴ m 7x10⁻⁴ m Nozzle discharge velocity U 9 to 18 m/s 8.5 to 18 m/s Retrieval pump inlet area ARinlet 95 in2 6.6 in2
Retrieval pump inlet velocity UR 0.6 to 0.8 ft/sec 0.6 to0.9 ft/sec Liquid density ρ 1170 kg/m3 998 kg/m3 Solids density ρs 2000 kg/m3 2000 kg/m3 Viscosity of liquid µ 0.0012 Pa-s 0.001 Pa-s Mixer pump rate of rotation ω 0.25 to 1 rpm 0.25 to 5 rpm
Table 2.3. Comparison of Selected Dimensionless Numbers Between the Full-Scale Tank 18F System and the Scaled Test Model of the Retrieval System
Dimensionless Parameters Symbol Full Scale Model Model/Full ScaleStandard Froude Number Fr 9.0 to 16.7 15.7 to 75.2 1.7 to 4.5 Modified Froude Number FrM 20.8 to 24.9 23.9 to 112 1.1 to 4.5 Densimetric Particle Froude Number Frρ 223 to 322 163 to 2708 0.7 to 0.8
Jet Reynolds Number Re 1,336,000 to
2,677,000 276,000 to
603,000 0.21 to 0.22
2.2 Test Setup
The test system consists of the 1/4-scale DST facility, the scaled mockup of the ADMP, a data acquisition system (DAS), a diesel–driven, Paco-type LUE Model 40157 pump and associated flex hose and piping, submersible Flygt Ready 4 dewatering pump and associated flexible hose to mockup Bibo retrieval pump and transfer line, and supporting analytical laboratory.
The 1/4-scale DST facility consists of the 1/4-scale DST test tank, a supernatant tank, a slurry tank, integrated connective piping, and diaphragm transfer pumps for handling water and test slurry. The 1/4-scale DST tank is cylindrical with a diameter of 5.7 m (18.8 ft) and a capacity of 59 m3 (15,625 gal). It is constructed of stainless steel. A dome encloses the top of the tank and contains access ports for installing test equipment. During the operational tests, the

2.7
tank dome was absent. Equipment bridges span all three tanks, and a viewing platform surrounds one-fourth of the 1/4-scale DST circumference. Each of the tanks rests on a group of three load cells, which allows the mass of each tank and its contents to be measured. The bulk of the testing was conducted in the 1/4-scale DST, and the slurry tank was used to accept the retrieval line flow during open loop tests.
The scaled mockup of the ADMP was installed and operated in the center of the 1/4-scale DST. The design incorporated the essential geometric components that influence the ADMP flow external to the mixer pump casing. Figure 2.1 is a photograph of the ADMP installed in the test tank. The inlet suction and the discharge nozzle diameters were geometrically scaled to those of the full-scale mixer pump by a factor of 4.53. A close-up of the lower portion of the scaled ADMP mockup is presented in Figure 2.2. A photo of the lower portion of the full-scale ADMP is presented in Figure 2.3 for comparison.
The scaled ADMP was capable of continuous oscillation with sweep angles of 1o to 180o and
rotational speeds of 0.25 to 5 rpm. The beginning and ending points of the 180o sweep angle were adjustable and could be located at any azimuthal tank position. The pump angular position was measured using a rotating potentiometer. The pump rotation was controlled with a variable-speed DC motor, and limit switches to reverse the rotation were located at the top of the ADMP mockup assembly. Figure 2.4 is a photo of the drive unit.
Figure 2.1. ADMP Scaled Mockup (center) and Transfer Pump Mockup (Flygt 4 Ready Pump in the background)
ADMP Mockup
Transfer Pump (Flygt 4 Ready Pump)
Retrieval Line

2.8
Figure 2.2. Close-up of Lower Portion of ADMP Mockup Showing Discharge Nozzles (nozzle orientation is reversed from full-scale ADMP seen in Figure 2.3)
Figure 2.3. Lower Portion of Full-Scale ADMP Installed in the SRS Test Facility (nozzle orientation of mockup ADMP is reversed from full-scale ADMP in Figure 2.2)
Discharge Nozzles
Inlet Suction Line
Pump Lower Casing Structure

2.9
Figure 2.4. Mockup of ADMP Rotational Drive
The original schematics provided by SRS, which were used to fabricate the ADMP mockup
lower unit, showed the full-scale ADMP nozzles discharging in a counter-clockwise direction when viewed from above. However, the full-scale ADMP nozzles discharge in a clockwise direction when viewed from above. Upon review, the dimensions of the original schematics were found to be correct; only the nozzle discharge direction was in error. Because of schedule constraints, the reversed nozzle configuration of the ADMP mockup was used for the test program. The only consequence of using this reverse configuration was that the final recommendations for full-scale operation were reversed in rotation from those achieved during the test program. The test results presented in Sections 3 and 4 thus are mirror images of those predicted for full-scale performance.
The mockup of the ADMP contained no internal pump components and used an external pump to power the system. The mockup contained one suction line and two discharge lines configured to simulate the suction and discharge flows in and out of the ADMP. External structures in the region of the nozzles and suction inlet were designed to approximate that of the full scale ADMP. Slurry flow through the ADMP was created using a skid-mounted, end-suction, Paco-type LUE Model 40157 pump, which is capable of delivering 500 gpm at 220 full discharge head (FDH) (shown in Figure 2.5). The flow rate was controlled by throttling the diesel engine instead of the throttling valve at the pump discharge. This was done to reduce the chance of solids holdup or settling within the flow loop. The skid-mounted diesel drive and
Discharge Lines
Suction Line
Rotational Drive and
Motor

2.10
Figure 2.5. Paco Pump Skid Installed Outside the 336 Building Test Facility
pump were located outside the 336 Building. The ADMP was plumbed to the pump suction and discharge via 6- and 4-inch lines, respectively. The flow loop was a combination of flex hose and steel pipe with 150-psi class raised face flanges. A 3-inch Micro Motion Coriollis flow meter was installed in the discharge line to measure the total flow rate and slurry density passing through the mixer pump. The discharge flow split into two pipe runs near the top of the mockup pump column. Pressure transducers were installed at symmetrical locations in the separate pipe runs for each nozzle. Throttle valves in the nozzle pipe runs allowed equal flow through both nozzles by balancing the pressure drop through the two lines.
The Flygt 4 Ready pump that powered the retrieval line is capable of producing 10 gpm at 35 FDH. The retrieval line could be operated in a closed loop configuration that discharged the fluid back into the test tank at three locations around the outer circumference of the test tank. The retrieval line could also be operated in an open-loop mode that transferred fluid from the retrieval pump to the slurry tank, simulating a pump-down (waste transfer) operation. The retrieval line flow loop plumbing consisted entirely of flex hose and contained a 1-inch Micro Motion Coriollis meter to provide flow rate and density measurements. The retrieval line flow rate was adjusted by increasing or decreasing the pressure drop through the transfer line. This was accomplished by coiling or straightening the flex hoses.
Suction Line
Discharge Line Paco Pump

2.11
The analytical labs within the 336 Building contain an array of characterization equipment for analyzing the physical properties of simulant batches and samples extracted from the test setup. In support of this effort, the analytical labs were used primarily to develop and characterize the physical properties of the solid simulants.
Two simulants were used for this test effort. The initial simulant, referred to as the zeolite simulant, is the same one developed in February 2001 for the scaled Flygt mixer tests for SRS Tank 19F retrieval. This zeolite simulant consisted of a solids mixture of 4:4:3 by weight of zeolite, 70-mesh silica sand, and kaolin clay. Three-thousand pounds of the solids mixture was added to 22,000 lb of water to create a 12 wt% bulk mixture of solids. For the simulated pump-down operations, a mixture of 49.1 wt% kaolin clay and 50.9 wt% water was used to simulate the settled sludge. Time was allowed for the mixture to gain strength; then, additional water was added on top of the setup mixture to raise the total liquid elevation to 17.2 inches.
2.3 Test Procedure This section provides a brief overview of the test procedure to clarify the results provided in Sections 3 and 4. The test runs can be divided into two categories. The first category started from an initial condition of the settled solids uniformly distributed over the tank floor. The second category was a continuation test in which the tank conditions existing at the end of the previous test along with any additional solids settling occurring while the ADMP was not running became the initial conditions for the next continuation test. Testing started with operational conditions of the ADMP configured in the following way:
• Nozzle (pump assembly) elevation. Shims for thrust bearing were used to raise the ADMP assembly.
• End points of the 180o sweep angle. The pump azimuthal position was referenced by the position on the tank wall that the discharge nozzle centerline intersected (see Figure 2.6).
• Sweep angle. The maximum sweep angle was 180o, but the sweep angle could be set from 0 to 180o.
• Rotational speed. A variable-speed control allowed the ADMP rotational speed to be adjusted between approximately 0.2 and 5 rpm.
• Initial position. For operating conditions using discrete positioning (pump held at a fixed location for specified time or until solids retrieval was observed to decline, then rotated a specified angle to a new fixed position). For operating conditions using continuous rotation the initial position was not considered critical.
After the operating conditions were set, the material was spread to a uniform thickness over the tank floor for an initial condition test or left in its current state for a continuation test.

2.12
The DAS was started with all instruments recording. After obtaining zero readings the retrieval pump was started in the recirculation mode. Flow through the ADMP was initialized and adjusted to the desired rate using the engine speed control. The pressure drop through the two nozzle supply lines was checked and equalized if needed. Depending on the test sequence, the retrieval line was left in the closed loop mode or valved to the open (transfer) mode. During testing, the real-time mass flow rates through the ADMP and retrieval pump could be monitored to evaluate process performance. Depending on the test sequence, the ADMP position was adjusted to specified time intervals or based on changes in solids retrieval rates through the retrieval pump, which could be determined based on mass flow rate and solids concentration. For monitoring, the assumption was made that the solids make-up remained fairly uniform. This was not a critical assumption because the specific gravities of the various solids were similar. At the completion of a test run, the settled material on the tank floor was profiled by recording the liquid depth above the settled layer. The topographies of the settled material are presented in Sections 3 and 4. Figure 2.6 is a schematic of the relative position of the ADMP mockup (centered in the tank) and the retrieval pump, which was located at a radius of 95 inches and the 60o azimuthal position. The zero-degree reference was on the south end of the test tank, and the azimuthal angle increased in the clockwise direction. Angle references during testing were taken from 0o to 359o and from –180o to 180o. Figure 2.6 contains x and y axes that are labeled “percent of tank radius” and range from -100 to +100. The software used to plot the topographical data of the settled sludge used Cartesian coordinates. The origin was at tank center and radial values were nondimensionalized with respect to the test tank radius. This same coordinate system appears on all the topography plots presented in Sections 3 and 4.

2.13
100
0
0
-100
-100 100
95 in
Percent of Tank Radius
100% = 9.4 ft (112.5 in)
ADMP MockupPositioned atTank Center
RetrievalPump
270º (-90º)
315º (-45º)
330º (-30º)
0º
30º
60º
90º
180º
= Location of Zeolite addition for Kaolin Clay Retrieval Test
Direction of Nozzle Discharge
Reference for ADMPAzimuthal Position
Figure 2.6. Plan View of Test Tank Setup Showing Location of Transfer Pump Relative to ADMP Mockup. Relative azimuthal/angular positions in test tank are displayed. The transfer pump was on a 95-inch radius and a 60o angle. The percent of tank radius is used to present topography plots of settled material in Sections 3 and 4.

3.1
3.0 Zeolite Simulant Testing This section presents the test description, test results, and recommendations associated with work conducted using the original zeolite simulant developed to represent the waste predictions from the Tank 18F Operations Plan (refer to Table 2.1, column 2). Results obtained from testing conducted with the kaolin clay simulant are presented in Section 4. Section 3.1 provides a brief description of the testing that was done with the zeolite simulant. The results of the zeolite simulant tests are summarized in Section 3.2, and recommendations are presented in Section 3.3
3.1 Test Description The tests with the zeolite simulant evaluated the following:
• The minimum and maximum distance of the eroded footprint on the tank floor for the stationary ADMP jet at various run times, nozzle elevations, and nozzle discharge velocities.
• The ECR for the oscillating ADMP at various run times, angular rotation rates, and nozzle discharge velocities.
• Optimum locations for accumulating solids to maximize solids concentration in retrieval line flow.
• Operating scenarios for mobilizing and transporting solids from half of tank opposite retrieval pump to the vicinity of the retrieval pump.
• Operating scenarios for accumulating solids in optimum locations for solids retrieval. The testing was conducted using a bulk density of approximately 1021 kg/m3, which results in solids mass and volume fractions of 4.7% and 2.4%, respectively. Because resources were limited, not all of the test results are presented in this report. Section 3.2 contains those test results used to formulate the recommendations presented in Section 3.3.
3.2 Test Results Testing with the zeolite simulant demonstrated that the cleared radius for a stationary jet with a 6-inch nozzle centerline height (h/d = 4.1) reaches the tank wall at full-scale velocity (Uo=18 m/s). Table 3.1 presents the cleared radius data. Testing at various jet velocities between 0.5 and 0.7 Uo (nozzle exit velocity) showed an increase (10 to 20%) in the cleared radius as a function of nozzle centerline height. Higher nozzle centerline heights resulted in an

3.2
increase not only in the cleared radius but also in unmobilized material near the pump because the jet attachment is farther downstream. For a rotating ADMP, the ECR was reduced with increasing rotational speed. This is due to a significant reduction in the amount of time available to erode/mobilize the material at a given azimuth position. The testing performed did not evaluate steady-state conditions. (Table 3.2 contains the ECR data.) These results are relative to specific times or time increments, which can be scaled. The ADMP oscillation varied between rotational rates of 1.27 and 4.2 rpm, which correspond to full-scale speeds of 0.28 and 0.93 rpm. Continuous oscillation reduced the cleared radius/ECR from that of a fixed jet by ~40% for equal time increments (steady-state conditions not achieved) and resulted in a ring of solids (donut-shaped) around the circumference of the tank. Continuous rotation (as opposed to oscillation) was not tested due to equipment limitations.
Table 3.1. Conditions and Results for Stationary Mixer Erosion Tests
Cumulative Run Time
(min)
Fraction of Full-Scale
Nozzle Velocity (%)
Dimensionless Nozzle Height
(h/d)
Dimensionless Maximum Radius of Cleared Area
(rmax/d)
Dimensionless Minimum Radius of Cleared Area
(rmin/d) 9 59 4.1 76.5 0
13 45 4.1 43.9 0 13 44 4.1 41.3 0 13 59 4.1 53.8 0 13 60 5.1 54.5 9.8 13 47 5.1 51.9 18.9 13 60 6.1 57.2 14.0 13 47 6.1 33.0 21.6 53 40 4.1 53.0 0 53 45 4.1 53.0 0 53 60 4.1 84.8 0 53 60 5.1 77.3 9.8 53 47 5.1 61.4 12.9 53 60 6.1 84.8(a) 14.0 53 47 6.1 52.7 17.4 85 47 4.1 57.1 0 85 60 4.1 84.8(a) 0 6 102 4.1 84.8(a) 0
(a) Jets cleared solids from the floor out to the tank wall; 84.8 is the maximum possible value for the dimensionless radius.

3.3
Table 3.2. ECRs Obtained for Continuous Oscillation (180o sweep) of ADMP and Comparison of wt% Solids Passing Through the Retrieval Pump and ADMP
Scaled ADMP Flow
Scaled RetrievalPump Flow Cumulative
Run Time (min)
Fraction of Full-Scale
Nozzle Velocity
(%)
Dimensionless Nozzle Height
(h/d)
Dimensionless ECR
(ECR/d)
Dimensionless ADMP
Rotational Speed ωhD2
Ud 2
wt % solids
vol% solids
wt% solids
vol% solids
20 100 4.1 48.5 15.0 2.23 1.13 2.29 1.16 20 58 4.1 39.4 25.9 2.08 1.05 1.23 0.62 20 103 4.1 39.4 48.0 2.33 1.18 1.53 0.77 44 100 4.1 57.6 15.0 2.29 1.16 -- -- 46 60 4.1 39.4 24.9 2.10 1.06 1.21 0.61 46 104 4.1 48.5 47.7 2.16 1.09 1.41 0.71
As was observed during both the Phase D Flygt mixer tests and the two mixer operational tests, the transfer pump was again a limiting factor in retrieving solids. The large particulate has a high settling velocity and does not remain suspended for long periods of time. Transporting the solids to the vicinity of the transfer pump is not enough to result in particle entrainment into the pump. To achieve particle entrainment, the solids must be fed directly into the retrieval pump inlet. Even a particle directed toward the entrance of the retrieval pump might not be entrained. The momentum imparted to the particles by the flow of the ADMP is too large for the inlet flow of the retrieval pump to overcome. The effect of the retrieval pump is observed upon review of the wt% solids data contained in Table 3.2 for both the ADMP and retrieval pump flows. The ADMP, with its suction in the tank center, transfers the bulk of the solids to the outer radii of the tank and yet it contains a solids concentration that is approximately twice that of the retrieval pump. Discrete positioning testing demonstrated that all of the solids within the tank could be mobilized and transported to the vicinity of the retrieval pump. Figures 3.1 through 3.6 show a sequence of accumulated solid topographies achieved by performing the recommended operating scenario (refer to Section 3.3). Table 3.3 provides the entire test sequence and indicates where each figure occurs within the test sequence. The initial condition was an even layer of solids; the nozzle discharge velocity was 18 m/s.

3.4
Figure 3.1. Solids Topography after 10o of Discrete Positioning
and Cumulative Run Time of 11 min.

3.5
Figure 3.2. Solids Topography after a Total of 90o of Discrete Positioning in 10o Increments with the ADMP Run for 5 min. at each Position

3.6
Figure 3.3. Solids Topography after a Total of 180o of Discrete Positioning in 10o Increments with the ADMP Run for 5 min. at each Position
3.7
Figure 3.4. Solids Topography after ADMP Stopped at 180o, Returned to Original Orientation, and Operated for 5 min.

3.8
Figure 3.5. Solids Topography During Second Sweep of ADMP after 30o of Discrete Positioning in 5o Increments with ADMP run 5 min. at each Position

3.9
Figure 3.6. Solids Topography During Second Sweep of ADMP after 70o of Discrete Positioning in 5o Increments with ADMP Run 5 min. at each Position

3.10
Table 3.3. Test Sequence Conducted to Obtain Topographies Shown in Figures 3.1 Through 3.6
Test No. Cumulative
ADMP Run Time (min)
ADMP Run Time at Fixed Position
(min)
ADMP Orientation
(deg)
Figure Depicting Ending Solids Topography
011114R1 5 5 120 NA 011114R1 11 6 110 Figure 3.1 011114R2 17 6 100 NA 011114R2 22 5 90 NA 011114R2 27 5 80 NA 011114R2 33 6 70 NA 011114R2 38 5 60 NA 011114R2 43 5 50 NA 011114R2 48 5 40 NA 011114R2 53 5 30 Figure 3.2 011114R3 59 6 20 NA 011114R3 64 5 10 NA 011114R3 69 5 0 NA 011114R3 74 5 -10 NA 011114R3 79 5 -20 NA 011114R3 84 5 -30 NA 011114R3 89 5 -40 NA 011114R3 94 5 -50 NA 011114R3 99 5 -60 Figure 3.3 011115R1 104 5 120 Figure 3.4 011115R2 109 5 120 NA 011115R3 114 5 115 NA 011115R3 118 4 110 NA 011115R3 124 6 105 NA 011115R3 129 5 100 NA 011115R3 134 5 95 NA 011115R3 139 5 90 Figure 3.6 011115R4 144 5 85 NA 011115R4 149 5 80 NA 011115R4 154 5 75 NA 011115R4 159 5 70 NA 011115R4 164 5 65 NA 011115R4 169 5 60 NA 011115R4 174 5 55 NA 011115R4 179 5 50 Figure 3.6

3.11
During the time that elapsed between Figures 3.4 and 3.5, the mound of solids was swept directly around the transfer pump. In Figures 3.1 through 3.6, the retrieval pump is depicted by the black circle, which is labeled as “pump.” The retrieval pump is in the same location as indicated in Figure 2.6. The x and y axes on each plot indicate percent of total radius.
3.3 Recommendations from Zeolite Simulant Testing Testing with the scaled ADMP indicated that it was sufficient to mobilize the material in all regions of the tank in a relatively short period of time (compared with the duration of a pump-down cycle) and that all of the solids could be transported to the vicinity of the retrieval pump. Testing with the zeolite simulant indicated that the current Tank 18F retrieval system (ADMP and retrieval pump) will not be effective in efficiently removing fast-settling (>1 cm/s) solids from Tank 18F. The flow of fast-settling particulate into the transfer pump is constrained because of the relatively low velocity through the pump screen, the low flow rate of the pump relative to the flow of the mixer pump nozzles, and the restrictive geometry of the inlet screen. The inlet screen on the full-scale transfer pump is similar to those found on dewatering pumps, which are intended to reduce or inhibit solids transport. The geometry of the Bibo inlet by itself is a major factor in the reduction of retrieved waste. Waste Removal Engineering (WRE) should strongly consider making changes to the inlet geometry of the Tank 18F transfer pump to improve waste retrieval efficiency if a large majority of the waste is determined to consist of fast-settling solids. Improving the geometry of the retrieval pump along with increasing both the inlet velocity and flow rate may result in a solids retrieval rate sufficient to meet project requirements. The original schematics provided by SRS, which were used to fabricate the ADMP mockup lower unit, showed the full-scale ADMP nozzles discharging in a counter-clockwise direction when viewed from above. However, the nozzles actually discharge in a clockwise direction when viewed from above (refer to Figures 2.2 and 2.3). Upon review, the dimensions of the original schematics were found to be correct; only the nozzle discharge direction was in error. Because of schedule constraints, the reversed nozzle configuration of the mocked-up ADMP was used for the test program. The only consequence of using this reverse configuration was that the final recommendations for full-scale operation were reversed in rotation from those achieved during the test program. The solids topographies presented in Sections 3 and 4 thus are mirror images of those predicted for full-scale performance. Based on tests to quantify the cleared radius as a function of h/d, a full-scale nozzle centerline height of 23 inches (suction screen 6 inches above tank bottom) is recommended for the ADMP in Tank 18F. This height ensures the ECR will reach the tank wall for a fixed position jet and will maximize material mobilization near the ADMP. The 23-inch height is recommended assuming the waste has physical characteristics similar to the Tank-19F (zeolite) simulant.

3.12
Testing with the zeolite simulant indicated that solid particles from all regions of the tank floor could be transported to the vicinity of the transfer pump. The recommended operating scenario for full-scale operations consists of discretely positioning the mixer pump in 5o increments for 50- to 60-minute intervals. The incremental positioning of the mixer pump is performed in the clockwise direction starting at the 270o orientation.
The optimized locations of the sweep angle end points have not been determined. Recommendations are for the end points to be at 270o and 90o, + 20o. The operating sequence allows material to be transported from the side of the tank opposite the transfer pump without the end points of the sweep angle having to be readjusted. After rotating the mixer pump to its limit in the clockwise direction, the flow is stopped and the ADMP rotated back to its counter-clockwise limit. Flow is resumed and the process repeated.
Solids transfer is greatest with mixer orientations from 330o to 30o. No testing was conducted to evaluate whether oscillating the ADMP through a narrower sweep angle might be effective in sustaining the peak transport rates after material has been consolidated between 0o and 30o.
The recommended operating scenario resulted in short durations at solids concentrations of 5 to 7 wt% within the retrieval line. Scheduling did not allow for additional testing to be conducted in an attempt to prolong the duration of the peak solids transport. The recommended scenario was the only one that yielded solids loadings through the transfer pump that were greater than those measured in the ADMP flow.

4.1
4.0 Pump-Down Tests with Kaolin Clay
After providing a revision for the estimate of the Tank 18F waste makeup (refer to Table 2.1 column 3), SRS personnel requested that simulated pump-down tests not be performed with the original zeolite-based stimulant (Flygt Phase D - Tank 19F simulant) used for the tests described in Section 3. Instead, the pump-down tests were to be conducted using a mixture of 49.1 wt% kaolin clay and 50.9 wt% water to create the settled sludge layer. Additional water was introduced on the top of this mixture to raise the total liquid elevation to 17.2 inches
This simulant was chosen for several reasons: 1) kaolin clay was in the Tank 19F simulant
used for the tests presented in Section 3; 2) kaolin clay is well suited to manual mixing in large quantities; 3) kaolin clay was readily available; and 4) the erosion characteristics of kaolin clay are well documented (Powell et al.1997). The simulant was intended to represent the revised waste prediction for Tank 18F that is presented in Table 2.1. The revised waste estimate included 2000 gal of zeolite. The entire scaled inventory of zeolite material was to be added on top of the kaolin clay mixture at the west riser (270o orientation in the 1/4-scale tank). The assumption was that the zeolite material had been introduced to Tank 18F from the Tank 19F transfers. The discharge for the transfer line had been below the west riser, and Tank 18F had not undergone any mixing since the transfer.
The kaolin clay mixture was prepared in the 1/4-scale tank by adding 2933 lb of dry kaolin
followed by 3051 lb of process water. The material was mixed using hand tools and spread over the entire tank floor in an even layer that measured 2.7 to 3 inches thick. The initial mixture was calculated to have a specific gravity (S.G.) of 1.43. Based on previous work with kaolin clay (Powell et al. 1997), the shear strength of the mixture was estimated at 100 Pa. Funding and time constraints did not allow for detailed characterization of the mixture.
There is evidence to indicate that the ECR for kaolin/water sludges is relatively independent of bulk shear strength. The value of ECR/U0D from PNNL testing at 1/25 scale of a Hanford tank was approximately 0.06 s/cm for shear strengths ranging from 100 to 3000 Pa. Using UoD for the scaled ADMP test setup, the calculated ECR would be 11.8 ft. Based on these results, because the quarter-scale tank is 18.7 ft in diameter (9.35 ft radius) the ADMP should be able to achieve an ECR exceeding the tank radius. Prior testing has shown that stiffer kaolin sludge recipes require longer periods of time to reach the maximum ECR. Furthermore, the ECR for a 100-Pa kaolin sludge is lower than that for other sludge simulants of equal yield strength, such as kaolin/bentonite simulants.
It is unknown how well a kaolin clay/water mixture alone represents the Tank 18F sludge. Previous simulants modeling SRS Tank 19F waste have used kaolin clay to represent an interstitial sludge dispersed within a mixture of zeolite and precipitated salt crystals. The Tank 18F sludge is expected to consist mostly of metal hydroxides. It is unknown how cohesive the sludge material is or what effect the dissolved salt has on the cohesive strength or settling

4.2
behavior of the sludge. The effects on the sludge or the degree of consolidation resulting from time, depth of solids, and hydrostatic head applied by the supernatant liquid are unknown.
The shear strength of the Tank 18F sludge was reported by SRS to be 27 Pa based on a 1984 measurement. The reference for this measurement is unknown. Based on the sensitivity of shear strength to disruption for other tank sludges, it is assumed that the measured shear strength is low compared with the in situ sludge. Current tank sampling methods result in the sample being disturbed or agitated prior to characterization.
The kaolin clay is expected to perform as a reasonable simulant with respect to the mixing
and transport properties of the Tank 18F sludge. Water was used as the supernatant liquid; therefore, the reduced viscosity and density of the water are conservative with respect to transport and settling. The major concern associated with using kaolin clay as a simulant for a pure sludge is in the mobilization behavior of the simulant versus the sludge in Tank 18F. The relative cohesive and mechanical strengths of the Tank 18F sludge as well as its erosive characteristics are unknown.
4.1 Test Description
One transfer scenario consisting of four pump-down cycles was carried out in the 1/4-scale DST. The operation of the ADMP was not the same for all four cycles. For all periods of ADMP oscillation, the oscillation rate was approximately 1.2 rpm, which corresponds to a full-scale angular rotation rate of 0.28 rpm; the sweep angle was 180o; and the end points of the sweep angle were –60o (300o) and 1200
(refer to Figure 2.6). A description of the ADMP operation is provided for each cycle in Tables 4.1 through 4.4. The times provided are relative to the initiation of the test (time 0).
SRS requested that the discharge velocity match that of the full-scale ADMP, 18 m/s. Based
on the scaling presented in Section 2.1, matching the velocities results in time scaling as the inverse of the geometric scale. Therefore, the relationship between test time and full-scale time is assumed to be 1:4.53. The duration of one minute during the scaled tests represents 4:32 minutes at full scale.
Table 4.1. Cycle 1 (11/20/01) Test Description
Test time (min.)
Recycle Mode
Transfer Mode Description of ADMP Operation
5 X Flow through the ADMP is initiated. The mixer pump is oscillating.
27 X The retrieval pump is switched from recycle to transfer mode. The ADMP is still oscillating.
139 X The ADMP is shut down due to liquid level in the tank. 210 X The retrieval pump is shut down due to loss of suction.
(a) Total test mixing time with jets oscillating: 134 minutes (2.23 hr).

4.3
Table 4.2. Cycle 2 (11/24/01) Test Description
Test time(a) (min.) Recycle Mode Transfer
Mode Description of ADMP Operation
7 X Flow through the ADMP is initiated. The mixer pump is stationary and oriented at 120o.
70 X The ADMP is rotated to 115o 75 X The ADMP is rotated to 109o 80 X The ADMP is rotated to 98o 85 X The ADMP is rotated to 92o 90 X The ADMP is rotated to 88o 100 X The ADMP is rotated to 84o 110 X The ADMP is rotated to 79o 120 X The ADMP is rotated to 74o 130 X The ADMP is rotated to 69o 140 X The ADMP is rotated to 65o 150 X The ADMP is rotated to 61o 160 X The ADMP is rotated to 55o 170 X The ADMP is rotated to 50o
181 X The ADMP starts oscillating through 180o sweep from –60o to 120o at 1.27 rev/min.
221 X The ADMP is rotated to 43o and held stationary 231 X The ADMP is rotated to 35o 241 X The ADMP is rotated to 29o 251 X The ADMP starts oscillating through 180o sweep from
–60o to 120o at 1.27 rev/min.
261 X The retrieval pump is switched from recycle to transfer mode. The ADMP is still oscillating.
363 X The ADMP is shut down due to liquid level in the tank 455 X The transfer pump is shut down due to loss of suction
(a) Total test mixing time with jets oscillating: 152 minutes (2.53 hr). Total test mixing time with discrete positioning jets: 204 minutes (3.4 hr).
The initial liquid level of 17.2 inches corresponded to a full-scale depth of 78 inches At a
liquid depth of 8.8 inches, corresponding to 40 inches at full-scale, flow through the ADMP was terminated. The retrieval pump was run until suction was lost, which occurred at a liquid depth on the order of 0.6 to 1 inch in the test tank. The residual clay and the draining of system lines back into the test tank made accurate measurement of the liquid level difficult.
The retrieval pump used in the tests was capable of operating in both a recycle mode and a transfer mode. The recycle mode allowed the solids concentration at the inlet of the retrieval pump to be monitored while the tank contents remained constant. The discharge of the transfer line was returned to the outer diameter of the tank at three separate locations. In transfer mode, the waste stream was transferred from the 1/4-scale DST. The retrieval pump was operating in the recycle mode prior to the initiation of each test run (cycle).

4.4
Table 4.3. Cycle 3 (11/26/01) Test Description
Test time(a) (min.) Recycle Mode Transfer
Mode Description of ADMP Operation
3 X Flow through the ADMP is initiated. The mixer pump is stationary and oriented at 45o.
72 X The ADMP is rotated to 38o. 84 X The ADMP is rotated to 30o 94 X The ADMP is rotated to 23o
103 X The ADMP is rotated to 20o 113 X The ADMP is rotated to 14o 123 X The ADMP is rotated to 7o 133 X The ADMP is rotated to 5o
143 X The ADMP starts oscillating through 180o sweep from –60o to 120o at 1.27 rev/min.
170 X The retrieval pump is switched from recycle to transfer mode. The ADMP is still oscillating.
275 X The ADMP is shut down due to liquid level in the tank.358 X The transfer pump is shut down due to loss of suction.
(a) Total test mixing time with jets oscillating: 132 minutes (2.20 hr). Total test mixing time with discrete positioning jets: 140 minutes (2.33 hr).
Table 4.4. Cycle 4 (12/4 - 11/01) Test Description
Test time(a) (min.) Recycle Mode Transfer
Mode Description of ADMP Operation
3 X Flow through the ADMP is initiated. The mixer pump is oscillating.
483 X Flow through the ADMP is stopped and sludge topography measurements made. Test time suspended until ADMP flow is restarted with ADMP oscillating.
963 X Flow through the ADMP is stopped and sludge topography measurements made. Test time suspended until ADMP flow is restarted with ADMP oscillating.
1463 X Flow through the ADMP is stopped and sludge topography measurements made. Test time suspended until ADMP flow is restarted with ADMP oscillating.
1513 X The retrieval pump is switched from recycle to transfer mode. The ADMP is still oscillating.
1610 X The ADMP is shut down due to liquid level in the tank.1694 X The transfer pump is shut down due to loss of suction.
(a) Total test mixing time with jets oscillating: 1607 minutes (26.78 hr). Total test mixing time with discrete positioning jets: 0 minutes (0 hr).

4.5
4.2 Test Results The original schematics provided by SRS, which were used to fabricate the ADMP mockup lower unit, showed the full-scale ADMP nozzles discharging in a counter-clockwise direction when viewed from above. However, the nozzles actually discharge in a clockwise direction when viewed from above (refer to Figures 2.2 and 2.3). Upon review, the dimensions of the original schematics were found to be correct; only the nozzle discharge direction was in error. Because of schedule constraints, the reversed nozzle configuration of the mocked-up ADMP was used for the test program. The only consequence of using this reversed configuration was that the final recommendations for full-scale operation were reversed in rotation from those achieved during the test program. The test results presented in Sections 3 and 4 thus are mirror images of those predicted for full-scale performance.
Following the Cycle 1 pump-down, the test tank was left drained with the tops of the residual mounds of sludge exposed to air. Several samples of the sludge were taken from the test tank at various locations. All of the samples were taken from the sides of the sludge mounds by first removing and discarding approximately 1 inch of surface sludge to avoid the fines that settle during the period that the ADMP is shut down. This top material does appear to settle/pack as densely as the initial settled material. The densities of the samples were measured and yielded an average value of 1.48 ± 0.05 g/mL. The measured density corresponds to a 52.5 wt% kaolin mixture compared with 49 wt% for a calculated 1.43 S.G. The higher values could be due to uncertainties in measurements of initial material quantities and densities, drying of the material; incomplete mixing of the initial material, leaving residual water; nonuniform mixing, with the weaker material being mobilized earlier; consolidation of the material; or some combination of factors.
Tables 4.5 and 4.6 present the overall results of the four pump-down cycles assuming sludge densities of 1.48 and 1.43, respectively. Using the two densities provides bounding results. The results presented in Table 4.5 for Cycle 4 clearly indicate that 1.48 is an upper-bound value because a residual amount of sludge was observed in the test tank following Cycle 4, although a negative value is presented in the table.
Table 4.5. Results of Waste Transfer Assuming a Sludge Density of 1.48 (52.5 wt% kaolin)
Cycle No.
Calculated mass of sludge
removed (kg)
Mass of sludge remaining at end of cycle
(kg)
Percent of original sludge inventory
transferred (%)
Percent of sludge existing at start of cycle transferred
(%)
Bulk wt% sludge @
start of cycle (wt%)
1 1672 861 66.0 66.0 22.0 2 569 292 22.5 66.1 8.0 3 258 34 10.2 88.5 2.7 4 202 -168.4(a) 8.0 600(a) 0.3
(a) Impossible values due to 1.48 S.G. being an upper bound value.

4.6
Table 4.6. Results of Waste Transfer Assuming a Sludge Density of 1.43 (49 wt% kaolin)
Cycle No.
Calculated mass of sludge
removed (kg)
Mass of sludge remaining at end of cycle
(kg)
Percent of original sludge inventory
transferred (%)
Percent of sludge that existed @ start of cycle transferred
(%)
Bulk wt% sludge @
start of cycle (wt%)
1 1561 1152 57.5 57.5 23.6 2 531 621 19.6 46.1 10.7 3 241 380 8.9 38.9 5.6 4 224 156 8.3 59.0 3.5
Based on the results of the pump-down tests, it appears that continued oscillation is the best way to maximize the suspended solids concentration that was deposited at the west riser. The zeolite simulant made up approximately 4 vol% of the total solids initially added to the test tank.
Based on the assumption of a sludge S.G. of 1.48 (see Table 4.5) the initial sludge mass was 2533 kg (5587 lb). Of the original mass, 1.3% remains after the three pump-down cycles. By comparison, a sludge S.G. of 1.43 (see Table 3.6) corresponds to the measured initial mass of 2713 kg (5984 lb) and 14% residual sludge following Cycle 3. The results are very sensitive to the density of the residual sludge. An estimate of the residual sludge volume was made by hand calculations using the topography data obtained after Cycle 3. The initial volume was approximately 67 ft3. The hand calculations estimated the residual sludge volume to be between 7.9 and 10.1 ft3, or 11.7 to 15.1% of the original volume. Assuming a density of 1.43, these volumes would correspond to a sludge mass between 320 and 409 kg, which is consistent with the value from Table 4.6.
Throughout the testing conducted with kaolin clay, the S.G. of both the mixer pump and transfer pump flows remained essentially identical. Along with the waste topography observed in the vicinity of the transfer pump, it appears the transfer pump flow rate, inlet geometry, and inlet velocity provided no restriction to the entrainment of the suspended kaolin. Figures 4.1 through 4.5 show the solids concentration in the retrieval line in terms of weight percent as a function of time for Cycle 1 (All011120.Kal). Figures 4.6 through 4.13 contain the solids concentration as a function of time for Cycle 2 (All011124.Kal). Figures 4.14 through 4.18 contain the solids concentration as a function of time for Cycle 3 (All011126.Kal). After each pump-down cycle, the topography of the residual solids was mapped. Table 4.7 provides the ECR values obtained during pump-down cycles 1 through 4. Figures 4.19 and 4.20 contain plots of the residual solids topography within the test tank after Cycles 1 and 2, respectively. Photos of the residual solids in the test tank after Cycles 1 and 2 are presented in Figures 4.21 and 4.22, respectively. The mounds of sludge observed in the figures coincide with the location of the transfer pump and the initial mound of zeolite placed at the west riser (270o position in the test tank). Because of the configuration of the ADMP nozzles, which have a solid boundary on one side of each jet, the discharging jets bend to create a counter-clockwise flow

4.7
0
5
10
15
20
25
30
-100
-50
0
50
100
150
0 10 20 30 40 50 60
NewAll011120.Kal
wt% Solids Transfer Pump Mixer Orientation
wt%
Sol
ids T
rans
fer P
ump
Mixer O
rientation
Test Time (min) Figure 4.1. Weight Percent Solids Through the Transfer Pump and Mixer
Pump Orientation During First Hour of Cycle 1 Transfer
0
5
10
15
20
25
30
-100
-50
0
50
100
150
60 70 80 90 100 110 120
NewAll011120.Kal
wt% Solids Transfer Pump Mixer Orientation
wt%
Sol
ids T
rans
fer P
ump
Mixer O
rientation
Test Time (min) Figure 4.2. Weight Percent Solids Through the Transfer Pump and Mixer
Pump Orientation During Second Hour of Cycle 1 Transfer
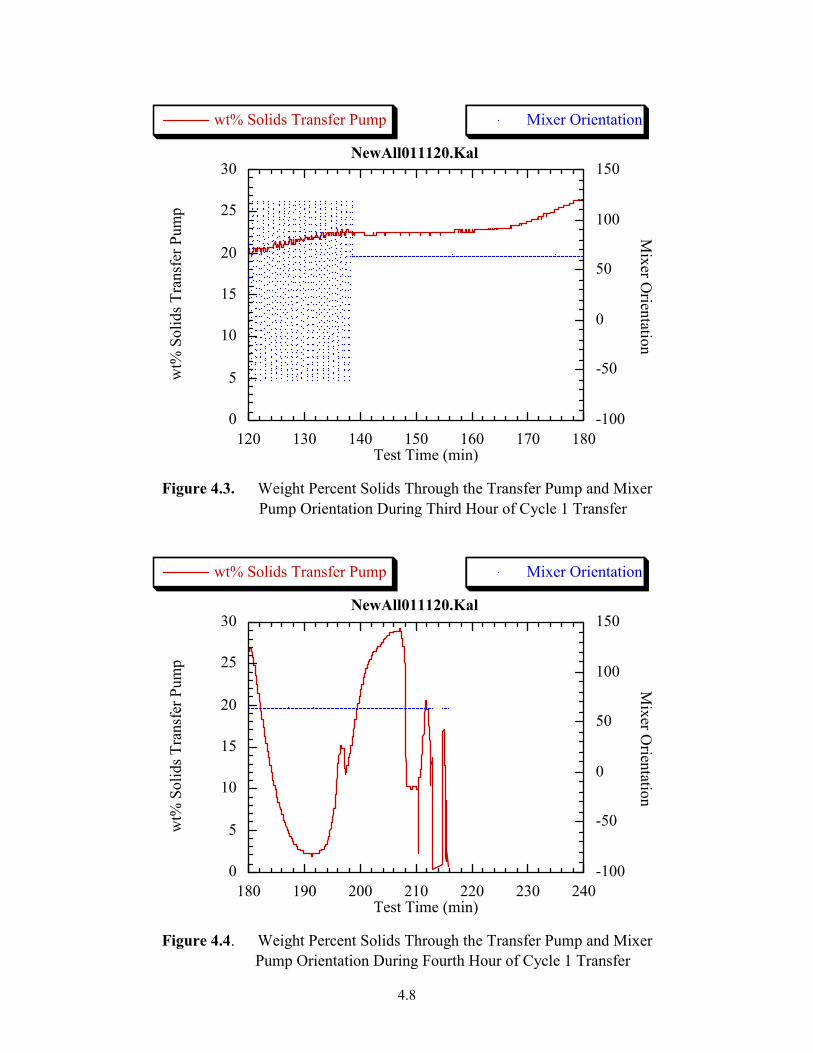
4.8
0
5
10
15
20
25
30
-100
-50
0
50
100
150
120 130 140 150 160 170 180
NewAll011120.Kal
wt% Solids Transfer Pump Mixer Orientation
wt%
Sol
ids T
rans
fer P
ump
Mixer O
rientation
Test Time (min) Figure 4.3. Weight Percent Solids Through the Transfer Pump and Mixer
Pump Orientation During Third Hour of Cycle 1 Transfer
0
5
10
15
20
25
30
-100
-50
0
50
100
150
180 190 200 210 220 230 240
NewAll011120.Kal
wt% Solids Transfer Pump Mixer Orientation
wt%
Sol
ids T
rans
fer P
ump
Mixer O
rientation
Test Time (min) Figure 4.4. Weight Percent Solids Through the Transfer Pump and Mixer
Pump Orientation During Fourth Hour of Cycle 1 Transfer

4.9
0
2
4
6
8
10
12
14
-100
-50
0
50
100
150
0 10 20 30 40 50 60
NewAll011124.data
wt% Solids Transfer Pump Mixer Orientation
wt%
Sol
ids T
rans
fer P
ump
Mixer O
rientation
Test Time (min) Figure 4.5. Weight Percent Solids Through the Transfer Pump and Mixer
Pump Orientation During First Hour of Cycle 2 Transfer
0
2
4
6
8
10
12
14
-100
-50
0
50
100
150
60 70 80 90 100 110 120
NewAll011124.data
wt% Solids Transfer Pump Mixer Orientation
wt%
Sol
ids T
rans
fer P
ump
Mixer O
rientation
Test Time (min) Figure 4.6. Weight Percent Solids Through the Transfer Pump and Mixer
Pump Orientation During Second Hour of Cycle 2 Transfer

4.10
0
2
4
6
8
10
12
14
-100
-50
0
50
100
150
120 130 140 150 160 170 180
NewAll011124.data
wt% Solids Transfer Pump Mixer Orientation
wt%
Sol
ids T
rans
fer P
ump
Mixer O
rientation
Test Time (min) Figure 4.7. Weight Percent Solids Through the Transfer Pump and Mixer
Pump Orientation During Third Hour of Cycle 2 Transfer
0
2
4
6
8
10
12
14
-100
-50
0
50
100
150
180 190 200 210 220 230 240
NewAll011124.data
wt% Solids Transfer Pump Mixer Orientation
wt%
Sol
ids T
rans
fer P
ump
Mixer O
rientation
Test Time (min) Figure 4.8. Weight Percent Solids Through the Transfer Pump and Mixer
Pump Orientation During Fourth Hour of Cycle 2 Transfer

4.11
0
2
4
6
8
10
12
14
-100
-50
0
50
100
150
240 250 260 270 280 290 300
NewAll011124.data
wt% Solids Transfer Pump Mixer Orientation
wt%
Sol
ids T
rans
fer P
ump
Mixer O
rientation
Test Time (min) Figure 4.9. Weight Percent Solids Through the Transfer Pump and Mixer
Pump Orientation During Fifth Hour of Cycle 2 Transfer
0
2
4
6
8
10
12
14
-100
-50
0
50
100
150
300 310 320 330 340 350 360
NewAll011124.data
wt% Solids Transfer Pump Mixer Orientation
wt%
Sol
ids T
rans
fer P
ump
Mixer O
rientation
Test Time (min) Figure 4.10. Weight Percent Solids Through the Transfer Pump and Mixer
Pump Orientation During Sixth Hour of Cycle 2 Transfer

4.12
0
2
4
6
8
10
12
14
-100
-50
0
50
100
150
360 370 380 390 400 410 420
NewAll011124.data
wt% Solids Transfer Pump Mixer Orientation
wt%
Sol
ids T
rans
fer P
ump
Mixer O
rientation
Test Time (min) Figure 4.11. Weight Percent Solids Through the Transfer Pump and Mixer
Pump Orientation During Seventh Hour of Cycle 2 Transfer
0
2
4
6
8
10
12
14
-100
-50
0
50
100
150
420 430 440 450 460 470 480
NewAll011124.data
wt% Solids Transfer Pump Mixer Orientation
wt%
Sol
ids T
rans
fer P
ump
Mixer O
rientation
Test Time (min) Figure 4.12. Weight Percent Solids Through the Transfer Pump and Mixer
Pump Orientation During Eighth Hour of Cycle 2 Transfer

4.13
0
1
2
3
4
5
6
-100
-50
0
50
100
150
0 10 20 30 40 50 60
NewAll011126.dat
wt% Solids Transfer Pump Mixer Orientation
wt%
Sol
ids T
rans
fer P
ump
Mixer O
rientation
Test Time (min) Figure 4.13. Weight Percent Solids Through the Transfer Pump and Mixer
Pump Orientation During First Hour of Cycle 3 Transfer
0
1
2
3
4
5
6
-100
-50
0
50
100
150
60 70 80 90 100 110 120
NewAll011126.dat
wt% Solids Transfer Pump Mixer Orientation
wt%
Sol
ids T
rans
fer P
ump
Mixer O
rientation
Test Time (min) Figure 4.14. Weight Percent Solids Through the Transfer Pump and Mixer
Pump Orientation During Second Hour of Cycle 3 Transfer

4.14
0
1
2
3
4
5
6
-100
-50
0
50
100
150
120 130 140 150 160 170 180
NewAll011126.dat
wt% Solids Transfer Pump Mixer Orientation
wt%
Sol
ids T
rans
fer P
ump
Mixer O
rientation
Test Time (min) Figure 4.15. Weight Percent Solids Through the Transfer Pump and Mixer
Pump Orientation During Third Hour of Cycle 3 Transfer
0
1
2
3
4
5
6
-100
-50
0
50
100
150
180 190 200 210 220 230 240
NewAll011126.dat
wt% Solids Transfer Pump Mixer Orientation
wt%
Sol
ids T
rans
fer P
ump
Mixer O
rientation
Test Time (min) Figure 4.16. Weight Percent Solids Through the Transfer Pump and Mixer
Pump Orientation During Fourth Hour of Cycle 3 Transfer

4.15
0
1
2
3
4
5
6
-100
-50
0
50
100
150
240 250 260 270 280 290 300
NewAll011126.dat
wt% Solids Transfer Pump Mixer Orientation
wt%
Sol
ids T
rans
fer P
ump
Mixer O
rientation
Test Time (min) Figure 4.17. Weight Percent Solids Through the Transfer Pump and Mixer
Pump Orientation During Fifth Hour of Cycle 3 Transfer
0
1
2
3
4
5
6
-100
-50
0
50
100
150
300 310 320 330 340 350 360
NewAll011126.dat
wt% Solids Transfer Pump Mixer Orientation
wt%
Sol
ids T
rans
fer P
ump
Mixer O
rientation
Test Time (min) Figure 4.18. Weight Percent Solids Through the Transfer Pump and Mixer
Pump Orientation During Sixth Hour of Cycle 3 Transfer

Table 4.7. ECR Values Obtained During ADMP Pump-Down Tests Performed with Kaolin Clay
Cumulative Oscillation Time/Total Run Time
(hr) (cycle no.)
Azimuthal Position within tank North is 0o, angle increases with clockwise rotation, the transfer pump is located at 60o
ECR values in inches, tank radius = 112.5 inches Note: Not all points were measured after each cycle
Angle position + 3o, radial distance + 1 inch
0o 15o 30o 45o 60o 75o 90o 105o 120o 135o 150o 165o 180o 195o 210o 225o 240o 255o 270o 285o 300o 315o 330o 345o 2.23/2.23
(1) 68 - 64 67 96 69 68 - 77 - 64 - 55 57 64 63 57 60 68 - 84 - 82 73
4.76/9.81 (2)
67 72 72 70 112 74 75 88 112 73 68 64 62 65 66 65 74 68 75 112 112 84 87 72
6.96/15.8 (3)
66 69 76 41 112 71 75 61 112 75 70 68 66 69 76 69 81 65 62 112 112 84 84 72
15.0/23.8 (4)
84 84 78 87 112 86 83 112 112 80 73 74 70 79 80 79 80 85 86 86 112 112 82 85
23.0/31.8 (4)
87 84 82 86 112 85 88 112 112 85 81 76 72 80 81 80 86 83 87 88 112 112 112 85
31.3/40.2 (4)
87 80 82 88 112 86 87 112 112 88 79 76 73 80 81 81 83 86 85 112 112 112 88 85
33.8/42.6 (4)
84 84 82 87 112 88 87 112 112 87 80 75 73 80 81 81 85 85 112 112 112 112 90 85
4.3

4.17
Figure 4.19. Waste Topography of Kaolin Clay at the Completion of Cycle 1

4.18
Figure 4.20. Waste Topography of Kaolin Clay at the Completion of Cycle 2

4.19
Figure 4.21. Photograph of Solids Topography Following Cycle 1 Transfer.
Topography plot of Figure 4.19 taken at same time as photo.
Figure 4.22. Photograph of Solids Topography Following Cycle 2 Transfer.
Topography plot of Figure 4.20 taken at same time as photo.

4.20
within the test tank (clockwise in the full-scale tank). The annular mounds exist in the down-stream “shadow” of the transfer pump and the original mound of zeolite. However, results obtained during the previous zeolite tests presented in Section 3 indicate that the location of the mounds may be a product of the location of the 180o sweep angle end points. The mixer pump experiences a short delay during which it is stationary when changing rotational direction. Thus, the portions of the tank floor influenced by the jets during this delay experience a longer period of solids mobilization during each rotational cycle. Figure 4.23 contains the topography of the solids obtained at the completion of the Cycle 3 pump-down.
Figure 4.23. Waste Topography of Kaolin Clay at the Completion of Cycle 3

4.21
Cycle 4 was conducted with a long run time before starting transfer to evaluate the mobilization of the annular mound of sludge over time. The mixer pump was periodically stopped so that the solids topography could be measured. Figures 4.24 through 4.27 contain plots of the waste topography at different time durations of Cycle 4. Photos of the residual solids existing in the test tank after Cycles 3 and 4 are presented in Figures 4.28 and 4.29, respectively.
Figure 4.24. Waste Topography of Kaolin Clay after 8 hr of Run Time During Cycle 4

4.22
Figure 4.25. Waste Topography of Kaolin Clay after 16 hr of Run Time During Cycle 4

4.23
Figure 4.26. Waste Topography of Kaolin Clay after 24.4 hr of Run Time During Cycle 4

4.24
Figure 4.27. Waste Topography of Kaolin Clay after 26.8 hr of Run Time at Completion of Cycle 4
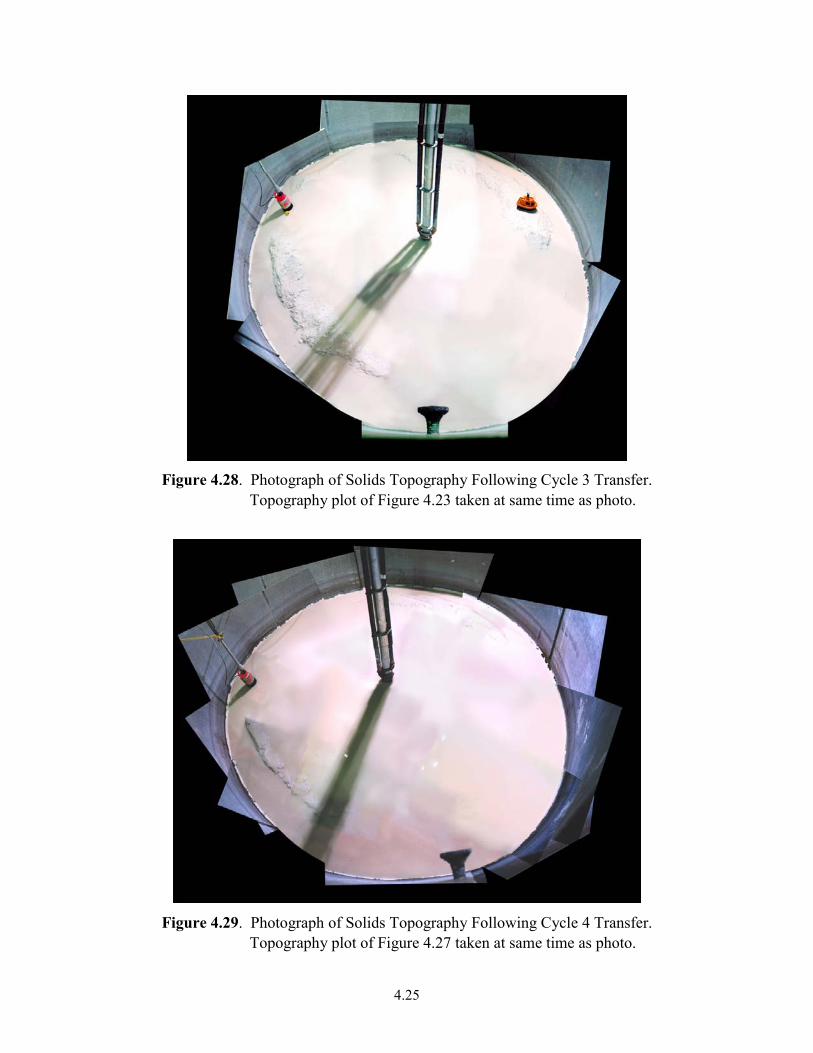
4.25
Figure 4.28. Photograph of Solids Topography Following Cycle 3 Transfer.
Topography plot of Figure 4.23 taken at same time as photo.
Figure 4.29. Photograph of Solids Topography Following Cycle 4 Transfer.
Topography plot of Figure 4.27 taken at same time as photo.

4.26
4.3 Recommendations from Kaolin Clay Tests The following recommendations are made assuming the waste characteristics are similar to those of the kaolin clay simulant.
• For Cycle 1 the ADMP should be operated in oscillation mode for at least 150 minutes (680 minutes at full scale) before the waste is transferred.
• Before oscillating the ADMP, consideration should be given to directing a mixer pump jet at the west riser to break up the zeolite pile. Current estimates are on the order of 20 to 24 hours at full scale.
• While results from kaolin clay tests indicate that it may be possible to mobilize the entire volume of sludge in one cycle, the tests did not evaluate the ADMP performance with all of the sludge suspended. The test setup controlled the flow rate through the mixer pump using a variable-speed, diesel-driven pump. No attempt was made to evaluate the change in performance of the ADMP resulting from increased slurry density and viscosity. Depending on the performance curve of the pump, it may be impractical to “premix” for an extended period before starting the first waste transfer. In other words, performing a waste transfer before completely mobilizing the tank contents and allowing the pump to work on the more challenging (based on location) material with a lower viscosity and density fluid may be more efficient.
• Based on the uncertainties associated with the waste properties, we recommend that a mass flow meter be installed in the transfer line to provide some form of process monitoring. An optimized system would provide a bypass line allowing the transfer pump to be run during the entire duration of ADMP operation. The added system complexity needs to be weighed against extended ADMP operations with unknown benefits or consequences of performing transfers with negligible solids loading.

5.1
5.0 Conclusions Conclusions for the zeolite and kaolin clay tests are provided separately in this section. The recommendations from the two sets of tests are provided in Sections 3.3 and 4.3.
5.1 Conclusions from Zeolite Tests The following conclusions were obtained from testing with the fast settling zeolite simulant. These conclusions are based on the assumption that the Tank 18F waste contains a large percentage of fast settling solids and mobilizes similar to the Tank 19F simulant.
• The current transfer/retrieval pump restricts/inhibits the entrainment/recovery of fast-settling (>1 cm/s) particulate. During the majority of tests conducted, the solids concentration passing through the ADMP was on the order of 2 to 4 times of that passing through the transfer pump. This is indicative of the degree to which the transfer pump restricts solids transport.
• More than four pump-down cycles will be required to completely remove the solid waste from Tank 18F using the planned system. The peak values for solids concentration obtained through the mixer pump were approximately 7 wt%.
• A nozzle centerline height of 23 inches for the ADMP provides the best mobilization of waste over the entire tank floor if the physical properties of the waste are similar to the test simulant.
• The ADMP mixer pump is capable of mobilizing waste at all locations within the tank and transporting the solids to the vicinity of the retrieval pump.
5.2 Conclusions from Kaolin Clay Tests
The following conclusions were obtained from the pump-down tests with kaolin clay. No testing was performed using kaolin clay in the ADMP mockup before initiating the pump-down tests. Therefore, no opportunity existed to optimize the retrieval process for the kaolin clay material. Based on the testing and analyses completed to date, the following conclusions apply for the revised waste predictions (refer to Table 2.1) assuming the Tank 18F sludge mobilization characteristics are similar to or less challenging than those of the kaolin clay simulant.
• The bulk of the waste can be retrieved from Tank 18F if the waste properties are similar to those of the kaolin clay simulant.
• The retrieval pump configuration and inlet velocity may be adequately suited for Tank 18F if only a small fraction of the material consists of fast-settling solids.

5.2
• The installation of a mass flow meter in the retrieval line discharge coupled with a recirculation capability can improve the efficiency of the transfer operation by maximizing the solids concentration in the flow stream transferred from Tank 18F.
• Significant differences exist between the two simulants and the recommended operating procedures for the two types of simulated waste tested.
• If the waste is similar to kaolin clay in mobilization and transport characteristics, the ADMP should be allowed to mobilize and mix the waste for a significant period of time before initiating waste transfer. While the recommended operating procedure for the kaolin clay used a continuously oscillating ADMP for a large portion of the retrieval process, the ADMP should be directed at the zeolite mound under the west riser for a significant period of time prior to mobilizing the rest of the tank.

6.1
6.0 References Ade F and N Rajaratnam. 1998. “Generalized study of erosion by circular horizontal turbulent jets.” Journal of Hydraulic Research, Vol. 36, pp. 613-635. Enderlin CW, G Terrones, B Hatchell, and B Adkins. 2002. “Scaled Testing to Determine Operational Strategies for Removal of Zeolite in Savannah River Site Tank 19F Using Shrouded Axial Impeller Mixers.” 15th International Conference on Hydrotransport, Vol. 1, pp. 187-201. Lilliston GR. 2001. Tank 18F Waste Removal Operating Plan. U-ESR-F-00014 Rev. 0, Westinghouse Savannah River Company, Aikin, SC. Powell MR, Y Onishi, and R Shekarriz. 1997. Research on Jet Mixing of Settled Sludges in Nuclear Waste Tanks at Hanford and Other DOE Sites: A Historical Perspective. PNNL-11686, Pacific Northwest National Laboratory, Richland, WA. http://www.tanks.org. Rajaratnam N. 1976. Turbulent Jets. Elesevier Scientific Publishing Co., New York.

Appendix
Schematics of ADMP Mockup

A.1
Appendix: Schematics of ADMP Mockup
AB
A = 1.00 = inner diameter of thrust bearingB = 2.00 = outer diameter of thrust bearing
Note: Anti-vortex support plates and suction top-plate not shown.Refer to Figure A.2.
NOTE: ALL DIMENSIONS IN INCHES

A.2
NOTE: ALL DIMENSIONS IN INCHES

PNNL-14443
Distr.1
Distribution No. of Copies Offsite K Gerdes DOE EM-54 19901 Germantown Road Germantown, MD 20874 9 Westinghouse Savannah River Site Aiken, SC 29808 Attn: MJ Augeri 704-70F NF Chapman 703-H NR Davis 703-H NS Elrayhab 704-71F M Hubbard 704-70F BA Martin 704-70F TC Robinson Jr. 241-108F DB Stefanco 678-8T SA Smith 742-4G B Adkins WSMS Mid-America 105 Mitchell Rd Suite 200 Aikin, SC 29808 G Terrones Applied Physics Division Los Alamos National Laboratory MS: P225 Los Alamos, NM 87545
No. of Copies On Site DOE Richland Operations Office JA Frey K8-50 Office of River Protection BM Mauss H6-60 CH2M Hill Hanford Group KA Gasper H6-03 14 Pacific Northwest National Laboratory CJ Bates K1-01 D Bell P7-08 SQ Bennett K7-90 WF Bonner K9-14 TM Brouns K9-69 CW Enderlin (4) K7-15 BK Hatchell K5-22 MW Rinker K5-22 MW White K7-15 Information Release (2) K1-06