recommendation for the negligible creep domain for...
TRANSCRIPT

Report EUR 27782 EN
Stefan Holmström (JRC-IET) Jia-Chao Chen (PSI)
MATerials TEsting and Rules
MATTER Deliverable 5.3
2016
Recommendation for the negligible creep domain for P91

European Commission
Joint Research Centre
Institute for Energy and Transport
Contact information
Stefan Holmström
Address: Joint Research Centre, Westerduinweg 3, NL-1755 LE Petten, the Netherlands
E-mail: [email protected]
Tel.: +31 224 565069
JRC Science Hub
https://ec.europa.eu/jrc
Legal Notice
This publication is a Validated Methods, Reference Methods and Measurements Report by the Joint Research Centre,
the European Commission’s in-house science service. It aims to provide evidence-based scientific support to the European
policy-making process. The scientific output expressed does not imply a policy position of the European Commission.
Neither the European Commission nor any person acting on behalf of the Commission is responsible for the use which
might be made of this publication.
JRC94451
EUR 27782 EN
ISBN 978-92-79-57140-4 (PDF)
ISSN 1831-9424 (online)
doi: 10.2790/689331
Luxembourg: Publications Office of the European Union, 2016
© European Union, 2016
Reproduction is authorised provided the source is acknowledged.

MATTER MATERIALS TESTING AND RULES – Grant agreement for collaborative Project
Co-funded by the European Commission under the Euratom Research and Training Programme on Nuclear Energy
within the Seventh Framework Programme
Grant Agreement no. 269706 Start date: 01/01/2011 Duration: 48 Months
Recommendation for the negligible
creep domain for P91
Deliverable 5.3
Authors: Stefan Holmström, Chen Jia-Chao
Contributors: JRC, PSI
Approval:


MATTER – Deliverable D5.3 EURATOM FP7 Grant Agreement no.269706
3
MATTER project
EC Scientific Officer: Mykola Džubinský
Document title Recommendation for the negligible creep domain for P91
Author(s)
Stefan Holmström, Chen Jia-Chao
Number of pages 47
Document type Deliverable
Work Package WP 5
Document number D5.3
Date of completion 19/12/2014
Level of Confidentiality PU PP RE CO
Document Version 1.0
Summary
The report is a recommendation on the methodology for determining the negligible creep (NEC) domain for P91 steel. The objective to define the actual TNEC curve for P91 was fully reached and time safety factors involved in the recommended curve was calculated and found to be conservative. The curve can be recommended for use in the nuclear design codes. The report also contains the new data collated in the negligible creep domain (375-450°C).
Revisions
Rev. Date Short description Main author (WP Leader) DP Leader
Distribution list
Name Organisation Comments Dzubinsky, Mykola EC Scientific Officer
Agostini, Pietro ENEA Project Coordinator
Utili, Marco ENEA Scientific Responsible Domain Leader – 4
Workpackage Leader – 15
Gavrilov, Serguei SCK CEN Domain Leader – 1
Lebarbé, Thierry CEA Domain Leader – 2
Giacomo Aiello CEA Domain Leader – 2

MATTER – Deliverable D5.3 EURATOM FP7 Grant Agreement no.269706
4
Angelika Bohnstedt KIT Domain Leader – 3 Workpackage Leader – 8
Gelineau, Odile AREVA Workpackage Leader – 1
Chen Jia-Chao PSI Workpackage Leader – 2
Davide Bernardi ENEA Workpackage Leader – 7
Ancelet, Olivier CEA Workpackage Leader – 4
Aktaa, Jarir KIT Workpackage Leader – 5
Rami Pohja VTT
Nilsson, Karl-Fredrik JRC Workpackage Leader – 9
Hyeong-Yeon Lee KAERI
Stéphan Marie CEA
Malerba, Lorenzo SCK•CEN EERA JPNM coordinator
Martine Blat EDF
Pertti Auerkari VTT
Ulla Ehrnstén VTT
David Dean EDF-UK
Sophie Dubiez-Legoff AREVA
Sylvain Pillot Industeel
Nathalia Luziginova NRG
Warwick Payten ANSTO
Wolfgang Hoffelner retired
Colombarini, Mara ENEA Assistant for the Project Organization

MATTER – Deliverable D5.3 EURATOM FP7 Grant Agreement no.269706
5
Table of contents
List of Acronyms .........................................................................................7
Scope ..........................................................................................................7
Reference stress and strain limits for NEC ..................................................9
Materials and methods ............................................................................. 12
Testing to support the definition of negligible creep for P91 ................... 15
Tensile test results (JRC) ................................................................................................................ 16
Ensuring the sufficient quality of the creep data in the NEC range............................................... 21
Creep test results ........................................................................................................................... 22
Defining the negligible creep curve .......................................................... 23
Initial predictions for time to creep strain limit ............................................................................. 23
Creep strain model based on the Wilshire equations ................................................................... 25
The negligible creep (NEC) curve for P91 steel .............................................................................. 31
Conclusions and recommendations .......................................................... 33
References ................................................................................................ 34
APPENDIX 1, Methodology for creep test loading to aquire accurate initial strain and time at zero creep strain. ................................ 37
APPENDIX 2; Uniaxial creep tests ............................................................. 39
Uniaxial creep test at 500°C / 171 MPa ......................................................................................... 39
Uniaxial creep test at 450°C / 280 MPa ......................................................................................... 40
Uniaxial creep test at 425°C / 330 MPa ......................................................................................... 42
Uniaxial creep test at 400°C / 380 MPa ......................................................................................... 43
Uniaxial creep test at 375°C / 415 MPa ......................................................................................... 45
APPENDIX 3; PSI miniature test results ..................................................... 47
Miniature test rig ........................................................................................................................... 47
Tensile test results ......................................................................................................................... 47
Creep test results .............................................................................. Error! Bookmark not defined.

MATTER – Deliverable D5.3 EURATOM FP7 Grant Agreement no.269706
6

MATTER – Deliverable D5.3 EURATOM FP7 Grant Agreement no.269706
7
List of Acronyms
WE Wilshire model for creep rupture or strain NEC Negligible Creep T Temperature (°C) TRupt Temperature-time curve for creep rupture at reference stress TNEC Temperature-time curve for NEC at reference stress TNC Temperature limit for NO creep, 375°C for ferritic steels
Stress (MPa) t Time (h)
Strain (%) Ru/t/T Rupture strength (MPa) for time to rupture t at temperature T
Rf/t/T Strength (MPa) to reach specified creep strain at temperature T and time t Rp02 Yield stress (MPa) at specified temperature T Rm Ultimate tensile strength (MPa) at specified temperature T
Sm Allowable stress (MPa), Austenitics Sm=2/3Rp0.2 , P91 (RCC-MRx) Sm=1/2.7Rm
ref Reference stress (MPa), ref =1.5 Sm
tr Time to rupture (h) at specified stress and temperature T
t0.2% Time to 0.2% strain (h) at stress and temperature T SCF Stress correction factor used on creep rupture strength
RTF Rupture time factor; adjusting tr to NEC criterion; t (, T)=tr (, T)/ RTF
Scope
This report is the final deliverable in Task 5.2. The report is a recommendation on the methodology for determining the negligible creep (NEC) domain for P91 steel. The objective to define the actual TNEC curve for P91 has been reached and the safety factors in time against creep rupture and strain have been calculated for the recommended curve. The curve is proposed for use in the nuclear design code RCC-MRx [1]. This report contains both data collected from literature [2] [3] [4] [5] and the new data produced in the MATTER project for the negligible creep domain, i.e. temperatures below 450°C. It is to be noted that in the latest version of the RCC-MRx (2012) the material properties for P91 steel (tensile strain curves, creep, and fatigue) have been moved to "probationary phase rules" in section III-Tome 6. The negligible creep has different interpretations depending on which damage mechanisms potentially affected by creep are considered. For instance the impact of cyclic softening on and the interaction between creep and fatigue, creep and fatigue crack growth as well as ratcheting. In this work the main effort is laid in defining the limits for pure creep to a small strain that can be considered to be negligible. In earlier work the softening is found to have a beneficial effect on the localized damage rate induced by cyclic loading, i.e. slower damage rate is lowering the NEC temperature [5]. For a cyclic hardening material the effect is reversed. It is to be noted that this conclusion was made assuming strain controlled cyclic loads.

MATTER – Deliverable D5.3 EURATOM FP7 Grant Agreement no.269706
8
In the MATTER consortium the negligible creep criteria to be investigated was consensually defined as the time to 0.2% strain at a specified reference stress. The negligible temperature curve (TNEC) is defined as the temperature that causes 0.2% of creep strain in a specified time at the specified reference stress. Thus, the negligible creep domain is the limiting temperature / time within which designers do not need to consider creep, i.e. if the service time is below the negligible creep curve. In this work the reference stress used in TNEC calculations are either based on yield stress, as is suggested in the non-nuclear standard for unfired pressure vessels (EN-13445 [7]) or on tensile strength as is defined in the RCC-MRx for P91 steel The different design regions in temperature-time at specified (reference) stress is shown in Figure 1.
Figure 1. Time-temperature regions for specified reference stress. The Negligible Creep temperature curve TNEC (long dash) separates the regions where time dependent and time independent design has to be applied. The creep rupture temperature curve beyond which creep failure occurs (TRupt continuous line) and the No Creep limit (TNC small dash) at 375°C are also given.
The negligible creep curves are sensitive to the chosen reference stresses, i.e. low yield or tensile strength properties given for a material move the TNEC curve towards longer times. This means that a more conservative curve is acquired by using mean value tensile properties instead of minimum values for the NEC evaluation. The TNEC is of course also sensitive to the creep strain model chosen for the predictions. In [8] strain models from the codes ASME-NH [9], RCC-MRx and R5 [10] were compared for both 316FR and P91 steel for a range of different reference stresses. It is clear that the TNEC curves from different codes cannot be compared against each other if the NEC strain limit is ranging from 0.01% to 0.2% and the reference stresses are defined differently (0.95-1.25·Rp02). However, the most conservative result for P91 was acquired by the RCC-MRx code using a reference stress of 0.95·Rp02 and a strain limit of 0.01%. As will be explained later in this report the very low strain limit will have an overly conservative safety factor against creep
350
375
400
425
450
475
500
525
550
1.E+01 1.E+02 1.E+03 1.E+04 1.E+05 1.E+06
Tem
pe
ratu
re (
°C)
Time (h)
Rupture
NEC for 0.2% strain
NO creep limit
NEGLIGIBLE CREEP (NEC),time independent design
NO CREEP (NC), time independent design
CREEP (strain)
FAILURE
CREEP RUPTURE
CREEP, time dependent design

MATTER – Deliverable D5.3 EURATOM FP7 Grant Agreement no.269706
9
damage. The allowable NEC service times for the high reference stress and low allowable strain was only about 4 hours at 425°C and 1000 h at the NC limit of 375°C, which would be useless for design purposes.
Reference stress and strain limits for NEC
Negligible creep (NEC) is an important design parameter since it gives a temperature / time range below which creep damage does not need to be considered in the design analysis. The RCC-MRx design code does not provide the negligible creep curve for ferritic/martensitic steels, such as the T/P91 steel as it does for the austenitic steel 316L(N). It is however given that for ferritic steels the
"no creep" (NC) temperature limit is 375oC regardless of stress ( allowable stress). The temperature limit is consistent with the ASME design code. The P91 material yield stresses given in RCC-MRx and ASME are listed as a function of temperature in Table 1. for the NEC temperature range 350-500°C. The RCC-MRx minimum yield values (designation Rp02-min) are in average 5% lower than the ASME yield strength values (designation Sy). The ASME Sy stress is also defined to represents the lower bound of material property.
Table 1. Minimum yield strength of P91 steel as given in ASME and minimum and average yield strength as given in RCC-MRx for the NEC temperature range
Temperature (°C)
ASME Sy (MPa)
RCC-MRx -min Rp02-min (MPa)
RCC-MRx -average Rp02-ave (MPa)
300 377 355 426
325 375 - -
350 371 349 416
375 366 - -
400 358 338 403
425 348 - -
450 337 320 385
475 322 - -
500 306 292 361
In this work the modelling and plots are given in terms of normalized stress (Xm=/Rm), i.e. the stresses are normalized by the ultimate tensile strength Rm at the specified temperatures. The
specific test stress can then be extracted as ref =Xm·m when the normalized value and the tensile
strength are known. The same can be done using yield as normalizing factor (ref=Xp·Rp02). However, the normalization by the ultimate tensile strength is more convenient in creep modelling since the Wilshire model [9] uses this form. Also, in RCC-MRx the allowable design stress for P91 is
calculated as the tensile strength divided by a factor of 2.7 (ref / Rm= 1/2.7), i.e. Xm=0.37. In the NEC temperature range the RCC-MRx minimum yield stress over minimum tensile strength ratio is at a level of Rp02/Rm = 0.72 and the corresponding ratio for average yield stress over average tensile strength is at the level of R=0.8. Thus if the normalized stress level in a creep test is 0.8 it corresponds to a test stress at or very close to average yield stress.

MATTER – Deliverable D5.3 EURATOM FP7 Grant Agreement no.269706
10
Note also the substantial difference between the minimum and the average ratio values. The measured yield over tensile strength for the MATTER test material is 0.81 (as reported later in Figure 3) and complies well with the RCC-MRx average values. The negligible creep definitions in the current nuclear design codes as well as the corresponding reference stresses are defined in Table 2 for austenitic stainless steel [4]. These definitions are formulated taking into account steels that exhibit cycling hardening. For austenitic steels such as 316L(N) component design can be done assuming NEC as long as the time fraction, i.e. time in service divided by the rupture time (t/tr), is below 0.1 for a reference stress of 1.5·Sy and the accumulated creep strain is below 0.2% at a reference stress of 1.25·Sy (at specified temperature). It should be noted that the factors 1.5 and 1.25 are claimed to take into account creep fatigue hardening and ratcheting phenomena.
Table 2. Nuclear design code NEC definitions for austenitic stainless steels:
Based on: Code Reference stress NEC criterion
Time fraction ASME NH 1.5·Sy* (R=0.67) tu/tr ≤ 0.1
Creep strain ASME NH 1.25·Sy (R=0.8) ≤ 0.2 %
Time fraction (App. RB3216)
RCC-MRx - ti/Ti ≤ 1
Creep strain RCC-MRx 1.25·Sy (R=0.8) 1·Sm**
≤ 0.03% ≤ 0.01%
Relaxation RCC-MRx 3·Sy/E *** 1.5·Sm
1-0/rel = 10%
1-0/rel = 20%
Creep strain Japanese design (Fast reactor)
1.5·Sm ≤ 0.03%
Strain Relaxation
R5 1.5·Sy
1.35·Sy 0.03%
1-0/rel = 20% *Sy is the yield (0.2%) stress, **Sm is the allowable stress defined by the design code at specified temperature, Note that SmRm (Rm
being ultimate tensile strength) and SmRT/t.(RT/t being the rupture strength for given temperature and rupture time, i.e. 100 kh or 200 kh in standards).*** determined as the stress to produce a total strain of 3Sy/E on the average monotonic curve.
To solve the difference in reference stresses between the austenitic stainless steel and the ferritic-martensitic steels the following rationalizing based on the R5 procedure [10] could be done: For the austenitic steel the traditional design limit was set at 0.5·Rm (half minimum tensile strength) or 1.35·Rp02. The factors included a safety factor 1.5 based on engineering judgement. This means that the allowable stress Sm is set at 1/3·Rm (one third tensile strength) or 0.9·Rp02. The criterion for negligible creep was set to 20% relaxation of the initial (reference) peak stress. By using the same logic for P91 the ultimate tensile strength is a suitable base instead of yield due to the strongly differing yield to tensile strength ratios of the materials. The allowable stress in RCC-MRx for P91 steel is defined as 1/2.7 times the tensile strength, i.e. 0.37 Rm. The reference stress is then 1.5 times the allowable stress or 3/2 1/2.7 Rm = 0.56 Rm. Alternatively the traditional design limit (for austenitic steel) of 0.5 Rm could be used. The

MATTER – Deliverable D5.3 EURATOM FP7 Grant Agreement no.269706
11
justification of using the same factor of 1.5 for the reference stress is gained from the safety factor calculations later in this report. The definition for reference stress in the draft amendment of the non-nuclear European standard EN-13445 for design of unfired pressure vessels is 2/3·Rp0.2. corresponding to 0.48·Rm or 0.54 Rm depending on if minimum or average yield stress values are used for the conversion. As a consequence the potential candidates for reference stress of P91 steel are between 0.48 and 0.56 Rm. In this work the 0.56 Rm is chosen to fulfil the objective of the MATTER project to define the TNEC curve for the RCC-MRx design code. In Table 3 the allowable stresses (0.33 and 0.37 Rm) and the reference stresses (0.5 and 0.56 Rm) are presented as actual stress values for 400°C as given in RCC-MRx. The average strength of the reported NIMS heats and the measured material properties of plate 20057 are also given. Note that the lowest stress (RCC-MRx-min) is about 82% of the highest (NIMS). This difference in the tensile properties clearly indicates the importance of anchoring the reference stress at a specific set of tensile strength values and not allowing to use the true material properties. The main reason for this when considering negligible creep is that if higher tensile strengths are used as
base for the TNEC curve, such as the NIMS [12], the allowable times at the corresponding ref/Rm will be shorter.
Table 3. Reference stresses in MPa for the proposed factors of tensile strength for RCC-MRx, NIMS and plate 20057 at 400°C. The ASME allowable stress 2/3 Rp02 = 239 MPa corresponds rather well
to the 0.5Rm (min) values.
Code –min/ave 0.33 Rm 0.37 Rm 0.50 Rm 0.56 Rm
RCC-MRx - min 155 174 236 262
RCC-MRx-ave 169 190 257 285
Plate 20057 176 198 267 297
NIMS - ave 191 213 287 321
The reference stress definition and the selected NEC criterion will of course have a direct impact on the calculated NEC temperature creep curve. In Table 1 there were also NEC limits based on very small strains (0.03-0.01%). It is most likely that the small creep strains are in fact calculated from relaxation data, and do not as such represent values acquired from constant load creep testing. In terms of measuring accuracies and testing machine limitations for conventional creep testing a strain of 0.01% is a highly impractical limit and will be prone to errors larger than the targeted measurement value. Standard dead weight creep test rigs cannot accurately record the precise time and/or the precise strain when full load is reached. Therefore the initial strain and the following rapid primary creep strain extracted from the recorded data at quite low sampling rate are susceptible to considerable scatter. In the loading phase it is therefore almost impossible to distinguish between instantaneous plastic deformation and time dependent creep deformation.

MATTER – Deliverable D5.3 EURATOM FP7 Grant Agreement no.269706
12
The data available in the open literature for determining low creep strains at low temperatures are not sufficient for a thorough assessment of the NEC. The majority of existing data are targeting creep rupture or high strains. Tests programs are also usually designed to assess creep rupture during service lives and therefore low stress creep tests at low temperatures are limited or totally lacking. In the rare cases where such data exists, the data owners are unfortunately not publishing it or the full creep curves are not shown in the open literature. To satisfactorily define the negligible creep domain for P91 steel to be used in design codes is therefore a challenging task. In the MATTER project the target has been set to accurately predict the time to 0.1-0.2% of strain in a temperature range below 450 °C at a stress range relevant to creep strain assessment at the reference stress. Initially it was assumed that the reference stress would be around the yield strength. In this work different time to strain models are used for predicting NEC temperature curves. Also, the life fraction approach is tested (based on rupture life) to equal the results of the strain models. It should be noted that the life fraction route or an equivalent method based on creep rupture properties is convenient to use in the design codes since it allows relating the NEC limits to creep strength and service time limits available in material standards such as EN-10028 [13]. Work is currently being carried out by the CEN TC/54 WG 59 (CREEP) work group to include negligible creep limits (NEC curves) for all steels tabulated in EN 13445. In the work of the WG59 one of the suggested definitions of negligible creep temperature curves is based on linear extrapolation of 10 000, 100 000 and 200 000 hours creep strength values corrected by a safety factor towards the lower temperature to find the insertion point with the corresponding yield stress curve (also corrected by the same safety factor).
Materials and methods
Negligible creep tests, i.e. tests below 450°C have been performed with two heats of P91 material. The main negligible creep test material used at JRC is the 60 mm thick plate (heat nr. 20057) from ArcelorMittal [14]. The plate was tested in "as received" product state and has undergone the following heat treatment: 1060°C – 4Hrs + Water Quenching + 760°C – 3hrs and 20min – Air Cooling. This plate was produced in full accordance with RCC-MR requirements (STR RM 2432). The other P91 heat tested at PSI for NEC is a 30 mm plate (heat nr. 25240002) delivered by CEA. The steel has undergone a heat treatment consisting of austenitization at 1323K during 30 min followed by quenching and tempering at 1053K for 1 h.
The chemical compositions of the above materials are given in Table 4. The JRC creep tests have been performed with the 60 mm thick plate. The test specimens used were 8 mm in diameter with a gauge length of 50 mm and a diameter of 8 mm as shown in Figure 2.

MATTER – Deliverable D5.3 EURATOM FP7 Grant Agreement no.269706
13
Figure 2. Creep specimen for negligible creep tests with the JRC test material.
Table 4. Chemical compositions in % of the P91 steels tested and assessed in MATTER. #N/A=information not available.
Elements Min/Max Plate 20057 Plate 25240002
C 0.08/0.12 0.12 0.086
Mn 0.30/0.60 0.41 0.363
Si 0.20/0.50 0.24 0.324
Ni <=0.20 0.1 0.149
Cr 8.00/9.50 8.32 8.91
Mo 0.85/1.05 1.02 0.917
Cu <=0.10 0.05 0.068
Al <=0.040 0.006 0.018
S <=0.0050 0.001 0.001
P <=0.0200 0.0091 0.017
V 0.180/0.250 0.235 0.198
Nb 0.060/0.100 0.084 0.080
N 0.030/0.070 0.041 0.0411
For the assessment of time to rupture and time to strain in the creep range, where the designers do need to take creep into consideration, the main source of data was acquired NIMS Japan In the negligible creep temperature range some additional low temperature data were obtained from the public domain [14]. The tensile properties for the assessed materials are given in Table 5. The ratios for yield stress normalized by ultimate tensile strength are shown in Figure 3 as a function of temperature. The low temperature creep data used in the assessment is not optimal for low temperature predictions. The JRC low temperature tests are the only available tests with test temperatures as
low as 375°C. In the temperature range 450 °C there are only 3 data points in the NIMS data, at or just above yield stress for the selected time to 0.2% creep strain criteria. There are 4 data points

MATTER – Deliverable D5.3 EURATOM FP7 Grant Agreement no.269706
14
for 0.1% strain at 450°C and 2 points at 427°C in [14]. No additional public data below 427 °C was found.
Table 5. Tensile properties of the 60 mm thick P91 plate. The M1 yield stress is 28% higher than the RCC-MRx minimum yield in the NEC temperature range.
Identif. Temp Rp02 Rm f(%) Rp02/Rm Rp02/R0p0m-RCC
AA003 22 510 680 38.7 0.75 1.28
AA004 375 436 542 38.9 0.80 1.27
AA005 375 436 541 40 0.81 1.27
AA006 375 433 544 40 0.80 1.26
AA007 400 430 534 39.1 0.81 1.27
AA008 425 425 524 39.4 0.81 1.29
AA009 425 433 533 37.7 0.81 1.31
AA010 425 425 526 41.2 0.81 1.29
AA011 450 410 502 41.9 0.82 1.28
AA012 500 395 475 38.4 0.83 1.35
AA013 550 340 404 49.2 0.84 1.34
AA014 600 260 322 54.7 0.81 1.28
Figure 3. Yield over ultimate tensile stress for MATTER test materials and the 3 heats tested by
NIMS. Corresponding values for the RCC-MRx are calculated on average and minimum 02 andUTS values given in the code. The temperature range of interest for NEC is between 350 and 500°C. The expected variations in the ratio are between 0.76 and 0.86 in this range.
For the existing tests conducted to failure (at high stresses) at temperatures close to the NEC temperature range it was found that minimum strain rate is reached (for ferritic-martensitic
0.68
0.72
0.76
0.8
0.84
0.88
0.92
0 100 200 300 400 500
Rp
0.2
/Rm
Temperature [°C]
PSI miniature tests, CEA plateJRC-plateDEMETRASPIRERCC-MRx AVERCC-MRx MIN

MATTER – Deliverable D5.3 EURATOM FP7 Grant Agreement no.269706
15
steels) at strains of at least 1%. It is to be remembered that for the targeted temperature range (375-450°C) the required loads for short to medium test durations are very high in comparison to expected service stresses (see RCC-MRx allowable stress), especially if tests to 1% strain or rupture are targeted. It is also to be noted that tests designed for relatively high strains or to rupture are not always helpful for determining the NEC temperature curve. These tests have seldom the recorded information at the very short durations to reach 0.1 or 0.2% in strain and the stresses are
very close or above yield whereas the allowable stress range with Sm 1/3 Rm are are only tested at high temperatures far from the NEC temperatures.
Testing to support the definition of negligible creep for P91
The test matrices of JRC and PSI for Task 7.1 (Test in support to the definition of the negligible creep domain) are presented in Table 6 and Table 7, respectively. The creep tests are performed according to the ISO 204:2009 standard, which defines the standard test method for creep testing in tension. The uniaxial tensile tests at elevated temperatures were performed according to ISO 6892-2:2011.
Table 6. The JRC tensile and creep test matrix:
Heat Test type Temp. (°C) Nr of test Target Note
20057 Tensile RT (1)? Reference
Rp02 / Rm = 0.76
0.2 = 518, 522 MPa [[1]]
UTS= 680, 684 MPa
20057 Tensile 375 3 Rp02 / Rm for normalization
20057 Tensile 400 1 Rp02 / Rm for normalization
20057 Tensile 425 3 Rp02 / Rm for normalization
20057 Tensile 450 1 Rp02 / Rm for normalization
20057 Tensile 500 1 Rp02 / Rm for normalization
20057 Tensile 550 1 Reference Rp02 / Rm = 0.86
0.2 = 387, 389 MPa [[1]]
UTS= 453 MPa
20057 Uniaxial Creep
500 1 c=0.2% in 5000 h
171 MPa
20057 Uniaxial Creep
450 1 c=0.2% in 5000 h
280 MPa
20057 Uniaxial Creep
425 1 c=0.2%
in 5000 h 330 MPa
20057 Uniaxial Creep
400 1 c=0.2%
in 5000 h 380 MPa
20057 Uniaxial Creep
375 1 c=0.2%
in 5000 h 415 MPa2

MATTER – Deliverable D5.3 EURATOM FP7 Grant Agreement no.269706
16
Table 7. The PSI test matrix for NEC with miniature specimen (0.1 mm thick, 2 mm wide dogbone specimen).
Heat Test type Temp. (°C) Nr of test Target Note
25240002 Uniaxial Creep
475 1 Time to strain and rupture
460 MPa
25240002 Uniaxial Creep
475 1 Time to strain and rupture
430 MPa
25240002 Uniaxial Creep
475 1 Time to strain and rupture
400 MPa
25240002 Uniaxial Creep
475 1 Time to strain and rupture
370 MPa
25240002 Uniaxial Creep
475 1 Time to strain and rupture
350 MPa
25240002 Uniaxial Creep
425 1 Time to strain and rupture
510 MPa
25240002 Uniaxial Creep
400 1 Time to strain and rupture
510 MPa
The times to specified strain and rupture targeted in the test program are rather short ( 5000 h) and the required extrapolations for the targeted service times are large. However, the test matrix provides data that does not exist in the public domain, especially for intermediate stress levels at low temperature.
Tensile test results (JRC)
The tensile test results for the 60 mm thick P91 plate (heat 20057) are presented in Figure 4, the raw data can be retrieved from the ODIN data base at https://odin.jrc.ec.europa.eu/ [23].

MATTER – Deliverable D5.3 EURATOM FP7 Grant Agreement no.269706
17
Figure 4. Tensile test results, ultimate tensile strength and yield. The temperature field relevant for NC testing is marked with dash-dotted lines.
Polynomials were fitted to tensile strength and yield stress test data and to the RCC-MRx values for easier use in modelling as :
(T)=A1 +A2 T+A3·T2+A4·T3+A5·T4+A6·T5 (1)
Where is the yield stress or the ultimate tensile strength in MPa, T the temperature in Celsius and the Ai are fitting constants given in Table 8.
Table 8. Fitting parameters for ultimate tensile strength and yield stress as a function of temperature. Note that for RCC-MRx the fit is to minimum (lower bound) values.
Parameter M1 (JRC)
UTS-average
M1 (JRC)
0.2- average
NIMS
UTS- average
NIMS
0.2- average
RCC-MR
UTS-min
RCC-MR
0.2-min
Polynomial 3rd
degree 3rd
degree 2nd
–degree 3rd
degree 5th -degree 5
th degree
A1 6.997E+02 3.736E+02 3.879E+02 5.574E+02 5.979E+02 4.089E+02 A2 -9.733E-01 -2.740E-01 1.455E+00 -7.026E-01 -9.824E-01 -4.542E-01 A3 2.993E-03 2.838E-03 -2.518E-03 2.685E-03 4.538E-03 1.243E-03 A4 -3.969E-06 -4.467E-06 0 -3.726E-06 -8.792E-06 1.729E-07 A5 0 0 0 0 3.848E-09 -5.170E-09 A6 0 0 0 0 4.005E-13 3.238E-12
For the tensile tests the stress-strain response was also modelled to compare the initial strains recorded at loading for the creep tests.

MATTER – Deliverable D5.3 EURATOM FP7 Grant Agreement no.269706
18
In RCC-MRx the stress-strain curve is the standard Ramberg-Osgood relation that allows to separate elastic and plastic contribution. It is defined as:
i (%)= 100*/(E*1000)+(/(c0*0.2))(1/n)·1/100 (2)
Where and 0.2 are in MPa, E in GPa and the parameters c0 and n are temperature dependent as
shown in Figure 5. Note that for this model the temperature dependences of E and 0.2 also have
to be taken into consideration. We assume that between 300-450°C the c0, n, E and 0.2 depend linearly on temperature.
Figure 5. Parameters c0 and n for describing the stress-strain curve for P91 as given in RCC-MRx (version 2010).
Using the RCC-MR formula to predict initial strains at loading (for creep tests) the strains are higher than the ones measured in the MATTER project. The main reason being lower "average" yield stress values in the code. To simplify the calculation of initial strain for the whole temperature range and to accurately represent the MATTER materials the initial creep strain as a function of normalized stress was solved for both NIMS and MATTER data representing a more average material property range. The engineering stress-strain curve below 0.8% in strain can be described by:
i (%)=0.18·R/(72.5 -83.8R)·100 (3)
Where R= (/UTS) is the normalized stress, the temperature dependence of i is handled by the
temperature dependence of UTS. Note that the model should not be used for strains above 0.8%
MATTER – Deliverable D5.3 EURATOM FP7 Grant Agreement no.269706
19
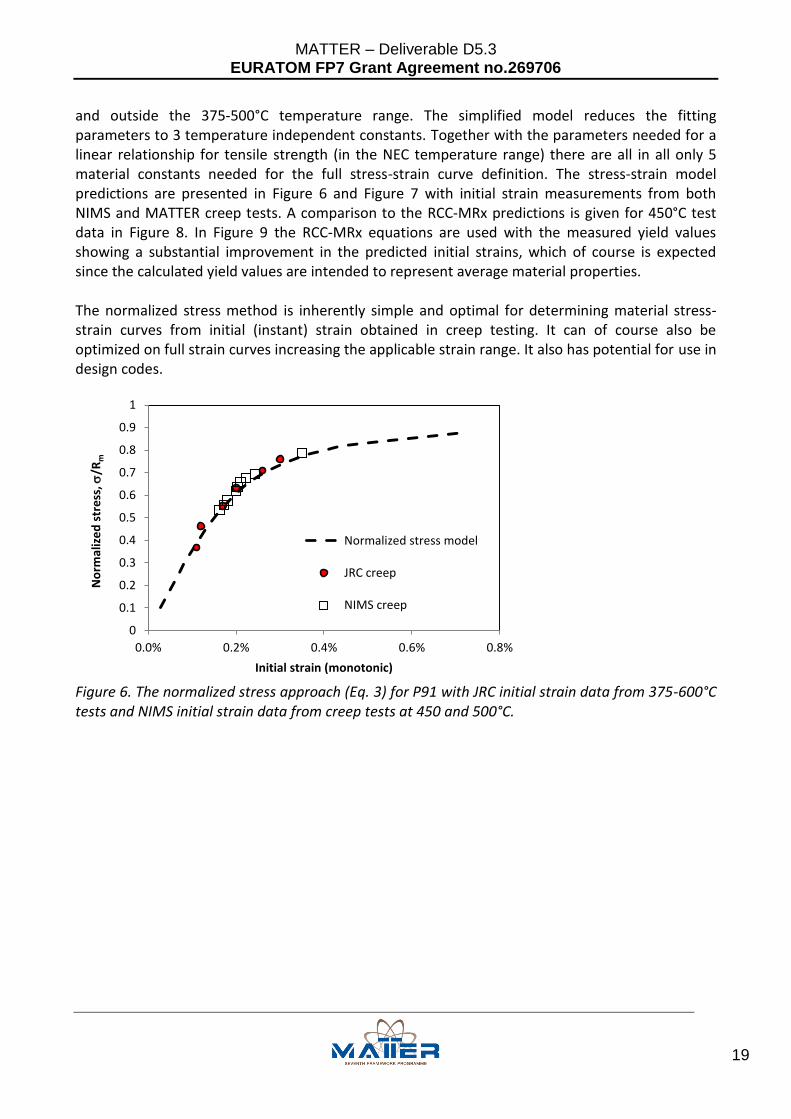
and outside the 375-500°C temperature range. The simplified model reduces the fitting parameters to 3 temperature independent constants. Together with the parameters needed for a linear relationship for tensile strength (in the NEC temperature range) there are all in all only 5 material constants needed for the full stress-strain curve definition. The stress-strain model predictions are presented in Figure 6 and Figure 7 with initial strain measurements from both NIMS and MATTER creep tests. A comparison to the RCC-MRx predictions is given for 450°C test data in Figure 8. In Figure 9 the RCC-MRx equations are used with the measured yield values showing a substantial improvement in the predicted initial strains, which of course is expected since the calculated yield values are intended to represent average material properties. The normalized stress method is inherently simple and optimal for determining material stress-strain curves from initial (instant) strain obtained in creep testing. It can of course also be optimized on full strain curves increasing the applicable strain range. It also has potential for use in design codes.
Figure 6. The normalized stress approach (Eq. 3) for P91 with JRC initial strain data from 375-600°C tests and NIMS initial strain data from creep tests at 450 and 500°C.
0
0.1
0.2
0.3
0.4
0.5
0.6
0.7
0.8
0.9
1
0.0% 0.2% 0.4% 0.6% 0.8%
No
rmal
ize
d s
tre
ss,
/Rm
Initial strain (monotonic)
Normalized stress model
JRC creep
NIMS creep

MATTER – Deliverable D5.3 EURATOM FP7 Grant Agreement no.269706
20
Figure 7. Modelled stress-strain curves for using the normalized stress approach (Eq. 3) for P91.
Figure 8. Comparing the RCC-MRx stress-strain response with the normalized stress model and measured initial stress data from 450°C tests (JRC and NIMS data).

MATTER – Deliverable D5.3 EURATOM FP7 Grant Agreement no.269706
21
Figure 9. Measured versus predicted stress-strain from tensile tests for the temperature range 375°C – 450°C predicted with a) RCC-MRx model using both mean yield stress of the code and the measured yield stress values, and b) simplified normalized model. Note the increased scatter between tests at higher strain levels.
Ensuring the sufficient quality of the creep data in the NEC range
At JRC the test programme was launched in mid-2013 restricting the available testing time to up to 10 000 hours to the end of the MATTER project. To give room for inaccuracies in the initial predictions the target times were set to 5000 h. To reach the target of defining small creep deformations in the specified time range requires high accuracy in determining the instant (elastic-plastic) strain at loading. Normally in creep rupture testing where the target is reaching minimum strain rate or rupture the initial strain is usually neglected or determined from tensile tests. The tests performed at JRC is targeting creep strains considerably lower than 1% meaning that the tests will be entirely within the primary creep region. The strains at minimum strain rate for ferritic-martensitic (ductile) steels are usually around 1%. For the targeted temperature range (375-450°C) the required loads for short to medium term test durations are high, especially if 1% or rupture is targeted. For supporting design rules again only stress ranges close to or below material yield are relevant. Extrapolation from the "power law break-down" region at stresses close to maximum tensile strength towards lower stresses are likely to be more challenging than extrapolations in temperature at moderate stresses. To define the stress range applied in terms of proximity to yield and ultimate tensile strength and to have the possibility of using the Wilshire approach for modelling rupture and time to strain the ultimate tensile strengths as a function of temperature described earlier are used. As mentioned before, the initial strain and time when the load is fully applied is crucial for determining the time to the targeted small strains. To acquire as good results as possible using standard dead-weight creep machines without load measurement capacity, a methodology for starting the tests has been developed. For the standard creep machine the applied dead weight is usually amplified by a lever ratio depending on the machine manufacturer (at JRC 1:10 or 1:15). Loading is normally done manually with little or no control of the loading rate of the specimen. This of course makes accurate determination of the time and strain when full load is applied difficult, thus making the time to specified low strain also uncertain. The new method described in APPENDIX 1 for improving the measured primary creep and especially the initial strain at loading has been applied at JRC.

MATTER – Deliverable D5.3 EURATOM FP7 Grant Agreement no.269706
22
Creep test results
The time to specified creep strains for the MATTER tests (by JRC) are given in Table 9 and are available in the MatDB data base [22]. The full strain curves of the tests are given in APPENDIX 2.
Note that in these plots "CORR" refers to curves in which the initial strain I have been removed.
Table 9. The results of the JRC creep test program for determining creep and NEC properties.
Designations; tr=time to rupture, t=time to strain, f=fracture strain, t=strain at time.
Ident. Temp.
(°C) Stress (MPa)
Norm. Ratio /Rm
Time t (h)
Strain (%)
Note:
MC06 600 155 0.46 tr=666 f=38.4 Ruptured
MC08a 550 280/330/380 3 x 415
0-0.76 - - Interrupted 1)
MC08b 550 230 0.56 tr =417 f=36.5 Ruptured 2)
MC01 500 171 0.37 t =7050 t=0.180 Interrupted
MC02 450 280 0.55 t =+7970 t=+0.191 Interrupted
MC03 425 330 0.63 t =+7800 t=+0.215 Interrupted
MC05 400 380 0.71 t =+7950 t=+0.247 Interrupted
MC07 375 415 0.76 t =817 t=+0.23 Interrupted
MC04 375-450°C 415 0.76 t =+11660 t=+1.65 Running 3)
1) load cycling test with stress ratio R=0, i.e. unload between loading
2) creep test with pre-strain from load cycling continued test from above (0.4 creep strain at start)
3) temperature cycling test cycling between 375-450°C at 415MPa
As given in the above table the creep strain of 0.2% has been reached for some of the tests and for some it has nearly been reached. The result indicates that the primary creep rates at temperatures as low as 375°C might be higher than what would be expected from extrapolation towards lower temperature with classical time-temperature parameter approaches. The two tests where changes in stress or temperature have been made are presented in Figure 10 and Figure 11. The tests were done to support modelling of transients. The decreasing primary creep strain rates measured in the step wise increased loading tests clearly shows the increased strain hardening imposed on the material. For the temperature cycling test the strain rate change can be used for verification of creep models and calculating the activation energy.

MATTER – Deliverable D5.3 EURATOM FP7 Grant Agreement no.269706
23
Figure 10. Stress cycling test (MC08a) with increasing stress, i.e. 280, 330, 380 and 415MPa at 375°. There was 3 cycles at 415 MPa. Note that the specimen was unloaded between stresses levels.
Figure 11. Temperature cycling at 415MPa at the border of yield (MC04).
The measured creep strain curves and strain rate plots of the miniature tests performed by PSI can be found in APPENDIX 3.
Defining the negligible creep curve
Initial predictions for time to creep strain limit
Extrapolations towards lower temperatures have been performed for all test data below 450°C by using both classical models [16] such as Manson-Haferd (MH), Manson-Brown (MB) or the minimum commitment (MC) method and by the Wilshire equations (WE) [11] together with the LCSP strain model [17] as shown in Figure 12.

MATTER – Deliverable D5.3 EURATOM FP7 Grant Agreement no.269706
24
The DESA [18] software was used for the classical creep models predicting stress required to gain 0.2% strain at a given time mainly using the NIMS P91 data set [12]. These predicted (extrapolated) stress values to gain 0.2% strain in 5000 h were used to set-up the MATTER (JRC) test matrix given earlier in this report (see Table 10 and compare to Table 6). The models represented are of course more reliable in extrapolation towards higher temperatures but the initial predictions give information on the potential "challenges" of temperature extrapolation towards NEC conditions.
Figure 12. Initial determination of stress to give 0.2% creep strain in 5000h as given Table 10. The two methods used are; classical parametrical extrapolations (t0.2%) and using the LCSP creep strain model with temperature and stress dependent shape functions. Note that the normalization is by yield stress.
Table 10.Predicted stress to cause given strain in 5000 h (for MATTER test matrix) using direct fitting of time to specified strain with classical creep models. The stress ratio: predicted test stress over yield stress (Sy as in RCC-MR, mean value) and ultimate tensile strength is also given.
Temp Creep
model*
Creep
strain
(%) in
5000 h
Predicted
stress
(MPa)
Pred. stress /
Yield Stress Note:
0.00
0.20
0.40
0.60
0.80
1.00
1.20
1.40
350 400 450 500
/R
p0
2-a
ve (0
.2%
in 5
kh)
Temperature (°C)
classical / normalized stress predictions
500°C predictions, not in linear fit
WE-LCSP
Linear (classical / normalized stress predictions)
Linear (WE-LCSP)
extrapolation

MATTER – Deliverable D5.3 EURATOM FP7 Grant Agreement no.269706
25
500
LM
MH
MC
MB
WE-0.2
LCSP (WE)
0.2%
191
186
195
184
180
184
0.519±0.012
Data available
6 pts 0.2%
Max. t0.2~70h at 260 MPa
450
LM
MH
MC
MB
WE-0.2
LCSP (WE)
0.2%
287
263
272
271
275
286
0.713±0.023
Data available:
3 pts 0.2%, (NIMS)
2 pts 0.1% [14]
425
LM
MH
MC
MB
WE-0.2
LCSP (WE)
0.2%
339
308
319
319
329
350
0.816±0.028
Data available:
2 pts 0.1% [14]
Inconsistent results
(higher stress longer t02%)
400
LM
MH
MC
MB
WE-0.2
LCSP (WE)
0.2%
393
353
365
367
383
(416 > Rp022)
0.914±0.035
No data available
Temperature
extrapolation -25°C
375 WE-0.2 0.2% 415
(457 > Rp02) 1
Temperature
extrapolation -50°C
*LM=Larson-Miller, MH=Manson-Haferd, MB=Manson-Brown, MC=Minimum Commitment, WE=Wilshire Equation,
LCSP=Logistic creep strain prediction
Creep strain model based on the Wilshire equations
The classical models used for the initial predictions were compared to the Wilshire type strain model (WE) optimised on the MATTER and NIMS data. This type of strain model was selected due to the robust nature of the model. The main WE model advantages for defining the NEC limit temperatures and stresses are:
Few fitting parameters (u,k)
the activation energy Q for time to strain seems to be constant also at NEC temperatures

MATTER – Deliverable D5.3 EURATOM FP7 Grant Agreement no.269706
26
easy to express time to specified strain t() as a function of stress and stress required to
cause a specified strain as a function of time (t) (see below Eq. 1 and 2)
easy to relate to rupture properties (same models used with differing u and k)
robust in extrapolation limited by tensile strength (normalized value between 0 and 1) The WE equation for time to strain tε is:
)exp()ln(1
1
TR
Q
kt
u
UTS
(1)
where is the test stress and UTS the ultimate tensile strength, i.e. /UTS is the normalized stress, Q the activation energy, R the gas constant and T the temperature in K.
The WE equation for normalized stress /UTS is:
u
UTS TR
Qtk ))exp((exp
(2)
and the sought temperature T at specified stress and time to strain or rupture as:
u
mRktR
QT
1
)ln(1
ln
(3)
The WE model fits for rupture, 1%, 0.5%, 0.2% strain (NIMS data only) are shown in Figure 13 and the corresponding model parameters derived from the plot are shown in Figure 14 and Table 11.
Note that the data close to yield (at about /Rm 0.8) seems to be in quite good agreement with the model predictions. The activation energy Q used is 300 000 J/mol in the temperature range 450°C-650°C. The predicted against measured logarithmic time to strain (or rupture) are given in Figure 15.

MATTER – Deliverable D5.3 EURATOM FP7 Grant Agreement no.269706
27
Figure 13. NIMS strain data and WE model predictions for rupture, 1%, 0.5% and 0.2% strain.
Figure 14. Determination of fitting parameters u and k for the strain data.

MATTER – Deliverable D5.3 EURATOM FP7 Grant Agreement no.269706
28
Table 11.Wilshire creep strain and rupture model parameters for P91 steel (NIMS data). Note that
time (tr/) is in hours, and the total strain range in %. Note also that there is a change in parameters at the stress ratio of 0.45. The activation energy Q is 300 000 J/mol in all cases (see Eq. 2-4).
Model type
/Rm > 0.45 /Rm 0.45
k u k u
rupture 82.769102 0.135627 75.618032 0.133624
1.0% strain
150.827655 0.141074 31.330443 0.101257
0.5% strain
246.987398 0.147260 22.206093 0.086804
0.2% strain
382.358129 0.149313 33.303955 0.090673
The full master strain model for stresses above 0.45Rm and strains in the range of 0.2-1% is defined by using Eq. 1-2 with k and u as functions of strain. The functions for k and u are given in Table 12. It is to be noted that predicted time to 1% strain is closing in on the rupture curve as the extrapolation time increase, showing a tendency of creep ductility decrease at long extrapolation times.
Table 12.Wilshire creep strain parameters k and u for full master strain model (c 1%, T=375-
600°C and /Rm > 0.45). Note that is not to be given in %.
/Rm > 0.45 predicted
Strain range % (0.2-1%) k=-331.71log() u=-1.051+0.1518
The new creep strain test results from MATTER and the NIMS data are plotted in Figure 16 for time to 0.2%. The PSI test data obtained with miniature specimen at 475°C are plotted in Figure 17. The results of the miniature specimens give comparable results to the classical creep specimen. There were inconstancies in some high stress range tests.

MATTER – Deliverable D5.3 EURATOM FP7 Grant Agreement no.269706
29
Figure 15. Measured against predicted time to strain for 0.1-0.5% strain using the WE model and WE model parameters optimized to the data.
Note that extrapolation towards the "power law break-down" region at stresses approaching the ultimate tensile strength are likely to be more challenging than extrapolations in temperature at moderate stresses due to the curvature of the Wilshire equation. The reference stress is however still in the stress region where creep test results (at higher temperatures) are available and the effect of the proximity to the power law breakdown region is sufficient.

MATTER – Deliverable D5.3 EURATOM FP7 Grant Agreement no.269706
30
Figure 16. Normalized stress plot for JRC test results for time to 0.2% creep strain. The selected reference stress of 0.56 Rm is marked by a dotted line.
Figure 17. Normalized stress plot for PSI miniature tests (475 °C) specimen results for time to 0.2% creep strain.
0.10
0.20
0.30
0.40
0.50
0.60
0.70
0.80
0.90
1.00
1.E-23 1.E-21 1.E-19 1.E-17 1.E-15 1.E-13
/R
m
t*exp(-Q/RT)
Rupture
Time to 0.2% strain
LT tests 0.2% strain
NIMS 0.2% data
Reference stress
0.10
0.20
0.30
0.40
0.50
0.60
0.70
0.80
0.90
1.00
1E-25 1E-23 1E-21 1E-19 1E-17 1E-15 1E-13
/R
m
t*exp(-Q/RT)
PSI te - 0.1%
PSI te - 0.2%
PSI rupture 475°C
rupture-NIMS
model 1% - NIMS
model 0.2% - all
model 0.1% - JRC
JRC te - 0.2%
JRC te - 0.1%

MATTER – Deliverable D5.3 EURATOM FP7 Grant Agreement no.269706
31
With both the creep strain model and the rupture model in place it is now possible to calculate rupture time safety factors (RFT) corresponding to different strain limits by overlapping the strain
and rupture models using Eq. 2 by finding the optimal RFT that satisfies t=tr/RTF. For P91 it can be
shown that RFT10 corresponds to time to 1% strain, RFT100 to 0.5% strain and RFT1000 to 0.2% strain as shown in Figure 18.
Figure 18. Normalized stress plot for JRC test results with RTF corrected time to strain estimates.
The negligible creep (NEC) curve for P91 steel
In Figure 19 the proposed NEC temperature curve is presented using the time to 0.2% strain criteria and a reference stress of 0.56 Rm-ave as generated by Eq. 4. To further verify the proposed TNEC curve against another comparable model, creep strain calculations were made using the RCC-MRx creep strain formulations and parameters for the temperatures 400, 450 and 500°C to predict time to 0.2% creep strain. The same reference stress and Rm values were used. The predictions are depicted in Figure 20 together with the 0.2% strain TNEC curve and a curve calculated on the TRupt curve corrected with a RTF of 1000. It can be seen that the RCC-MRx predicted time to 0.2% strain coincides well with the TNEC curve based on the MATTER assessment. The proposed TNEC predicts marginally longer time to 0.2% than the RCC-MRx creep strain model.
0.10
0.20
0.30
0.40
0.50
0.60
0.70
0.80
0.90
1.00
1E-23 1E-21 1E-19 1E-17 1E-15 1E-13
/R
m-N
IMS
t*exp(-Q/RT)
Rupture
RTF=10
RTF=1000
RTF=10 000
NIMS 1% strain data
LT tests 0.2% strain
LT tests at 0.1% strain

MATTER – Deliverable D5.3 EURATOM FP7 Grant Agreement no.269706
32
Figure 19. Proposed negligible creep temperature curve for the 0.2% creep strain criterion with
reference stresses of 0.56Rm with correction for RCC-MRx average rupture strength. Note that the curve is intersecting the NC temperature (375°C) at approximately 500 000 h.
Figure 20. Negligible creep temperature curves using time fractions of time to rupture (all available rupture data) The NEC curve for RTF life fraction of 1/1000 corresponds well with the above given 0.2% creep strain criteria.
350
375
400
425
450
475
500
100 1000 10000 100000 1000000
Tem
per
atu
re (
°C)
Time to 0.2% strain
T-RUPT
T-0.2%
No Creep (NC)
350
375
400
425
450
475
500
100 1000 10000 100000 1000000
Tem
per
atu
re (
°C)
Time to 0.2% strain
T-RUPT
tr/1000
T-0.2%
RCC-MRx strain model
No Creep (NC)

MATTER – Deliverable D5.3 EURATOM FP7 Grant Agreement no.269706
33
Conclusions and recommendations
The negligible creep temperature curve (TNEC) has been constructed for P91. A reference stress of 0.56 times the ultimate tensile strength has been recommended in compliance with the RCC-MRx allowable stresses for this steel. The TNEC curve has been defined using the Wilshire equations for rupture and strain with data from public domain and the recent MATTER project. The generated data is a set of low temperature tests with test stresses close to the proposed reference stress
ranging from 0.37 to 0.76Rm. The NEC criteria proposed for the RCC-MRx design code are tabulated in Table 13. It is to be remembered that there is extensive extrapolation involved in defining the TNEC curve and the corresponding time factors. If the extrapolation range would be limited to a factor of 3 as recommended when defining the creep rupture properties, the curve could not be defined.
Table 13. P91 negligible creep definition to be proposed for RCC-MRx with Sm=Rm/2.7
Based on: Reference stress NEC criterion
Creep strain
c≤ 0.2%
1.5·Sm
(0.56Rm) 1
1 max
n
i i
i
t
t
Time factor t≤ tr/1000
1.5·Sm
(0.56Rm) 1
1 max
n
i i
i
t
t
The conservativeness of the generated TNEC curve, based on time to 0.2% creep strain, is large
compared to rupture. Rupture times are 1000 times higher than the time to 0.2% strain. The predicted rupture times at reference stress and allowable stress were compared and an additional safety factor of >100 in time is imposed by the stress ratio between reference stress and allowable stress (time factor tallowable/tref=115 for 0.2% strain and 400 for rupture). With the proposed curve the total design safety factor against creep rupture (in time) is > 100 000, i.e. 100 times 1000. The corresponding factor against 0.5% strain is 1000 (100 times 10).

MATTER – Deliverable D5.3 EURATOM FP7 Grant Agreement no.269706
34
Figure 21. Normalized stress plot for NEC criterion time to 0.2% creep strain and temperature predictions for 200 000 h service at reference or allowable stresses.
It is concluded that a "sufficient" safety margin is in place for the proposed TNEC and that it can be recommended for use in the nuclear design codes such as RCC-MRx. It is also to be noted that additional creep tests are highly recommended to verify the results with a closer range of test stresses around the reference stress and an increased amount of test
temperatures in the 375 to 500C range.
References
[1] RCC-MRx. Design and construction rules for mechanical components of Nuclear
installations, AFCEN; 2012.
[2] Riou B. et. Al, Proc. of ASME Pressure Vessels and Piping Division Conference, PVP2006-
ICPVT-11, paper: 93408. Canada, 2006
[3] Ren W., Lillo T., Totemeier T., Assessment of Negligible Creep, Off-Normal Welding and
heat treatment of Gr91 Steel for nuclear reactor pressure vessel application,
ORNL/GEN4/LTR-06-032, 2006.
0.1
0.2
0.3
0.4
0.5
0.6
0.7
0.8
0.9
1.0
1E-24 1E-23 1E-22 1E-21 1E-20 1E-19 1E-18 1E-17 1E-16 1E-15
/R
m
t/r·exp(-Q/RT)
Rupture (NIMS)
Time to 0.2% strain (RCC-MRX-average)
At reference stress find T for spec. time
388°C
Reference stress 0.56Rm
0.37Allowable stress 1/2.7Rm
0.56
429°C

MATTER – Deliverable D5.3 EURATOM FP7 Grant Agreement no.269706
35
[4] Riou B., Improvement of ASME NH for Grade 91 Negligible Creep and Creep Fatigue STP-
NU-13, 2008
[5] Improvement of ASME NH for Grade 91 Negligible Creep and Creep Fatigue (STP-NU-13),
2008
[6] Jetter. R.I, Sham T.L, Swindeman R.W. Application of Negligible Creep Criteria to Candidate
Materials for HTGR Pressure Vessels, Journal of Pressure Vessel Technology, Vol. 133, pp.
021103/ 1-7, 2001
[7] EN 13445-3, Unfired pressure vessels, Part 3 - Design: 2009
[8] Masanori A., Nobuhiro I., Nobuchika K., Masayuki S., Naoto K., A comparative study of
negligible creep curves for rational elevated temperature design. Proc. ASME Pressure
Vessels and Piping Conference, Paper PVP2009-77232, Prague, Czech Republic, 2009
[9] ASME. Section III Div. 1 Sub-Section NH, New York USA: ASME; 2007.
[10] R5 Assessment Procedure for the High Temperature Response of Structures. British Energy,
Gloucester , UK, 2001.
[11] Wilshire, B., Scharming, P.J., Hurst, R., A new approach to creep data assessment, Material
Science and Engineering A, Vol.510-511, 2009, p. 3-6
[12] NIMS Atlas of creep deformation property. No. D-1, Creep deformation properties of
9Cr1MoVNb steel for boiler and heat exchangers (2007).
[13] EN 10028, Flat products made of steels for pressure purposes, 2009
[14] ArcelorMittal Technical Note, CRMC - 2013 – 002, Production of plates (P91 and 316LNmod
material) for MATTER FP7 Project, 2013
[15] Riou B. et. Al, Proc. of ASME Pressure Vessels and Piping Division Conference, PVP2006-
ICPVT-11, paper: 93408. Canada, 2006
[16] PD 6605-2, Guidance on methodology for assessment of stress-rupture data. Computing
methods, 1998
[17] Holmström S., Auerkari P., Robust prediction of full creep curves from minimal data and
time to rupture model. Energy Materials, Materials Science & Engineering for Energy
Systems, Vol. 1 (2006) 249-255
[18] Feher A., Linn S., Schwienheer M., Scholtz A, Berger C., An interactive approach to creep
behaviour modelling. Material Science and Engineering: A, Vol 510-511, 2009

MATTER – Deliverable D5.3 EURATOM FP7 Grant Agreement no.269706
36
[19] Wilshire, B. Scharning, P.J, Hurst, R., A new methodology for long term creep data
generation for power plant components. Baltica VII Conf. on Life Management and
Maintenance for Power Plants, vol. 1, 2007, p. 196–207.
[20] Holmström S., Luzginova N., Negligible creep of P91 steel, Proc. ECCC conference, Creep &
Fracture in High Temperature Components, Design & Life Assessment, may 5-7th 2014
[21] Design and Construction Rules, DCR report N1, Negligible creep for 316L, R5, Vol 2-3, 1988.
[22] Creep data: http://dx.doi.org/10.5290/250008, http://dx.doi.org/10.5290/2500079,
http://dx.doi.org/10.5290/2500078, http://dx.doi.org/10.5290/2500077,
http://dx.doi.org/10.5290/2500076, http://dx.doi.org/10.5290/2500002,
http://dx.doi.org/10.5290/2500001
[23] Tensile test data: http://dx.doi.org/10.5290/2500005, http://dx.doi.org/10.5290/2500004,
http://dx.doi.org/10.5290/2500006, http://dx.doi.org/10.5290/2500007,
http://dx.doi.org/10.5290/2500008, http://dx.doi.org/10.5290/2500009,
http://dx.doi.org/10.5290/2500010, http://dx.doi.org/10.5290/2500011,
http://dx.doi.org/10.5290/2500012, http://dx.doi.org/10.5290/2500013,
http://dx.doi.org/10.5290/2500014, http://dx.doi.org/10.5290/2500015

MATTER – Deliverable D5.3 EURATOM FP7 Grant Agreement no.269706
APPENDIX 1, Creep test loading methodology
37
APPENDIX 1, Methodology for creep test loading to aquire accurate initial strain and time at zero creep strain.
The tests for NEC determination have all been started by a new technique ensuring equal loading rate and better initial strain measurement. The method is using the automatic lever correction feature of the creep machines. It means that the load is applied to the specimen by the electrical motor that corrects the leaver when the specimen creeps. The measured loading rate for the loading bar movement when correction is activated is approximately 0.02mm/s. The assessed data for initial strain (for plate 20057) is show in Figure 22.
Figure 22. Strain development during loading with electrical leaver correction motor.
It can be seen that only the tests at the two highest stresses yield. The yielding is though less than 0.1% thus not over the defined standard yield point referring to 0.2% plastic deformation. Method for acquiring equal loading conditions sequences in creep testing with dead-weight lever machines
The standard dead weight creep machines have in most cases an inbuilt automatic lever correction
function. The lever correction, working by an electric motor, keeps the lever ratio constant and the
load lines vertical, automatically levelling the lever by retracting the loading bars when creep strain
is accumulated. This feature can be used to load the specimen at a repeatable rate.
The procedure for creep tests for NEC included the following steps;
The LVDTs are zeroed at level lever position (lever correction is ON)
The automatic lever correction is switched OFF and the load train is lowered below the lever
correction limit to the supporting tray
Loading sequence
approx. loading bar deflection rate 0.02 mm/s
0
20
40
60
80
100
120
0.00% 0.05% 0.10% 0.15% 0.20% 0.25% 0.30% 0.35%
Strain
Tim
e (
s)
500°C/171MPa
450°C/280MPa
425°C/330MPa
400°C/380MPa
375°C/415MPa

MATTER – Deliverable D5.3 EURATOM FP7 Grant Agreement no.269706
APPENDIX 1, Creep test loading methodology
38
The full load is applied on the machine supported by the tray, i.e. the force on the specimen
is negligible
The automatic lever correction is switched ON and the lever correction function lifts the
weights to a level lever position
The time from switching ON the lever correction to the instant the load is free from the
support tray is measured
The data is assessed with the time and measured strain data as shown in Figure 23.
The initial strain at loading is recorded and the actual creep strain accumulation and time
starts from this point.
The above procedure enhances the quality of the initial and primary creep strain data.
Figure 23. a) Loading of a creep test at 375°C to 415 MPa with lever leveling function b) uniaxial tensile test at the same temperature. Note that the initial strain at full load (creep) is corresponding very well with the expected strain at 415 MPa in the tensile test.

MATTER – Deliverable D4.5 EURATOM FP7 Grant Agreement no.269706
APPENDIX 2, JRC CREEP DATA
39
APPENDIX 2; Uniaxial creep tests
Uniaxial creep test at 500°C / 171 MPa
Note that the LVDT1 has an initial problem, only LVDT1 is used for creep strain only after the signal drop at 20h if creep.
Result table for MC01 tested at 500°C / 171 MPa, initial strain 0 (elastic-plastic) was 0.11 %
Creep strain
(%)
0.01 0.03 0.1 0.2 0.202 %
(test max)
Strain rate
(1/h)
6.6E-5
6.8E-5
2.9e-7
1.5E-7 1.3E-7
Time (h) 0.75 12 936 6845 7050
Fig. X Time to deflection (right y-axis) and engineering strain (left y-axiz). CORR means that the initial strain has been removed.

MATTER – Deliverable D4.5 EURATOM FP7 Grant Agreement no.269706
APPENDIX 2, JRC CREEP DATA
40
Strain rate (1/f) as a function of creep strain.
Strain rate (1/f) as a function of time (h).
Uniaxial creep test at 450°C / 280 MPa
Result table for MC02 tested at 450°C / 280 MPa, initial strain 0 (elastic-plastic) was 0.17 %

MATTER – Deliverable D4.5 EURATOM FP7 Grant Agreement no.269706
APPENDIX 2, JRC CREEP DATA
41
Strain (%) 0.01 0.03 0.1 0.2 0.19%
(test max)
Strain rate
(1/h)
2E-3 1.4E-4 3.7E-6 - 3E-8
Time (h) 0.06 1.39 89 - 7053

MATTER – Deliverable D4.5 EURATOM FP7 Grant Agreement no.269706
APPENDIX 2, JRC CREEP DATA
42
Uniaxial creep test at 425°C / 330 MPa
Result table for MC03 tested at 425°C / 330 MPa, initial strain 0 (elastic-plastic) was 0.20 %
Strain (%) 0.01 0.03 0.1 0.2 0.22%
(test max)
Strain rate
(1/h)
1.2E-2 2.5E-4 7.1E-6 1.5E-7 1.5E-8
Time (h) 0.01 0.42 38 2522 6882

MATTER – Deliverable D4.5 EURATOM FP7 Grant Agreement no.269706
APPENDIX 2, JRC CREEP DATA
43
Uniaxial creep test at 400°C / 380 MPa
Result table for MC05 tested at 400°C / 380 MPa, initial strain 0 (elastic-plastic) was 0.26 %
Strain (%) 0.01 0.03 0.1 0.2 0.24%

MATTER – Deliverable D4.5 EURATOM FP7 Grant Agreement no.269706
APPENDIX 2, JRC CREEP DATA
44
(test max)
Strain rate
(1/h)
2.9E-3 2.8E-3 1.3E-5
5.6E-7
2.8E-8
Time (h) 0.005 0.04 14.2 812 7026

MATTER – Deliverable D4.5 EURATOM FP7 Grant Agreement no.269706
APPENDIX 2, JRC CREEP DATA
45
Uniaxial creep test at 375°C / 415 MPa
Result table for MC07 tested at 375°C / 415 MPa, initial strain 0 (elastic-plastic) was 0.32 %
Strain (%) 0.01 0.03 0.1 0.2 0.27%
(test max)
Strain rate
(1/h)
1.2E-2 3.6E-3 1.2E-5 8.3E-7 5E-8
Time (h) 0.002 0.02 5.1 458 7005

MATTER – Deliverable D4.5 EURATOM FP7 Grant Agreement no.269706
APPENDIX 2, JRC CREEP DATA
46
Initial strain rates compared against the predictions made for the test matrix;

MATTER – Deliverable D5.3 EURATOM FP7 Grant Agreement no.269706
APPENDIX 3, PSI CREEP DATA
47
APPENDIX 3; PSI miniature test results
Miniature test rig
Tensile test results
Sample_ID Temperature[°C] σ0.2[MPa] Strength[MPa]
7 475 434 500
9 425 431 526
17 400 428 540
8 25 526 680

MATTER – Deliverable D5.3 EURATOM FP7 Grant Agreement no.269706
APPENDIX 3, PSI CREEP DATA
48
Creep results with miniaturized samples from PSI
P91
425°C under 510 MPa
time (hr)
0 20 40 60 80 100
str
ain
0.00
0.01
0.02
0.03
0.04
Time to 0.1% strain: 0.10 h Time to 0.2% strain: 0.27 h Time to failure: 88.6 h

MATTER – Deliverable D5.3 EURATOM FP7 Grant Agreement no.269706
APPENDIX 3, PSI CREEP DATA
49
P91475°C under 430 MPa
time (h)
0.0 0.5 1.0 1.5 2.0 2.5
str
ain
0.00
0.01
0.02
0.03
0.04
Time to 0.1% strain: - Time to 0.2% strain: - Time to failure: 2.37 h

MATTER – Deliverable D5.3 EURATOM FP7 Grant Agreement no.269706
APPENDIX 3, PSI CREEP DATA
50
P91475°C at 400 MPa
time (hrs)
0 10 20 30 40 50
str
ain
0.00
0.02
0.04
0.06
0.08
Time to 0.1% strain: 0.03 h Time to 0.2% strain: 0.08 h Time to failure: 47.8 h

MATTER – Deliverable D5.3 EURATOM FP7 Grant Agreement no.269706
APPENDIX 3, PSI CREEP DATA
51
P91475°C under 370 MPa
time (hrs)
0 100 200 300 400 500 600 700
str
ain
0.000
0.002
0.004
0.006
0.008
0.010
0.012
Time to 0.1% strain: 0.19 h Time to 0.2% strain: 0.94 h Time to failure: 659 h

MATTER – Deliverable D5.3 EURATOM FP7 Grant Agreement no.269706
APPENDIX 3, PSI CREEP DATA
52
P91475°C under 350 MPa
time (hrs)
0 2000 4000 6000 8000
str
ain
0.000
0.002
0.004
0.006
0.008
0.010
0.012
0.014
0.016
Time to 0.1% strain: 1.0 h Time to 0.2% strain: 30 h Time to failure: 7564 h

Europe Direct is a service to help you find answers to your questions about the European Union
Freephone number (*): 00 800 6 7 8 9 10 11
(*) Certain mobile telephone operators do not allow access to 00 800 numbers or these calls may be billed.
A great deal of additional information on the European Union is available on the Internet.
It can be accessed through the Europa server http://europa.eu.
How to obtain EU publications
Our publications are available from EU Bookshop (http://bookshop.europa.eu),
where you can place an order with the sales agent of your choice.
The Publications Office has a worldwide network of sales agents.
You can obtain their contact details by sending a fax to (352) 29 29-42758.
European Commission
EUR 27782 EN – Joint Research Centre – Institute for Energy and Transport
Title: Recommendation for the negligible creep domain for P91
Author(s): Stefan Holmström, Chen Jia-Chao
Luxembourg: Publications Office of the European Union
2016 – 53 pp. – 21.0 x 29.7 cm
EUR – Scientific and Technical Research series – ISSN 1831-9424 (online)
ISBN 978-92-79-57140-4 (PDF)
doi: 10.2790/689331

ISBN 978-92-79-57140-4
doi: 10.2790/689331
JRC Mission
As the Commission’s in-house science service, the Joint Research Centre’s mission is to provide EU policies with independent, evidence-based scientific and technical support throughout the whole policy cycle.
Working in close cooperation with policy Directorates-General, the JRC addresses key societal challenges while stimulating innovation through developing new methods, tools and standards, and sharing its know-how with the Member States, the scientific community and international partners.
Serving society Stimulating innovation Supporting legislation
LD
-NA
-27
78
2-E
N-N