recent trends in the bilateral trade engagement of india...
TRANSCRIPT
RECENT TRENDS IN THE BILATERAL TRADEENGAGEMENT OF INDIA AND CANADA
Rahul Dhiman*1, Rajesh Kumar2, Sahil Gupta and 3Munish Kumar4
Abstract: India–Canada trade is growing, but the relationship is still well below its potentialrelative to both the growth of the Indian economy and the performance of other nations’ tradewith India. The trade between India and Canada is growing in services; manufacturing tradeis still very much below its potential. The present study makes an attempt to study the recentchanges in the Indo-Canadian trade in the new economic environment. The broad objective ofthe paper is to understand the structure, composition and direction of India’s Exports to andimport from Canada. Compounded Annual growth rates and instability index of Indo-Canadatrade are calculated to identify the recent changes those have taken place in the bilateral trade.
Keywords: Bilateral investment, Export, Growth Rate, Instability.
I. INTRODUCTION
Developing countries are playing a larger role in global economic growth, but theeconomic relations between developing countries also play a crucial role. Thedeveloping countries are contributing more to development knowledge- boththrough home grown academic research and practical experience that has beengained over the years (Lin and Resenblatt, 2012). Canada’s interest in strengtheningits economic and business ties with Asia has grown over the past decade, especiallysince the 2008 global financial crisis. One of the reasons behind Canada’s tradeparticipation with India is based on current trends, it is set to become one of thefour largest economies in the world within the next four decades. While manyexperts had predicted a slump in Indian growth as a result of the global financialcrisis, India came out of the crisis relatively strong. Its GDP grew by nearly 10 percent in 2010 (Canadian Chamber of Commerce Report, 2012). The economic reformsof Finance Minister Manmohan Singh during the government of Narasimha Raoalso made India attractive to the Liberal government of Jean Chretien when itswept to power in a 1993 landslide. In October of 1994, during a major trade missionto India, Minister for International Trade Roy MacLaren proclaimed India to be“one of the most promising markets in the Asia-Pacific region for Canadian business
I J A B E R, Vol. 14, No. 3, (2016): 1645-1670
1Assistant Professor, 2Associate Professor, 3Research Associate, 4Assistant ProfessorChitkara Business School, Chitkara University, Punjab-140601, E-mail*: [email protected]

1646 � Rahul Dhiman, Rajesh Kumar, Sahil Gupta and Munish Kumar
(Louis, 1998). The study of bilateral trade flows has been at the centre of researchon international trade flows for almost four decades (Harrigan, 2001). Cooperationbetween India and Canada has been thriving for the past several decades. Bothcountries have been engaged in deepening the economic cooperation by engagingin a comprehensive economic partnership agreement. In recent years, both countrieshave been working together to enhance bilateral cooperation in a number of areasincluding trade, investment, education, energy, science & technology andagriculture among others. Both India and Canada have been working in a numberof areas and still there are many opportunities exist for mutual cooperation. Themajor areas where the bilateral relationship can move forward include cooperationin trade and investment, energy, food security, fertilizer, finance, agriculture, etc.Canada can contribute to the ongoing development initiatives that India has in anarray of areas in which India is looking for partnership like the areas of foodsecurity, skills formation, energy cooperation, migration, remittances, innovationand scientific cooperation, etc., among others. In 1998, Canada’s exports to Indiawere just 0.1% of its world exports, while Canada’s imports from India were amere 0.3% of its world imports. Canada ranked 17th among foreign investors inIndia, with only a 1.4% share. By the same token, India’s exports to Canada wereonly 1.6% of its total exports, and its imports from Canada were only 0.8% of itstotal imports. Economic ties were, thus, unable to provide an underpinning ofstability to bilateral political and strategic relations and prevent their deterioration(Rubinoff, 2002). India’s exports to Canada are largely concentrated on the textilesand jewellery. Though the trade between India and Canada is growing in services,manufacturing trade is still very much below its potential. India exports traditionalmedicine and other products to Canada and imports a number of such productsfrom Canada. Besides China, India is a top collaborator for Canadian firms. In therecent years, Indian multinationals have established collaborations with Canadianfirms with the objective of expanding market access in Canada and to learn fromthe Canadian firms. From Canada’s perspective, both India and China appear tobe attractive for promoting bilateral cooperation in S&T. India and China are bothhigh-volume and low-value markets. The motivation for Canadian firms behindchoosing these two markets is basically due to cost advantages (Research andInformation System, 2013).
India–Canada trade is growing, but the relationship is still well below itspotential relative to both the growth of the Indian economy and the performanceof other nations’ trade with India. The current federal government has voiced itsrecognition of the need to expand
Canada’s presence throughout all parts of India, enhance the trade relationship,and encourage Canadians of South Asian background to become more involved

Recent Trends in the Bilateral Trade Engagement of India and Canada � 1647
in Ottawa (Vaidyanath, 2008). During the early to mid-2000s, Canada lagged behindin the growth of exports to India compared with other industrial nations. Forexample, while Australia moved up from India’s eleventh largest importer in 1998–99 to eighth in 2008–09, Canada dropped from twenty-sixth to twenty-eighthposition over the same period (India Department of Commerce 2009). The policymakers must encourage exporters with export promotion schemes such asproviding different export awards, marketing facilities, organizing buyer and sellerinteractions between Indian exporters and overseas buyers in the key markets(Sharma & Dhiman, 2015). As India’s economy continues to expand and Canada’srelative detachment from this emerging economic powerhouse becomesincreasingly apparent, greater attention is being directed at enhancing the flaggingrelationship. Ministerial visits to India in 2009 resulted in high-level discussionsand a commitment from both countries to launch a study group to examine thedevelopment of a Comprehensive Economic Cooperation Agreement (CEPA)(Roberts, 2011). In the Indian textile and clothing industry, it is found that morethan 60% of export value was affected by the Nontariff Measures (NTMs) in USA,EU-25 and Canada at various points in time (Dhiman & Sharma, 2016).
Since 1991, a series of economic reforms and restructuring has led to India’simpressive economic rise, and it remains a stable democracy in an otherwisetroubled region. This has prompted successive governments in Ottawa to re-evaluate and adjust past attitudes and policies towards New Delhi. The commonrefrain in Ottawa these days is that India is a “priority nation” and that the Canadiangovernment wants to broaden the overall bilateral relationship. New Delhi hassignalled restrained optimism at Canada’s interest (Touhey, 2007). In terms ofCanada’s composition of trade, its exports to India are dominated by chemicals,followed by vegetables, fruits and nuts (mostly pulses including dried peas andlentils), pulp and paper products, and machinery and equipment. Other importantexport sectors include metals, transportation equipment and minerals. As Indianconsumption moves up in sophistication, there will be room for robust exportgrowth in knowledge and technology industries. Most of Canada’s imports fromIndia consist of chemical products, textiles and apparel, miscellaneousmanufactured products as well as machinery and equipment. Ferrous and non-ferrous metals, food products and minerals are also important imports (CanadianChamber of Commerce, 2012).
There are several similarities and differences between Canada and India. Whilemost of them are well-known, we begin by highlighting some of the relevant ones.Both Canada and India are geographically large countries. In terms of area, Canadais the second largest country and India is the seventh largest country in the world,while India is the second most populous country in the world. Canada is one of
1648 � Rahul Dhiman, Rajesh Kumar, Sahil Gupta and Munish Kumar
the eight developed nations and one of the soundest economies with skilled workforce in the world. India is just opposite. In terms of education, health care,environment, low crime and violence rate, clean environment, etc., Canada isconsidered as the best place to live in. Since World War II, the impressive growthof the manufacturing, mining and services sector has transformed Canada from alargely rural economy into one primarily industrial and urban. The Indian economy,on the other hand, is still based on agriculture. Unlike India, Canada is an activeforeign investor on the global front. In addition, it receives a high degree of foreigninvestment from all over the world.
The international environment has witnessed numerous changes in the nineties.These are collapse of communism in East Europe and in the Soviet Union, witheringaway of communist bloc, end of cold war, end of military alliances, coming closerof old rivals, disintegration of the Soviet Union, unification of Germany, integrationof Europe, revival of market economy at global level and rise of new centres ofpower, especially economic powers, growing importance of economic factor,emerging of new trade blocs etc. All these changes in international environmenthave their own implications of India-Canada relationship. These changes in globalpolitics have promoted Canada to reconsider its position vis-à-vis India. Emergingmarket, growing business and investment opportunities in India served as greenpastures in Canada’s eyes. On the other hand for India’s sustainable economicdevelopment, infrastructural and technological development and environmentalprotection, Indo-Canadian partnership holds out great promise.
Cordial relations between Canada and India would very much seem to dependmore on the changing world situation than on any factors in Indo-Canadianrelations (Rajan, 1962). In the emerging globalization, the economic factors andmarket forces play a dominant role and these forces may provide an importantbasis for strengthening the Indo-Canadian relations. From missed opportunity inthe past, India-Canada economic relations have found new opportunities to grow.The process of wide-ranging economic reforms in India was initiated in the year1991 and at the time it was christened as the New Economic Policy. The processgot consolidated in the subsequent years and in fact, there are quite a few of itscomponents which are still hanging fire because of continuing slanging matchbetween its proponents and opponents. During the last decade there has been amajor shift in economic policies in our country. It is not only because several policymeasures aimed at liberalization and globalization were initiated during this period,but the trends towards deregulation and ‘opening up’ of the economy were alreadyset in the 1980’s. The real difference between the current reform process and earliermeasures is that the former challenges the very basis of planning and policy makingwhich guided Indian economic development since independence. The Path of

Recent Trends in the Bilateral Trade Engagement of India and Canada � 1649
globalization and economic reforms introduced by India has led to a broadeningof Indo-Canadian economic and commercial relations. India now offers significantopportunities for Canadian trade, investment and tourism. Previous studies(Oskoee, 1991; Chan et al., 2008; Wang, 2013; Yoganandan, 2014; Sharma & Dhiman,2016) conducted on identifying the significant variables that are playing a vitalrole in affecting the exports include a) Exchange rate b) GDP c) Population growthrate of the importers d) Labour costs e) Supply side factors.
The recent foreign trade policies have been useful in facilitating free and flexibletrade with many of the barriers for a number of exportable and importable itemshave gone and the cut in import duties being continued. The new policy has pavedthe way for setting up free trade and warehousing zones. These are aimed at makingIndia a global trading-hub. In these zones foreign direct investment would bepermitted up to 100 percent of the development and establishment costs. The newthrust on service exports in the form of “Served from India” would add the newthrust on services exports and broaden the country from the dominance of IT andsoftware services exports.
The objective of this paper is to examine the trends in bilateral trade betweenthe two nations in recent years and to draw possible implications for future tradeand economic cooperation between the two economies. This paper thus adds tothe growing literature on the comparison of the Canada and Indian economies.
II. THE CANADA-INDIA COMPREHENSIVE ECONOMIC PARTNERSHIPAGREEMENT (CEPA)
In 2009 and 2010, the Canadian Chamber of Commerce called upon the federalgovernment to undertake free trade negotiations with India. That call was heard.On November 12, 2010, Prime Minister Harper and his Indian counterpart, PrimeMinister Singh, announced the beginning of negotiations for a ComprehensiveEconomic Partnership Agreement (CEPA) between the two countries. Thisimportant milestone concludes a cycle of work begun with the Canadian primeminister’s visit to India in November 2009, where the two governments set up aJoint Study Group to examine the feasibility of a CEPA. The negotiation of a CEPAwith India is set to be a lengthy process, taking India’s trade negotiations with theEuropean Union and Australia as benchmarks or comparison. It will be achallenging process given the size and complexity of the Indian market and itsstakeholders.
III. PROBLEM STATEMENT
Trading activities between two nations can definitely act as a catalyst towardsoutput growth of both nations. The present study makes an attempt to study the

1650 � Rahul Dhiman, Rajesh Kumar, Sahil Gupta and Munish Kumar
recent changes in the Indo-Canadian trade in the new economic environment.The broad objective of the study is to understand the composition and direction ofIndia’s Exports and to identify the recent changes those have taken place in thebilateral trade of India and Canada.
IV. OBJECTIVES OF THE STUDY
The objectives of the study are as follows:
a) To study the structure, composition and direction of Indian exports andimports.
b) To study the recent changes in Export & Import that has taken place inthe bilateral trade between India and Canada.
c) To find out the compounded annual growth rates and instability of India’sexport to and import from Canada.
V. RESEARCH METHODS
(a) Nature and Sources of data
The one of the important prerequisite for the analysis part of the study is theavailability of the consistent and easily assessible database. The present study isbased upon the time series secondary data collected from various published sourcesof Government agencies such as Economic Survey, Government of India, Ministryof Finance, New Delhi, Handbook of Statistics on Indian Economy, Reserve Bankof India, Mumbai, official websites of Government of India and Canada.
(b) Period of Analysis
The study broadly covers the period of 20 years from 1995-96 to 2013-14.
(c) Techniques of Analysis
1. Compounded Annual Growth Rates (CAGR): The compounded growth ratesindexes will be calculated using following exponential function,
Yi = a (bi)t
Log Yi = log a + t log (bi )
Where,
Yi = export value/ volume/ unit price of ith item,
t = time variable.
The Annual Growth rate (r) can thus be computed using the formula,
Recent Trends in the Bilateral Trade Engagement of India and Canada � 1651
r = [antilog (log bi) –1]×100
or
r = (b-1) × 100
where, b = Slope of semi-logarithmic trend
2. Export – Instability Index (EII): Instability in various commodities will beexamined by calculating Export Instability Index (EII). Export instability index isdefined as the standard deviation of the observed deviation from the estimatedexponential trend. The instability index has two major advantages. First, this isscale independent and can be used for cross comparisons. Secondly, it estimatesthe coefficient of variation corrected for exponential trend which is useful in policydecisions, on long term basis, as these are taken in terms of growth rates.
2
0
ˆ
100( ) .
ˆ
ˆ ˆ. . it
nit
i
it it it
bit it it i
eExport Instability Index EII
X n k
Where e X X
i e X a e u
Where,
X = mean of the export earnings/volume/unit value
Xit = Actual values of export earnings/volume/unit value
Xit = Estimated values of export earnings/volume/unit value
eit = observed deviation from the exponential trend i.e. differencebetween actual and estimated values of export earnings/volume/unit value
ui = Random term
VI. ANALYSIS OF INDO-CANADIAN TRADE
Since the liberalization, India’s exports and imports have made cumulative progressboth qualitatively and quantitatively. Though the size of foreign trade and its value,both have increased during post-independence era, this increase in foreign tradecan’t be said to be satisfactory because Indian Share in total foreign trade of worldhas remained remarkable. In view of the current wave of worldwide globalization,India has taken major initiatives to diversify its exports as also their destinations,Indian exports cover over 7500 commodities to about 190 countries while importfrom about 140 countries account for over 6000 commodities.

1652 � Rahul Dhiman, Rajesh Kumar, Sahil Gupta and Munish Kumar
Canada and India have longstanding bilateral relations, built upon sharedtraditions of democracy, pluralism and strong interpersonal connections withan Indian diaspora of more than one million in Canada. This expanding bilateralrelationship is supported by a wide range of agreements and by PM Singh andPM Harper’s commitment to increase annual bilateral trade to $15 billion by2015. Canada’s priorities in India include infrastructure, energy, food, education,science and technology. India is an important source country for immigration toCanada. Top Canadian exports to India include vegetables (mostly peas andlentils), fertilisers, paper and paperboard, machinery, wood pulp, precious stones,and iron and steel. Canadian imports from India include organic chemicals,precious stones and metals, knit apparel, woven apparel, machinery, and ironand steel.
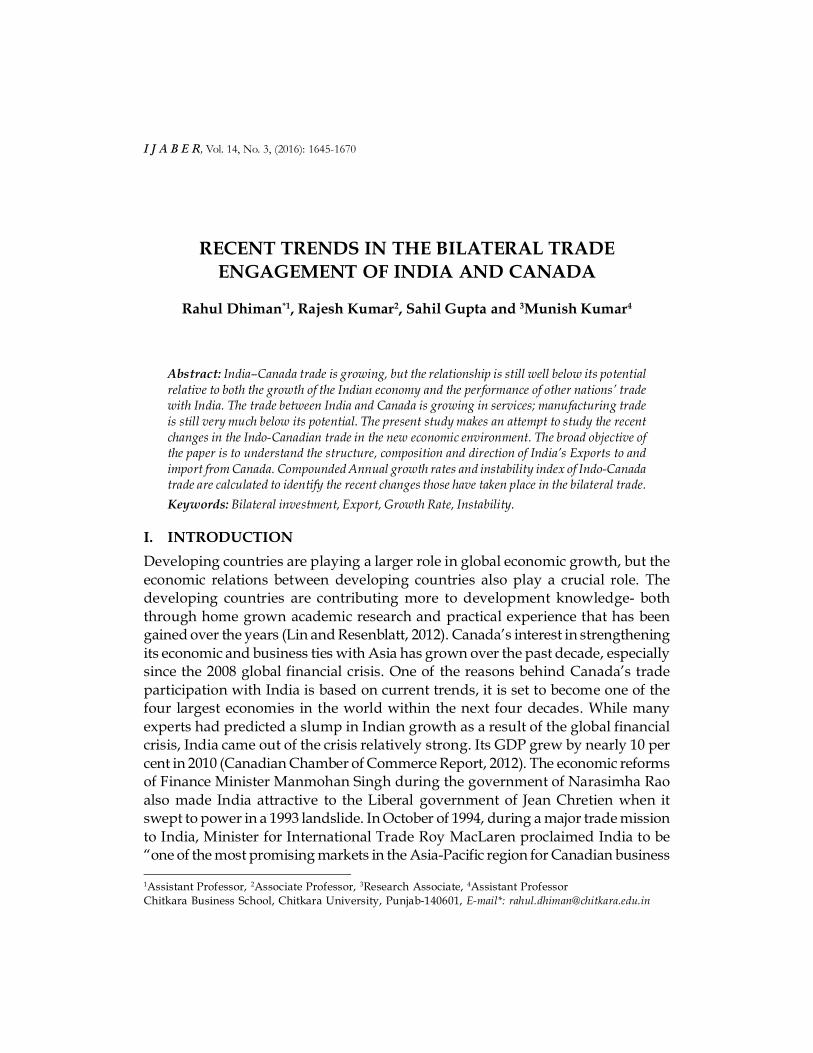
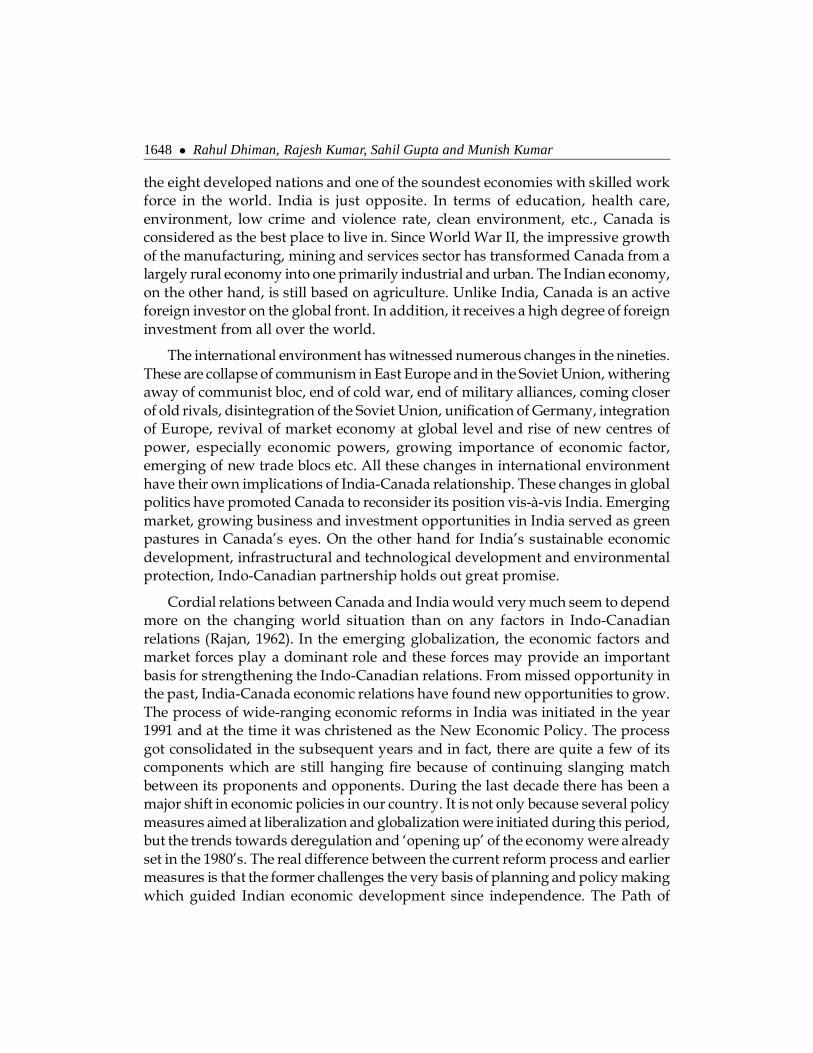
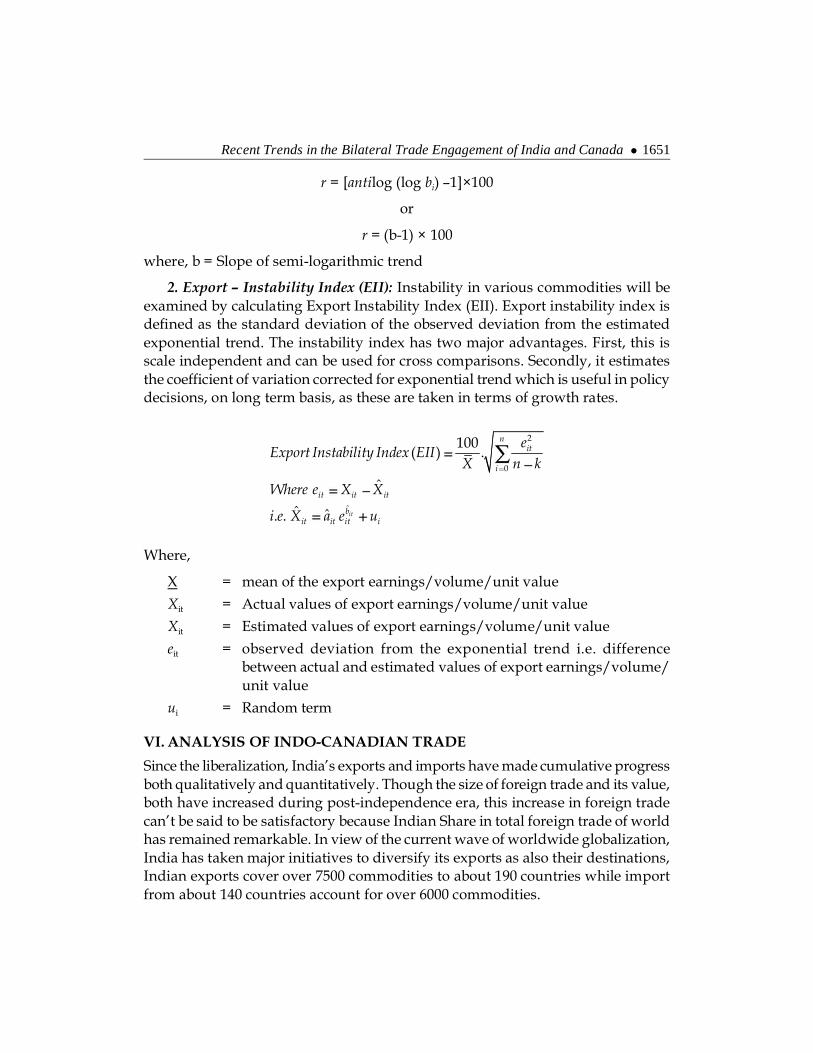
VII. EXPORT STRUCTURE OF INDIA
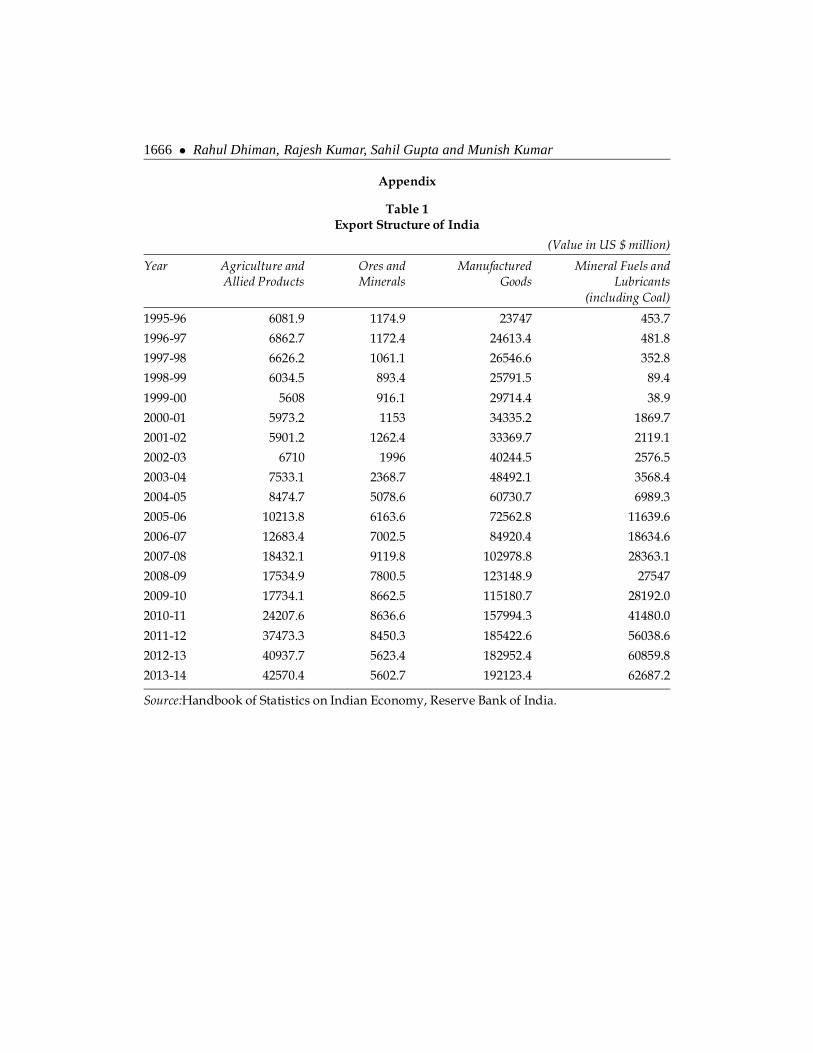
Indian exports structure comprises of different sectors such as Agricultural andAllied products, Ores and Minerals, Manufactured Goods and Mineral Fuels andLubricants (including coal). Table1(See Appendix) reveals that the value of totalagriculture and allied products in the year 1995-96 was US $ 6081.9 andhas increased to US $ 42570.4 million in 2013-14. If we take in considerationOres and Minerals, the value of exports was very less in the beginning andwas around US $ 1174.9 million in 1995-96 and has touched the highestvalue of US $ 9119.8 in 2007-08. Exports of Ores and Mineral again declined toUS $ 5602.7 Million in 2013-14. Moving on to the Manufactured Goods tableshows the increasing trend in the export of manufactured goods and was aboutUS $ 192123.4 Million in the year 2013-14. Fluctuating trend has been noticedin case of Mineral Fuels and Lubricants exports. In 1999-00, it reached to lowestvalue US $ 38.9 million, after then it again paced up and reached to US $ 62687.2 in2013-14.
Also it gets very clear from figures 1(a), 1(b) and 1(c) that share of manufacturedgoods in Total exports have also declined from 1995-96 to 2013-14. In 1995-96manufactured goods had share of 75.5 per cent in total exports and declined to72.1 per cent in 2005-06 and in 2013-14 it was 63.4 per cent only. However agricultureand allied products have shown volatile trend from 1995-96 to 2013-14. In 1995-96share of agriculture and allied products in total exports was 19.3 per cent and in2005-06 it was 10.2 per cent and in 2013-14 it accouted to 14.1 per cent. Fuels andlubricants including coal has shown termendous growth in terms of percentageshare in total exports. Fuels and lubricants including coal had percentage share of1.4 per cent in 1995-96 which rose to 11.6 per cent in 2005-06 and finally it accoutedto 20.7 per cent in 2013-14.
Recent Trends in the Bilateral Trade Engagement of India and Canada � 1653
Figure 1(a)
Figure 1(b)
Figure 1(c)

1654 � Rahul Dhiman, Rajesh Kumar, Sahil Gupta and Munish Kumar
VIII. IMPORT STRUCTURE OF INDIA
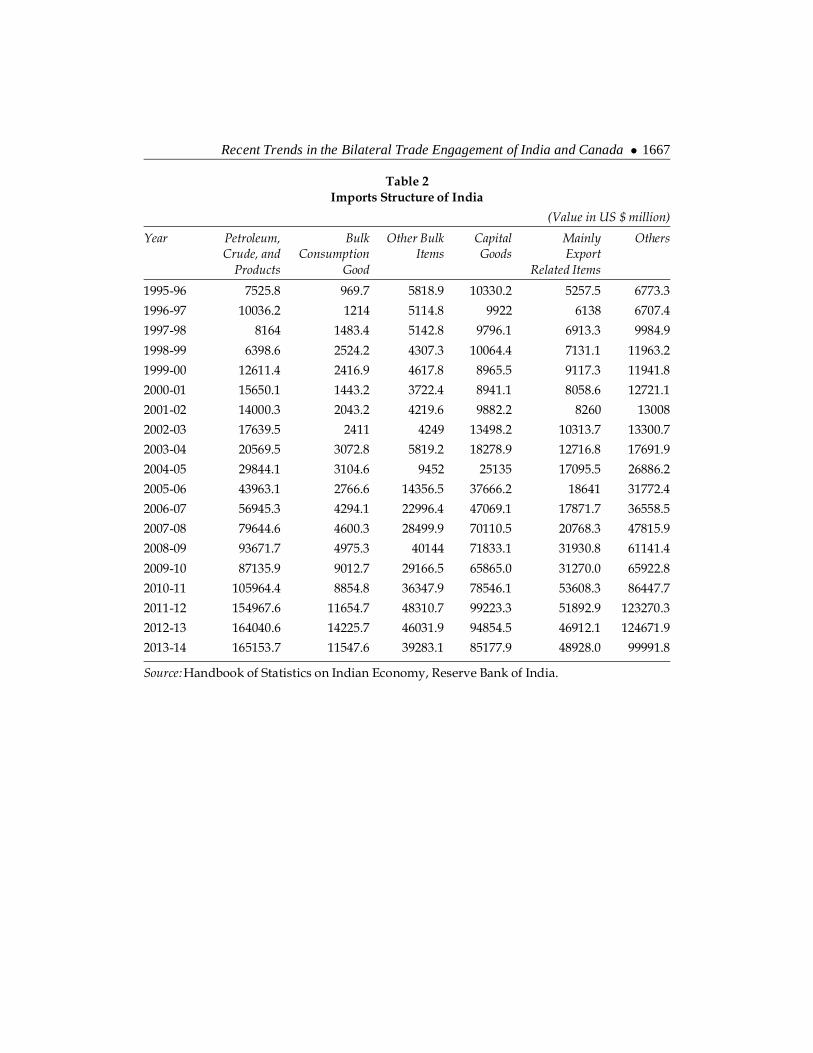
Indian imports comprises of various commodities and are classified in differentcategories like Petroleum crude and products, Bulk consumption goods, Otherbulk items, Capital goods, mainly export related items and other goods and product.
Table 2 (See Appendix) depicts that the value of imports of petroleum, crudeand products in 1995-96 was US$ 7525.8million and has increased to US$ 165153.7million in 2013-14. In addition, major growth was noticed in bulk consumptiongoods, which was US$ 969.7 million in 1995-96 and was US$ 11547.6 Million in2013-14. If we move on to the capital goods, the value of the imports was US$10330.2 Million in 1995-96 and was US$ 85177.9 Million in 2013-14..
IX. DIRECTION OF INDIA EXPORTS
Table 3 (See Appendix) shows India’s major trading partners and their share intotal India’s exports. Figures 2(a), 2(b) and 2(c) also reveals that during 1995-96out of total major trading partners in terms of exports, USA has the highest sharein India’s exports with US $ 5520.4 million followed by Japan with US $ 2215.6million and United Kingdom with US $ 2010.8 million. USA remained highesttrading partner in terms of India’s exports till 2013-14. In the year 2013-14 USAhas the largest share of India’s exports, that is, US $ 39131.1 million, followed byUAE with US $ 30535.1 million and China with US $ 15009.3 million. Trends depictsthat the India’s export with major trading partners, especially with Hong Kong,and Singapore has increased tremendously. If we see the exports with China, it isfound that in the year 1995-96 the total exports was US $ 332.7 million whichincreased to US $ 15009.3 million in the year 2013-14. It generates lot of opportunityfor the development of India’s economic sectors as well as other sectors.
X. DIRECTION OF INDIA IMPORTS
India has taken a number of initiatives to enhance trade in other parts of the worldthrough various trade promotion programmes, which aim to promote trade bygiving market access initiatives, establishing institutional mechanisms such as JointTrade Committees, holding fairs & exhibitions and by granting assistance toexporters to promote trade. Imports to India are governed by the Foreign TradeAct of 1992, which controls India’s exports and imports trade. Its goal is to facilitateimports into and exports out of India. These rules and regulations were furthersimplified by the EXIM policy of 2002-2007.
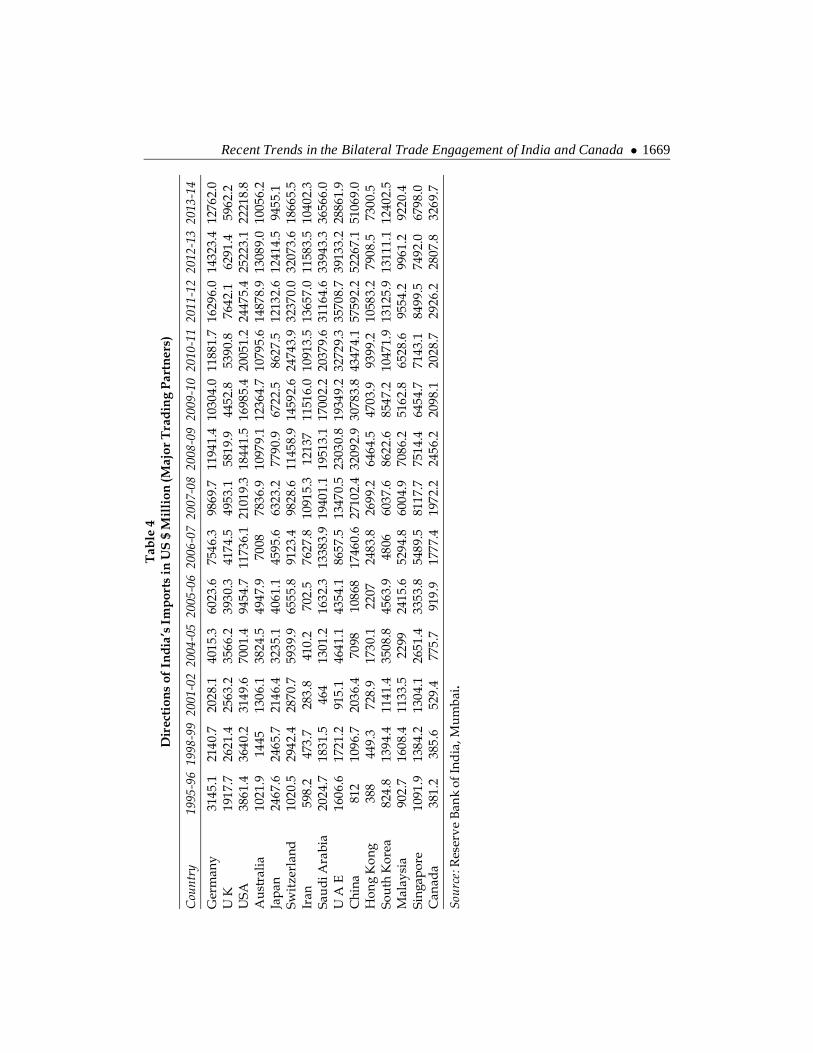
Country-wise share from 1995-96 to 2013-14 of major trading partner in India’sImports has been given in Table 4 (See appendix) and Figure 3(a), 3(b) & 3(c), Outof total imports during the year 1995-96, USA had the major share with US $ 3861.4

Recent Trends in the Bilateral Trade Engagement of India and Canada � 1655
Figure 2(a)
Figure 2(b)

1656 � Rahul Dhiman, Rajesh Kumar, Sahil Gupta and Munish Kumar
Figure 3(a)
Figure 2(c)

Recent Trends in the Bilateral Trade Engagement of India and Canada � 1657
Figure 3(b)
Figure 3(c)

1658 � Rahul Dhiman, Rajesh Kumar, Sahil Gupta and Munish Kumar
million followed by Germany with US $ 3145.1 million and Japan with US $ 2467.6million. During the year 1998-99, again USA had the major share but followed bySwitzerland with US $2942.4 million and United Kingdom with US $2621.4 million.USA remained at the top till 2005-06 with US $ 9454.7 million followed bySwitzerland with 6555.8 million and Germany with US $ 6023.6 million in thesame year. In 2006-07 China got the top position with US $ 17460.6 million andremained at the top till 2008-09. During 2006-07, China is followed by Saudi Arabiawith US $13383.9 million and USA with 11736.1 million. In the year 2013-14 totalshare of China’s imports to India was US $ 51069.0 million followed by SaudiArabia with US $ 36566 and UAE with US $ 28861.9 million.
XI. INDO-CANADIAN ECONOMIC RELATIONS
India and Canada share many of the same values and friendly relations betweentwo countries started even before India attained independence and they furtherflourished in post-independence era. Canada was the first to come with thedevelopment program under Colombo Plan. During 1950’s and 1960’s, Canadawas one of the top three suppliers of India. Both these countries took a leadingrole in bringing democracy in South Africa. The most important link between twocountries is that more than 5 lakh Canadian citizens are of Indian origin.
Various agreements further cemented the ties between two countries. Sinceopening up of the Indian economy from 1991 onwards, these have been atremendous expansion in indo-Canadian commercial relations. In 1997 Canadawas the fifth largest investor in India. Canada has identified energy (includingpower, oil and gas), telecommunications environmental products and services aspriority sector in India for Canadian business.
XII. CHANGING SCENARIO OF INDO- CANADIAN TRADE
Export-Import relations between India and Canada have steadily increased overthe years. India presents a good business opportunity for Canadian companies.Canada can leverage on the growth of infrastructure related sectors in India. InSouth Asia, India is the largest trading partner for Canada. India is capitalizing onits large numbers of well-educated people skilled in the English language to becomemajor exporters of software services and software workers. Software servicesexports have led to creation of knowledge intensive jobs in India. Indian exportsto Canada include readymade garments, textiles, cotton yarn, carpets, gems andjewellery and precious stones, organic chemicals, coffee, spices, light engineeringgoods, iron and steel articles, footwear and leather products. Jobs in Canada relyheavily on the export business. Canada has favourable trade policies for exportsand export oriented production generates jobs. The jobs are many and the export
Recent Trends in the Bilateral Trade Engagement of India and Canada � 1659
businesses have a good web presence. For job seekers and young entrepreneursthis could be a good starting point. As already been pointed out that during 1950’sand 60’s Canada was amongst the three largest suppliers, but its share has declinedconsiderably which special needs attention of policy makers.
XIII. INDIAN EXPORTS TO CANADA
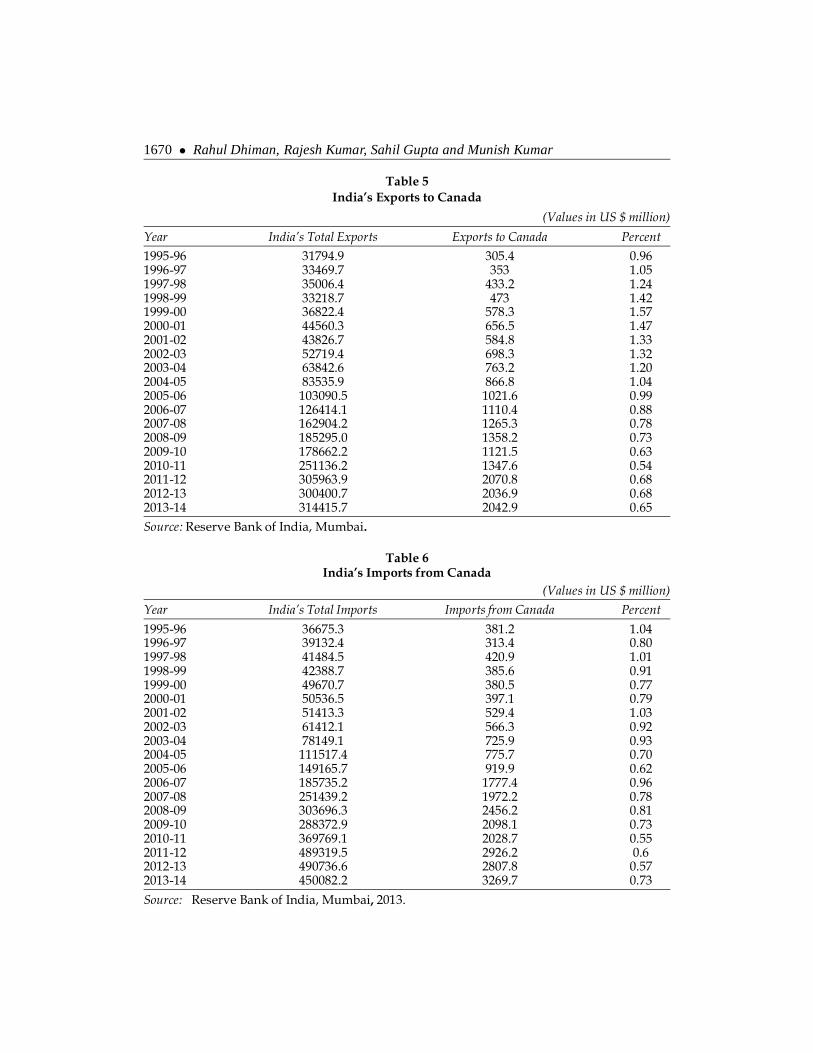
Table 5 (See Appendix) and figure 5(a), 5(b), 5 (c) shows India’s total exports andexports to Canada. The figure shows India’s exports’ are increasing. In 1995-96,the total India’s exports were US $ 31794.9 million which increased to US $ 314415.7million in the year 2013-14. But on the other hand the share of Export to Canadashows both increasing and decreasing trend. Out of total Exports, the percentageof Export to Canada in the year 1995-96 was 0.96 per cent, which increased to 1.57per cent in the year 1999-2000. After this it shows decreasing trend and it decreasedto 0.65per cent in the year 2013-14.
XIV. INDIA’S IMPORTS FROM CANADA
Some major Imports from Canada include newsprint, wood pulp, asbestos, potash,peas, iron scrap, copper, minerals, and industrial chemicals. Overseas investmentceiling of US $100 million has been removed, favouring Indian software companiesto increase FDI in Canada. These Indian companies have expanded their operationsin Canada by setting up software development centers and providing jobs. Table6 explained India’s Imports from Canada. Table 6 (See Appendix) & Figure 6(a),6(b) & 6(c) reveals that India’s total imports show an increasing trend. In 1995-96India’s total imports was US $ 36675.3 million which increased to US $ 450082.2million in the year 2013-14. Out of this total Imports the share of Imports fromCanada shows an uneven trend. In the year 1995-96 the percentage share of India’sImports from Canada was 1.04 per cent which decreased to 0.80 per cent in theyear 1996-97. Again it increased to 1.01 per cent in the year 1997-98. Then itdecreased to 0.91 per cent in the year 1998-99. After this it shows increasing trendand it increased to 1.03 per cent in the year 2001-02. Then again with somefluctuation, it decreased to 0.73 per cent in the year 2013-14. It can be concludedthat the share of India’s Imports from Canada remained under 1 per cent.
XV. COMPOUNDED ANNUAL GROWTH RATES AND INSTABILITY OFINDIA’S EXPORT TO AND IMPORT FROM CANADA
It is quite clear (see table 7) that annual growth rate of India’s Export to Canadafrom 2005-06 to 2013- 14 declined to 9.72 per cent as compared to 11.48 per centfrom 1995-96 to 2004-05. High growth rate of imports from Canada is also seen asimport growth increased to 12.43 per cent in 2005-06 to 2013- 14 as compared to

1660 � Rahul Dhiman, Rajesh Kumar, Sahil Gupta and Munish Kumar
Figure 5(a)
Figure 5(b)
Figure 5(c)

Recent Trends in the Bilateral Trade Engagement of India and Canada � 1661
Figure 6(a)
Figure 6(b)
Figure 6(c)

1662 � Rahul Dhiman, Rajesh Kumar, Sahil Gupta and Munish Kumar
9.35 per cent from 1995-96 to 2004-05. Similarly annual growth rate of import forthe whole period i.e. 1995-96 to 2013-14 also increased to 15.61 per cent whichproves that our import growth is still higher as compared to export growth ratefrom Canada.
Instability in case of Indian exports was low as compared to the importinstability from Canada. Instability accounted to 1.57 per cent for the whole periodi.e. 1995-96 to 2013-14 in case of Indian exports to Canada. But in case of importsfrom Canada instability was found to be 3.26 per cent for the same period. Exportinstability was found to be 1.31 per cent, 1.81 per cent and 1.57 per cent y for theyears 1995-96 to 2004-05, 2005-06 to 2013-1 4 and 1995-96 to 2013-14 respectively.
Table 7Compounded Annual Growth Rate & Instability Index for Exports & Imports
Growth & Instability 1995-96 to 2005-06 to 1995-96 to2004-05 2013-14 2013-14
Export Growth 11.48 9.72 10.73Export Instability 1.31 1.87 1.57Import Growth 9.35 12.45 15.61Import Instablity 2.31 2.70 3.26
XVI . BILATERAL INVESTMENT BETWEEN INDIA AND CANADA
Table 8 reveals that in Indo-Canadian bilateral investment India’s investment hasshown increasing trend i.e. in 2005, in which the India’s investment was C $ 171million which increase to C $ 3776 million in 2013. But in case of Canada’sinvestment it also shows fluctuating trend .i.e. increased from C $ 319 million in2005 to C $ 677 million in 2006, then decrease to C $ 520 million in 2009, and againincrease to C $ 667 million in year 2008, finally it accounted to C $ 613 million in2013.. The total indo-Canadian bilateral investment shows increasing trend fromC$ 490 million in 2005 to C $ 4389 in 2013.
Table 8India-Canada Bilateral Direct Investment
(Value in million Canadian dollars)
Details 2005 2006 2007 2008 2009 2010 2011 2012 2013
India’s Investment in 171 211 1,988 6,514 6,217 4,364 3,730 3,814 3,776CanadaCanada’s Investment 319 677 506 667 520 676 655 641 613in IndiaTotal 490 888 2494 7181 6737 5040 4385 4455 4389
Source: Statistics Canada.
Recent Trends in the Bilateral Trade Engagement of India and Canada � 1663
XVII. CONCLUSION
From the above discussion we can conclude that India’s exports consists of differentsector and from which agriculture and allied products have shown a fluctuatingtrend. In year 2013-14 this sector has shown maximum increase. But in case ofmineral fuel and lubricants (including coal) it has offered fluctuating trend from1991-92 to 1999-2000, thereafter increasing trend has been observed till 2013-14.The import structure comprises of various commodities. The major growth wasshown in case of bulk consumption goods, which was US $ 969.7 million in 1995-96 and was US $ 11547.6 million in 2013-14. In case of India’s exports major tradingpartner was USA from 1995-96 to 2013-14. In the year 2013-14 USA has the largestshare of India’s exports, that is, US $ 39131.1 million, followed by UAE with US $30535.1 million and China with US $ 15009.3 million. But in imports UAE held theposition of major trading partner in import till 2013-14, then USA with US $ 22218.8million, followed by Switzerland with US $ 18665.5 million. Import-Export relationbetween India and Canada has steadily increased over the years. India s exportshave shown an increasing trend since 1995-96. In 1995-96 the total exports of Indiawas US $ 31794.9 million which increased to US $ 314416 million in the year 2013-14.Out of total exports the percentage of exports to Canada in the year 1995-96was 0.96. After this it showed decreasing trend and it decreased to 0.65 per cent inthe year 2013-14 India’s total imports show an increasing trend. In 1995-96 India’stotal imports were US $ 36675.3 million, which increased to US $ 450082 million inthe year 2013-14. Out of this total Imports the share of Imports from Canada hasshown an uneven trend. Indo-Canadian bilateral investment India’s investmentshows increasing trend form year 2005 to 2013. But, in case of Canada’s investmenthas shown fluctuating trend. The global recession in the world economy could becited as one of the major reasons behind the fluctuations.
Indian exports to Canada has not grown that much for the period 2005-06 to2013-14 as compared to 1995-96 to 2004-05. However an alarming situation is incase of Indian imports from Canada which has increased in the same period. Importgrowth rose to 12.45 per cent in 2005-06 to 2013-14 as compared to 9.35 per cent in1995-96 to 2004-05.It simply indicates that our receipts are less as compared to thepayments which is causing the balance of trade in Indian context. Export instabilityhas not increased that much as compared to import instability for different periods.Export instability was only 1.57 per cent for the whole period i.e. 1995-96 to 2013-14, however import instability for the same period was 3.26 per cent which is quitehigh.
XVIII. SCOPE FOR FUTURE RESEARCH
The present study focussed on the structure, composition and direction of bilateraltrade between India and Canada. Compounded annual growth rates and instability

1664 � Rahul Dhiman, Rajesh Kumar, Sahil Gupta and Munish Kumar
index has been calculated to identify the recent changes that has taken place.Instability can occur from several reasons such as demand side and supply sidefactors. Now there are several factors such as increase or decrease in demand,procedural delays etc. which are sub dimensions of both demand and supply sidefactors. So, future researchers are encouraged to find out these determinants whichare the significant contributors towards causing instability in the export and importof bilateral trade between India and Canada.
References
Chan, E.M.H., K.F. Au and Sarkar, M.K. (2008), Antecedents to India’s textile exports: 1985–2005. International journal of Indian Culture and Business Management, 1(3): 265-276.
Charan, D. W. and Woo, Y.P. (2005), Asian regionalism, Canadian and Indian perspectives.New Delhi: APH Publishing Corporation.
Dhiman, R. and Sharma, M. (2016), Textile Exports in South Asia and its determinants: ALiterature Review. Frontiers of New Era for Indian Economy. (pp 244-251). New Delhi:Bharti Publications.
Gupta, D. (2007), Citizens versus people: the politics of majoritarianism and marginalization indemocratic India. Sociology of Religion, 68 (1): 27–44.
Gupta, S. (2006), Foreign direct investment in India: policy reform and politics. Canadian ForeignPolicy, 13 (2): 19–36.
Harrigan, J. (2001), Specialization and the volume of trade: Do they obey the laws? NationalBureau of Economic Research. Working Paper number 8675. Cambridge, MA.
Lin, J. and Resenblatt, D. (2012), Shifting patterns of economic growth and rethinkingdevelopment. Journal of Economic Policy Reform, 15(3): 171–194.
Louis, A. D. (1998), Canada and India: A New Beginning? The Round Table, 345: 57-59.
Malhotra, V.K. (1999), Contemporary Indo- Canadian Relations. New Delhi: Amol PublicationsPvt. Ltd.
Mishra, A. and Prasad, G. (2003), India and Canada: Past, Present & Future. New Delhi: MittalPublications.
Mooney, N. (2006), Aspiration, reunification and gender transformation in Jat Sikh marriagesfrom India to Canada. Global Networks, 6 (4): 389–403.
Oskoee. (1991), Is there a long-run relation between the trade balance and the real effectiveexchange rate of LDCs? Economics Letters, 36: 403-407.
Pendakur, K. and Pendakur, R. (2002), Colour my world: have earnings gaps for Canadian-born ethnic minorities changed over time? Canadian Public Policy/Analyse de Politiques, 28(4):489–512.
Rajan, M. (1962), The Indo-Canadian Entente. International Journal, 17(4): 358-384.
Ravindra, H. D. (2006), Regional Imbalance under Federal Structure: A Comparison of Canadaand India. Vikalpa, 31(4): 1-8.

Recent Trends in the Bilateral Trade Engagement of India and Canada � 1665
Reay, D., Hollingworth, S., Williams, K., Crozier, G., Jamieson, F., James, D. and Beedell, P.(2007), A darker shade of pale? Whiteness, the middle classes and multi-ethnic inner cityschooling. Sociology, 41 (6): 1041–60.
Roberts, W. (2011), Immigration, trade and ‘ethnic surplus value’:a critique of Indo–Canadiantransnational networks. Global Networks, 11 (2): 203-221.
Rubinoff, G. (2002), Canada’s Reengagement with India. Asian Survey, 42 (6): 838-855.
Sharma, M. and Dhiman, R. (2014), Study of Post –Reform Period of Indian Exports: A Review.Review of Business Technology and Research, 11(1): 836-841.
Sharma, M. and Dhiman, R. (2015), Agribusiness Strategies to Promote Exports: An Analysis ofGrowth and Instability. International Journal in Management and Social Science, 3(5): 622-637.
Sharma, M. and Dhiman, R. (2016), Determinants Affecting Indian Textile Exports: A Review.Biz and Bytes. A Journal of Management & Technology, 6(2): 193-199.
Touhey, R. (2007), Canada and India at 60. International journal, 62(4): 733-752.
Vaidyanath, S. (2008), Trade between Canada and India set to burgeon. Epoch Times ParliamentHill.
Wang (2013), The determinants of textile and apparel export performance in Asian countries.Doctoral dissertation, Iowa state University.
Yoganandan. G and Jaganathan, A.T. (2013), Factors Affecting the Export Performance of TextileIndustry in Developing Countries – A Review of Literature. International Journal of Commerce,Business and Management, 2(4): 173-176.
1666 � Rahul Dhiman, Rajesh Kumar, Sahil Gupta and Munish Kumar
Appendix
Table 1Export Structure of India
(Value in US $ million)
Year Agriculture and Ores and Manufactured Mineral Fuels andAllied Products Minerals Goods Lubricants
(including Coal)
1995-96 6081.9 1174.9 23747 453.7
1996-97 6862.7 1172.4 24613.4 481.8
1997-98 6626.2 1061.1 26546.6 352.8
1998-99 6034.5 893.4 25791.5 89.4
1999-00 5608 916.1 29714.4 38.9
2000-01 5973.2 1153 34335.2 1869.7
2001-02 5901.2 1262.4 33369.7 2119.1
2002-03 6710 1996 40244.5 2576.5
2003-04 7533.1 2368.7 48492.1 3568.4
2004-05 8474.7 5078.6 60730.7 6989.3
2005-06 10213.8 6163.6 72562.8 11639.6
2006-07 12683.4 7002.5 84920.4 18634.6
2007-08 18432.1 9119.8 102978.8 28363.1
2008-09 17534.9 7800.5 123148.9 27547
2009-10 17734.1 8662.5 115180.7 28192.0
2010-11 24207.6 8636.6 157994.3 41480.0
2011-12 37473.3 8450.3 185422.6 56038.6
2012-13 40937.7 5623.4 182952.4 60859.8
2013-14 42570.4 5602.7 192123.4 62687.2
Source:Handbook of Statistics on Indian Economy, Reserve Bank of India.
Recent Trends in the Bilateral Trade Engagement of India and Canada � 1667
Table 2Imports Structure of India
(Value in US $ million)
Year Petroleum, Bulk Other Bulk Capital Mainly OthersCrude, and Consumption Items Goods Export
Products Good Related Items
1995-96 7525.8 969.7 5818.9 10330.2 5257.5 6773.3
1996-97 10036.2 1214 5114.8 9922 6138 6707.4
1997-98 8164 1483.4 5142.8 9796.1 6913.3 9984.9
1998-99 6398.6 2524.2 4307.3 10064.4 7131.1 11963.2
1999-00 12611.4 2416.9 4617.8 8965.5 9117.3 11941.8
2000-01 15650.1 1443.2 3722.4 8941.1 8058.6 12721.1
2001-02 14000.3 2043.2 4219.6 9882.2 8260 13008
2002-03 17639.5 2411 4249 13498.2 10313.7 13300.7
2003-04 20569.5 3072.8 5819.2 18278.9 12716.8 17691.9
2004-05 29844.1 3104.6 9452 25135 17095.5 26886.2
2005-06 43963.1 2766.6 14356.5 37666.2 18641 31772.4
2006-07 56945.3 4294.1 22996.4 47069.1 17871.7 36558.5
2007-08 79644.6 4600.3 28499.9 70110.5 20768.3 47815.9
2008-09 93671.7 4975.3 40144 71833.1 31930.8 61141.4
2009-10 87135.9 9012.7 29166.5 65865.0 31270.0 65922.8
2010-11 105964.4 8854.8 36347.9 78546.1 53608.3 86447.7
2011-12 154967.6 11654.7 48310.7 99223.3 51892.9 123270.3
2012-13 164040.6 14225.7 46031.9 94854.5 46912.1 124671.9
2013-14 165153.7 11547.6 39283.1 85177.9 48928.0 99991.8
Source:Handbook of Statistics on Indian Economy, Reserve Bank of India.

1668 � Rahul Dhiman, Rajesh Kumar, Sahil Gupta and Munish KumarT
able
3D
irec
tion
s of
Ind
ia’s
Exp
orts
in U
S $
Mil
lion
(Maj
or T
radi
ng
Part
ners
)
Cou
ntry
1995
-96
1998
-99
2001
-02
2004
-05
2005
-06
2006
-07
2007
-08
2008
-09
2009
-10
2010
-11
2011
-12
2012
-13
2013
-14
Ger
man
y19
77.4
1851
.917
88.4
2826
.235
86.1
3979
.551
16.4
6347
.654
02.9
6745
.379
25.6
7250
.075
15.6
U K
2010
.818
55.4
2160
.936
81.1
5059
.356
1866
98.2
6597
.662
13.0
7307
.886
23.0
8652
.598
31.5
USA
5520
.471
99.6
8513
.313
765.
717
353.
118
866.
120
712
2097
2.3
1947
9.4
2528
6.6
3473
7.9
3616
4.6
3913
1.1
Aus
tral
ia37
5.7
387.
441
872
0.2
821.
292
4.8
1150
1429
.913
82.5
1712
.625
02.0
2351
.423
04.9
Japa
n22
15.6
1652
1510
.421
27.9
2481
.328
62.7
3853
.830
02.1
3613
.350
88.2
6368
.561
05.6
6818
.6Sw
itze
rlan
d28
1.6
319.
140
9.1
540.
947
9.5
466.
561
576
6.5
586.
968
9.5
1102
.111
18.2
1795
.5Ir
an15
515
9.1
253
1231
.411
88.3
1450
.819
48.5
2514
.518
56.4
2488
.324
02.2
3355
.249
21.8
Sau
di A
rabi
a48
2.3
774.
382
6.4
1412
.118
09.8
2588
.237
06.5
4987
.739
10.4
4674
.156
77.5
9785
.912
204.
0U
A E
1428
.318
67.6
2491
.873
47.9
8591
.812
032.
115
626.
923
966.
323
891.
233
770.
335
947.
036
359.
630
535.
1C
hina
332.
742
7.2
952
5615
.967
59.1
8293
.910
828.
892
75.6
1153
2.5
1545
4.3
1829
3.8
1355
8.7
1500
9.3
Hon
g K
ong
1821
.418
80.6
2366
.436
91.8
4471
.346
80.6
6305
.266
07.6
7862
.110
323.
912
911.
812
295.
212
768.
4So
uth
Kor
ea44
8.3
307.
947
1.4
1041
.718
27.2
2514
.728
51.8
3990
.533
99.2
3723
.443
36.4
4206
.842
06.3
Mal
aysi
a39
3.2
321.
777
3.7
1084
.111
61.9
1304
.325
67.6
3431
2846
.338
79.8
3986
.244
37.4
4198
.9Si
ngap
ore
901.
651
7.5
972.
340
00.6
5425
.360
68.9
7367
.582
09.2
7577
.198
17.6
1676
9.3
1359
9.6
1238
1.7
Can
ada
305.
447
358
4.8
866.
810
21.6
1110
.412
65.3
1358
.211
21.5
1347
.620
70.8
2036
.920
42.9
Sour
ce: R
eser
ve B
ank
of In
dia,
Mum
bai.
Recent Trends in the Bilateral Trade Engagement of India and Canada � 1669T
able
4D
irec
tion
s of
Ind
ia’s
Im
port
s in
US
$ M
illi
on (M
ajor
Tra
din
g Pa
rtne
rs)
Cou
ntry
1995
-96
1998
-99
2001
-02
2004
-05
2005
-06
2006
-07
2007
-08
2008
-09
2009
-10
2010
-11
2011
-12
2012
-13
2013
-14
Ger
man
y31
45.1
2140
.720
28.1
4015
.360
23.6
7546
.398
69.7
1194
1.4
1030
4.0
1188
1.7
1629
6.0
1432
3.4
1276
2.0
U K
1917
.726
21.4
2563
.235
66.2
3930
.341
74.5
4953
.158
19.9
4452
.853
90.8
7642
.162
91.4
5962
.2U
SA38
61.4
3640
.231
49.6
7001
.494
54.7
1173
6.1
2101
9.3
1844
1.5
1698
5.4
2005
1.2
2447
5.4
2522
3.1
2221
8.8
Aus
tral
ia10
21.9
1445
1306
.138
24.5
4947
.970
0878
36.9
1097
9.1
1236
4.7
1079
5.6
1487
8.9
1308
9.0
1005
6.2
Japa
n24
67.6
2465
.721
46.4
3235
.140
61.1
4595
.663
23.2
7790
.967
22.5
8627
.512
132.
612
414.
594
55.1
Swit
zerl
and
1020
.529
42.4
2870
.759
39.9
6555
.891
23.4
9828
.611
458.
914
592.
624
743.
932
370.
032
073.
618
665.
5Ir
an59
8.2
473.
728
3.8
410.
270
2.5
7627
.810
915.
312
137
1151
6.0
1091
3.5
1365
7.0
1158
3.5
1040
2.3
Sau
di A
rabi
a20
24.7
1831
.546
413
01.2
1632
.313
383.
919
401.
119
513.
117
002.
220
379.
631
164.
633
943.
336
566.
0U
A E
1606
.617
21.2
915.
146
41.1
4354
.186
57.5
1347
0.5
2303
0.8
1934
9.2
3272
9.3
3570
8.7
3913
3.2
2886
1.9
Chi
na81
210
96.7
2036
.470
9810
868
1746
0.6
2710
2.4
3209
2.9
3078
3.8
4347
4.1
5759
2.2
5226
7.1
5106
9.0
Hon
g K
ong
388
449.
372
8.9
1730
.122
0724
83.8
2699
.264
64.5
4703
.993
99.2
1058
3.2
7908
.573
00.5
Sout
h K
orea
824.
813
94.4
1141
.435
08.8
4563
.948
0660
37.6
8622
.685
47.2
1047
1.9
1312
5.9
1311
1.1
1240
2.5
Mal
aysi
a90
2.7
1608
.411
33.5
2299
2415
.652
94.8
6004
.970
86.2
5162
.865
28.6
9554
.299
61.2
9220
.4Si
ngap
ore
1091
.913
84.2
1304
.126
51.4
3353
.854
89.5
8117
.775
14.4
6454
.771
43.1
8499
.574
92.0
6798
.0C
anad
a38
1.2
385.
652
9.4
775.
791
9.9
1777
.419
72.2
2456
.220
98.1
2028
.729
26.2
2807
.832
69.7
Sour
ce: R
eser
ve B
ank
of In
dia
, Mum
bai.
1670 � Rahul Dhiman, Rajesh Kumar, Sahil Gupta and Munish Kumar
Table 5India’s Exports to Canada
(Values in US $ million)
Year India’s Total Exports Exports to Canada Percent1995-96 31794.9 305.4 0.961996-97 33469.7 353 1.051997-98 35006.4 433.2 1.241998-99 33218.7 473 1.421999-00 36822.4 578.3 1.572000-01 44560.3 656.5 1.472001-02 43826.7 584.8 1.332002-03 52719.4 698.3 1.322003-04 63842.6 763.2 1.202004-05 83535.9 866.8 1.042005-06 103090.5 1021.6 0.992006-07 126414.1 1110.4 0.882007-08 162904.2 1265.3 0.782008-09 185295.0 1358.2 0.732009-10 178662.2 1121.5 0.632010-11 251136.2 1347.6 0.542011-12 305963.9 2070.8 0.682012-13 300400.7 2036.9 0.682013-14 314415.7 2042.9 0.65Source: Reserve Bank of India, Mumbai.
Table 6India’s Imports from Canada
(Values in US $ million)Year India’s Total Imports Imports from Canada Percent
1995-96 36675.3 381.2 1.041996-97 39132.4 313.4 0.801997-98 41484.5 420.9 1.011998-99 42388.7 385.6 0.911999-00 49670.7 380.5 0.772000-01 50536.5 397.1 0.792001-02 51413.3 529.4 1.032002-03 61412.1 566.3 0.922003-04 78149.1 725.9 0.932004-05 111517.4 775.7 0.702005-06 149165.7 919.9 0.622006-07 185735.2 1777.4 0.962007-08 251439.2 1972.2 0.782008-09 303696.3 2456.2 0.812009-10 288372.9 2098.1 0.732010-11 369769.1 2028.7 0.552011-12 489319.5 2926.2 0.62012-13 490736.6 2807.8 0.572013-14 450082.2 3269.7 0.73
Source: Reserve Bank of India, Mumbai, 2013.