recent surface reflectance measurement ... - physics… · –1 day spent in the lab calibrating...
TRANSCRIPT

Recent Surface Reflectance Measurement Campaigns With Emphasis on Best Practices, SI
Traceability and Uncertainty Estimation
NEWRAD 2011 Maui, HI
Dennis Helder1, Kurt Thome2, Dave Aaron1, Larry Leigh1, Jeff Czapla-Myers3, Nathan
Leisso3, Stuart Biggar3, Nik Anderson3
1South Dakota State University, Brookings, SD 2NASA Goddard Space Flight Center, Greenbelt, MD 3University of Arizona, Tucson, AZ

Outline
• Recent Field Campaigns
– 2011 Arizona Round Robin Campaign
– 2010 Tuz Golu Campaign
• Surface Reflectance Measurements
– Arizona: the 48% Tracor tarp
– Tuz Golu: the M1 strip
– Uncertainties and SI Traceability
• Discussion & Conclusions

Problem Statement
• What are the uncertainties associated
with various aspects of the
measurement?
• How can reproducibility of
measurements between groups be
improved?
• What are the best practices for
measuring surface reflectance?

Arizona Round Robin Campaign
• Purpose – To develop consistent procedures for vicarious satellite
calibration methodologies, particularly with respect to surface reflectance measurements
– To improve our understanding of error sources and uncertainties
– To re-calibrate field equipment, primarily Spectralon panels
– To develop methodologies useful for cross-comparison of calibration groups
• Procedure – 1 day spent in the lab calibrating panels
– 2 days spent in the field measuring surface reflectance
• 3 teams participated: University of Arizona, South Dakota State University, and Goddard Space Flight Center

AZ Round Robin Participants
8-9 Mar 2011
ASD Spectrometers: SDSU: 2 UofA: 2 GSFC: 1
Spectralon Panels:
SDSU: 1 UofA: 1 GSFC: 1

Surface Reflectance Measurement Procedures
• Instrumentation: – ASD Spectrometers – Spectralon Reflectance
Panels – Natural and man-made
targets
• Procedures: – Warm up ASD’s for two
hours – Begin at specified time
(illumination geometry) – Begin measurements
• Measure calibration panel
• Measure next target
• Repeat
– All target measurements made 2-3 times
– 45 minutes per data collect
• Site Location/Conditions – U of Arizona campus green – Sky condition: Severe Clear
(Photos courtesy of
Nathan Leisso, U. of AZ)
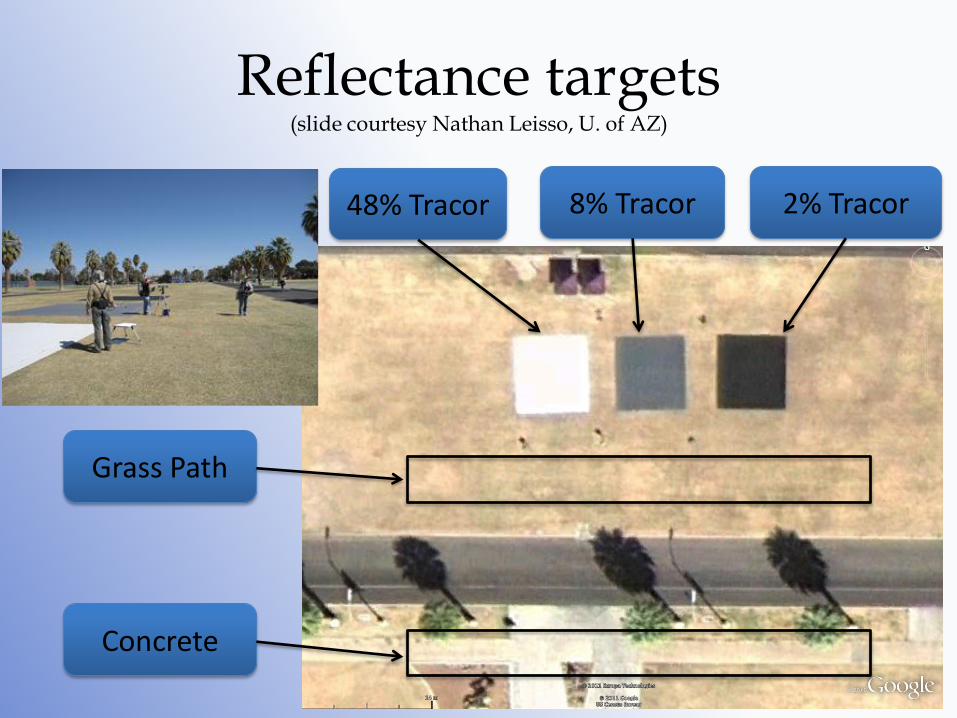
Reflectance targets
(slide courtesy Nathan Leisso, U. of AZ)
48% Tracor 8% Tracor 2% Tracor
Grass Path
Concrete

Questions to address:
• How repeatable is a surface reflectance measurement by one operator, one instrument, on one date?
• How reproducible is a surface reflectance measurement by one operator, one instrument, multiple (2) dates, one illumination geometry?
• How reproducible is a surface reflectance measurement by 2 operators, 2 instruments, one date?
• How reproducible is a surface reflectance measurement by 2 operators, one instrument, multiple (2) dates, one illumination geometry?
• How reproducible is a surface reflectance measurement by 3 operators, two instruments, multiple (2) dates, one illumination geometry?

One Operator, One Instrument, One Date (Mar 8)
• Note the high reflectance of the tarp.
• Each measurement comprised of approximately 30 spectra. 1σ ≤ 0.2 (≈ 4% inVNIR)
• Type A standard uncertainty is <1%
• Most highly trained operator using our ‘best’ ASD.

One Operator (#2), One Instrument, One Date (Mar 9)
• Similar to previous, except Operator #2, ASD 6219
• Note similar standard deviations of measurement, solid at 0.02 absolute units.
• Note Type A Standard Uncertainty at 1%, (except at ends of spectrum approaching 1.5%).

One Operator, One Instrument, Two Dates (Mar 8-9)
• Top chart indicates all 5 tarp
reflectance measurements made
during the two day period.
• Standard deviations of
measurements on the second day
were similar to the first day.
• Type A Standard Uncertainty at
1% except for shortest
wavelengths
• Bottom chart shows average
reflectance measurements
(red/blue curves) obtained on the
two days.
• Reproducibility is indicated by the
green curve with better than1%
agreement at all but the shortest
wavelengths.
– Observed even at longer
wavelengths where tarp
reflectance is much lower.

Two Operators, Two Instruments, One Date (Mar 8)
• Two operators, using two ASDs simultaneously 1400 local time. – Both experienced
operators – Operator 1 carried
‘pristine’ ASD; Operator 2 carried ‘backup’ ASD.
• Strong agreement between operators, especially in the SWIR.
• Type A Std. Unc. = 1%
• Reproducibility with this scenario increases to 2% as indicated by green curve.
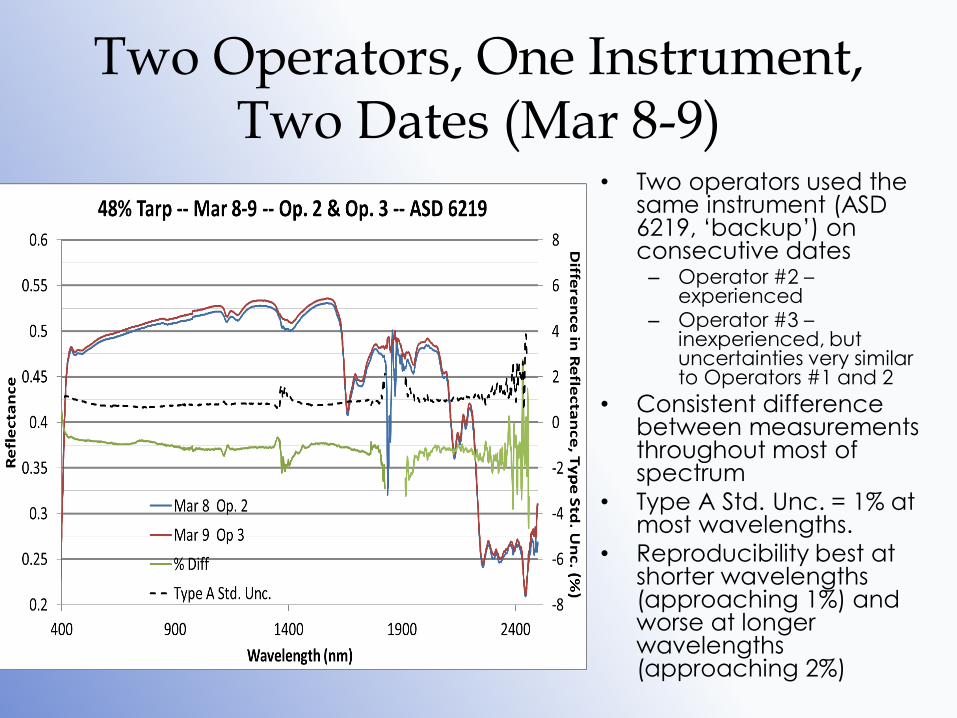
Two Operators, One Instrument, Two Dates (Mar 8-9)
• Two operators used the same instrument (ASD 6219, ‘backup’) on consecutive dates – Operator #2 –
experienced – Operator #3 –
inexperienced, but uncertainties very similar to Operators #1 and 2
• Consistent difference between measurements throughout most of spectrum
• Type A Std. Unc. = 1% at most wavelengths.
• Reproducibility best at shorter wavelengths (approaching 1%) and worse at longer wavelengths (approaching 2%)

Three Operators, Two Instruments, Two Dates (Mar 8-9)
• Overall combination of all operators, instruments, and dates. – Consistent reflectance
measurements made by all three operators.
• Type A Std. Unc. < 1.5% and approaching 1% at some wavelengths.
• Reproducibility of measurements clearly under 2% and approaching 1% at longer wavelengths.

AZ Round Robin Reproducibility Summary
Situation Reproducibility Comments
One operator, one
instrument, one day
Approaching 1% Slightly worse at shorter
wavelengths.
One operator, multiple
dates
1%
Two operators, one
instrument, two dates
1-1.5% Better at shorter, worse
at longer wavelengths.
Two operators, two
instruments, single
date
2% Slightly worse at shorter
wavelengths.
Two operators, two
instruments, multiple
dates
2% Slightly worse at shorter
wavelengths.
Three Operators, two
instruments, two dates
1-2% Worse at shorter,
better at longer
wavelengths.

Arizona Round Robin Calibration Panel Uncertainties
• Panel calibration performed in U of Arizona’s cal lab. – Data courtesy of Stu Biggar
• Uncertainty is spectrally dependent – Lamp current uncertainties
– Instrumentation uncertainties
• Uncertainties range from 1.0 to 1.7% • A combination of both Type A and
Type B uncertainties.
Spectralon Panel Calibration: % Uncertainty
Wavelength 445 485 560 657 863 1372 1611 2206
Lamp effects
Stray light 0.5 0.5 0.5 0.5 0.5 0.5 0.5 0.5
Lamp current uncertainty 0.07 0.06 0.05 0.04 0.03 0.02 0.02 0.01
Lamp current stability 0.09 0.08 0.06 0.05 0.04 0.02 0.02 0.01
Lamp current uncertainty 0.07 0.06 0.05 0.04 0.03 0.02 0.02 0.01
Lamp current stability 0.09 0.08 0.06 0.05 0.04 0.02 0.02 0.01
Alignment 0.4 0.4 0.4 0.4 0.4 0.4 0.4 0.4
Lamp ageing and drift 0.5 0.4 0.3 0.2 0.15 0.1 0.1 0.1
Reference effects
RF spectral change 0.1 0.1 0.1 0.1 0.1 0.1 0.1 1.0
NIST uncertainty in RF 0.33 0.33 0.33 0.33 0.33 0.31 0.31 0.33
Instrumentation
Spectral uncertainty 0.5 0.4 0.2 0.16 0.13 0.1 0.1 0.1
HP34970A/Lock-in uncertainty
0.03 0.03 0.03 0.03 0.03 1.0 1.0 1.0
Detector/amplifier SNR 0.5 0.45 0.4 0.3 0.3 0.1 0.1 0.1
Detector/amplifier SNR 0.5 0.45 0.4 0.3 0.3 0.1 0.1 0.1
Stability 0.2 0.2 0.2 0.2 0.2 0.2 0.2 0.2
Repeatability 0.5 0.5 0.5 0.5 0.5 0.5 0.5 0.5
Transmittance 0.1 0.1 0.1 0.1 0.1 1.0 0.1 0.1
Total 1.4 1.3 1.1 1.0 1.0 1.7 1.4 1.7
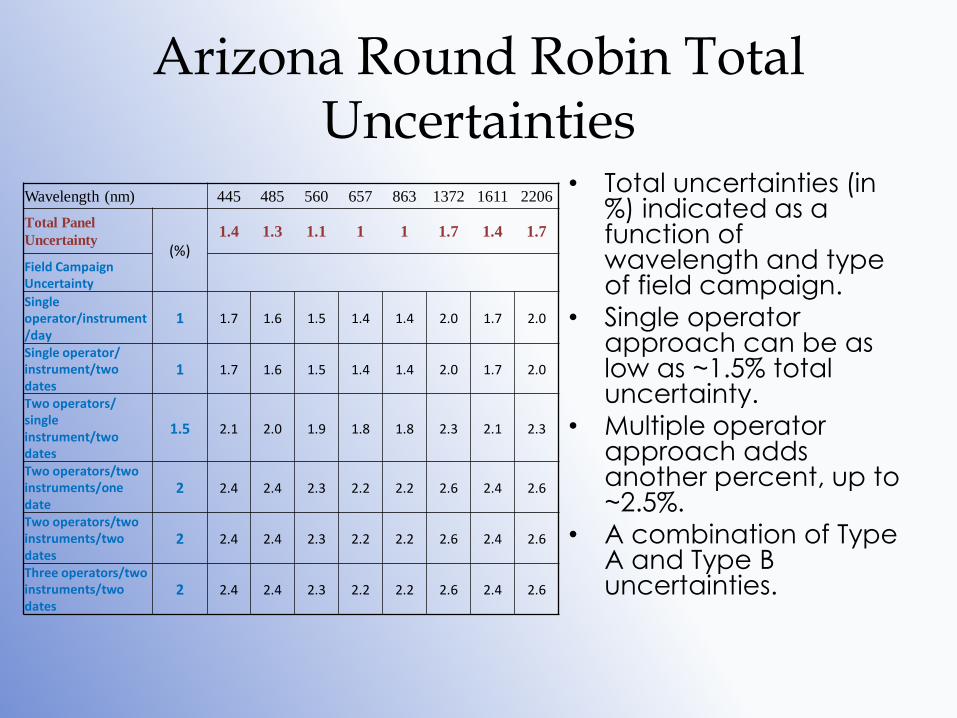
Arizona Round Robin Total Uncertainties
• Total uncertainties (in %) indicated as a function of wavelength and type of field campaign.
• Single operator approach can be as low as ~1.5% total uncertainty.
• Multiple operator approach adds another percent, up to ~2.5%.
• A combination of Type A and Type B uncertainties.
Wavelength (nm) 445 485 560 657 863 1372 1611 2206
Total Panel
Uncertainty (%)
1.4 1.3 1.1 1 1 1.7 1.4 1.7
Field Campaign Uncertainty
Single operator/instrument/day
1 1.7 1.6 1.5 1.4 1.4 2.0 1.7 2.0
Single operator/ instrument/two dates
1 1.7 1.6 1.5 1.4 1.4 2.0 1.7 2.0
Two operators/ single instrument/two dates
1.5 2.1 2.0 1.9 1.8 1.8 2.3 2.1 2.3
Two operators/two instruments/one date
2 2.4 2.4 2.3 2.2 2.2 2.6 2.4 2.6
Two operators/two instruments/two dates
2 2.4 2.4 2.3 2.2 2.2 2.6 2.4 2.6
Three operators/two instruments/two dates
2 2.4 2.4 2.3 2.2 2.2 2.6 2.4 2.6
Comparison to the 2010 Tuz Golu Field Campaign
--following 6 slides courtesy of
Larry Leigh
Tuz Gölü Campaign Overview • CEOS field campaign which took place Aug 13 – 23, 2010
• Consisted of 13 different teams from across the planet.
• Primary goals, – Evaluate differences in field instrument primary calibrations
– Evaluate differences in methods for characterizing and assigning “radiometric value” to a site, for multiple view angles
– Establish formal traceability of Tuz Gölü reference site based on an evaluation of all comparison results.
– Establish “best practice” guidance for above and/or knowledge of variance between methodologies.
– Provide a multi-satellite sensor comparison linked to the ground calibration derived from the multi-team comparison.
– Identify the minimum and ideal specifications for characterization/instrumentation for a CEOS “reference standard”

Tuz Gölü Campaign Overview • Located in central Turkey.
– 1 hour north of Aksaray, about 2 hours south of Ankara.
– Salt flat at an elevation of about 3000 ft.
– Covering an area of 14 miles wide x 22 miles long
– Covered with water for most of the year.
– Bright in the short wavelengths.

Tuz Gölü Spectral Reflectance Study • Primary Goal was to develop a comprehensive understanding
of: – best practices for surface measurements
– uncertainties associated surface measurements
– The absolute ground level spectral reflectance of the site
– The variability in reflectance both spatially and temporally
• The site measurement phase of the study commenced with identifying, marking, and subsequently measuring a series of sub-sites on the Tuz Golu salt flat. These sub-sites were identified as: – M1 mini-strip - for temporal analysis
– M1 test site - for small scale variability
– M1-M9 test sites - for larger scale variability
• A more detailed description of the sub-sites and studies follows.

• To characterize short term temporal site stability and measurement uncertainty the small “M1 mini-strip” was used. – To reduce illumination angle differences and BRDF effects,
acquisition of the M1 mini-strip data was restricted to 10:45-10:50am
– The collection of data was confined to a precise 30 meter by 5 meter location. • 30 spectra “in motion” were taken down the center of the
strip • This site was knowingly selected to be “pristine”
– Maximal uniformity – Minimal degradation from traffic – Minimal “blemishes”
Tuz Gölü Spectral Reflectance Study: Short Term Stability Study: M1 min-strip

• Reflectance from 9 days of collection over M1 mini-strip show very good repeatability – For short wavelengths reflectance varies from 0.40 – 0.60. – For longer wavelengths reflectance drops off to 0.05 – 0.15
Tuz Gölü Spectral Reflectance Study: Short Term Stability Study : M1 mini-strip
Note similarity to Tracor tarp reflectance in the VNIR, but in the SWIR Tuz Golu is a much darker target!

• Reflectance variability for ‘limited location, limited time’ study is on the order of 0.01 reflectance units. – 8 days of consecutive data is shown – Black lines represent absolute standard deviation
• +/- 0.01 in reflectance
Tuz Gölü Spectral Reflectance Study: Short Term Stability Study : M1 mini-strip
Dev
iati
on
fro
m M
ean
Ref
lect
ance
(A
bs.
Un
its)
±0.01 absolute ≈ 2% uncertainty in VNIR
±0.01 absolute ≈ 7% uncertainty
±0.01 absolute ≈ 12.5% uncertainty

Comparison of Repeatability between AZ and Tuz Golu Field Campaigns
• Tuz Golu results on the left are very similar to the AZ results on the right – Tuz Golu M1 Strip measured over 8 days – AZ Tracor Tarp measured over 2 days – Same operator, same instrument (ASD 16004)
• In terms of absolute units, repeatability of the measurements are similar, with perhaps some advantage with the Tracor tarps.
• Reproducibility is 0.01 or less with σ = 0.005 or better.
De
via
tio
n fro
m M
ea
n R
efle
cta
nc
e (A
bs.
Un
its)

Discussion
• AZ Round Robin – Conducted under very good sky conditions
– Demonstrates the capability of experienced operators
– Advantages with bright, spectrally flat target
– Exact sources of uncertainties remain • ASD stability • Operator stability/repeatability • Degradations of target during campaign (debris) • Small atmospheric changes?
• Tuz Golu Campaign – Conducted under more variable sky conditions
– Advantages of very large, uniform target • However, target was dark in the SWIR
– Same operator/instrument within 6 months makes an excellent comparison
– Sources of uncertainty likely very similar to AZ campaign

Conclusions
• Type A uncertainties consistently around 1%, worst case (3 operators) still under 1.5%
• Field reproducibility can be as good as 1% – Single operator/instrument: 1%
– Multiple operators/instruments: 2%
– Normally under 0.01 reflectance units (abs.) at all wavelengths independent of target reflectance
• Calibration panel uncertainty (Type B?): 1-1.7% (wavelength dependent). • Total uncertainty can approach 1.5% for certain wavelengths and be as large as
2.5% for other wavelengths. • These results demonstrated by experienced teams with good field conditions. • Results using Tracor tarps suggests a means for comparing teams worldwide
– Rather than bringing teams to a common site, a common target can be shipped to the teams.
– Each team can measure tarp reflectance using their instrumentation and calibration standard.
– Care must be taken during shipment of deployment of tarps to maintain spectral reflectance properties.
– Virtual Round Robin campaigns could be conducted on regular (annual or bi-annual) basis to develop short and long term comparisons