recent headlines - savi.org · recent headlines •frustrated with a summer of violence. •crime...
TRANSCRIPT


RecentHeadlines
• Frustrated with a summer of violence.
• Crime is destroying communities.
• Surge of violence in Indianapolis.
• Vandalism on the rise.
• Stop the gun violence.

OurQuestions
• How have crime rates changed over time?
• How does the type of crime differ?
• How do crime rates vary by geography?
• Does the perception of crime match the reality?
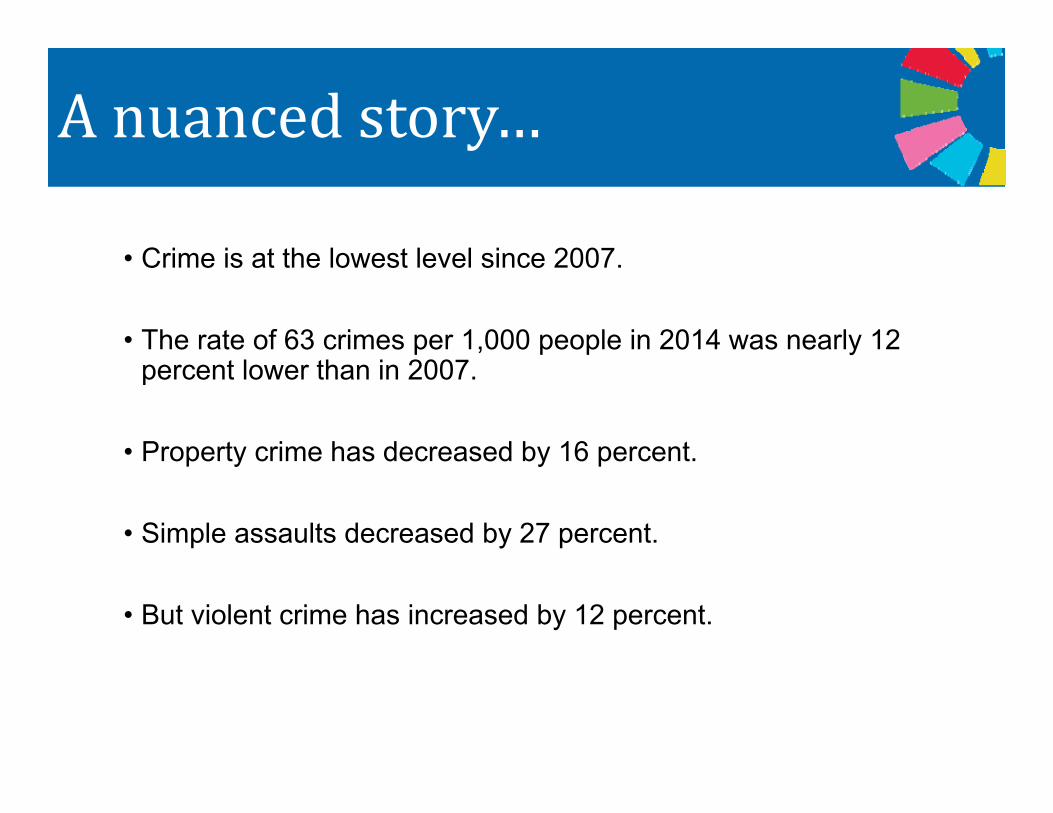
Anuancedstory…
• Crime is at the lowest level since 2007.
• The rate of 63 crimes per 1,000 people in 2014 was nearly 12 percent lower than in 2007.
• Property crime has decreased by 16 percent.
• Simple assaults decreased by 27 percent.
• But violent crime has increased by 12 percent.
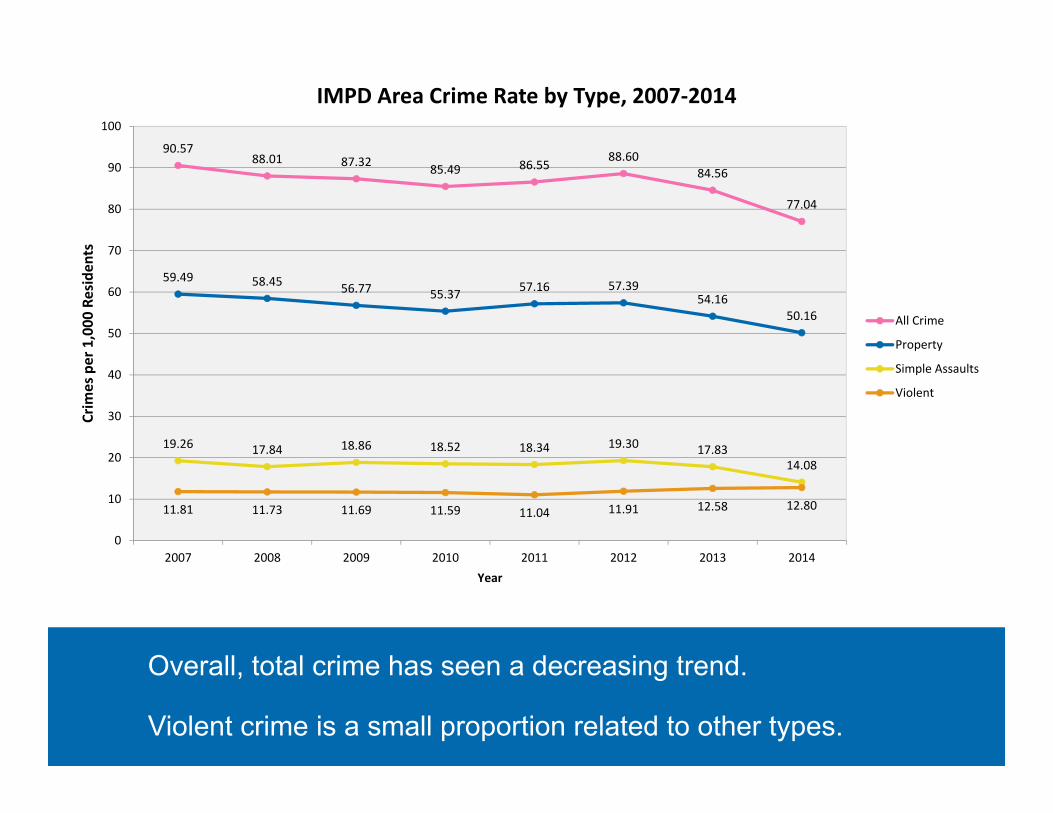
Overall, total crime has seen a decreasing trend.
Violent crime is a small proportion related to other types.
90.5788.01 87.32 85.49 86.55
88.6084.56
77.04
59.49 58.45 56.77 55.37 57.16 57.3954.16
50.16
19.26 17.84 18.86 18.52 18.34 19.30 17.8314.08
11.81 11.73 11.69 11.59 11.04 11.91 12.58 12.80
0
10
20
30
40
50
60
70
80
90
100
2007 2008 2009 2010 2011 2012 2013 2014
Crim
es per 1,000
Residen
ts
Year
IMPD Area Crime Rate by Type, 2007‐2014
All Crime
Property
Simple Assaults
Violent
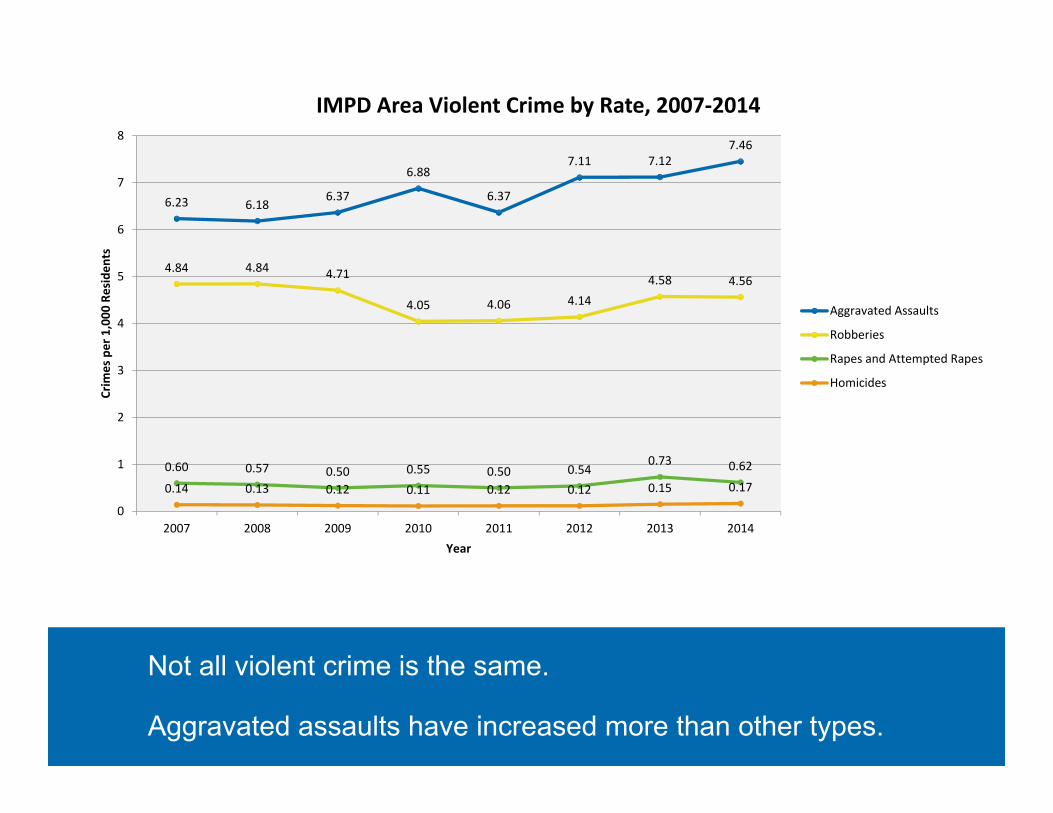
6.23 6.186.37
6.88
6.37
7.11 7.127.46
4.84 4.84 4.71
4.05 4.06 4.144.58 4.56
0.60 0.57 0.50 0.55 0.50 0.540.73 0.62
0.14 0.13 0.12 0.11 0.12 0.12 0.15 0.17
0
1
2
3
4
5
6
7
8
2007 2008 2009 2010 2011 2012 2013 2014
Crim
es per 1,000
Residen
ts
Year
IMPD Area Violent Crime by Rate, 2007‐2014
Aggravated Assaults
Robberies
Rapes and Attempted Rapes
Homicides
Not all violent crime is the same.
Aggravated assaults have increased more than other types.
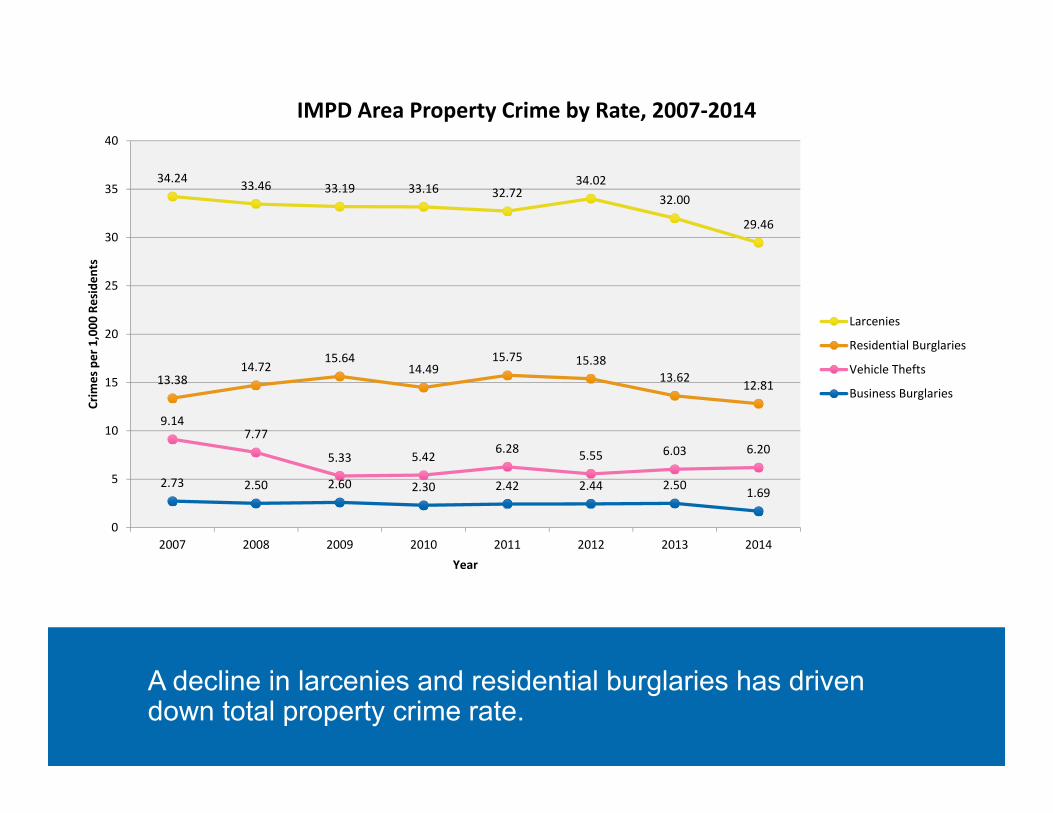
34.24 33.46 33.19 33.16 32.7234.02
32.00
29.46
13.3814.72
15.6414.49
15.75 15.3813.62 12.81
9.147.77
5.33 5.42 6.28 5.55 6.03 6.20
2.73 2.50 2.60 2.30 2.42 2.44 2.50 1.69
0
5
10
15
20
25
30
35
40
2007 2008 2009 2010 2011 2012 2013 2014
Crim
es per 1,000
Residen
ts
Year
IMPD Area Property Crime by Rate, 2007‐2014
Larcenies
Residential Burglaries
Vehicle Thefts
Business Burglaries
A decline in larcenies and residential burglaries has driven down total property crime rate.

Geographymatters.
The possibility of becoming victim of crime is not the same for everyone.

The geographic distribution of crime shows wide variation from neighborhood to neighborhood.

Areas with malls, such as Lafayette Square and Keystone at the Crossing tend to have higher property crime rates.

Violent crimes show a different distribution in an east‐west band north of downtown.

Of 94 neighborhoods, 15 experienced an INCREASE in total crime while the remaining 79 experienced a DECREASE.

SocioeconomicContext
Low crime census tracts
High socio‐economic status
High crime census tracts
Low socio‐economic status

Comparing socio-economic factors of high-crime areas to low-crime areas reveals the following about high-crime areas:
• Crime rate is 6 times higher
• Poverty rate is 4 times higher
• Unemployment rate is nearly 3 times higher
• There are 3 times as many people with no high school diploma
• Bachelor degree attainment is almost half that of adults in low-crime areas
• Per capita income is half that of low-crime areas
Conclusions