recent financial innovations: have they distorted the
TRANSCRIPT
Recent Financial Innovations: HaveThey Distorted the Meaning of Ml?JOHN A. TATOM
EDWATCI-IERS and economic policvniakershave been sorely taxed by financial innovations inrecent years.1 Attempts to assess both the appro-
priate narrow monetary aggregate and its growthhave been complicated by the introduction of newtypes of checkable deposits and new definitions ofthe narrow aggregate.2
In November 1978, automatic transfer services(ATS) were legalized nationwide, allowing check-able deposits to be held in savings accounts. InOctober 1979, the Fed changed its monetary policy
procedures to better control the growth of monetaryaggregates and, four months later, redefined themonetary aggregates. In January 1981, negotiableorder of withdrawal (NOW) accounts became legalnationwide. The flood of Rinds to these accounts from
demand deposits led to a wide divergence in thegrowth rates of the newly defined aggregate M1B,which included both demand deposits and othercheckable deposits like ATS and NOW balances,and NI IA, which excluded the latter ha]ances.
Further complicating the problem of assessing thegrowth of a narrow aggregate and its implications,the Board of Governors of the Federal RcserveSystem introduced a shift adjustment of NI lB in re-
sponse to the nationwide introduction of NOWaccounts. For monetary control, the narrow aggre-gate target for 1981 was stated in tenns of this newmeasure b the Federal Open Market Committee.The shift adjustment was intended to remove thedistorting effects on M lB growth of shifts of non—
‘See especially, Keimeth II. Bacon, “Fed in a Fix,’’ W0
ii StoatJon n,oi, january 22. 1982, br a discussion of recent innovationsand some of the eoufnsiun felt by pobcvmakers. Also, a gelieralchscussion of past financial innovations and the potentialpml lie Ins for mea SI Ire, e it an ci po icy earI bc louor! in BarbaraBennett and joseph Bisignano, ‘‘Apples. Oranges. am
1Money: I
and Applies Oranges, anci NI oim V I I - Fedc cal Reserve Batik ofSan Fran ci s en U rr kit La / tee, january 22 an ci 29, 1982.
Ia crowaggrc’gate is a m eas Ii I’d’ I Ifthe ,ilOm,ev stiiek or Inuris halci
as ni c-clma of c’s cii angc’. A b ri lacier aggregate imici’ides, iii add i ti on,other highly liquid funds that arc, held at financial institutions.
transactions or savings balances into that aggregate.In January 1982, the distinction between NI IA andM lB was dropped sothat today one aggregate, Ml, isused for a narrow aggregate target. The new NIlmeasure is the same as the NI I B measure (not shift—adjusted) used in 1981.
This article examines the effect ofthe 1981 shift toNOW accounts on the monetary aggregates and itsimplications. The experience with the introductionofATS accounts is also reviewed, since some of theissues raised by shifts to NOW accounts applied toATS.
Whether M1B, shift-adjusted M1B, or M1A isconsidered the relevant narrow aggregate formonetary policy is important in evaluating the di-rection of policy. For example, while all threemeasures slowed in 1981, the extent of the slowingdiffered widely. Slower growth of the money stockcauses slower growth of total spending in theeconomy and, after a period of tune, reduced in-flation. Thus, the extent of slowing in spending andinflation that can he expected fi’omn monetary actionsin 1981 depends on which measure of the narrowaggregate most closely corresponds to narrow ag-gregate measures that existed prior to the intro-duction of nationwide NOW accounts.
Clearly, many finfnlcial innovations have con-cerned economic analysts. None, however, have soaffected the measurement and assessment of narrowmonetary aggregates as the introduction of A”lS andNOW, In addition, most other innovations generallyhave predated the changes mentioned above; th ,seother innovations have had greater effects ~n creditmarkets and broader monetary aggregates than onthe demandl and supply of transactions balances. Forexample, in 1981 considerable attention was paid tothe accelerating andl above—target growth of thebroad aggregate M2 (NI lB plus small time andsavings, money market mutual fund shares, over-night repurchase agreements (RPs) at commercialbanks, and overnight Eurodollar deposits of U.S.
23

FEDERAL RESERVE BANK OF St LOUIS APRIL 1982
nonbank residents at Caribbean branches of mnem-her banks).3 The M2 acceleration is relatedl to thegrowth ofmoney market mutual funds, an innoyationdating hack to the early ‘70s. Neither the growth ofM2 nor money market mutual funds is discussedhere.~
TlIE lIT S EXPERIENCE
Before the automatic transfer service for savingsdleposits at commercial banks was introduced, theonly transaction accounts at commercial banks thatwere not classified as demandl dleposits were NOWaccounts in New England.5 The shift to ATS ac-counts had two i nportant effects on the money sup-
ply process. First, as transactions balances wereshifted from demand deposit accounts into ATSaccounts, a narrow monetary aggregate like the oldiMl or M1A, which both exclude ATS balances,tended to fall; a broader measure such as current NIl(Ni 1B) or M2, which include ATS balances, was notaffected for definitional reasons.°
Second, the introdluction ofATS changed the totalrequired reserves of commercial banks. Depositsheld in ATS accounts-at member banks were subjectto the requiredl reserve ratio for savings dieposits,instead of the higher required reserye ratio fordemand deposits. As a result, the moyement of fundsfrom demand dleposits into ATS accounts tendled toreduce the required reserves in the banking system.This redltmction in redluiredl reserves, as expected, ledto increases in N-I lB and N’12, and partially offset the
1ln 1982 this incascm cc was ciIangad to ccxcii ide scm‘lice 1110 ne yniarkcet muttIa! fdi nd Iadaim ci’s - Only gail acal pu 1110 Se anci broker!dealer hal amices are included,
4Th a pm-i mar reason for igmm 0 ciiig the grt)dvth of M2 in 1981 is that itis not cicisely related to spemmd ing or inflation - For example, Nl2growth slowed steadily from 1976 to 1980, whiic- spenchng andinflatiom, accelerated. in 1980—S 1,M2 gm’owth acee lerateci, whilein II ati o ii and 5 pen cliii g bce gan to sI dm55’ - The comeI aticmn ccmef’fieice, mtfor the growth of Nl2 aix’ GNP measured for over bum—quarterpcciodls end iimg in each cinactec from 1/1978 to iV!1981 is only0,07. inci iceati rig tics rce I aticm II sliiJI whatscmcye m, For niche detaf ledanalyses, ice Kceitb M - Carl son and Scctt E - I 1cm, “McmnetnryAggregate s-as Monetary indicators, this Rae fare (Nrmvcmuher1980). pp. 12—21,-arc1 H. W, Hafer, ‘‘Muds Ado About M2,’’ thisflee icon (October 1981), pp. 13—18.
‘The iegislaticmn permitting nationwide ATS also extended NOWaceconri ts to New York State beginning in November 1978, aridNew Jr’rsey beginning in late 1979, Prcevinus legislation aflcmweciNOV-ac counts in Connecticut, Maine, Mas saebu sctts, NewHampshire, R}mcde I slanci ~umcl\-‘cermont,
0 Both old NI I mmcl NIl A focI ncle en rrenev in the IIandis of’non—hankpublic and riemn,and cie
1)d)Sfts- -at corn,iiereial hanks. Old NI 1
included deposits of foreign official instit,,tions its we]I - Nil B isNI IA plus other checkable deposits at all financial institntic,nfuel, irling A’l’S anci NOW Imafanees -
diecline in OldI Ml and N41A causedl by the shift toATS deposits.~
From October 1978 to October 1979, othercheckable deposits (largely NOW accounts in NewEngland, New Jersey and New York, and ATSdeposits) increased from 2.5 percent to6.3 percent oftotal checkable deposits. This shift slowed N-I 1Agrowth by about 2.4 percentage points andl raisedM1B growth by about 0.5 percentage points fromwhat otherwise would have occurred.8 NI 1A grewonly 4.8 percent from October 1978 to October 1979,aboutthe samneas the old measure of N-Il, which grew5.2 percent but cOnsidlerablv slower than the 7.9
percent growth of old Ml over the prior two years.M1B, however, grew 7.9 percent over the same pe-riodl, the same rate of growth that it and the oldnieasure of Ml registered over the prior two years.
The dliffering effects of tile introduction of ATSaccounts on the growth of’ the monetary aggregateswere important in assessmngmonetary policy as well.The growth ofMlB did not slow dluring the first yearof ATS; it continued, instead, at the record pace ofexpansion of the prior two years. Thus, judlged bythis measure, the influence of monetary aggregateson total spending and inflation remained tin-changed. In flict, inflation continued the upwardlspiral set in motion by the acceleration of moneystock growth that began in midl-1976. Similarly,nominal GNP grew at an 11 percent ,‘ate from 111/1978 to 111/1979, little changed from its 11.9 percentrate over the prior four dluarters. If one had focusedltipon oldI N-Il or N-I IA developments, however, thedirection of monetary actions wouldl have appearedextremely restrictiye. Consequently, a sharp re—yersal of both rapid GNP growth andl acceleratinginflation would have been expected.” Neither, infact, occurred.
‘When ATS was ,ntrociueecl in November 1978, the ,isonetarvaggregate me as, lies N-I 1_A aimcl NI I B ‘s-ceme a cit in usc’ - Thc’ ag-gregate measri cc N-Il A, hnwevc’r. is I ittlc’ chIle remit from the oldmmmc, act,re NI 1. TIma anal vs is of thc’ e fleets c) ATS on an NI IA a,mciNI 113 aggregate are dlese rihed alone fully by Johmm A. Tatommi andRichard U’, Lang, ‘‘Automatic Transkms and the NIor,ev SupplyProcess,” this Raefare (Februam 1979), PP. 2-id).
‘Scer, Tatomn and Lang.’’Autcmmatie Transfers,’’ pp 7-9.
°Shift adfnstnmcnt cmf 1-1113 makes little ciiffcercenee in the assess—merit of mommetaiy pnlicv i’m 1978-79, If 30 pem’eent of .ATS ha!—anees were considered idle savings balances, an appropriatelyadjusted N-I 113 rvouicl Fmavc grown by 7,0 percent frcmni October1978 to October 1979, less than 1 percent below actual N-Il Bgrowth - Scee Tatonm and Lang, Autcinm atie ‘rmans fans.’’ p - 7, (es-pecially fkx,tnote 14, Tbis difference woo Id hmcve little effect oninfiatim or spending dicevelopnienmts in 1979 ‘F he sb if to .ATS wasnot large enougb to provide even a weak test of whc,tber Nil Bshcmulci be sh ift—acljustecl, but it did raise tile issue,
24
FEDERAL RESERVE BANK OF ST. LOUIS APRIL 19e2
The proportion ofcheckable depositsheld in othercheckable deposits continued to rise after the firstyear of transition to ATS. From October 1979 toOctober 1980, the ratio rose from 6.3 percent to 8.5percent; by December 1980, it had reached 9.1percent With the introduction of nationwide NOWaccounts in January 1981, however, this proportionskyrocketed: by December 1981, it had climbed to24.6 percent. Such a large shift produced largedifferences in growth rates between M1B and M1A,and between M1B and a shift-ac~ustedMit
NATIONWIDE NOW ACCOUNTS ANDTHE MONEY SUPPLY PROCESS
The introduction of nationwide NOW accountsaffected the growth of monetary aggregates some-what differently than did ATS accounts. New NOWaccounts at all financial institutions were imme-diately subject to a 3 percent reserve requirementonthe first $25 million of these balances (an indexedthreshold that changes every January beginning in1982) and a 12 percent requirement on transactionsbalances in excess ofthis. The reserve requirementfor new NOW accounts exceeds those for othertransaction accounts at non-member financial insti-tutions until the phase-in ofreserve requirementsonother transactions balances is completed in 1987.Thus, shifts ofother transaction accounts or personalsavings balances at these institutions to NOW ac-counts will raise required reserves.
Underthe phase-down ofreserve requirements ondemand deposits at member banks, reserve re-quirements on demand deposits initially exceeded,at some banks, even the top reserve requirement (12percent) for NOW balances, so a shift of funds toNOW accounts could have increased reserve re-quirements. At the same time, the reserve require-ment on personal savings at member banks waslower than the minimum on NOW balances, so ashift from these funds raised reserve requirements.The important point, however, is that there was nosystematic shift of checkable deposits to lower re-serve deposit categories as was the case with ATSwhen checkable deposits moved into “savingsbalances” and thereby raised the M1B multiplier.
The principal efkctofthe transitionto nationwideNOW accounts on the growth of specific monetaryaggregates is definitional. That is, as NOW accountsare increased by switching funds from balancesincluded in an aggregate like M 1A that excludes
NOW balances, theaggregate will decline relative tomonetary aggregates such as MlB or M2 that includeboth the source of the funds and the newly createdNOW deposits. The requiredreserve ratio reductionassociated with ATS does not occur with NOWaccounts so that no unusual rise in the MiD mul-tiplier occurs as a result. Moreover, most of anyreserve requirementincreaseassociatedwith a shiftto NOW accounts is due to new reserve require-ments on those funds. Given the source base, theeffect of such a reserve requirement increase onmonetaryaggregates is reflected in a reduction in theadjusted monetary base (thesource base a~ustedforreserve requirement changes) instead of the moneymultiplier. Thus, if the level or growth rate of theadjusted monetary base is unchanged, there is nopositive efl~ctof a shift to NOW accounts on thelevel or growth of MiD or M2.
SHIFT-ADJUSTED M1B
The shift-adjusted MID measure was introducedin Chairman Volcker’s report to Congress on mone-tary policy on February 25, 198L’°Shift-adjustedM1B is simply MiD minus an estimate ofthe othercheckable deposit account balances that originatefrom shifts of non-demand deposit funds. Theconceptual rationale for this measure is to achieve a“purer” measure oftransactions balances by remov-ing balances that previouslyhad been held for non-transaction motives. It was estimated that 22.5 per-cent of seasonally unadjusted other checkabledeposit increases were associated with shifts fromdeposits other than demand in January 1981; thisfigure rose to 27.5 percent in subsequent months.
The estimate of the size of the shift is based onseveral surveys of depository institutions andhouseholds and econometric techniques. Thedepository institutions sampled included 100 com-mercial banks which provided dataon the sources ofnew NOW balances in January-April of 1981. InMay 1981,400 banks were sampled. A sample of 100savings and loan associations was conducted inJanuary, March and May. In addition, a sample ofabout 700 households provided survey information
t0See Patti A. Voicker, “Monetary Policy Report to Congress,”Federal Reserve Bulletin (March 1981), pp. 195-208. In Marchthe Fed began releasing information on shift-adjusted M1B infootnotestotheFederal Reserve Statistical Release 11.6. A fisHerdiscussion ofthe adjustmentwaspresentedIn the May15, 1981,13.6 release and in “Recent Revisions of the Money Stock,”Federal Resen.’e BulletIn (July 1981), pp. 539-42. BegInningMay 22, 1981, monthly data on MIB shift-adjusted began toappear in table 1 ofthe 11.6 release.
25

FEDERAL RESERVE BANK OF ST. LOUIS APRIL 1982
Table 1Levels of Selected Monetary Aggregate Measures(billions of dollars)
Other Shftcheckable adjusted MiS lee
Month MIA MiS2dept a M S sh ft adjusted MIS
December1980 $3876 $4145 $269 $4145 $00
January 198 3746 4179 43 4144 36February 3562 4194 6 3 4134 60
March 650 4244 595 4168 75Apt 3668 4 . 685 4236 97
May 640 4292 652 4201 91June 3616 4284 667 418-8 96
July 3614 4294 680 4195 99Augut 3616 4311 694 4209 02
eptembe 601 41 712 407 10Otto er 361 29 716 222 10
November 6t8 4 84 747 4250 114
December 36 8 4409 770 4287 1 .2
e y tra eler che ks and demand dep s c niponents a Mi
Now ailed Ml
SOUR Fe era! A set-v tat; tea/ Rele a H 6 e rua 2 an 19 198
to ti e Snr i Bc se n -ii e ftc of tic ii s crsits if but the ro th t ites in it ii I, Hi ci eaftc r. From
\Iic-himti ii ehrntn. Lu at (lApril. I iJ Inc tic )cc-enb~r1980 to - p 119 1 \I1 ~c it i 14.2entc r si S ci ed 5 0 )0 tore tousc’i ii 5 i,iI 1\ - ) r ci t ii mi ~c ao i t ii ate ~. ~ PC r - ntt m poi a
st tUsh ti sUm, ~e of th 5 11)1 lii c a - r ‘i-ttions i p f is i th a sh it- dit s ~d 1 - F -ow pill to Dc
ofet-tilcs othcr -it ti1~ckpositst -ki ~cst - abet ~981 B on ‘d to i~.f erceit Inc of
ii,’ ci ci )os ts s -is inciuc ci usinG ~ s- - iot i - - as a c lift- icijus ci 11 sb s c to t 1.8 p
sic ‘Us cati o’9(0O s e~-h tcpotti g I - nks. -~ iha ,tdffcret cc ofoils OSperce tttgepc its.
h Ic t oft te lift -idj s tm it I B Itt 981 is - -
ion ii tal 1 1. Tb differe tech ‘t s t 1 tic\ is oti - ci -k ibi ci posit . he diffhten’-c — -
bet ic ‘1 1 ift—idp s ci I a iti I1B i tic ii - -
p itc ci i icr ‘ate it of oti ci - ic ckahl cic posits di itt se front io i-ti c is ictons hal wee ( r th pit - \hcth r t i si fl tdjustmc at of Ii is tsc ub it
Sc of c-omputin shill--id t~i- 1 iii othet cot cit ct na - nfl iss ‘sst~monet-i \ poiic-s is ss t
bc -kabie (Ic po s prior t t 1981 -t trc tt ci is balls -w c’ npii -i ssuc. Pu po rot ts of r taos ii
transactions h ii tncc s). )thet check d I ci pos s sonic of thc N )W -iccos t ts fu in tb it ros none
snraed tpw a ci hi S50.2 hilhon ftoat ) cemhci 1980 tics - ,areait - 1 B a ‘ne th t tIcs b-tia icc s • t it
to D ‘cc robe 1981 hnt S i2.~billion ofti is ittcte-ts trnisacti i is ~i ii inc-c inc ‘ tin s c hft ci ~om
is e tim tc ci t i has ‘ -on f oat a on-t an - - on s s is it gs. Ic sc ic IC U 1- nec t i ‘s t~tc a c eid
h-ti t ices ace cdi ig to ti e Bo- rd staff, in \O \ ic - mt Is simply to s t isis win nnm I .ti, ncc
- . r ~q tirem u ts .~~ C iti s of 5i ift tdj istmc’nt n ac iiiTi inc - nc n ‘sOW t - o tots aid its snhs ‘quc at -
inipact on the nonet irs ggr ‘gate is cr • arc • t st
from ) ‘cc’nibc I 98( ~o kpr I 981. Tahlc 2 5i 055 s —
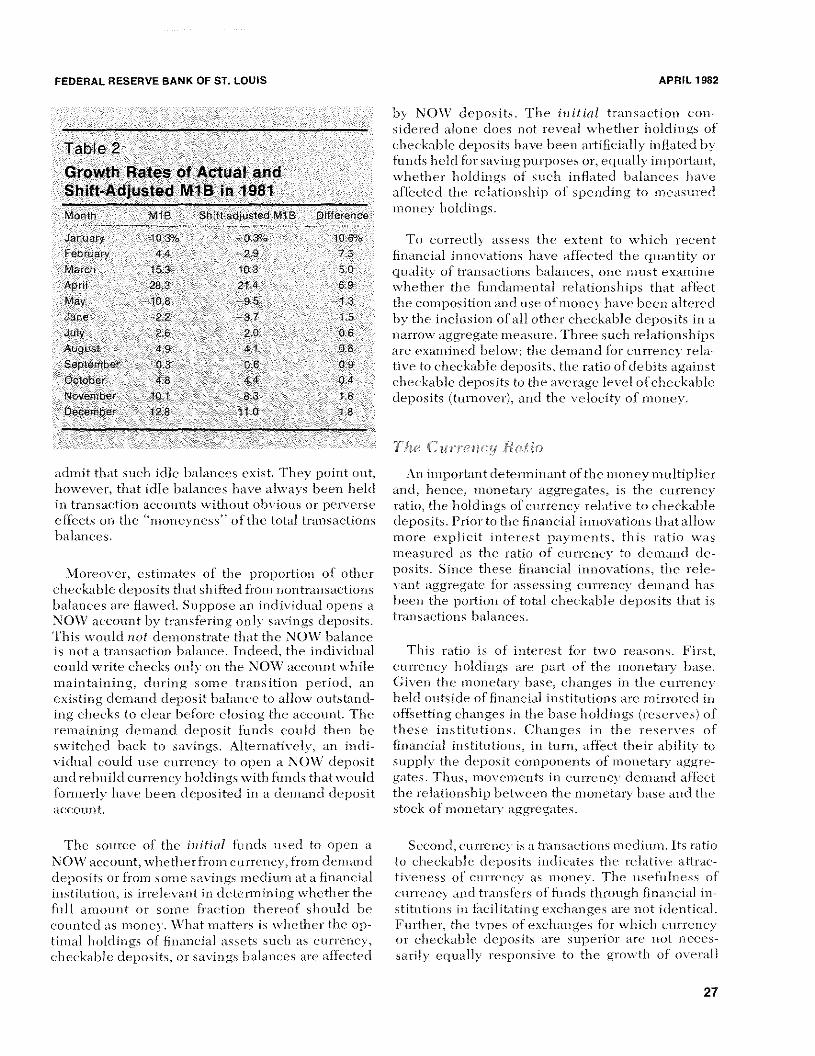
the a at .1 giow th r ttc s of -,ctn-tI and s nft-adjnstec ~ tel B udir cit Hi tic 1 I Bern nit Ii’ hi. iiic- - - - Ban! 51 t _S 1981 pi 1 toil t tics tli ii thc hilt itlB fit ciii nioi ti H 1981. TIme ciiffetet cc’ in ii p~tin iit~r is tim! uC;t c/in Un U ,itci ci that tint n tints
growth ratc t C 91 ttc I irge front Ian a. r to p - i rcn c~ii sI on tl tnt cli a-1
och d si tic aclin I ci tie i iF
26
FEDERAL RESERVE BANK OF ST. LOUIS APRIL 1982
Table2Growth Rates of Actual andShift Adjusted M1B in 1981Month MiS Shift adjusted MIS Diffe en e
January 10 3~c 0 3°~ 10 6°cFebruary 44 29 73
March 53 103 0April 288 214 69
May 108 95 13
une 2 15
July 6 20 06
August 49 41 08
Sep embe 03 06 09
October 48 44 04November ID 1 63 1 8
Deember 28 110 18
achnit that such idlc balances c xi t Thus point cmnt,how usci, that icilc balancc Ii is e alwis Imc en held
in tr-msa tion a -counts is itimcmut ohs ious cmr pets c tseeffbcts cia the nmone~nc s ofthe tcmtil tran actions
lmahincc s.
Moreover, estimates of time proportion cmf other
cheekalmie clepcmsits that shifted loam nontransacticmns
imalanctes are flawed. Suppose an inchviclual opens a
NOW acccmnnt lmv transfering cmnl savings depcmsits.
This would not demonstrate that the NOW lmalanceis tiot a transaction imalance. Indeed, the inchvicinalecmulci write cheeks onls- on the NOW account while
maintaining, during sonme trans itiotm pericmci, an
existing demand cie1mosit balance to allow outstand-
ing checks to clear imefore elcmsing the acccmutit. Timerenmaining denianci deposit funds conlci then lie
ssvitchecl imack to savings . Alternatively, an inch—
viclual could use currency tcm open a NOW deposit
and rebuild curretmcv liolchngs w’itlm funds that wcmulcifornmerlv have been deposited in a demand deprmsit
account,
The source of the in i/ia! futmcls used to open a
NOW account, whether front currenc, from dienianci
deposits or fronm some sas-ings nmecliuni at a financialinstituticmn, is irrelevant in ciciternmining whether the
full amount or some fracticmn tlmereimf sli cmiii ci Ime
counted as money. What niatters is svIiether the dip—
tuna1holchngs of financial assets such as currency,
clmeekalmic, deposits, cmi savings lmaiances are affected
imv NOW deposits. The in it ic-il transaction con—
siciereci alone does not reveal whether liolchngs cml
checkalmie depcmsits have lmeen artificially inflated imy-
funds hell fIr saving purposes or, equally intpcmrtant.
whether holdings cmf such inflated hmalances haveaffected the relationship of spending tim measured
nicmnev holdings.
To ccmrrectlv assess the extent to w-hicli recent
financial itinovaticmns have afic’c-tedi time quantity or
quality cmf transacticmtms balances, one rtiust extunine
whether the fundamental relaticmnshi1ms that affect
the cotnlmositidmn and use ofnicmtmev have been altered
liv the inclusion cmf all cmther c-heckahmle dlelmosits ill anarrow aggregate measure. Three such reiationsbips
are examined lmelcmw: the demand fur currency rela-tive tim checkalmle deposits, the ratio ofdelmuts against
eheckalmie deposits tcm the average level cmf checkable
deposits (tunicmver), and tIme velocity mf money.
The Cun-en.c,y Rati.o
An impcmrtant determinant ofthe nnmnev nmultiplier
and, hence, mcmnetarv aggregates, is the currency
rathm, the holdings of currency relative to checkaimle
deposits. Prior to the financial innovaticmns thmat allow
more explicit interest ~maynients,this ratio was
measured as the ratio cmf currency tcm demand die—
posits. Since these financial innovations, the rele—s-ant aggregate fcmr assessing currency demand hasImeen the portion cmf tcmtal c,heckalmle deposits that is
tran sacticmn s Imal anc,es.
This ratio is of interest for two rcascmns. First,
currency Imoici.tngs are part of tIme tncmnetary hase.Givetm time rncmnetary Imase, chmanges in the currency
Imelci cmutsicle of financial institutions are nnrrcmred in
cmffsetting changes in the lmase hohchngs (reserves) of
tlmese instituticmns . Changes in time reserves dmf
financial instituticmns, in turn, affect their almihitv tim
supply time deposit cimnijmimimeimts cmf nmonetarv aggre-
gates. Thins, movements in currctnc demand afflict
the relationship betw-eetm the nicmnctary base and tIme
stock of monetary aggregates.
Second, currency is a transacthmns nmediunm. Its raticm
tim clmc’ckalmle deposits inchcates the relative attrac-—
tivc,ness cmf currency as nicmncv. Time usefulness dmf
currency and trammsfers cmf fluids tlmrcmughm fitmancial in—
stitutions in facilitating exchanges are nut identical.
Further, time tines of exchanges for whmichm currencycmi checkalmie depcmsits are superior tire not neces-
sarily equally respcmnsive to time grcmwthm cmf dmverahi
27
FEDERAL RESERVE BANK OF ST. LOUIS APRIL 1982
eeommonmic activity or speimdiimg.12 Thus, eccmrammictheory inchcates that, given the teclmimology cmf thepaynmetmts prmcess -audi portfolio preferences, theratio of currency tim checkable dielmdmsits shmouhd dc—
penci otm the relative cumst of hdmldiitmg and using cur—rencv iim tratmsactiumnis aimdI on moyeumetmts in retilincome.
Now if sotmie portion of checkaimle deposits aresudidienly held for reasons unrelated tm their use—fulness in transactions, thetm the currelmey ratio thtttuses total checkaimle dieposits in its diendmtmmmatcmrshmouldi dechitme relative to one with mmlv transticticmnslmttlances in the dencmmiuatcmr. Thus, if a shift ad—justment of M lB is appropriate, one should observean unusual downwardi nmovenment of the currencyratio without adjustments for the shiftJ~Timis, inturn, should result in an unusual rise iii the mdmney-multiplier, the link Imetween the nmonetary base andall mcmtmetary aggregates (not shift adjusteci).t4
Thmere were, however, no unusual movements intIme ratio of curreimcv to tcmtal checkable deposits itt
1981. The ratio did not decline sharply with theintrdmduction of NOW accounts, At the end of 1980,the ratio stood at 39.02 percent. It rose to 39.12percent in the first dluarter of 1981, fell slightly in thesecond quarter to 38.93 percent, rose to 39.52 per-cent in the third quarter and fell to 39.33 percent inthe fourth quarter. On an annual average basis, theratio was 39.23 percent in 1981, little different frotmmthe 39.10 percent average in the pridmr year.
The ratio of total checkalmie dieposits to shift—adijustedi total checkable deposits rose from 1.019 hithe first quarter of 1981 tcm 1.032 in the secondi
quarter, 1.035 in the third and 1.038 iim time final
quarter of 1981. If total checkalmie deposits over—statedi transactiotms balances by ahdmut 2 percetmt to 4perceimt during the y-ear, the currency ratidm (rnea-sureci relative to total checktiImhe depcmsits) shouldhave fallen imv the stune anmumunt. Jim fact, the raticm rcmseslightly in 1981.
A shift—adijustedi curretmcy ratio can be ccmumstructecifmr 1981 Imy computing the ratio of currency to ad-justed checkalmle deposits (total checkable dlepositsless the estimate ofnon—traimsactions Imalanees). Thisshift-adjusted ratio rose sharply in 1981 so that in thefourth dluarter of time year, it was 4.6 percent largerthan the currency ratio at the end of 1980. Sucim asharp rise in time currency ratio has been exceedled incmnly two periods since 1960: fronm mid-1973 thmrough1976, when the eurreumcy ratio rose at a 5.2 percentrate, tin ci iii nm idi— 1980, svh en ti ehange iim the eont—position cmf denmatmd for liquidi transactions lmalaimcescaused the ratio to temporarily- surge upwardi at a16.6 percent annual rate. Excluding thmese periods,the nmeaum growth rate of the currency ratio (unad-justed) for four-quarter periods frcmmn 1/1960 tcm IV!l98owas 1.4 percent, while the standarcideviation ofthegrowth rate was 1,7 percentage points. The surgein the shift-adjustedi ratio itt 1981 was almosttwo s tandlard deviatioims h ighier thaim thus meangrowtIm rate.
The unusual surge of such a shift—adjusted cur-rency rtitidm suggests that the adjusttmietmt to remcmveimdmn—transacticmns halatmces was tcmo large. Indleed, thisconclusion is supported by the sttitistieal analysis itt
the appenchx to this article. Time currency’ ratiomovements after the thmird quarter cmf 1978 (thequarter hefdmre the introdluctiotm cmfATS acccmunts) tirewell expiaiumed liv a mmmmciel of currency diemandi rela-tive tcm all other transactidmims Imahatices, tu nmodiel thatalso ex1mhains the currency raticm lmefdmre thmat tinme. TImesurge in the currency ratio adjusted1 for the slmift tcmNOW accoutmts is clue to time adjustimment procedureitself, artificially pushing nh time ratidm,
The iurn..ore,- Rate
Atmcmther ratidm tbmat indicates tIme use dif dlepdisits fcmrtratisactions purpimses is time turncmver rtite, time ratidm ofdieposit account debuts to time average level cmf dc—
imosits. If time shmift—adjustnmermt tirguuiment is vtihid, timeinclusion of a large simurt cmfnon—tratmsacticmmms hmaltitmcesin nmeasumres ofchmecktihmle deposits shimulci reduce the
t ~A model cml time currency ratio timat emphasizes time imdmsitiverelaticmnsimip of relative curreumcy clemnaimcl to interest rates andtime inverse rd atioumsh ip with real itucotmme grosvtlm is presented inthe appemt clix to time article. liii s nioclel is used to usess wimetiteriii i Its of non—tt’a ii sac tiotm s hal am ices tim otimer clmeckahIc diepo sitshave uffircted cii rrcncv cit-it ia,md reinti s-c- to a time r trans acticmliImalattc:es.
itTum the extent that naticmnwide NOW accounts offered aim tip—tmortl miiitv for lcwt-,r—ccmst elieckahi c- deposits, time ratio of c-u r—remmcy to total cimeckaimic depumsits would he expected tum cieci inc
umutmess-im at. Thus, a decliii e in tliis rati a wumu id riot p runt’ thattime Sc elicekahl c- cicimosi ts are in Rated Lv tIme melusion of scm ateno n—transactiut tu5 ii alances- Time cv mule Imee ~mrc Scmiter in timeajmpenclix sit ggests iiiat tim crc were tmo unusual dccl ties in tim isratio in 1981 for either reasoti -
‘4The NI 113 omumhtipi ie r rumse 0.6 percent Loin time fourth quarter of
1 980 to tIme fort alt ciuartcr of 1981, ivhm ielm is acit mu our Sna I - NI its-c—in ents in tIme mu I tipi icr are itri ritarilv ciuSe tci cu rrcnc~ ratiovariatioti - The miiimnev nini tiplie r omove Incimt5 arc mtt,t c~stilt ten indlctai I lit-ic’ sluice time cu rrc-m icv rat in is -
28
FEDERAL RESERVE BANK OF ST. LOUIS APRIL 1982
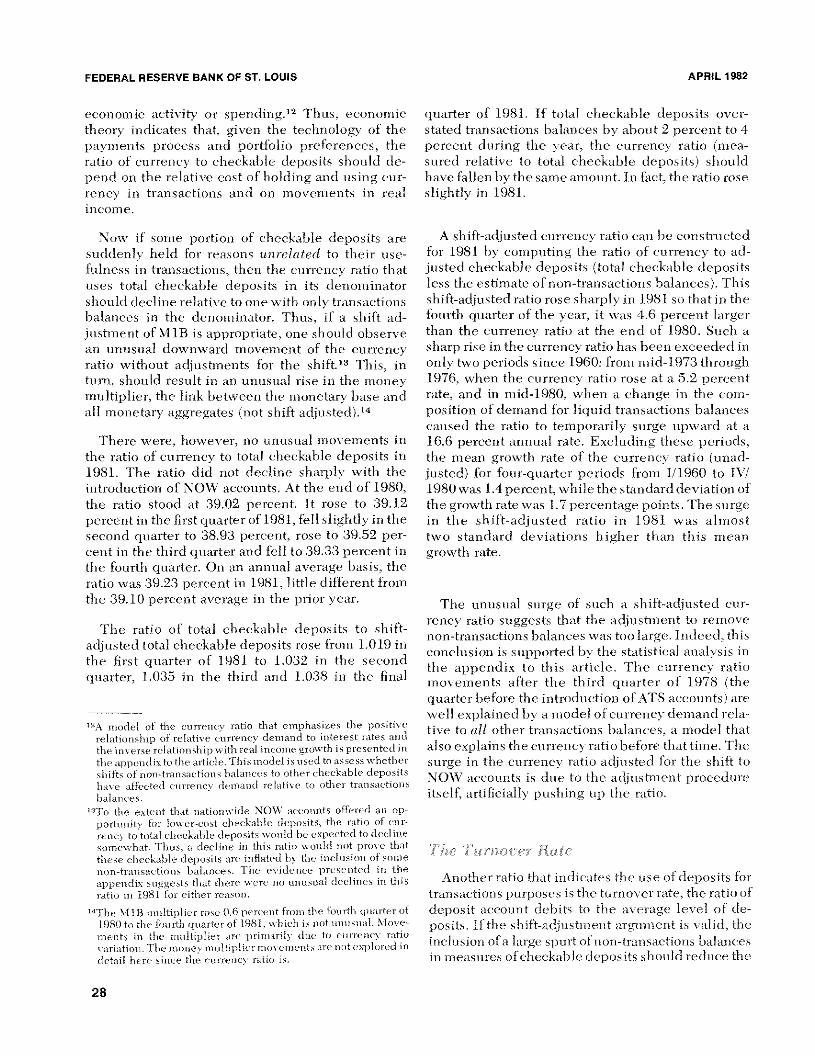
Chart 1
Transactions Account Turnover Ratios
100
Li. The ratio of debits against2 The ratio of debits against
for all banks.
Source: Board of Governors of the Federaldemand deposits to average demand depositscheckable deposits to average total checkable
Reserve Systemfor all banks.deposits
scale300
280
260
240
220
200
180
160
140
120
100
scale RatioRatio300
280
260
240
220
200
180
160
140
120
i~aIcheckt~bIedeposits~~
Demand deposits L17~
f~
1975 1976 1977 1978 1979 1980 1981
29

FEDERAL RESERVE BANK OF ST. LOUIS APRIL 1982
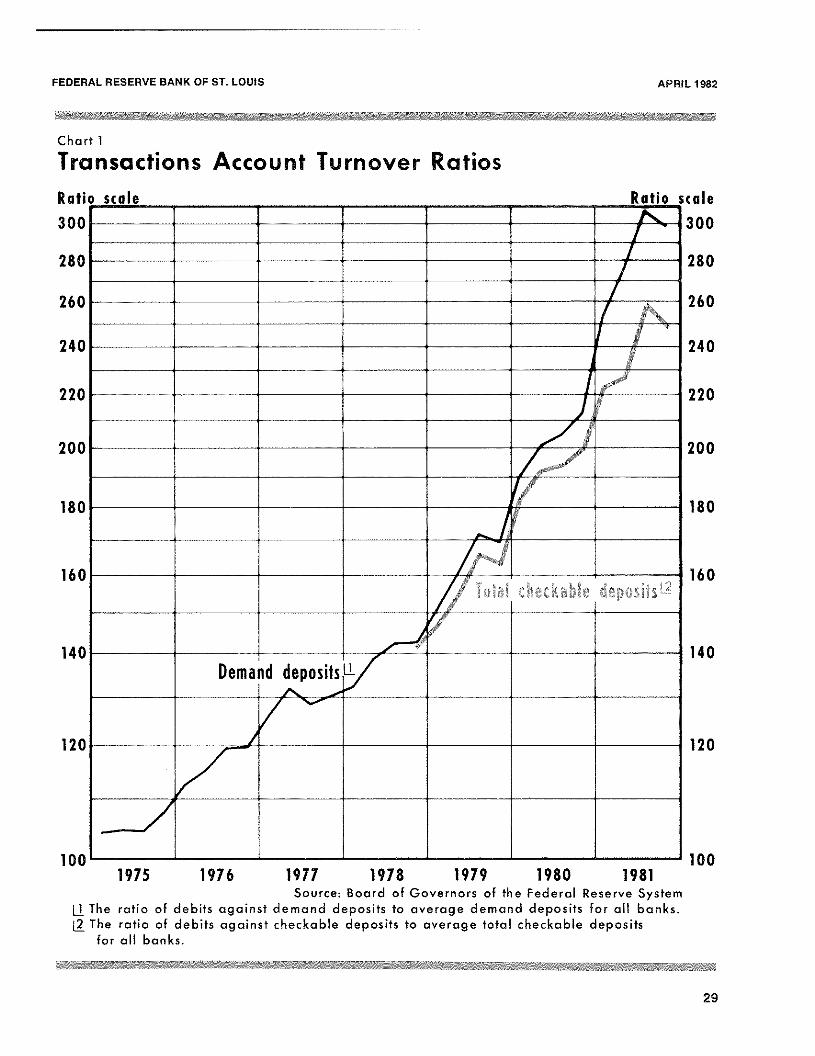
turmmover rates of suich dleposit5J~Chart 1 shows thequarterly average of the turnover rate at all cmii—inercitti batmks for diemmmandi deposits sitice 1975 audiall checkable deposits since 1977. The tunmover ratiofor tdmtal cheekab]e deposits is umeasuredi by dlis’idhmigciebmits on deimmand deposits and ATS/NOW tmccoummtsby the total of such deposits. On average, this ratioactually’ acceleratedi in 1981, rather thaim dlechnitmg asthe shift—adjustment argummmemmt would suggest.
TJ.~,. ~ ! if d/iiney
A final piece of evidience on shift adlju,rstmenteoncermms-ammotlmer ratio, time relationship of the tnt—tion’s tmomninai gross nationai product (GNP) to time
nmoney stock (Xl), or yelocity (V = GNP) This is
perhaps the tmmost important raticm to use in assessingtime impact, if any, of financial innovations on timeuneasu.mre of nmoney amid the assessment of monetarypolicy actions. If the nmotmey stock were artificiallyinflated by nomm—transactiomms imalances, a policy- toachieve tu giveum 1ev-el cmf Xl would! lmritmg about a lowerlevel of spemmd}ung (GNP) than desired or predicted!by ptist velocity relatidmmmships. Mommetarv policy in1981 focused on shift-adijusted M1B, rather thanM1B, Imec’tuuse time velocity of MIB was expectedi todecline relative td) its prior experiemmee. In ptirticuiar,existing historical reiatiotmships were expected to betmmore app] icable to time adjustedh Xl lB. Actual M lBgrdiwtlm was expected to lie 2 to 3 percentage poimmtsfhster tlmaim timat tturgeted fin adjustedl Xl 1B, reflectitmgthis inimos-atiotm—iumdueedi rediuctiomm in the velocity ofMl B aum~iits growth rtmte fdmr time year.
tOim t- ccmiu ml argue th at tim c- ohms cu rvu-dl t aruumven cm f ATS am tul NOWImalaumee s is mmm it cit lowcr tim aim timat of ul eimmanuI d!e
1t is its, prOv id ing
idle: ice timat ATS anci NOW’ lmaI a imee s ant- m nit tim umtm c-v tum tim u,551nme degree as ulc’m im andl d c-pit sits - lime lower tim imm diver rate is matstir-pt-ising, imumwes-er, fumr two reasdmums - First, NOW atmuh ATSaceumunts appuuai mmmcm st tui Custumuti ers timat would
1hiave low tum rn—
over if thu-ir traimsac-tiumims it al am ices is-u’ ru in ulcmtmstitch uletmums its -
Timis Steen rs imeeairse a pr mom inu’ut fiinn it f iia p I icit in terestpcivimmcnits ciii dc-mtmaimd deposits is time rertmissidstt of servicee Imarges - Tim us, tim cc in trim
1uuc-ti curt of c-sit lie it i im te ru-st cmii traim s—
ie tiutim s ma! ii imee5 su-oumId tmnst cimam i ge time i‘mt-c-it tives face ii imdlepdi5 itum rs neee ivi1mg cumt o pe titi ye inmimi icit iimtc’ rest - 11cm
1ui u-rs of
uic’maum ci dc-ph sits sc-it it se itim phie it itm tu- rest exceedl S tim e sc-nv icedma rgc 5 diii time i r haianc-c- s c-slimmmcm t rd-ce iye tie di ffr rut m ice as sinexplicit in terest itswuic-itt sri time y esi n cut ATS or N: OW’ it al sinc-es -
Tim t’ sc- enstumimm c- rs term dl tim lie timmisc’ witim re iaticclv low t ui rim liveraecomio ts, aumul timu-v siru’ time cut sti titters ivitl i the met-mttivc- tdi
switch their hoidimmgs. TIme shifting of thc’ir fluids frummmt du’msnmcluhepumsits tum N()W’ accounts shim ulci I cad time turnover i-siti umol totaleitu,ekaltic- depumsits to it e tim u’ s atitt’ in it simoil ci force timat ofdid’ it iandl uhepci sits tum 5mm nge up - iii sit, itt fsic-t, is svim sit tuppu’ans timoc:eur its chart 1.
In fact, the opposite occurred. Time imehtivior ofXl lB velocity was mmot at all ummusutml in 1981. For thefoutrquarters of 1981, M1B velocityexpammdeciata4.6
percent rate, hister titan the 2.0 percent rate ofmc’rease in the four quarters of 1980 tummdlfa.s-td’r thtm.n
time 3.1 percemtt average rate of’expansiomm fronm 1955through 1980J6 Thus, time behavior ofMlB velocityium 1981 dldies umot support the expecttmtions of theproponents of shift adjustnmetmt (see chati 2).
Of course, sitmce shift—adjustedi M1B grew slowerin 1981 than actual M1B. its velocity behavior mt-asmttmmtsual. Time velocity- of tu4justedi M lB su.trged mip—ward at a 7.4 percent rate from the fomtrth quarter of1980 to the fimurth djuarter of 1981. This suirge cx-ceedis the growth of Xl lB velocity for every four-
quarter period since 1959. From 1960 to the cud of1980, time mean grosvtim rate of velocity- for ftmuur—
quarter periods was 3.1 percemmt with a stammdiarddieviation of 1.58 percemit. On this basis, time 1981 risein the ve]ocity of adjustedi M1B was a statisticallysignificant departure front time past behavior of Xl lB.while the rise in actual M lB velocity was not.il Thissuggests that the shift—adjtmsteci nmeasure of velocity-svas seriumuslv lmitused upward by the renmovtui ofsonic transtictions balances froumm Mi B.18
10Time rtimtiek in Nil B vu’loeity grutsvth arises frutmim tsvui foetom’s. First,ic-nc-s-dr immo ‘mey grumwtim slums’- s, s-u-i nc-itv grdmss tim tic ni po ran I y
offsets sonic umf its decreasu’ imy speeding uip andh suimseqnentlvslumwitmg teuimporari iy scm tlmat velocity grumwth retmt rims tnt its priortneimd. liii ring the fcmu r ijuarters umf 1981, Nit 13 grimsvtim shosvcd tim5.0 pedeem it f’mi miii a 73 pe ret’ itt rate umf ineietm se muse r time fumi inquarters of 1980. Scenmtmdl, time 1979—80 energy umriee immereasu’sretarded CN P grnmsu’tli in 1980 audi accelerated it ut 1981. See
utimim A- Tatummmm, £ ‘Fime rgv Prices aimd Simnun— Ft iii Femits iii it iu Pc r—ho ‘maim u,e,’ - tins Ru’ em Cue simmusury 1981), imp - I 3—17 - lim emm im trsust,Benumutt saidl Bisigtiano, “Apple s, Oranges, aiim] Money: 11,’ tm 3,apparetmtiv ime I ieve the ye
1oeitv of Ml B aceeheratenl tci an mum-
usumal extemmt in 198t clue to “time tmumlmhe’s ittc-ru’asimmg sopimis—icati usum in nm atmagiimg id he tram sac’tiouts I malammc-e s - -,
tmTlme sign ifiu’sumt SU i-gd- 5 especially utarked in timu- hi-st hi-ui
dliiarte rs cmf 1981 iv bmc’u tlt e sit ift adj ii sOt ie imt alTec teul the gt’m twtl i
umf NIIB iimost. During timose hi-a qutartc’rs, sbmift—auljusteni N1IBvu-limeity mo Sc’ sit a 9. I mc’ ,-u-c’nt rates i gtt i fi c-snt thy al mcivu’ thu 3.pc-ru-u-mm t umcc rum tn ti—runartu’r ratu’ cii gruiwtim of Ml B veldie it> fm-dtit I11111959 tim IV/1980 (standiard error = 254 pereenti, wimile actualNI 113 velocity rose ummmlv imaif as fast.
miSomime1
mrumputnemmts of a shift adijustimment nemmisnu unulaumtti-dl Lvsud:l) abc’m’ratmutum s - For exan ip Ii-, soiii d-’ ohServc- rs s mmpI v c:l tiitimat thmc’ ummumsmmcd surge iu thu velocity of adjnstc’ul NUB is c’vi—tIc-nec- that timu’ demutumul for ‘‘mtmonu’v’ shtuhteil dhumw,twardl hi- aimamnoitmit that, my slicer eimiiteidenee, is ainiost exsmctls the somtoummmtmu mnom Icy takc mm mm itt In slm iitadj tmst, a ent. See, hi n Cxammmp Ii’, joltnP. juicidandi i3nian Motley, imsnovaticimm stmmdl Nlnmmmetanv imoliu.y: ~,‘
Fc-dlc-nai Re servu- Bait k of Sami F ram ie i su:otd ec’/d! q but tu’ r. Se~t—
tcnilmer 11,1)181: and David F. Lindsey, ‘Nonhsmmrnosveul Reservei’angeting amid NI ui,tc-tory Cumi S trnmi,‘ im i Imop roe! ng .tfo ii c’uj S Nick
mi trot: Ft-nub/c in iSo/mm! ions - asic! d7
us n.ienf mieii cc’ .s - fortIt ii immm inumrnmeeuul in gs I nmmm n a euin feuerm ci- i-ctsimi tim sureci imy ‘fit e C c-mm tic r hunthu’ Stud’, of Ammmericatm Bmisiimiss almcl this Bank, Oc-tniher :30-431,
30

FEDERAL RESERVE BANK OF ST. LOUIS APRIL 1982
Chart 2
The Velocity of MoneyGNP/Money Stock
6.8
6.4
6.0
5.6
5.2
4.8
4.4
4.0
3.6
3.21959 1961 1963 1965 1967 1969 1971 1973 1975 1977 1979 1981NOTE: Annual rates of turnover computed with quarterly GNP (current dollars) at seasonafly
adjusted annual rates, and seasonafly adjusted quarterly averages of daily money stock,
1981, Their argumuent is essentially timat NIIB auljtmstutientrccrmmumves X pereemit frummu the grcuwtii rate mmf Nil B, hmnt timat tcuassess tIme ucfieu:ts umf inomietary aggrccgate grosvth iim 1981, onemn ci it auhcl time X imc’ i-eu’ ut imacck; timi s is lmeestu Se of dt may stc-ri Sums
6.8
6.4
6.0
5.6
5.2
4.8
4.4
4.0
3.6
3.2
- ‘slmif’t’’ tlmat i-enlmmees the clemmiaimnh fntr nmommev. mmot nine 1cm timei~iicc stimm im ssbml e sim ift nhju stmitemmt of ‘mm imime)’ - Pt’e sumitsumI y, time ssu lieic s
1muutt icc c-nm ulci Ime immanhe ti u thc- cc ii die it cc- aimnuve fbr the eurrue mmdcv
rsitinm dir tim imiits-c-n rate -
Annual Rates of Turnover7.2
Annual Rates of Turnover7.2
31

FEDERAL RESERVE BANK OF ST. LOUIS
CONCLUSION
Analysts interested in determining the stance ofmonetary policy and assessing the likelyresponse ofspending and inflation to policy actions generallyhave focused on the behavior of a narrow monetaryaggregate, The experience last year posed problemsfor analysts because there were three potentialnarrow aggregates from which to choose: MIA, M1Band shift-adjusted MiS. It was generally concededthat new financial innovations made M1A virtuallyobsolete as a useful measure of monetary actionsinfluencing spending and prices. The choice be-tween MlB and shift-adjusted M 1B, however, canonly be determined by examining whether funda-mental relationships affecting the composition anduse of money are altered by including all othercheckable deposits in the measure of money.
Three different fundamental relationships wereexamined using both MiS and shift-adjusted MiS:the demand for currency relative to checkable de-posits, the ratio ofdebits against checkable depositsto theaverage level ofcheckable deposits (turnover),and the velocity of money. All three measures in-dicate that, in 1981, MIS showed no unusual de-parture from its nonnal pattern ofbehavior. Instead,unusual behavior in the fundamental relationships
APRIL1982
occurred only when shift adjustments weremade tocheckable deposits and MiS.
The most important conclusion to be drawn fromthe above analysis is that spending and inflationreductions in 1981 andbeyond cannot reasonably beexpected to match the unprecedented decline inmoney stock growth measured by shift-adjustedMiS,’°The growth of MiS was reduced from a 7.3percentrate for the four quarters of 1980 to a shift-adjusted 2.3 percent rate for the four quarters of1981; moreover, the three-year growth rate for theperiod ending in the fourth quarter ofeach year fellfrom 7.6 percent in 1980 to 5.6 percent in 1981, inshift-adjusted terms. Such a decline in monetarygrowth would be the sharpest slowing since WorldWar II.
The slowing in spending and inflation are morelikely to match the slowing in the growth of actualMiS to a 5.0percent ratefor thefourquarters of 1981and to a trend rate of6.6 percent. In each case, therestraint is about half as large as indicated byadjusted MiD.
‘9Au analysis that uses adjusted M1B as the appropriate Indicatormay be found In Congressional Budget Office. The ProspectsFor Economic Recovery, Febniary 1982, pp. 6, 14 and 39-45.
32

FEDERAL RESERVE BANK OF ST. LOUtS APRIL 1982
Appendix
NOW Accounts, Shift Adjustment and the Currency Ratio
This appendix exawinesac urrency demandmodel derived from the FMP quarterly econometricmodel developed, in part, and used by the staff oftheFederal Reserve Board of Governors. This modelcontains separate equations for currency and de-mand deposits from which a currency ratio can bederived. The currency ratio model can he used toassess whether shifts of non-transactions balances toothercheckable deposits have had significant electson the demand for currency relative to the othertransactions balances included in a narrow monetaryaggregate. The results do not supportthe use ofshift-adjusted measures of checkable deposits. Instead,past empirical relationships remain stable whendemand deposit measures are broadened to includeall other checkable depos its.
In the model, the logarithm (log) of currency perdollar of personal consumption expenditures is re-lated to a constant, a lagged dependent variable, thecurrent log of the 3-month Treasury bill rate, a timetrend and a zero/one dummy for the period beforeand after the second quarter of 1960. The log ofdemand deposits per dollar of GNP is related to: thelog of the current federal funds rate; current andthree lagged values of the log of the 3-monthTreasury bill rate, the log of the commercial bank
passbook rate, and real CNP per capita; and avarying time trend that is broken at the third quarterof 1974, the third quarter of 1976, the fourth quarterof1977, and the fourth quarter of 1978.’ The implicitmodel of the currency—demand deposit ratio relatesthe log of the currency ratio to all of the right—hand—side variables above, and the log of the ratio ofGNP
to personal consumption expenditures (with a co-efficient constrained to unity).
This model was estimated using the generalizedleast—square~method with second—order autocorre—lation adjustment for the period 1/1961-111/1978 butwithout the constraints imposed on right—hand—sidevariables that are used in the FMP model. Thisperiod was chosen to avoid the shift in the FMPcurrency equation in 11/1960, and the period when
other checkable deposits became a large share oftotal checkable deposits. The FMP variables thathave a t-statistic less than unity were omitted. Theresulting currency ratio estimate is (t—statistics in
parentheses):
(1) In (C/DD), = — 1.776 0.134 in (X/N), + 0.023 in r,~(—4.38) (—2.14) (3.93)
+ 0.008 in rto + 0.017 in r,~+ 0.155 in (C/PCE),,
(1.44) (3.00) (1.87)
+ 0.004 Ti + 0.013 i’2 — 0.004 T3 — 0.010 T4
(7.10) (8.51) (—1.46) (—2.47)= 0.968
SE 0.0045
where C is currency, Dl) is demand deposits, X1N isreal GNP per capita, r is the 3-month Treasury billrate, PCE is personal consumption expenditures,T1is an unbroken time trend, T2 isa time trend that iszero until 11/1974 and increases by one thereafter,and T3 and T4 are time trends that increase by one
from zero in 11/1976 and IV/1977, respectively.2
The introduction ofATS/NOW accounts’ after 111/1978 presumably changes the specification of thedemand for currency. In particular, the notion ofcompeting transactions balances must he broadenedto account for this innovation. There are two hy-
potheses tested here. The first is that total checkabledlepOsits adjusted for the estimate of the shift of non—
DW = 1.98h = 0.15
= 1.10
PC = —0.30
d) ne con Id argue that the broken time trend is not appropriatelyconsidered to he a part of the strnetnral specification of the FMPmodel, but rather is included to keep the demand deposit tune—to i on I raek and preserve efficicncv in a’ stiI sating the stn ‘c-lit ral )aralo etcrs . Their i nd u sfo,, here, however, cord(I not Isiasthe tests reported helo~vasthe hroken trend used here endsbefore the test period, and the improvement in the fit over theinitial sample period obtained by including the broken trendraises Oi e power of strue ti r~-tlchange tests.
‘When total checkable deposits are used in the denominator of
equation 1, the resulting equation is identical to that reported.
33
FEDERAL RESERVE BANK OF ST. LOUIS
transactions balances to NOW accounts is therelevant measure of transactions balances thatcom-pete with currency as a useful medium ofexchange.The alternative hypothesis is that all checkabledeposits are relevant for measuring transactions bal-ances that serve as a substitute for currency.
If a shift in currency demand behavior has oc-curred so that the relevant measure of competingtransactions balances is adjusted checkable deposits(ACDJ, which equals total checkable deposits lessthe estimate of non-transactions balances, then thelog of(ACDIDD)~should be added to the right-handside of equation i when the sample period is ex-tended into 1981. When this variable is added, itscoefficient should be one, if currency demand rela-tive to checkable deposits has been unchanged butsuch deposits are shift adjusted in 1981.
To examine the hypothesis that currency demandmeasured relative to checkable deposits after shiftadjustment is the appropriate measure for capturingtransactions balances, equation 1 is re-estimated forthe period 1/1961 - IVIi98i with this added variableand the inclusion of a dummy variable, D6=i in11/1980 andzero otherwise, to capture thetemporarysurge in currency demandassociated withthe creditcontrol program in that quarter.3 The estimate is:
(2) in (ODD), = —1,390 — 0.098 in (X/N), + 0.024 in r,.1(—3.57) (-1.65) (4.22)
+ 0.007 in r~+ 0.017 in r,3 + 0.232 in (OPCE),.1(1.37) (3.15) (2.90)
+ 0.004T1 + O.013T2 — 0.0061’3 — 0.008T4(7.62) (9.i8) (—2,35) (—3.07)
÷0.024 D6 +i.271 in (ACD/DD),(6.09) (16.87)
= 0.99iSE = 0.0048
Both of the added variables are highly significant,and the other coefficients, as well as the summarystatistics, are not significantly differentfrom those inequation 1. The last trend variable (T4) mentionedabove for the FMP model was also added to theequation; this time trend is zero to 111/1978, thenincreases by one in each subsequent quarter, and
APRIL1902
presumably is in the FMP model to accountfor ATSandNOW shifts,The inclusion ofthis variable hasnoeffecton the other coefficient estimates (for example,the coefficient on In (ACD/DD) is 1.251 with astandard error of0.083) or summary statistics, and itis not statistically significant (t = 0.54).
The shift-adjustment hypothesis implies that thecoefficient for In (ACD/DD) should equal one. Thestandard error ofthecoefficientestimate is 0.0753, sothe t-statistic for the null hypothesis is 3.59, andtherefore the shift-adjustment hypothesis that thecoefficient equals unity can be rejected. The ratio ofcurrency to adjusted checkable deposits is sig-nificantly and positively related to the size of theshift into NOW and ATS accounts (ACD/DD) so thatit appears artificially biased upward by the shiftadjustment.’
At the other extreme, one can hypothesize thatallother checkable deposits are transactions balances;that is, all other checkable deposits are competingtransactions balances for assessing currencydemand. Totest this hypothesis, the log of the ratioof total checkable deposits (TCD) to demand de-posits is added to equation i, and the other stepsdescribed for equation 2 are followed. The result is:
(3) in (ODD)5 —i.3i3 — 0.092 in (X/N), + 0.025 in r1.j(—3.28) (—1.53) (4.27)
+ 0.006 in r,.2 + 0.0i8 in r,3 + 0.25i in (C/PCE),.1(i.i6) (3.12) (3.06)
+ 0.004 Ti + 0.013 T2 — 0.006 T3 — 0.007 T4(7.53) (9.09) (—2.28) (—2.57)
+ 0.024 D6 +0.997 in (TCD/DD),(5.93) (16.51)
= 0.992
SE = 0.0049
‘When equation 2 is estimated with acbusted checkable depositsin the denominator, the elasticity of the currency ratio withrespect to the ratio of adjusted checkable deposits to demanddeposits is 0.271 (t = 3.59), essentIally the percentage of theshifting balances that has been removed.
‘When thetrend shift after 111/1978 is included in equation 3 theearlier result holds. in particular, the t-statlstlc for the shift is0.90, and the coefficients and summary statistics reported inequation 3 are not affected. The coefficient on the shift variablelog (TCD/DD), 0.971 (SE — 0.066), remains essentially unity.
DW = 1.97h =0.22
DW = 1.97h =0.18
= 0.97
P2 = —0.22~,= 0.98
P2 = 0.2.3 The fit ofthis equation is virtually identical to thatof equation 2.~In this case, however, the null hy-pothesis that the coefficient on the shift variableequals unity cannot be rejected (the standard error ofthe coefficient for the shiftvariable is 0.0604 and thet-statistic for the null hypothesis is t = —0.05). Thus,
‘This shift in thecomposition ofthe demand for money has beennoted In the report by Robert Weintraub, “The Impact of theFederal Reserve System’s Monetary Policies on the Nation’sEconomy,” (Second Report), Staff Report ofthe Subcommitteeon Domestic Monetary Policy of the Committee on Banking,Finance and Umban Affiuirs, House ofRepresentatives, 96 Cong.2Sess. (Government Printing Office, December 1980), p. 17.
34

FEDERAL RESERVE BANK cc ST. LOUIS APRIL1902
when the left-hand side is written as in (C/TCD), ashift variable is not significant (the coefficient on theshift variable is then —0.002 and its standard error is0.06), theright-hand side variables are the sameas inequation 1 and the currency demand equation isstable. The F-test for the stability of equation 1,including controls for the effects of the 1980 creditcontrols and the broadeningof transactions depositsfrom demand deposits to total checkable deposits,can reject instability. The F-statistic for the addi-tional observations in equation 3 is F11, 72 = 1.93,below the critical F of 2.50 for a 1 percent level ofsignificance.
Accordingto the currency-deposit relationship inthe FMP model, NOW accounts (or other new typesof transactions balances) do not cause a shift in thecurrency-checkable deposit ratio when all check-able depositbalances are included. When a shift ofnon-transactions deposits into checkable deposits istaken into account, the shift creates a bias in esti-mates ofcurrency demand thatis directly related tothe size ofthe adjustment, These results indicate, atleast for this model, that there is no support for shiftadjustments; where shift adjustments are used,offsetting shifts in relationships must be included to“wash out” the adjustment.
35