recent evidence and implications - stat - reporting from the frontiers of health … ·...
TRANSCRIPT
January 2017
Lifetime Trends in Biopharmaceutical InnovationRecent Evidence and Implications
Introduction Improvements in the treatment of disease are directly linked to advances in medicines available to patients. The biomedical innovation system that underpins advances in medical treatment is a critical driver of improvement for patients suffering from a wide range of diseases. Recent public health crises such as the outbreaks of Ebola and the Zika virus and the urgent calls for vaccines to be developed have reinforced this importance. Similarly, while remarkable progress has been made in the discovery and development of medicines to address rare diseases, several thousand such conditions still have no effective treatments.
Over the past 20 years, over 700 New Active Substances (NASs)—new small or large molecular entities—have successfully been discovered, developed and authorized by regulatory bodies for use with patients.1 Over 600 of these have additionally been authorized by the U.S. Food and Drug Administration and are used in treating American patients. The time between when a medicine is discovered and when the originator ceases to receive revenues from it can be thought of as its lifetime. Two measures of a new medicine’s lifetime are of particular importance. The first is the time taken from the discovery of a new molecule until it reaches patients; the second is the time that molecule has exclusivity in the market based on patents or other forms of protection. The first of these measures determines how quickly patients can receive the benefit of the biopharmaceutical innovation. The second determines how long a company has to recover its research and development investment in the particular molecule—as well as those molecules that failed to ever make it to market—and is therefore a critical measure for the sustainability of investment in future innovation.
This report profiles the NASs launched in the U.S. over the past 20 years with a view to both measures of a molecule’s lifetime, trends in these measures over time and by molecule characteristics, and implications for investors and manufacturers.
The research for this report was undertaken independently by the QuintilesIMS Institute without external funding. The contributions of Rajalakshmi Nair, Rick Sax, Onil Ghotkar and Urvashi Porwal to the development of this report are gratefully acknowledged.
Murray AitkenExecutive DirectorQuintilesIMS InstituteQuintilesIMS Institute100 IMS Drive, Parsippany, NJ 07054, [email protected] www.quintilesimsinstitute.org
©2017 QuintilesIMS and its affiliates. All reproduction rights, quotations, broadcasting, publications reserved. No part of this publication may be reproduced or transmitted in any form or by any means, electronic or mechanical, including photocopy, recording, or any information storage and retrieval system, without express written consent of QuintilesIMS and the QuintilesIMS Institute.
Find out more
If you wish to receive future reports from the QuintilesIMS Institute or join our mailing list, please click here.
Lifetime Trends in Biopharmaceutical Innovation: Recent Evidence and Implications. Report by the QuintilesIMS Institute.
Contents 1 Executive summary3 Characteristics of biopharmaceutical innovation6 Trends in time from patent filing to launch 11 Trends in time from launch to patent expiry 16 Sales trends for new molecules 24 Implications for life sciences stakeholders 27 Methodology and sources 28 References 29 Authors 30 About the QuintilesIMS Institute
1 | Lifetime Trends in Biopharmaceutical Innovation: Recent Evidence and Implications. Report by the QuintilesIMS Institute.
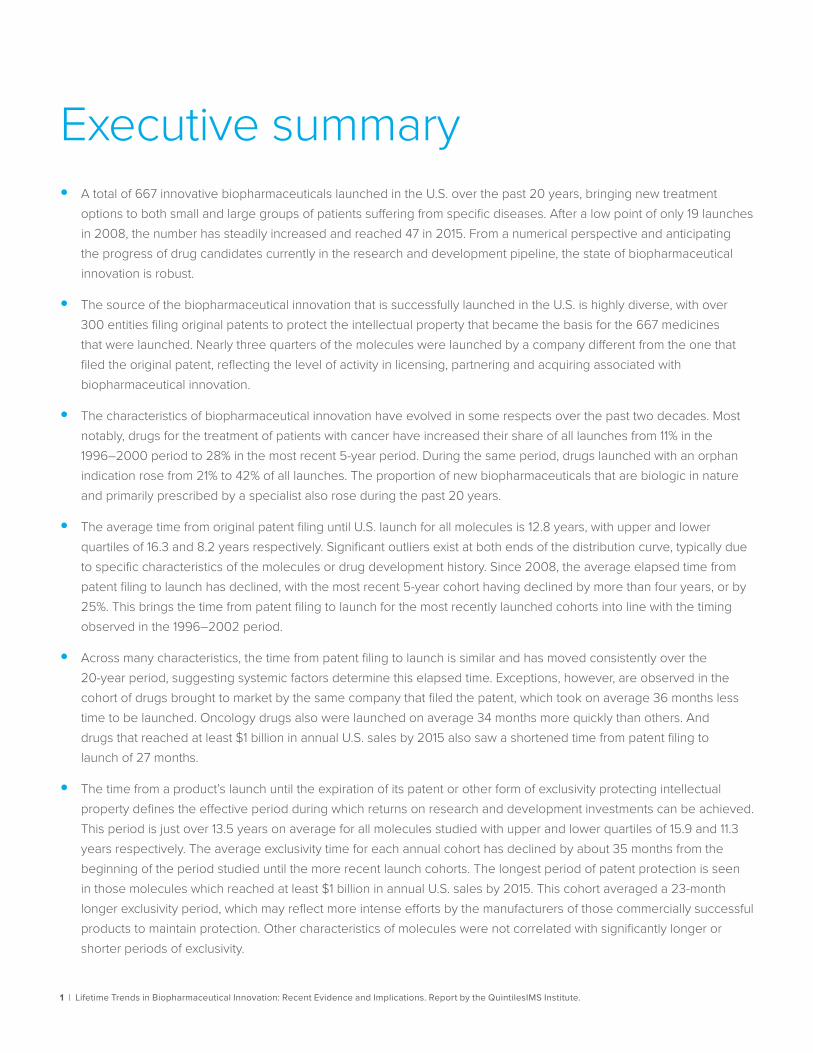
Executive summary • A total of 667 innovative biopharmaceuticals launched in the U.S. over the past 20 years, bringing new treatment
options to both small and large groups of patients suffering from specific diseases. After a low point of only 19 launches in 2008, the number has steadily increased and reached 47 in 2015. From a numerical perspective and anticipating the progress of drug candidates currently in the research and development pipeline, the state of biopharmaceutical innovation is robust.
• The source of the biopharmaceutical innovation that is successfully launched in the U.S. is highly diverse, with over 300 entities filing original patents to protect the intellectual property that became the basis for the 667 medicines that were launched. Nearly three quarters of the molecules were launched by a company different from the one that filed the original patent, reflecting the level of activity in licensing, partnering and acquiring associated with biopharmaceutical innovation.
• The characteristics of biopharmaceutical innovation have evolved in some respects over the past two decades. Most notably, drugs for the treatment of patients with cancer have increased their share of all launches from 11% in the 1996–2000 period to 28% in the most recent 5-year period. During the same period, drugs launched with an orphan indication rose from 21% to 42% of all launches. The proportion of new biopharmaceuticals that are biologic in nature and primarily prescribed by a specialist also rose during the past 20 years.
• The average time from original patent filing until U.S. launch for all molecules is 12.8 years, with upper and lower quartiles of 16.3 and 8.2 years respectively. Significant outliers exist at both ends of the distribution curve, typically due to specific characteristics of the molecules or drug development history. Since 2008, the average elapsed time from patent filing to launch has declined, with the most recent 5-year cohort having declined by more than four years, or by 25%. This brings the time from patent filing to launch for the most recently launched cohorts into line with the timing observed in the 1996–2002 period.
• Across many characteristics, the time from patent filing to launch is similar and has moved consistently over the 20-year period, suggesting systemic factors determine this elapsed time. Exceptions, however, are observed in the cohort of drugs brought to market by the same company that filed the patent, which took on average 36 months less time to be launched. Oncology drugs also were launched on average 34 months more quickly than others. And drugs that reached at least $1 billion in annual U.S. sales by 2015 also saw a shortened time from patent filing to launch of 27 months.
• The time from a product’s launch until the expiration of its patent or other form of exclusivity protecting intellectual property defines the effective period during which returns on research and development investments can be achieved. This period is just over 13.5 years on average for all molecules studied with upper and lower quartiles of 15.9 and 11.3 years respectively. The average exclusivity time for each annual cohort has declined by about 35 months from the beginning of the period studied until the more recent launch cohorts. The longest period of patent protection is seen in those molecules which reached at least $1 billion in annual U.S. sales by 2015. This cohort averaged a 23-month longer exclusivity period, which may reflect more intense efforts by the manufacturers of those commercially successful products to maintain protection. Other characteristics of molecules were not correlated with significantly longer or shorter periods of exclusivity.
2 | Lifetime Trends in Biopharmaceutical Innovation: Recent Evidence and Implications. Report by the QuintilesIMS Institute.
EXECUTIVE SUMMARY
• Sales trends for medicines launched over the past 20 years are characterized by a relatively small number of outlier products with significantly higher sales than the majority of products. In each year, the five drugs with the highest cumulative sales in their first five years on the market average 14 times higher sales than the rest of drugs launched that year.
• Only 19 drugs have reached the $1 billion in annual sales mark within their first five years on the market over the past 20 years, but 9 of these were launched in the past five years, including the only four drugs that exceeded $3 billion in annual sales within five years of their launch, and among these two notable hepatitis C drugs.
• The majority of drug launches achieve very modest levels of average annual sales in their first five years on the market. Over the 20-year period, 62% of the launches averaged less than $100 million in average annual sales during their initial five years following launch. This percentage was 64% for the most recent cohort, reflecting the shift to orphan drugs, which typically achieve lower levels of annual sales, and the growing competitiveness of the market and access restrictions for newly launched drugs.
• The time elapsed from a product’s launch until it reaches peak sales in the U.S. has been generally shortening during the past 20 years. A growing percentage of products launched are taking longer than five years to reach their peak sales, which may reflect slower progress to reach the patients who will benefit from the new medicines. In earlier periods, the most common products to peak within five years of launch were cancer products, as products rapidly reached their target patient group and also were replaced in usage just as quickly when better treatments became available. The more recently launched cancer treatments are expanding their range of indications which extends their use and extends their time to reach peak sales.
• A relatively consistent 24–27% of products are reaching their peak sales in less than five years, including a small number in the last five years where data is incomplete. In addition to cancer products, which in earlier periods peaked within five years of launch, hepatitis C treatments have been notable for rapid adoption and subsequent decline as newer treatment options address significant unmet need in the disease.
• The U.S. market remains of vital importance to biopharmaceutical innovation, accounting for more than 61% of a new drug’s sales over its first five years following launch, and 68% for the cohort of launches in the 2011–15 period. Ex-U.S. markets are generally proving more challenging for biopharmaceutical innovation from both a pricing and volume perspective.
• For manufacturers and investors alike, the prospects for biopharmaceutical innovation remain positive, even as the time elapsed from patent filing to launch remains stubbornly long and the period of exclusivity following launch is steadily declining. The commercial returns for a small number of outlier molecules are outsized but rare, while a substantial number of molecules being launched achieve levels of commercial success that fall far below threshold levels of economic return. Stakeholders with an interest in maintaining the biopharmaceutical innovation cycle are looking to seize opportunities to improve returns while lowering investment levels, many of which are now possible through harnessing the insights derived from real-world evidence and big data.
3 | Lifetime Trends in Biopharmaceutical Innovation: Recent Evidence and Implications. Report by the QuintilesIMS Institute.
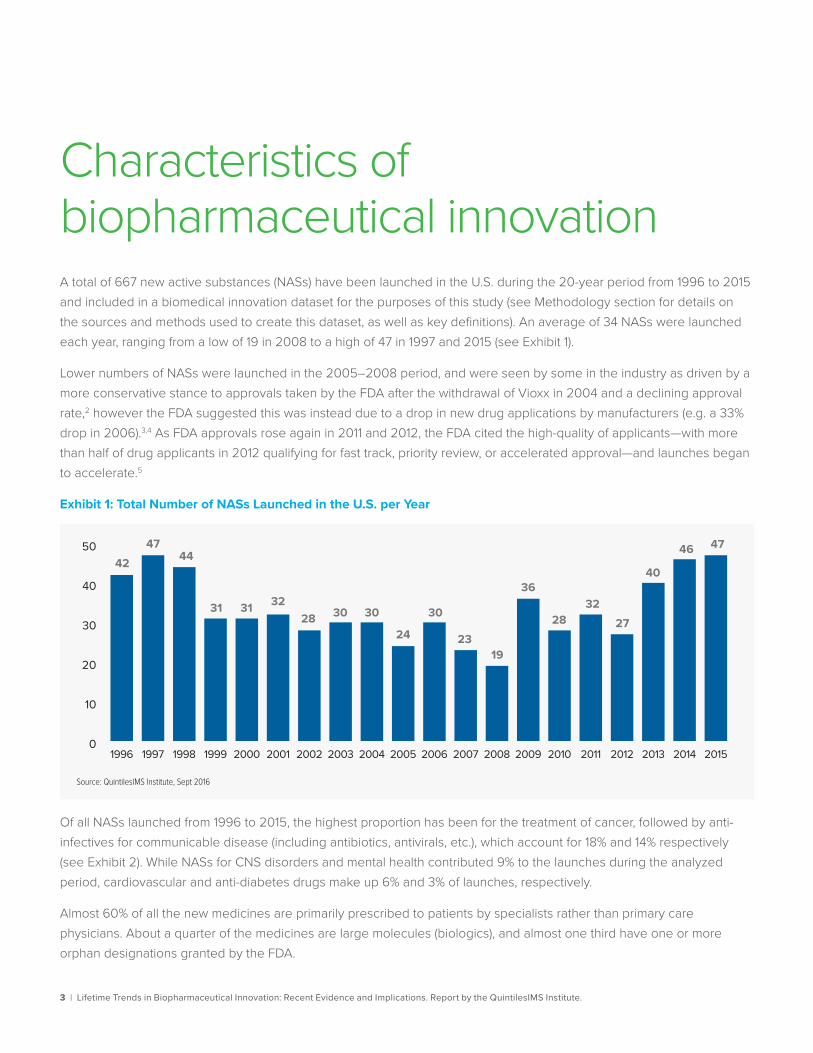
Characteristics of biopharmaceutical innovation A total of 667 new active substances (NASs) have been launched in the U.S. during the 20-year period from 1996 to 2015 and included in a biomedical innovation dataset for the purposes of this study (see Methodology section for details on the sources and methods used to create this dataset, as well as key definitions). An average of 34 NASs were launched each year, ranging from a low of 19 in 2008 to a high of 47 in 1997 and 2015 (see Exhibit 1).
Lower numbers of NASs were launched in the 2005–2008 period, and were seen by some in the industry as driven by a more conservative stance to approvals taken by the FDA after the withdrawal of Vioxx in 2004 and a declining approval rate,2 however the FDA suggested this was instead due to a drop in new drug applications by manufacturers (e.g. a 33% drop in 2006).3,4 As FDA approvals rose again in 2011 and 2012, the FDA cited the high-quality of applicants—with more than half of drug applicants in 2012 qualifying for fast track, priority review, or accelerated approval—and launches began to accelerate.5
Exhibit 1: Total Number of NASs Launched in the U.S. per Year
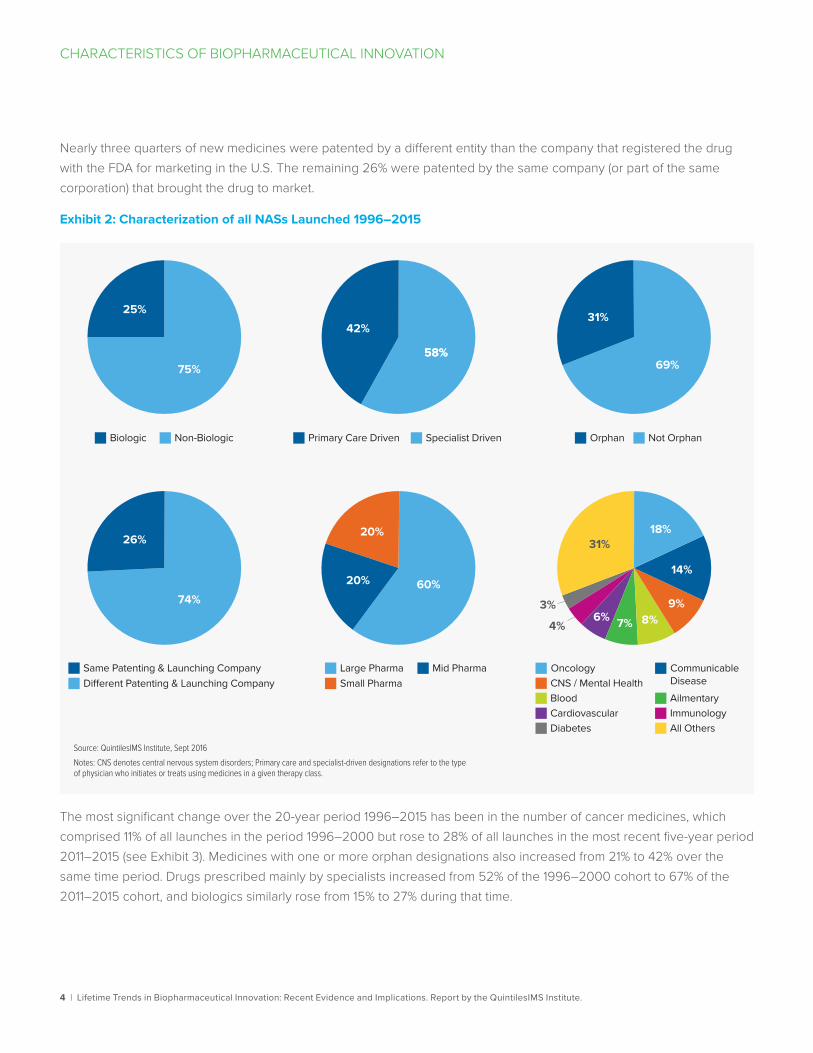
Of all NASs launched from 1996 to 2015, the highest proportion has been for the treatment of cancer, followed by anti-infectives for communicable disease (including antibiotics, antivirals, etc.), which account for 18% and 14% respectively (see Exhibit 2). While NASs for CNS disorders and mental health contributed 9% to the launches during the analyzed period, cardiovascular and anti-diabetes drugs make up 6% and 3% of launches, respectively.
Almost 60% of all the new medicines are primarily prescribed to patients by specialists rather than primary care physicians. About a quarter of the medicines are large molecules (biologics), and almost one third have one or more orphan designations granted by the FDA.
0
10
20
30
40
5042
4744
31 31 3228 30 30
24
30
2319
36
2832
27
40
46 47
Source: QuintilesIMS Institute, Sept 2016
1997 1998 1999 2000 2001 2002 2003 2004 2005 2006 2007 2008 2009 2010 2011 2012 2013 20141996 2015
4 | Lifetime Trends in Biopharmaceutical Innovation: Recent Evidence and Implications. Report by the QuintilesIMS Institute.
CHARACTERISTICS OF BIOPHARMACEUTICAL INNOVATION
Nearly three quarters of new medicines were patented by a different entity than the company that registered the drug with the FDA for marketing in the U.S. The remaining 26% were patented by the same company (or part of the same corporation) that brought the drug to market.
Exhibit 2: Characterization of all NASs Launched 1996–2015
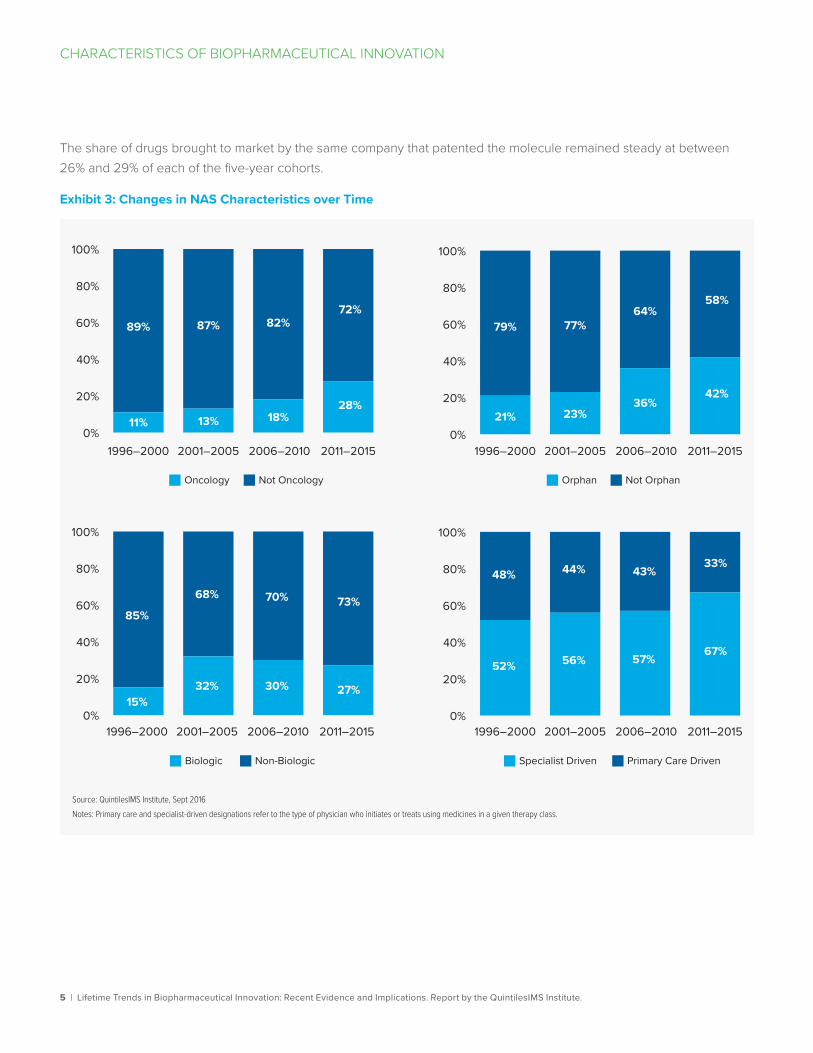
The most significant change over the 20-year period 1996–2015 has been in the number of cancer medicines, which comprised 11% of all launches in the period 1996–2000 but rose to 28% of all launches in the most recent five-year period 2011–2015 (see Exhibit 3). Medicines with one or more orphan designations also increased from 21% to 42% over the same time period. Drugs prescribed mainly by specialists increased from 52% of the 1996–2000 cohort to 67% of the 2011–2015 cohort, and biologics similarly rose from 15% to 27% during that time.
Same Patenting & Launching Company
25%
75%
Biologic Non-Biologic
26%
74%
Di�erent Patenting & Launching Company
Primary Care Driven Specialist Driven Orphan Not Orphan
42%
58%
Large PharmaSmall Pharma
Mid Pharma
60%
58%
31%
69%
20%
20%
Oncology Communicable DiseaseCNS / Mental Health
Blood AilmentaryCardiovascularDiabetes
ImmunologyAll Others
4%
3%
31%18%
14%
9%8%7%6%
Source: QuintilesIMS Institute, Sept 2016Notes: CNS denotes central nervous system disorders; Primary care and specialist-driven designations refer to the type of physician who initiates or treats using medicines in a given therapy class.
5 | Lifetime Trends in Biopharmaceutical Innovation: Recent Evidence and Implications. Report by the QuintilesIMS Institute.
CHARACTERISTICS OF BIOPHARMACEUTICAL INNOVATION
The share of drugs brought to market by the same company that patented the molecule remained steady at between 26% and 29% of each of the five-year cohorts.
Exhibit 3: Changes in NAS Characteristics over Time
0%
20%
40%
60%
80%
100%
0%
20%
40%
60%
80%
100%
0%
20%
40%
60%
80%
100%
0%
20%
40%
60%
80%
100%
1996–2000 2001–2005 2006–2010 2011–2015 1996–2000 2001–2005 2006–2010 2011–2015
1996–2000 2001–2005 2006–2010 2011–2015 1996–2000 2001–2005 2006–2010 2011–2015
89%
11%
87%
13%
82%
18%
72%
28%
79%
21%
77%
23%
64%
36%
58%
42%
85%
15%
68%
32%
70%
30%
73%
27%
48%
52%
44%
56%
43%
57%
33%
67%
Biologic Non-Biologic Specialist Driven Primary Care Driven
Orphan Not OrphanOncology Not Oncology
Source: QuintilesIMS Institute, Sept 2016Notes: Primary care and specialist-driven designations refer to the type of physician who initiates or treats using medicines in a given therapy class.
6 | Lifetime Trends in Biopharmaceutical Innovation: Recent Evidence and Implications. Report by the QuintilesIMS Institute.
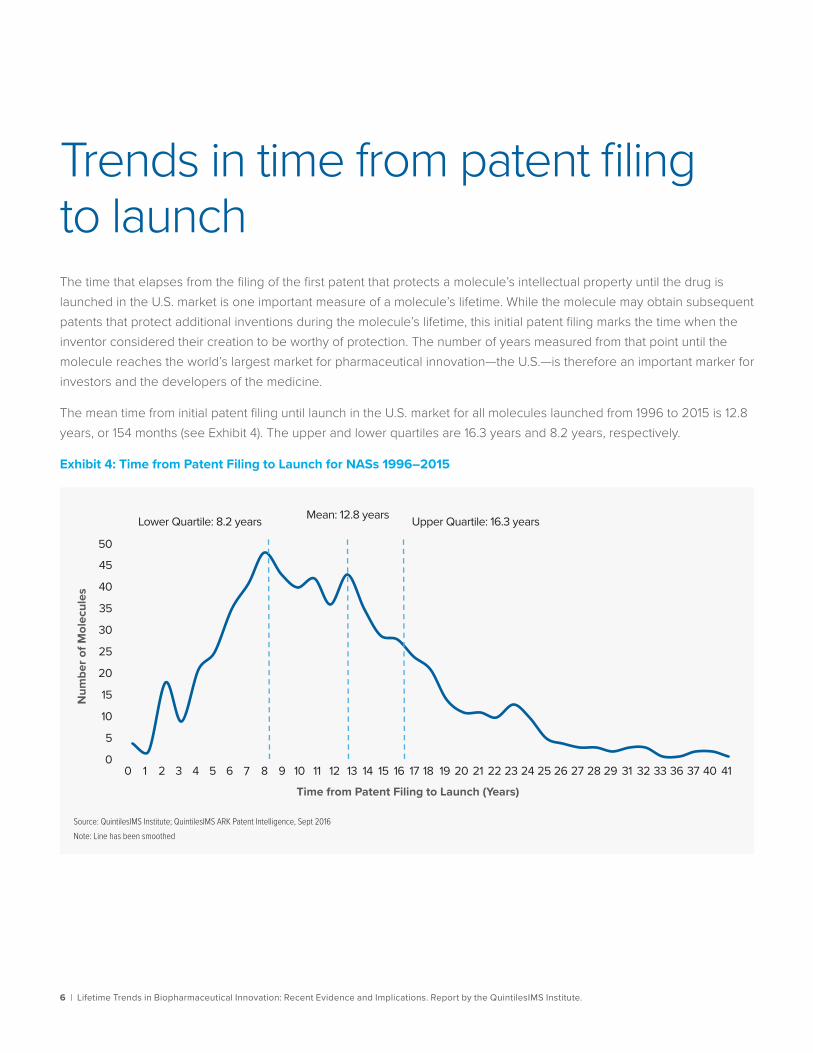
Trends in time from patent filing to launch The time that elapses from the filing of the first patent that protects a molecule’s intellectual property until the drug is launched in the U.S. market is one important measure of a molecule’s lifetime. While the molecule may obtain subsequent patents that protect additional inventions during the molecule’s lifetime, this initial patent filing marks the time when the inventor considered their creation to be worthy of protection. The number of years measured from that point until the molecule reaches the world’s largest market for pharmaceutical innovation—the U.S.—is therefore an important marker for investors and the developers of the medicine.
The mean time from initial patent filing until launch in the U.S. market for all molecules launched from 1996 to 2015 is 12.8 years, or 154 months (see Exhibit 4). The upper and lower quartiles are 16.3 years and 8.2 years, respectively.
Exhibit 4: Time from Patent Filing to Launch for NASs 1996–2015
0
5
10
15
20
25
30
35
40
45
50
0 1 2 3 4 5 6 7 8 9 10 11 12 13 14 15 16 17 18 19 20 21 22 23 24 25 26 27 28 29 31 32 33 36 37 40 41
Mean: 12.8 years
Source: QuintilesIMS Institute; QuintilesIMS ARK Patent Intelligence, Sept 2016Note: Line has been smoothed
Num
ber o
f Mol
ecul
es
Time from Patent Filing to Launch (Years)
Upper Quartile: 16.3 yearsLower Quartile: 8.2 years
7 | Lifetime Trends in Biopharmaceutical Innovation: Recent Evidence and Implications. Report by the QuintilesIMS Institute.
TRENDS IN TIME FROM PATENT FILING TO LAUNCH
Note on Very Long and Very Short Patent to Launch Times
In some cases, based on the available information, patents for NASs were filed at or close to their launch date. This can occur, for example, when the molecule is a naturally occurring substance or when the original patent was filed in another country. In other cases, many years or even decades can elapse between a drug’s initial patent and its eventual launch. This can reflect, for example, molecules which were patented and whose development was left dormant for a period.
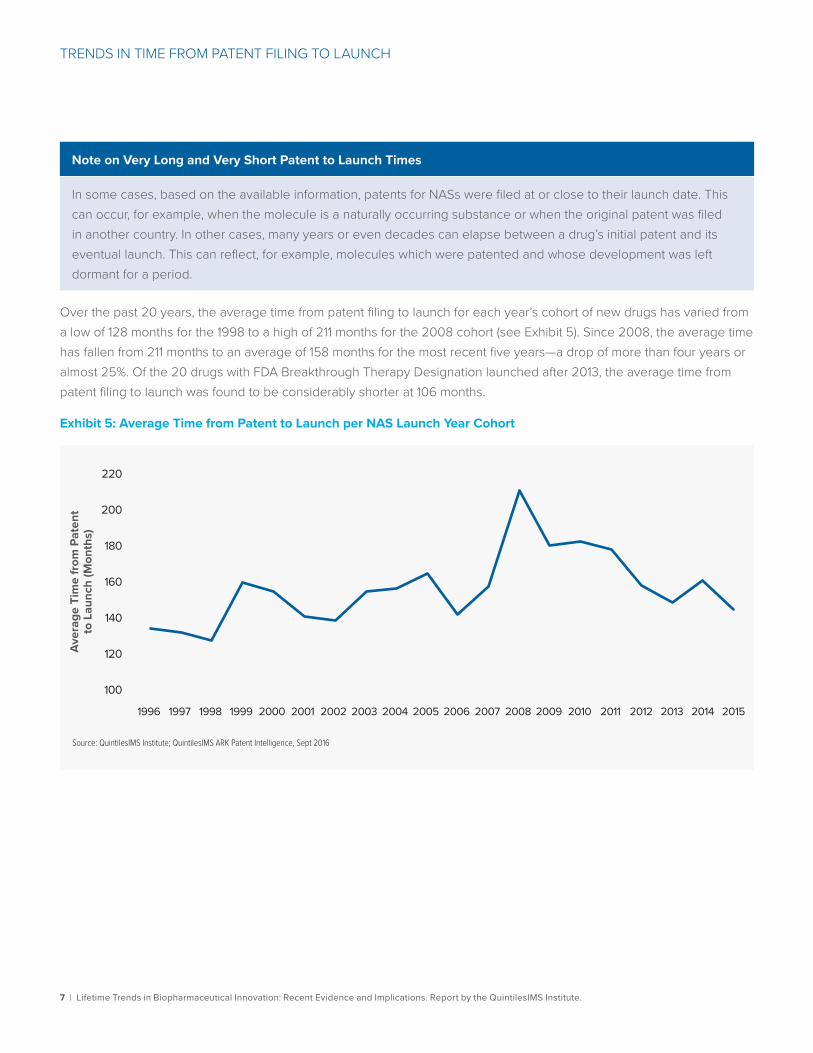
Over the past 20 years, the average time from patent filing to launch for each year’s cohort of new drugs has varied from a low of 128 months for the 1998 to a high of 211 months for the 2008 cohort (see Exhibit 5). Since 2008, the average time has fallen from 211 months to an average of 158 months for the most recent five years—a drop of more than four years or almost 25%. Of the 20 drugs with FDA Breakthrough Therapy Designation launched after 2013, the average time from patent filing to launch was found to be considerably shorter at 106 months.
Exhibit 5: Average Time from Patent to Launch per NAS Launch Year Cohort
Source: QuintilesIMS Institute; QuintilesIMS ARK Patent Intelligence, Sept 2016
Aver
age
Tim
e fr
om P
aten
t to
Lau
nch
(Mon
ths)
100
120
140
160
180
200
220
1997 1998 1999 2000 2001 2002 2003 2004 2005 2006 2007 2008 2009 2010 2011 2012 2013 20141996 2015
8 | Lifetime Trends in Biopharmaceutical Innovation: Recent Evidence and Implications. Report by the QuintilesIMS Institute.
TRENDS IN TIME FROM PATENT FILING TO LAUNCH
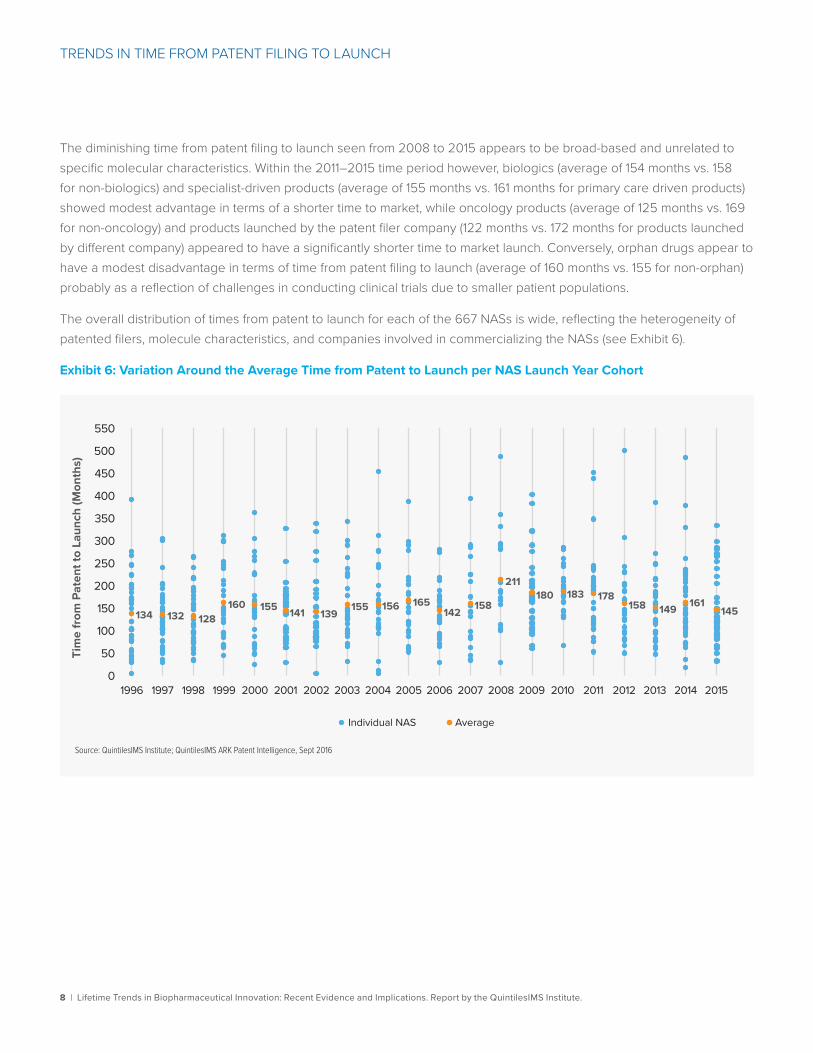
The diminishing time from patent filing to launch seen from 2008 to 2015 appears to be broad-based and unrelated to specific molecular characteristics. Within the 2011–2015 time period however, biologics (average of 154 months vs. 158 for non-biologics) and specialist-driven products (average of 155 months vs. 161 months for primary care driven products) showed modest advantage in terms of a shorter time to market, while oncology products (average of 125 months vs. 169 for non-oncology) and products launched by the patent filer company (122 months vs. 172 months for products launched by different company) appeared to have a significantly shorter time to market launch. Conversely, orphan drugs appear to have a modest disadvantage in terms of time from patent filing to launch (average of 160 months vs. 155 for non-orphan) probably as a reflection of challenges in conducting clinical trials due to smaller patient populations.
The overall distribution of times from patent to launch for each of the 667 NASs is wide, reflecting the heterogeneity of patented filers, molecule characteristics, and companies involved in commercializing the NASs (see Exhibit 6).
Exhibit 6: Variation Around the Average Time from Patent to Launch per NAS Launch Year Cohort
Source: QuintilesIMS Institute; QuintilesIMS ARK Patent Intelligence, Sept 2016
134 132 128160 155 141 139
155 156 165142
158
211180 183 178
158 149 161145
0
50
100
150
200
250
300
350
400
450
500
550
Tim
e fr
om P
aten
t to
Laun
ch (M
onth
s)
Individual NAS Average
1997 1998 1999 2000 2001 2002 2003 2004 2005 2006 2007 2008 2009 2010 2011 2012 2013 20141996 2015
9 | Lifetime Trends in Biopharmaceutical Innovation: Recent Evidence and Implications. Report by the QuintilesIMS Institute.
TRENDS IN TIME FROM PATENT FILING TO LAUNCH
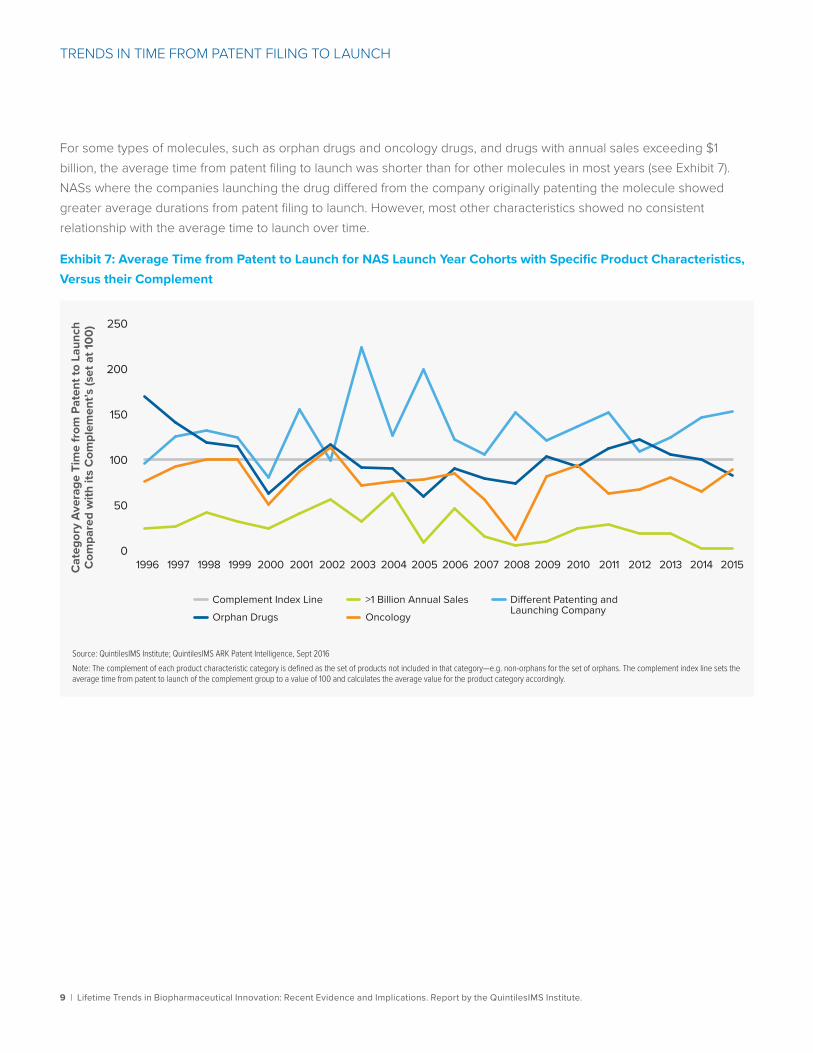
For some types of molecules, such as orphan drugs and oncology drugs, and drugs with annual sales exceeding $1 billion, the average time from patent filing to launch was shorter than for other molecules in most years (see Exhibit 7). NASs where the companies launching the drug differed from the company originally patenting the molecule showed greater average durations from patent filing to launch. However, most other characteristics showed no consistent relationship with the average time to launch over time.
Exhibit 7: Average Time from Patent to Launch for NAS Launch Year Cohorts with Specific Product Characteristics, Versus their Complement
Source: QuintilesIMS Institute; QuintilesIMS ARK Patent Intelligence, Sept 2016Note: The complement of each product characteristic category is defined as the set of products not included in that category—e.g. non-orphans for the set of orphans. The complement index line sets the average time from patent to launch of the complement group to a value of 100 and calculates the average value for the product category accordingly.
Cat
egor
y Av
erag
e Ti
me
from
Pat
ent t
o La
unch
C
ompa
red
with
its
Com
plem
ent’s
(set
at 1
00)
0
50
100
150
200
250
Complement Index LineOrphan Drugs
Di�erent Patenting and Launching CompanyOncology
>1 Billion Annual Sales
1997 1998 1999 2000 2001 2002 2003 2004 2005 2006 2007 2008 2009 2010 2011 2012 2013 20141996 2015
10 | Lifetime Trends in Biopharmaceutical Innovation: Recent Evidence and Implications. Report by the QuintilesIMS Institute.
TRENDS IN TIME FROM PATENT FILING TO LAUNCH
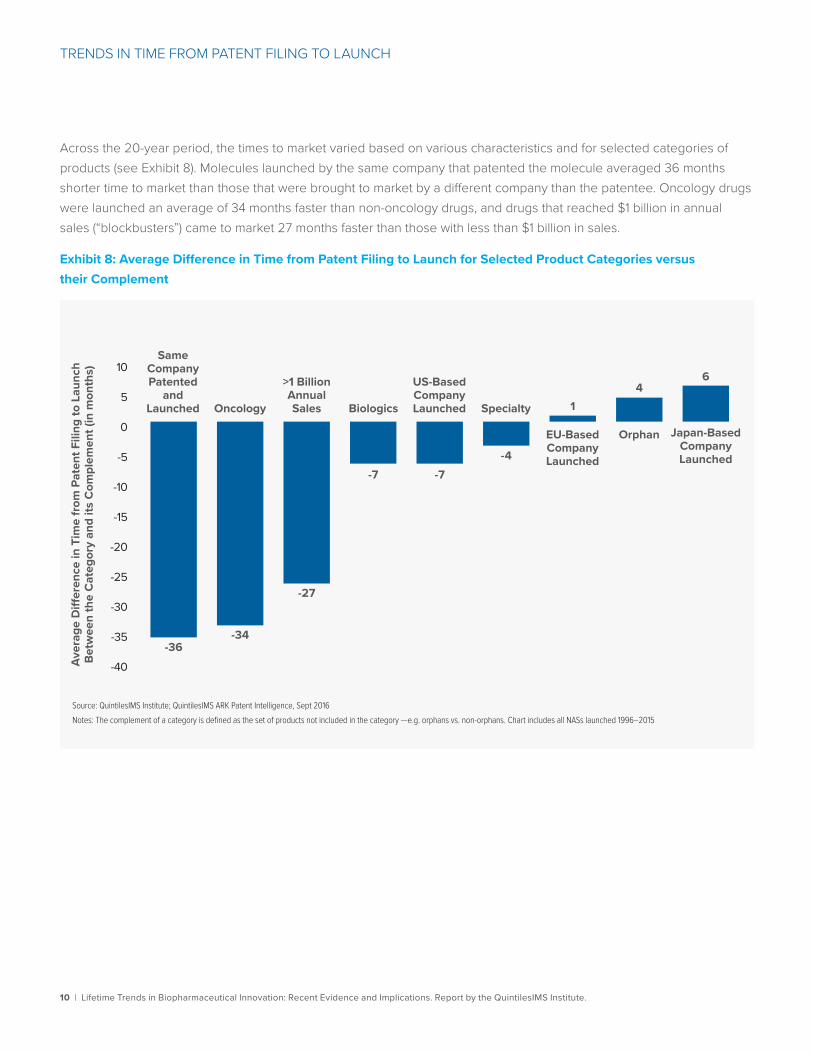
Across the 20-year period, the times to market varied based on various characteristics and for selected categories of products (see Exhibit 8). Molecules launched by the same company that patented the molecule averaged 36 months shorter time to market than those that were brought to market by a different company than the patentee. Oncology drugs were launched an average of 34 months faster than non-oncology drugs, and drugs that reached $1 billion in annual sales (“blockbusters”) came to market 27 months faster than those with less than $1 billion in sales.
Exhibit 8: Average Difference in Time from Patent Filing to Launch for Selected Product Categories versus their Complement
Source: QuintilesIMS Institute; QuintilesIMS ARK Patent Intelligence, Sept 2016Notes: The complement of a category is defined as the set of products not included in the category —e.g. orphans vs. non-orphans. Chart includes all NASs launched 1996–2015
Aver
age
Di�
eren
ce in
Tim
e fr
om P
aten
t Fili
ng to
Lau
nch
Betw
een
the
Cat
egor
y an
d its
Com
plem
ent (
in m
onth
s)
-40
-35
-30
-25
-20
-15
-10
-5
0
5
106
Japan-Based Company Launched
-36-34
-27
-7 -7-4
14
SameCompanyPatented
andLaunched Oncology
>1 BillionAnnualSales Biologics
US-BasedCompanyLaunched Specialty
EU-Based Company Launched
Orphan
11 | Lifetime Trends in Biopharmaceutical Innovation: Recent Evidence and Implications. Report by the QuintilesIMS Institute.
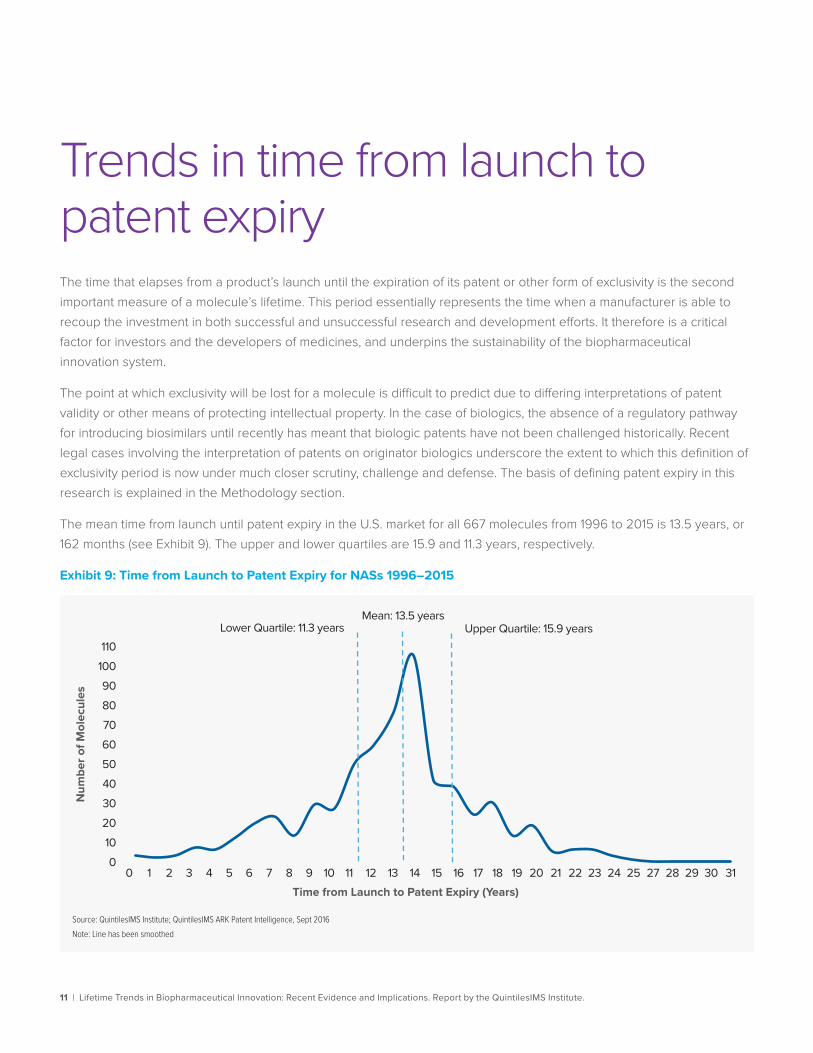
Trends in time from launch to patent expiryThe time that elapses from a product’s launch until the expiration of its patent or other form of exclusivity is the second important measure of a molecule’s lifetime. This period essentially represents the time when a manufacturer is able to recoup the investment in both successful and unsuccessful research and development efforts. It therefore is a critical factor for investors and the developers of medicines, and underpins the sustainability of the biopharmaceutical innovation system.
The point at which exclusivity will be lost for a molecule is difficult to predict due to differing interpretations of patent validity or other means of protecting intellectual property. In the case of biologics, the absence of a regulatory pathway for introducing biosimilars until recently has meant that biologic patents have not been challenged historically. Recent legal cases involving the interpretation of patents on originator biologics underscore the extent to which this definition of exclusivity period is now under much closer scrutiny, challenge and defense. The basis of defining patent expiry in this research is explained in the Methodology section.
The mean time from launch until patent expiry in the U.S. market for all 667 molecules from 1996 to 2015 is 13.5 years, or 162 months (see Exhibit 9). The upper and lower quartiles are 15.9 and 11.3 years, respectively.
Exhibit 9: Time from Launch to Patent Expiry for NASs 1996–2015
Num
ber o
f Mol
ecul
es
0102030405060708090
100110
0 1 2 3 4 5 6 7 8 9 10 11 12 13 14 15 16 17 18 19 20 21 22 23 24 25 27 28 29 30 31
Source: QuintilesIMS Institute; QuintilesIMS ARK Patent Intelligence, Sept 2016Note: Line has been smoothed
Time from Launch to Patent Expiry (Years)
Mean: 13.5 yearsUpper Quartile: 15.9 yearsLower Quartile: 11.3 years
12 | Lifetime Trends in Biopharmaceutical Innovation: Recent Evidence and Implications. Report by the QuintilesIMS Institute.
TRENDS IN TIME FROM LAUNCH TO PATENT EXPIRY
Note on Patent Life
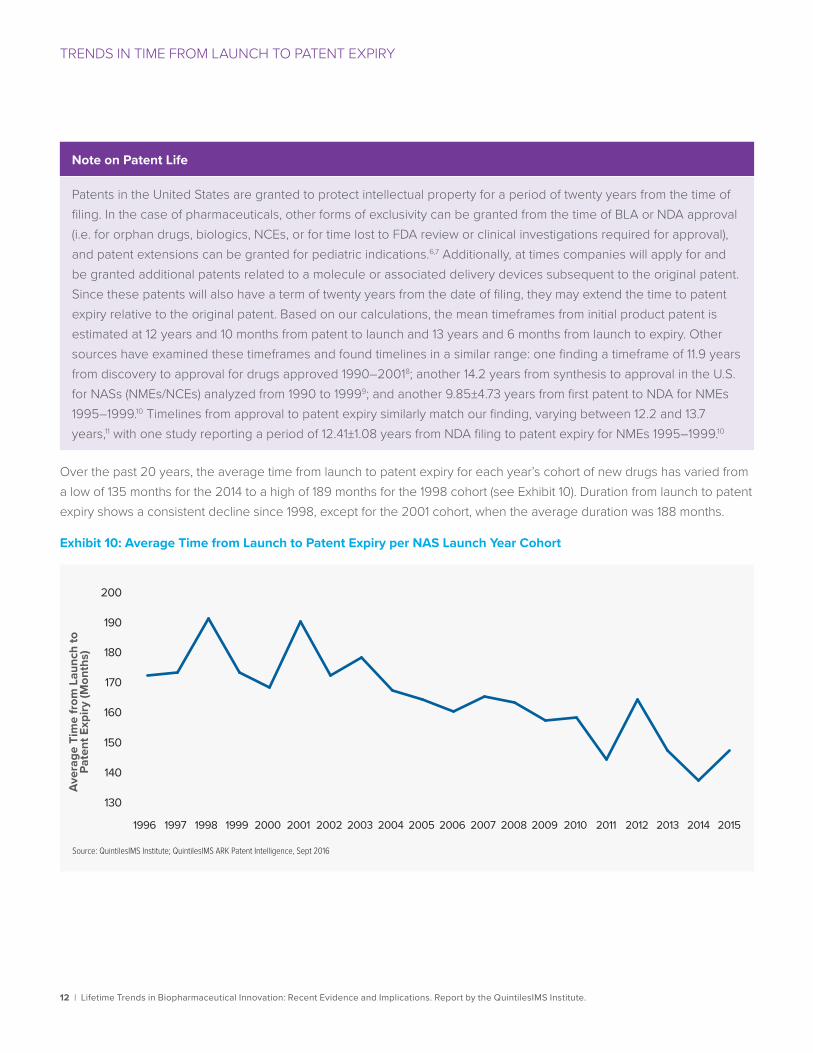
Patents in the United States are granted to protect intellectual property for a period of twenty years from the time of filing. In the case of pharmaceuticals, other forms of exclusivity can be granted from the time of BLA or NDA approval (i.e. for orphan drugs, biologics, NCEs, or for time lost to FDA review or clinical investigations required for approval), and patent extensions can be granted for pediatric indications.6,7 Additionally, at times companies will apply for and be granted additional patents related to a molecule or associated delivery devices subsequent to the original patent. Since these patents will also have a term of twenty years from the date of filing, they may extend the time to patent expiry relative to the original patent. Based on our calculations, the mean timeframes from initial product patent is estimated at 12 years and 10 months from patent to launch and 13 years and 6 months from launch to expiry. Other sources have examined these timeframes and found timelines in a similar range: one finding a timeframe of 11.9 years from discovery to approval for drugs approved 1990–20018; another 14.2 years from synthesis to approval in the U.S. for NASs (NMEs/NCEs) analyzed from 1990 to 19999; and another 9.85±4.73 years from first patent to NDA for NMEs 1995–1999.10 Timelines from approval to patent expiry similarly match our finding, varying between 12.2 and 13.7 years,11 with one study reporting a period of 12.41±1.08 years from NDA filing to patent expiry for NMEs 1995–1999.10
Over the past 20 years, the average time from launch to patent expiry for each year’s cohort of new drugs has varied from a low of 135 months for the 2014 to a high of 189 months for the 1998 cohort (see Exhibit 10). Duration from launch to patent expiry shows a consistent decline since 1998, except for the 2001 cohort, when the average duration was 188 months.
Exhibit 10: Average Time from Launch to Patent Expiry per NAS Launch Year Cohort
Source: QuintilesIMS Institute; QuintilesIMS ARK Patent Intelligence, Sept 2016
Aver
age
Tim
e fr
om L
aunc
h to
Pa
tent
Exp
iry (M
onth
s)
130
160
170
180
190
140
150
200
1997 1998 1999 2000 2001 2002 2003 2004 2005 2006 2007 2008 2009 2010 2011 2012 2013 20141996 2015
13 | Lifetime Trends in Biopharmaceutical Innovation: Recent Evidence and Implications. Report by the QuintilesIMS Institute.
TRENDS IN TIME FROM LAUNCH TO PATENT EXPIRY
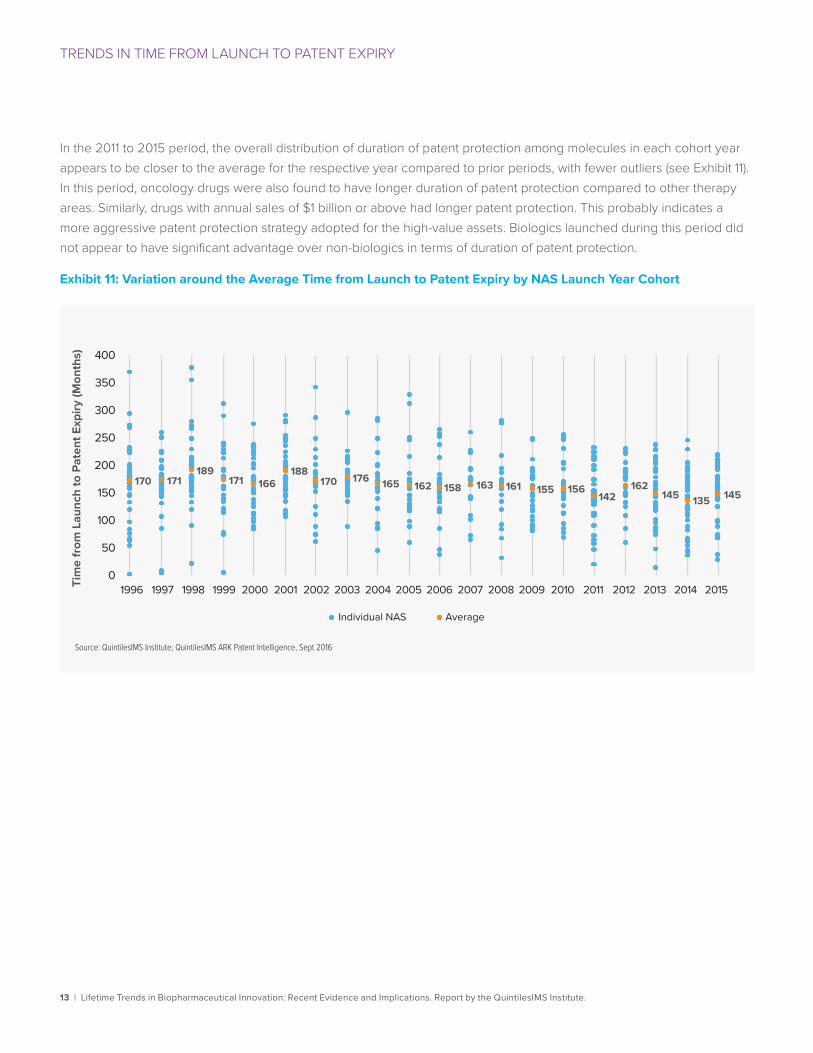
In the 2011 to 2015 period, the overall distribution of duration of patent protection among molecules in each cohort year appears to be closer to the average for the respective year compared to prior periods, with fewer outliers (see Exhibit 11). In this period, oncology drugs were also found to have longer duration of patent protection compared to other therapy areas. Similarly, drugs with annual sales of $1 billion or above had longer patent protection. This probably indicates a more aggressive patent protection strategy adopted for the high-value assets. Biologics launched during this period did not appear to have significant advantage over non-biologics in terms of duration of patent protection.
Exhibit 11: Variation around the Average Time from Launch to Patent Expiry by NAS Launch Year Cohort
Source: QuintilesIMS Institute; QuintilesIMS ARK Patent Intelligence, Sept 2016
Tim
e fr
om L
aunc
h to
Pat
ent E
xpiry
(Mon
ths)
1997 1998 1999 2000 2001 2002 2003 2004 2005 2006 2007 2008 2009 2010 2011 2012 2013 20141996 2015
170 171189
171 166188
170 176 165 162 158 163 161 155 156142
162145 135 145
0
50
100
150
200
250
300
350
400
Individual NAS Average
14 | Lifetime Trends in Biopharmaceutical Innovation: Recent Evidence and Implications. Report by the QuintilesIMS Institute.
TRENDS IN TIME FROM LAUNCH TO PATENT EXPIRY
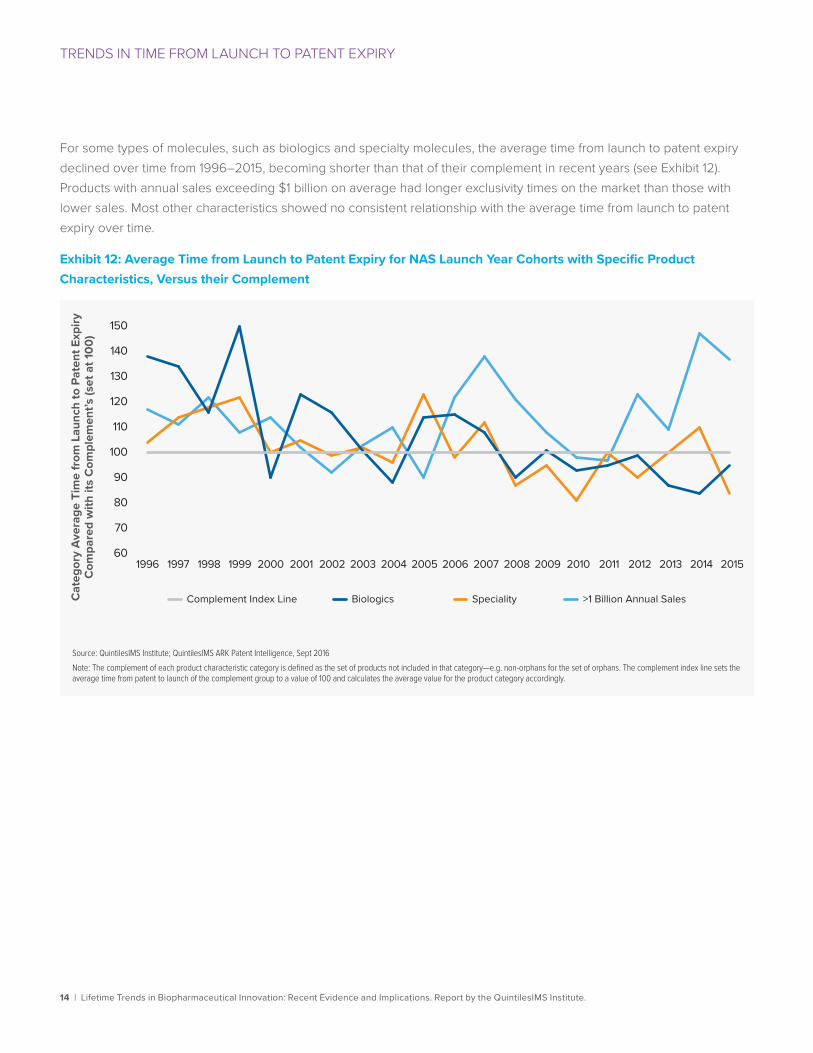
For some types of molecules, such as biologics and specialty molecules, the average time from launch to patent expiry declined over time from 1996–2015, becoming shorter than that of their complement in recent years (see Exhibit 12). Products with annual sales exceeding $1 billion on average had longer exclusivity times on the market than those with lower sales. Most other characteristics showed no consistent relationship with the average time from launch to patent expiry over time.
Exhibit 12: Average Time from Launch to Patent Expiry for NAS Launch Year Cohorts with Specific Product Characteristics, Versus their Complement
Source: QuintilesIMS Institute; QuintilesIMS ARK Patent Intelligence, Sept 2016Note: The complement of each product characteristic category is defined as the set of products not included in that category—e.g. non-orphans for the set of orphans. The complement index line sets the average time from patent to launch of the complement group to a value of 100 and calculates the average value for the product category accordingly.
Cat
egor
y Av
erag
e Ti
me
from
Lau
nch
to P
aten
t Exp
iry
Com
pare
d w
ith it
s C
ompl
emen
t’s (s
et a
t 100
)
Complement Index Line Biologics Speciality >1 Billion Annual Sales
1997 1998 1999 2000 2001 2002 2003 2004 2005 2006 2007 2008 2009 2010 2011 2012 2013 20141996 201560
90
120
150
70
100
130
80
110
140
15 | Lifetime Trends in Biopharmaceutical Innovation: Recent Evidence and Implications. Report by the QuintilesIMS Institute.
TRENDS IN TIME FROM LAUNCH TO PATENT EXPIRY
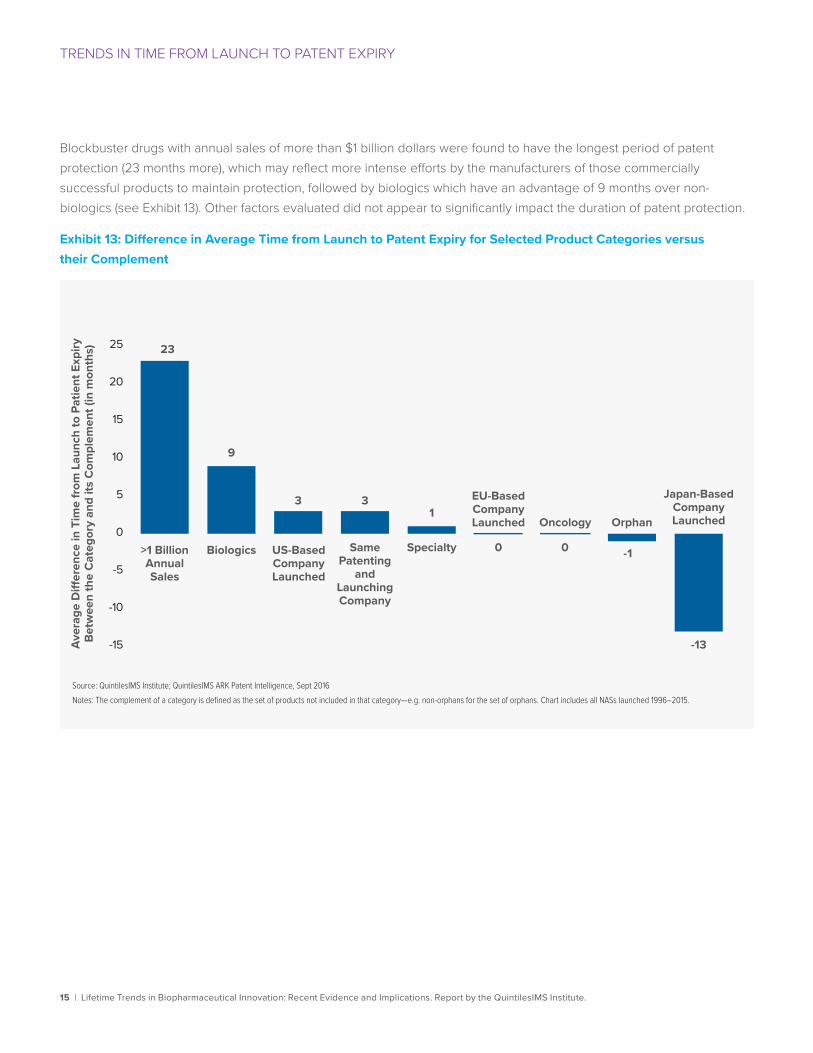
Blockbuster drugs with annual sales of more than $1 billion dollars were found to have the longest period of patent protection (23 months more), which may reflect more intense efforts by the manufacturers of those commercially successful products to maintain protection, followed by biologics which have an advantage of 9 months over non-biologics (see Exhibit 13). Other factors evaluated did not appear to significantly impact the duration of patent protection.
Exhibit 13: Difference in Average Time from Launch to Patent Expiry for Selected Product Categories versus their Complement
Source: QuintilesIMS Institute; QuintilesIMS ARK Patent Intelligence, Sept 2016Notes: The complement of a category is defined as the set of products not included in that category—e.g. non-orphans for the set of orphans. Chart includes all NASs launched 1996–2015.
Aver
age
Di�
eren
ce in
Tim
e fr
om L
aunc
h to
Pat
ient
Exp
iry
Betw
een
the
Cat
egor
y an
d its
Com
plem
ent (
in m
onth
s)
Japan-Based Company Launched
23
9
-13
0 0 -1
13 3
Same Patenting
and Launching Company
Oncology
>1 BillionAnnualSales
Biologics US-BasedCompanyLaunched
Specialty
EU-Based Company Launched Orphan
-15
-10
-5
0
5
10
15
20
25
16 | Lifetime Trends in Biopharmaceutical Innovation: Recent Evidence and Implications. Report by the QuintilesIMS Institute.
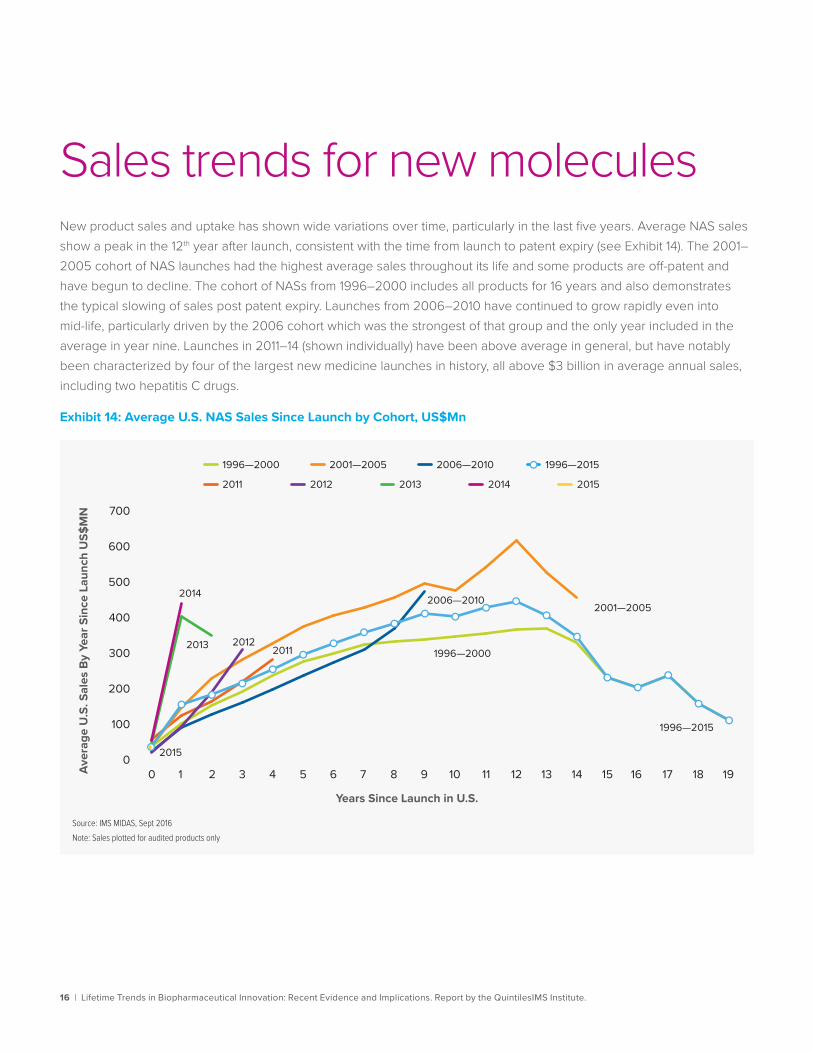
Sales trends for new moleculesNew product sales and uptake has shown wide variations over time, particularly in the last five years. Average NAS sales show a peak in the 12th year after launch, consistent with the time from launch to patent expiry (see Exhibit 14). The 2001–2005 cohort of NAS launches had the highest average sales throughout its life and some products are off-patent and have begun to decline. The cohort of NASs from 1996–2000 includes all products for 16 years and also demonstrates the typical slowing of sales post patent expiry. Launches from 2006–2010 have continued to grow rapidly even into mid-life, particularly driven by the 2006 cohort which was the strongest of that group and the only year included in the average in year nine. Launches in 2011–14 (shown individually) have been above average in general, but have notably been characterized by four of the largest new medicine launches in history, all above $3 billion in average annual sales, including two hepatitis C drugs.
Exhibit 14: Average U.S. NAS Sales Since Launch by Cohort, US$Mn
Source: IMS MIDAS, Sept 2016Note: Sales plotted for audited products only
Aver
age
U.S
. Sal
es B
y Ye
ar S
ince
Lau
nch
US$
MN
0
100
200
300
400
500
600
700
1996—2015
Years Since Launch in U.S.
1996—2015
0 1 2 3 4 5 6 7 8 9 10 11 12 13 14 15 16 17 18 19
1996—2000 2001—2005 2006—2010
2011 2012 2013 2014 2015
1996—2000
2001—20052006—2010
201120122013
2014
2015
17 | Lifetime Trends in Biopharmaceutical Innovation: Recent Evidence and Implications. Report by the QuintilesIMS Institute.
SALES TRENDS FOR NEW MOLECULES
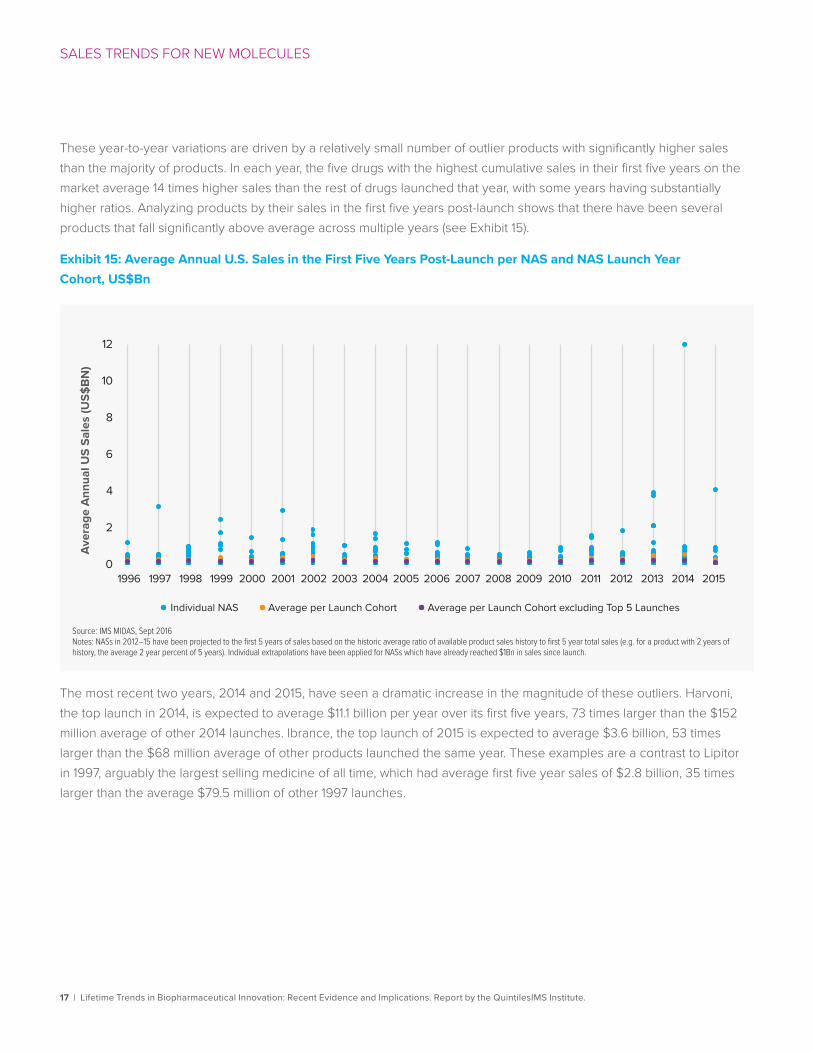
These year-to-year variations are driven by a relatively small number of outlier products with significantly higher sales than the majority of products. In each year, the five drugs with the highest cumulative sales in their first five years on the market average 14 times higher sales than the rest of drugs launched that year, with some years having substantially higher ratios. Analyzing products by their sales in the first five years post-launch shows that there have been several products that fall significantly above average across multiple years (see Exhibit 15).
Exhibit 15: Average Annual U.S. Sales in the First Five Years Post-Launch per NAS and NAS Launch Year Cohort, US$Bn
The most recent two years, 2014 and 2015, have seen a dramatic increase in the magnitude of these outliers. Harvoni, the top launch in 2014, is expected to average $11.1 billion per year over its first five years, 73 times larger than the $152 million average of other 2014 launches. Ibrance, the top launch of 2015 is expected to average $3.6 billion, 53 times larger than the $68 million average of other products launched the same year. These examples are a contrast to Lipitor in 1997, arguably the largest selling medicine of all time, which had average first five year sales of $2.8 billion, 35 times larger than the average $79.5 million of other 1997 launches.
Source: IMS MIDAS, Sept 2016Notes: NASs in 2012–15 have been projected to the first 5 years of sales based on the historic average ratio of available product sales history to first 5 year total sales (e.g. for a product with 2 years of history, the average 2 year percent of 5 years). Individual extrapolations have been applied for NASs which have already reached $1Bn in sales since launch.
1997 1998 1999 2000 2001 2002 2003 2004 2005 2006 2007 2008 2009 2010 2011 2012 2013 20141996 20150
2
4
6
8
10
12
Individual NAS Average per Launch Cohort Average per Launch Cohort excluding Top 5 Launches
Aver
age
Ann
ual U
S Sa
les
(US$
BN)
18 | Lifetime Trends in Biopharmaceutical Innovation: Recent Evidence and Implications. Report by the QuintilesIMS Institute.
SALES TRENDS FOR NEW MOLECULES
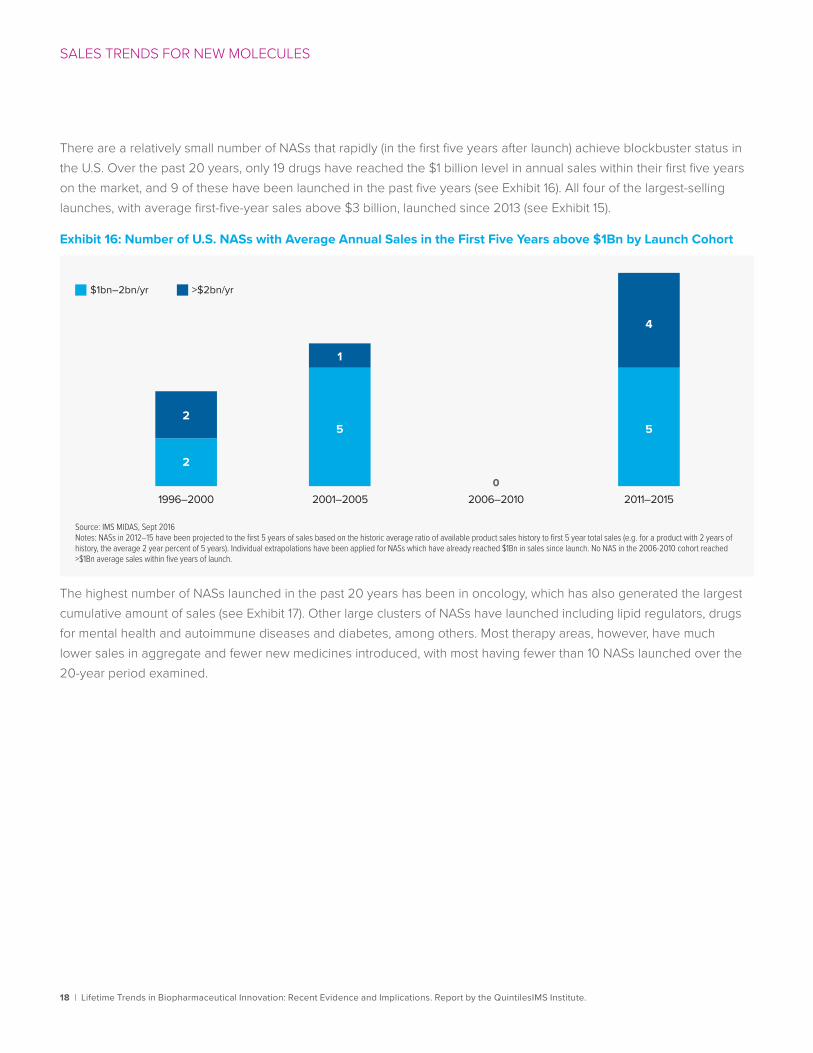
There are a relatively small number of NASs that rapidly (in the first five years after launch) achieve blockbuster status in the U.S. Over the past 20 years, only 19 drugs have reached the $1 billion level in annual sales within their first five years on the market, and 9 of these have been launched in the past five years (see Exhibit 16). All four of the largest-selling launches, with average first-five-year sales above $3 billion, launched since 2013 (see Exhibit 15).
Exhibit 16: Number of U.S. NASs with Average Annual Sales in the First Five Years above $1Bn by Launch Cohort
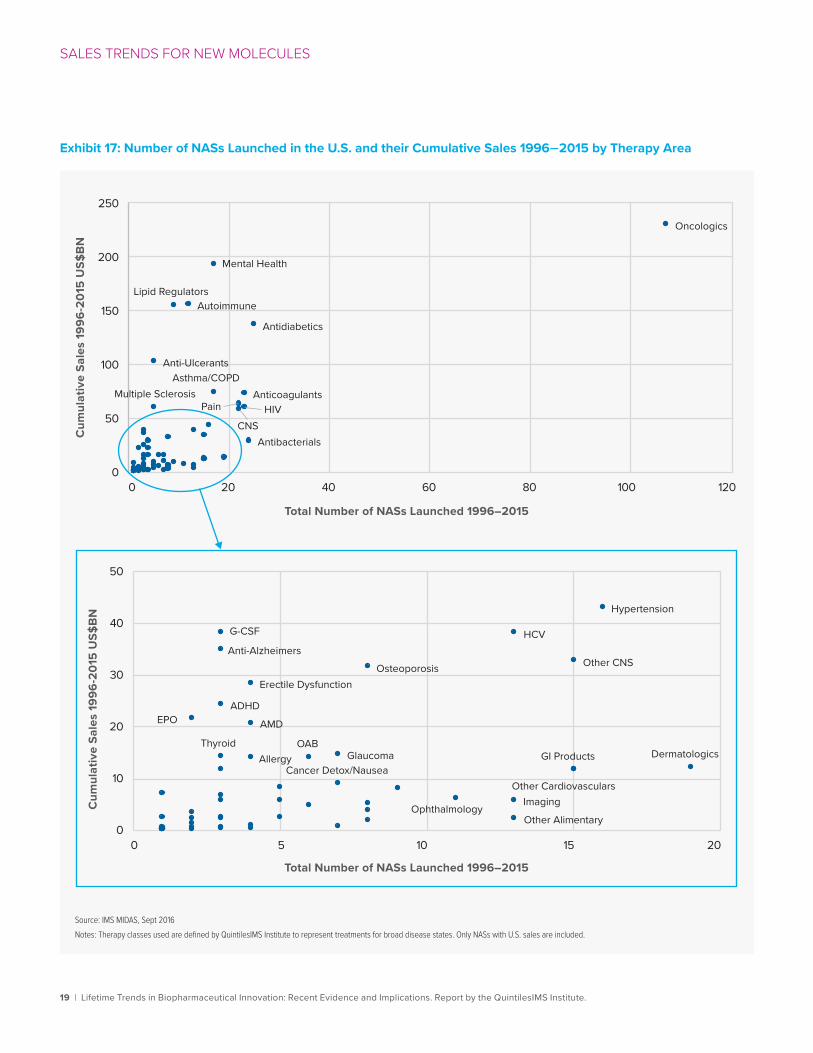
The highest number of NASs launched in the past 20 years has been in oncology, which has also generated the largest cumulative amount of sales (see Exhibit 17). Other large clusters of NASs have launched including lipid regulators, drugs for mental health and autoimmune diseases and diabetes, among others. Most therapy areas, however, have much lower sales in aggregate and fewer new medicines introduced, with most having fewer than 10 NASs launched over the 20-year period examined.
$1bn–2bn/yr >$2bn/yr
2
5
1
5
4
2
Source: IMS MIDAS, Sept 2016Notes: NASs in 2012–15 have been projected to the first 5 years of sales based on the historic average ratio of available product sales history to first 5 year total sales (e.g. for a product with 2 years of history, the average 2 year percent of 5 years). Individual extrapolations have been applied for NASs which have already reached $1Bn in sales since launch. No NAS in the 2006-2010 cohort reached >$1Bn average sales within five years of launch.
1996–2000 2001–2005 2006–2010 2011–20150
19 | Lifetime Trends in Biopharmaceutical Innovation: Recent Evidence and Implications. Report by the QuintilesIMS Institute.
SALES TRENDS FOR NEW MOLECULES
Exhibit 17: Number of NASs Launched in the U.S. and their Cumulative Sales 1996–2015 by Therapy Area
Source: IMS MIDAS, Sept 2016Notes: Therapy classes used are defined by QuintilesIMS Institute to represent treatments for broad disease states. Only NASs with U.S. sales are included.
Oncologics
Antidiabetics
Antibacterials
AnticoagulantsHIVPain
CNS
Mental Health
Asthma/COPD
AutoimmuneLipid Regulators
Multiple Sclerosis
Anti-Ulcerants
0
50
100
150
200
250
0 20 40 60 80 100 120
Dermatologics
Hypertension
GI Products
Other CNS
Other CardiovascularsImaging
Other Alimentary
HCV
Ophthalmology
Osteoporosis
GlaucomaCancer Detox/Nausea
OAB
Erectile Dysfunction
AMD
Allergy
G-CSF
Thyroid
ADHD
Anti-Alzheimers
EPO
0
10
20
30
40
50
0 5 10 15 20
Total Number of NASs Launched 1996–2015
Cum
ulat
ive
Sale
s 19
96-2
015
US$
BN
Cum
ulat
ive
Sale
s 19
96-2
015
US$
BN
Total Number of NASs Launched 1996–2015
20 | Lifetime Trends in Biopharmaceutical Innovation: Recent Evidence and Implications. Report by the QuintilesIMS Institute.
SALES TRENDS FOR NEW MOLECULES
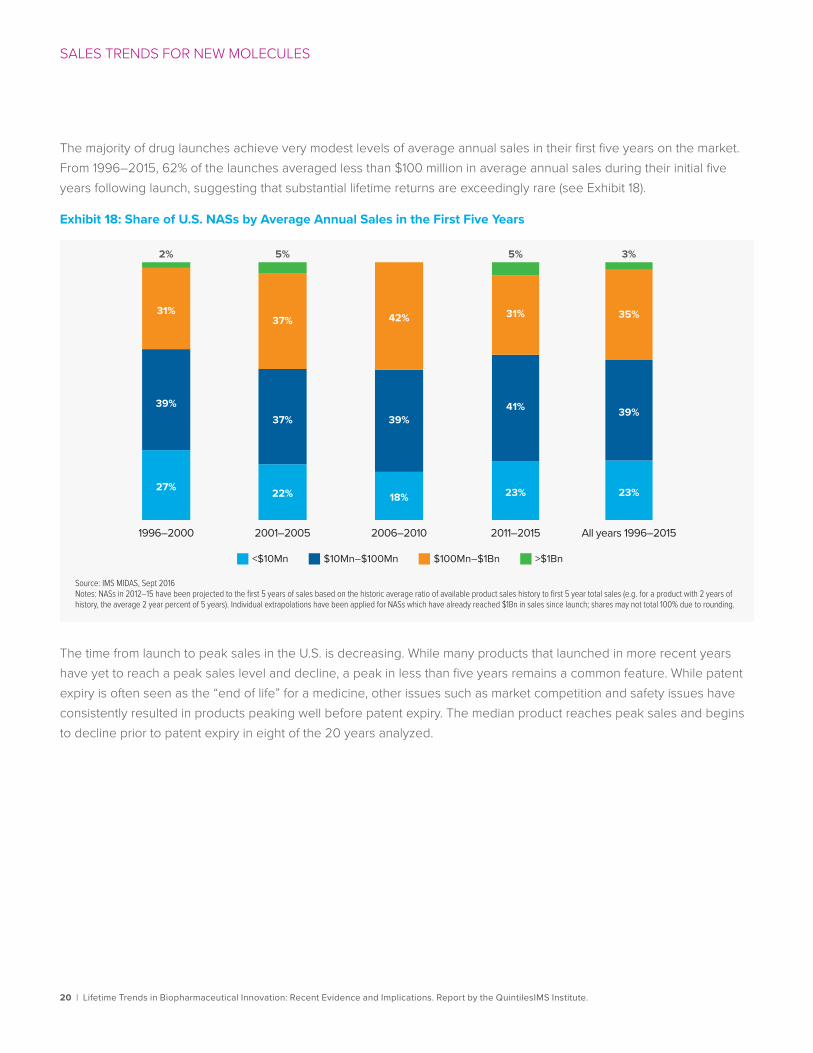
The majority of drug launches achieve very modest levels of average annual sales in their first five years on the market. From 1996–2015, 62% of the launches averaged less than $100 million in average annual sales during their initial five years following launch, suggesting that substantial lifetime returns are exceedingly rare (see Exhibit 18).
Exhibit 18: Share of U.S. NASs by Average Annual Sales in the First Five Years
The time from launch to peak sales in the U.S. is decreasing. While many products that launched in more recent years have yet to reach a peak sales level and decline, a peak in less than five years remains a common feature. While patent expiry is often seen as the “end of life” for a medicine, other issues such as market competition and safety issues have consistently resulted in products peaking well before patent expiry. The median product reaches peak sales and begins to decline prior to patent expiry in eight of the 20 years analyzed.
1996–2000 2001–2005 2011–20152006–2010 All years 1996–2015
<$10Mn $10Mn–$100Mn $100Mn–$1Bn >$1Bn
Source: IMS MIDAS, Sept 2016Notes: NASs in 2012–15 have been projected to the first 5 years of sales based on the historic average ratio of available product sales history to first 5 year total sales (e.g. for a product with 2 years of history, the average 2 year percent of 5 years). Individual extrapolations have been applied for NASs which have already reached $1Bn in sales since launch; shares may not total 100% due to rounding.
27%
39%
31%
2%
22%
37%
37%
18%
39%
42%
5%
23%
41%
31%
5%
23%
39%
35%
3%
21 | Lifetime Trends in Biopharmaceutical Innovation: Recent Evidence and Implications. Report by the QuintilesIMS Institute.
SALES TRENDS FOR NEW MOLECULES
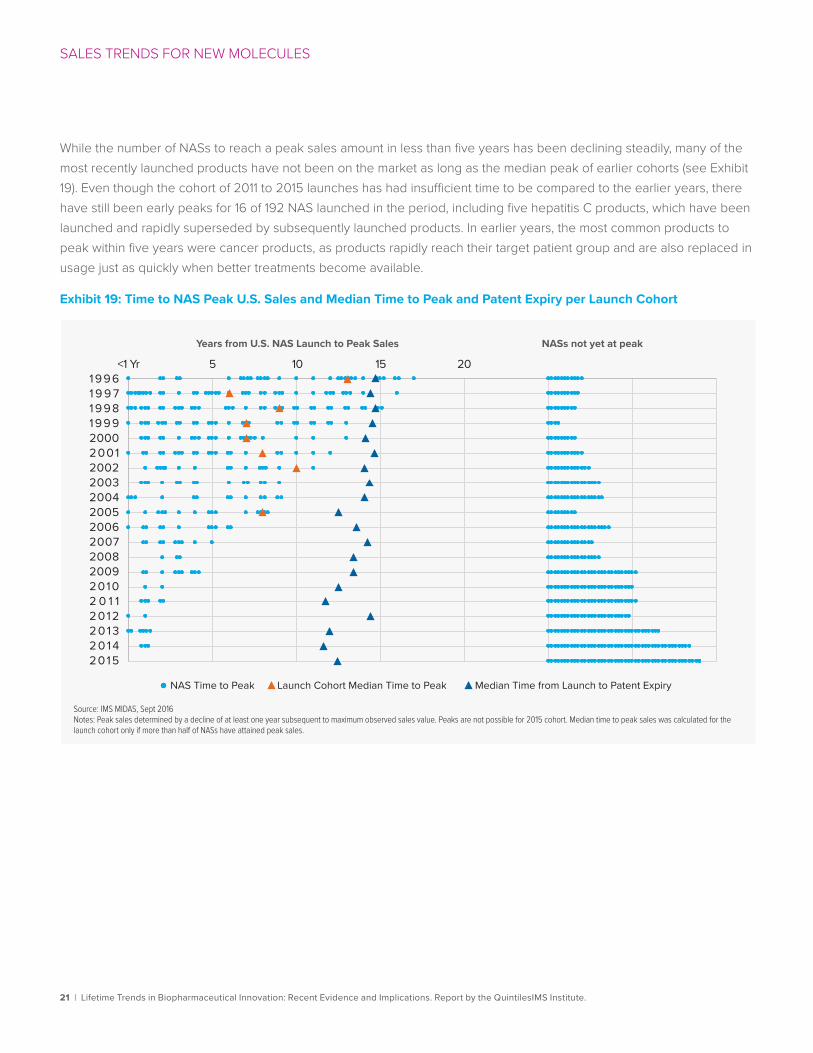
While the number of NASs to reach a peak sales amount in less than five years has been declining steadily, many of the most recently launched products have not been on the market as long as the median peak of earlier cohorts (see Exhibit 19). Even though the cohort of 2011 to 2015 launches has had insufficient time to be compared to the earlier years, there have still been early peaks for 16 of 192 NAS launched in the period, including five hepatitis C products, which have been launched and rapidly superseded by subsequently launched products. In earlier years, the most common products to peak within five years were cancer products, as products rapidly reach their target patient group and are also replaced in usage just as quickly when better treatments become available.
Exhibit 19: Time to NAS Peak U.S. Sales and Median Time to Peak and Patent Expiry per Launch Cohort
Source: IMS MIDAS, Sept 2016Notes: Peak sales determined by a decline of at least one year subsequent to maximum observed sales value. Peaks are not possible for 2015 cohort. Median time to peak sales was calculated for the launch cohort only if more than half of NASs have attained peak sales.
Years from U.S. NAS Launch to Peak Sales NASs not yet at peak
<1 Yr 5 10 15 20
NAS Time to Peak Launch Cohort Median Time to Peak Median Time from Launch to Patent Expiry
19961 9 9 719981999200020012002200320042005200620072008200920102 0 1 120122 0 1 32 0 1 42015
22 | Lifetime Trends in Biopharmaceutical Innovation: Recent Evidence and Implications. Report by the QuintilesIMS Institute.
SALES TRENDS FOR NEW MOLECULES
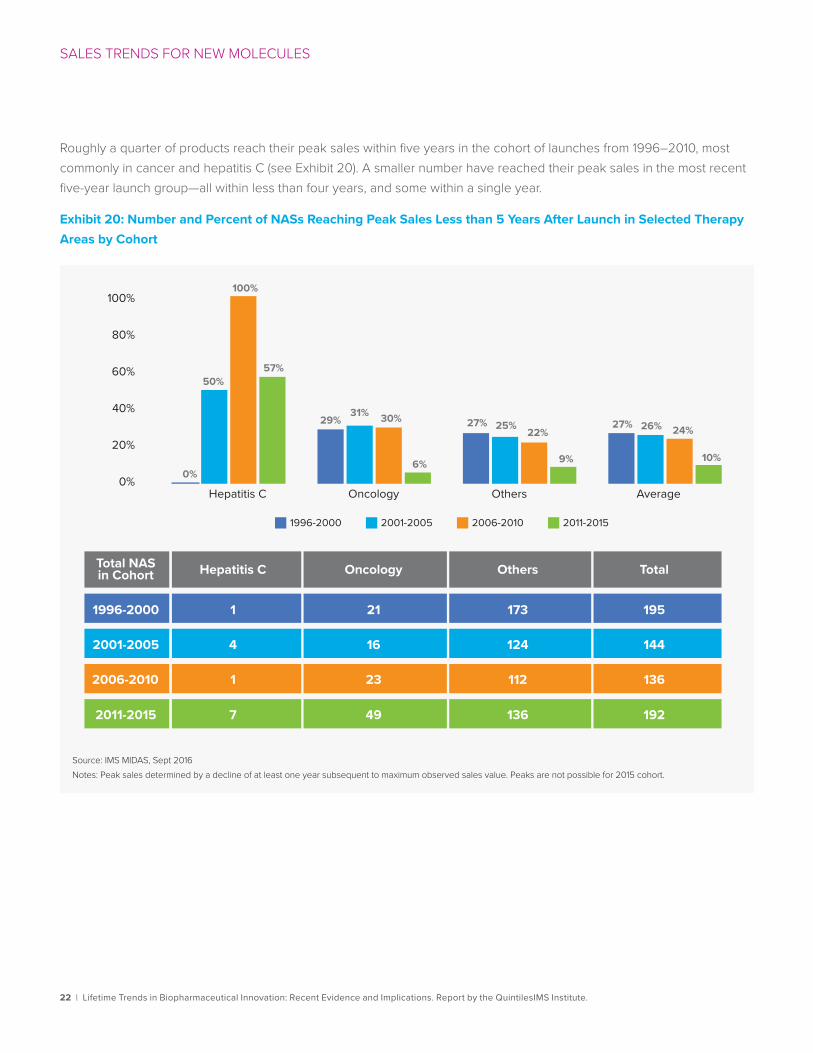
Roughly a quarter of products reach their peak sales within five years in the cohort of launches from 1996–2010, most commonly in cancer and hepatitis C (see Exhibit 20). A smaller number have reached their peak sales in the most recent five-year launch group—all within less than four years, and some within a single year.
Exhibit 20: Number and Percent of NASs Reaching Peak Sales Less than 5 Years After Launch in Selected Therapy Areas by Cohort
0%
20%
40%
60%
80%
100%
Hepatitis C
Total NASin Cohort Hepatitis C
1996-2000
2001-2005
2006-2010
2011-2015
Oncology Others Total
Oncology Others Average
1996-2000 2001-2005 2006-2010 2011-2015
Source: IMS MIDAS, Sept 2016Notes: Peak sales determined by a decline of at least one year subsequent to maximum observed sales value. Peaks are not possible for 2015 cohort.
0%
50%
100%
57%
29%31% 30%
6%
27% 25% 22%
9%
27% 26% 24%
10%
1 21 173 195
144124164
1 23 112 136
7 49 136 192
23 | Lifetime Trends in Biopharmaceutical Innovation: Recent Evidence and Implications. Report by the QuintilesIMS Institute.
SALES TRENDS FOR NEW MOLECULES
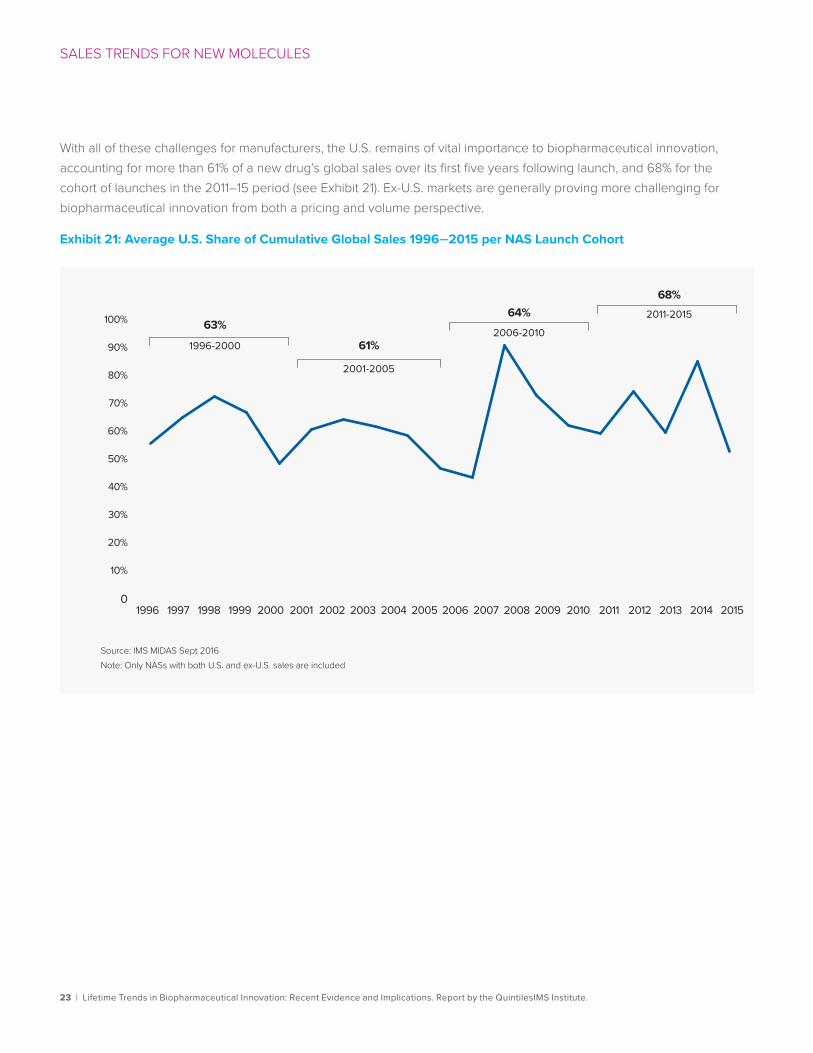
With all of these challenges for manufacturers, the U.S. remains of vital importance to biopharmaceutical innovation, accounting for more than 61% of a new drug’s global sales over its first five years following launch, and 68% for the cohort of launches in the 2011–15 period (see Exhibit 21). Ex-U.S. markets are generally proving more challenging for biopharmaceutical innovation from both a pricing and volume perspective.
Exhibit 21: Average U.S. Share of Cumulative Global Sales 1996–2015 per NAS Launch Cohort
Source: IMS MIDAS Sept 2016Note: Only NASs with both U.S. and ex-U.S. sales are included
1996-2000
2001-2005
2006-2010
2011-2015
1997 1998 1999 2000 2001 2002 2003 2004 2005 2006 2007 2008 2009 2010 2011 2012 2013 20141996 20150
10%
20%
30%
40%
60%
70%
80%
90%
50%
100% 63%
61%
64%68%
24 | Lifetime Trends in Biopharmaceutical Innovation: Recent Evidence and Implications. Report by the QuintilesIMS Institute.
Implications for life sciences stakeholdersThe surge in biopharmaceutical innovation over the past few years is expected to continue based on the number of quality molecules in late-stage clinical development. This has important implications for patients, providers, payers and pharmaceutical manufacturers alike. The complexity of selecting the best treatment option for a particular patient is increasing as more innovative treatments become available and more information derived from clinical trials and real-world use can be analyzed. Patient involvement is also shifting the balance of influence in decision-making, as is the role of the payer.
At the same time, the time elapsed from patent filing to launch remains stubbornly long while the period of exclusivity following launch is steadily declining. The combination of these factors is contributing to a decline in economic returns from investment in research and development.
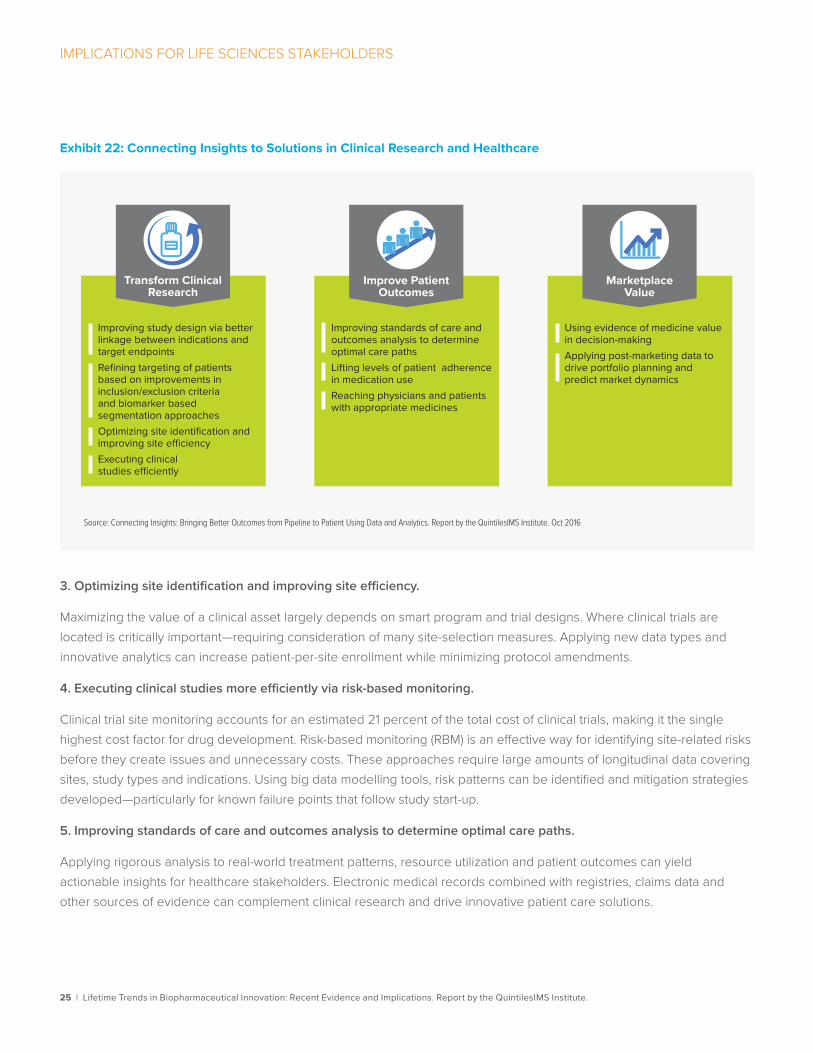
Investors and manufacturers alike have an interest in adopting new approaches that can address the trends experienced over the past 20 years. The recent proliferation of data and expanded ability to pool data sets brings new opportunities to produce efficiency and improvement across the clinical research and development cycle and to improve patient outcomes and increase marketplace value.12 Smarter analytics applied to these cross-industry data can enable nine solutions—across three streams—that can help enable transformation in drug development and commercialization and bring positive economic returns (see Exhibit 22).
These approaches can be summarized as follows:
1. Improving study design by better linking indications and target endpoints.
In every randomized controlled trial (RCT), therapeutic agents must be tested against defined potential indications. Often, a clinical study will succeed or fail based on the primary outcome endpoints that are chosen. Real-world insights, shared data and large datasets that supplement RCTs can help identify precise and useful primary outcome endpoints. They also can enable more rapid validation and acceptance of surrogate endpoints.
2. Improving patient targeting through better inclusion/exclusion criteria and biomarker-based segmentation approaches.
Biomarkers are a measurable indicator of a biological state or condition. Historically, biomarker identification has been conducted during pre-clinical research on a small scale. The advent of gene expression profiling, genetic analysis and genomic profiling now enable target and biomarker discovery to be applied beyond pre-clinical research to clinical studies and practice.
25 | Lifetime Trends in Biopharmaceutical Innovation: Recent Evidence and Implications. Report by the QuintilesIMS Institute.
IMPLICATIONS FOR LIFE SCIENCES STAKEHOLDERS
Exhibit 22: Connecting Insights to Solutions in Clinical Research and Healthcare
3. Optimizing site identification and improving site efficiency.
Maximizing the value of a clinical asset largely depends on smart program and trial designs. Where clinical trials are located is critically important—requiring consideration of many site-selection measures. Applying new data types and innovative analytics can increase patient-per-site enrollment while minimizing protocol amendments.
4. Executing clinical studies more efficiently via risk-based monitoring.
Clinical trial site monitoring accounts for an estimated 21 percent of the total cost of clinical trials, making it the single highest cost factor for drug development. Risk-based monitoring (RBM) is an effective way for identifying site-related risks before they create issues and unnecessary costs. These approaches require large amounts of longitudinal data covering sites, study types and indications. Using big data modelling tools, risk patterns can be identified and mitigation strategies developed—particularly for known failure points that follow study start-up.
5. Improving standards of care and outcomes analysis to determine optimal care paths.
Applying rigorous analysis to real-world treatment patterns, resource utilization and patient outcomes can yield actionable insights for healthcare stakeholders. Electronic medical records combined with registries, claims data and other sources of evidence can complement clinical research and drive innovative patient care solutions.
Source: Connecting Insights: Bringing Better Outcomes from Pipeline to Patient Using Data and Analytics. Report by the QuintilesIMS Institute. Oct 2016
Improve PatientOutcomes
Improving standards of care and outcomes analysis to determine optimal care pathsLifting levels of patient adherence in medication useReaching physicians and patients with appropriate medicines
Transform ClinicalResearch
Improving study design via better linkage between indications and target endpointsRefining targeting of patients based on improvements in inclusion/exclusion criteria and biomarker based segmentation approachesOptimizing site identification and improving site e�ciencyExecuting clinical studies e�ciently
MarketplaceValue
Using evidence of medicine value in decision-makingApplying post-marketing data to drive portfolio planning and predict market dynamics
26 | Lifetime Trends in Biopharmaceutical Innovation: Recent Evidence and Implications. Report by the QuintilesIMS Institute.
IMPLICATIONS FOR LIFE SCIENCES STAKEHOLDERS
6. Lifting levels of patient adherence in medication use.
The economic consequences of patient nonadherence are estimated to account for 4.6 percent of global total health expenditure, representing the majority of the world’s total avoidable costs linked to suboptimal medicine use.13 The movement toward outcomes-based contracting, the shift of risk from payer to provider, and the greater use of value-based insurance design are all contributing to a greater focus by stakeholders on this issue. Advances in technology and data analytics are enabling new approaches that recognize the diversity of underlying drivers of patient nonadherence; apply predictive analytics to stratify patients based on risk and consequences of nonadherence; use a broader range of interventions including low-cost smartphone-based apps; and integrate adherence measures into patient records.
7. Reaching physicians and patients with appropriate medicines.
Linking real-world data with analytics is generating new insights to better understand patient habits, health journeys and engagement with healthcare professionals, as well as to measure patient outcomes. This also helps identify physicians likely to have patients who can benefit from new medicines so that manufacturers can efficiently provide relevant educational information to those prescribers.
8. Evaluating medical value and real-world evidence in decision-making.
A proliferation of frameworks and assessment approaches now exist in response to increased calls for new medicines to demonstrate “evidence of value” to patients and health systems. These new approaches increasingly draw on information and analysis that go beyond traditional RCT data and include electronic medical records, claims data, mortality data, consumer data, registries, data collected in observational studies and chart reviews.
9. Applying post-market data to drive portfolio planning and predict market dynamics.
The biopharmaceutical industry increasingly is focused on niche segments such as rare diseases and patient sub-populations. The relative scarcity of precise data within these sectors presents challenges when making commercial decisions during asset development and deployment. Companies are addressing these challenges by leveraging real-world insights to measure patient populations in complex settings and using advanced analytics to bridge gaps in data availability.
Taken together, these approaches can bring meaningful reductions in the time elapsed from original scientific discovery until product launch, improve the profile of the drug that is launched, bring improved outcomes to patients treated with the drug, and sustain commercial returns throughout the patent life. As a result, the prospects for sustained biopharmaceutical innovation for the long-term can be assured.
27 | Lifetime Trends in Biopharmaceutical Innovation: Recent Evidence and Implications. Report by the QuintilesIMS Institute.
Biomedical Innovation NAS DatasetNAS (New Active Substances) were identified by QuintilesIMS, and include both biologic and small molecules launches where the active ingredient is new, or for combinations, where at least one ingredient is available for the first time. NAS launch date for this study is based on first U.S. availability. The launch date of an NAS may be revised as new information becomes available, and the number of NASs launched per year may therefore be restated relative to previous QuintilesIMS Institute publications. The earliest patent filing date, and the probable expiry date for a medicine was identified using QuintilesIMS ARK Patent Intelligence™. Where no patent details were available for specific NASs, or when the numbers were negative, these were excluded from the analyses pertaining to patent timelines. In total, 24 such exclusions occurred, with 23 exclusions for analyses on time from patent to launch, and 17 exclusions for the analyses on time from launch to expiry, with overlap due to some molecules missing both initial patent date and expiry details.
Patent expiry is defined in this study as the latter of either patent expiry or other forms of exclusivity. These forms can include cases where a molecule holds extended exclusivity such as for pediatric indications, or when those molecules are for orphan diseases, or are a new chemical entity.6
ARK Patent Intelligence™ is a database of biopharmaceutical patents or equivalents in over 130 countries and including over 3000 molecules. Research covers approved patent extensions in 51 countries, and covers all types of patents including product, process, method of use, and others.
Orphan drugs are those to treat small populations with rare diseases, and in this study include those designated by U.S. FDA. NASs are considered to have an orphan designation if any approved indication has orphan status within the first year after U.S. launch.
Lifetime SalesAnalyses of lifetime sales were based on QuintilesIMS MIDAS™, an audit of medicine spending in the U.S. and globally, and include those sales for a medicine from the originator before the availability of generic or other non-original versions. Where no sales information was available for specific NASs, these were excluded from sales analyses.
QuintilesIMS MIDAS™ is a unique data platform for assessing worldwide healthcare markets. It integrates QuintilesIMS national audits into a globally consistent view of the pharmaceutical market, tracking virtually every product in hundreds of therapeutic classes and providing estimated product volumes, trends and market share through retail and non-retail channels. MIDAS data is updated quarterly and retain 12 years of history. Historic archives of QuntilesIMS MIDAS™ were used for lifetime analyses where more than 12 years of data were required.
Methodology and sources
28 | Lifetime Trends in Biopharmaceutical Innovation: Recent Evidence and Implications. Report by the QuintilesIMS Institute.
1. IMS Institute for Healthcare Informatics. Global medicines use in 2020: outlook and implications, 2015 Nov
2. Smith A. The FDA’s higher bar on new drugs: experts disagree as to whether regulators have gotten tougher on new drug approvals as the industry faces massive generic pressure. CNN Money. 2008 Feb 5. [Internet]. Available from: http://money.cnn.com/2008/02/04/news/companies/fda/
3. The pharmaletter. US FDA set for even fewer approvals in 2008. 2008 Jan 9. [Internet]. Available from: http://www.thepharmaletter.com/article/us-fda-set-for-even-fewer-approvals-in-2008
4. U.S. Food and Drug Administration. NMEs approved by CDER. Available from: http://www.fda.gov/downloads/Drugs/DevelopmentApprovalProcess/HowDrugsareDevelopedandApproved/DrugandBiologicApprovalReports/UCM242695.pdf
5. Center for Drug Evaluation and Research, U.S. Food and Drug Administration and U.S. Health and Human Services. 2012 novel new drugs summary. 2013 Jan. Available from http://www.fda.gov/downloads/drugs/developmentapprovalprocess/druginnovation/ucm337830.pdf
6. U.S. Food and Drug Administration and the Center for Drug Evaluation and Research (FDA/CDER) SBIA Chronicles. Patents and exclusivity. 2015 May 19. [Internet]. Available from: http://www.fda.gov/downloads/drugs/developmentapprovalprocess/smallbusinessassistance/ucm447307.pdf
7. Grabowski HG, DiMasi JA, Long G. The roles of patents and research and development incentives in biopharmaceutical innovation. Health Aff. 2015 Feb;34(2):302-10
8. DiMasi J A. The value of improving the productivity of the drug development process: faster times and better decisions. Pharmacoeconomics 2002; 20 Suppl. 3
9. DiMasi J A. New drug development in the United States from 1963 to 1999. Clin Pharmacol Ther. 2001 May;69(5):286-96
10. Seoane-Vazquez, EC, Schondelmeyer, SW. Szeinbach SL. Drug patent live and generic competition: analysis of new molecular entities approved by the FDA between 1980 and 1999. J Pharmaceut Finance Econ Pol. 2007, 16(4): 67-85
11. Grabowski H, Long G, Mortimer R. Recent trends in brand-name and generic drug competition. J Med Econ. 2014;17(3):207–14
12. MS Institute for Healthcare Informatics. Connecting Insights: Bringing Better Outcomes from Pipeline to Patient Using Data and Analytics. 2016 Oct
13. IMS Institute for Healthcare Informatics. Advancing the Responsible Use of Medicines. 2012 Oct
References

29 | Lifetime Trends in Biopharmaceutical Innovation: Recent Evidence and Implications. Report by the QuintilesIMS Institute.
Murray Aitken Executive Director, QuintilesIMS Institute
Murray Aitken is a senior vice president at QuintilesIMS and the executive director of the QuintilesIMS Institute (formerly the IMS Institute for Healthcare Informatics). Aitken is a renowned healthcare expert on addressing the challenges facing the global healthcare industry and prospects for improving patient outcomes, managing costs and maximizing access through better use of healthcare data and information. Established in 2011, The QuintilesIMS Institute provides global policy setters and decision makers with objective, transformational insights into healthcare dynamics derived from granular analysis of information.
Michael Kleinrock Research Director, QuintilesIMS Institute
Michael is the research director for the QuintilesIMS Institute. Kleinrock is a sought-after speaker and expert on methods of measuring the current state and forecasting the future place of biopharmaceuticals in healthcare. He brings a deep understanding of data sources and analytics from QuintilesIMS and elsewhere, as well as the historic drivers of key market segments.
Authors
30 | Lifetime Trends in Biopharmaceutical Innovation: Recent Evidence and Implications. Report by the QuintilesIMS Institute.
About the QuintilesIMS Institute The QuintilesIMS Institute leverages collaborative relationships in the public and private sectors to strengthen the vital role of information in advancing healthcare globally. Its mission is to provide key policy setters and decision-makers in the global health sector with unique and transformational insights into healthcare dynamics derived from granular analysis of information.
Fulfilling an essential need within healthcare, the Institute delivers objective, relevant insights and research that accelerate understanding and innovation critical to sound decision-making and improved patient care. With access to QuintilesIMS’s extensive global data assets and analytics, the Institute works in tandem with a broad set of healthcare stakeholders, including government agencies, academic institutions, the life sciences industry and payers, to drive a research agenda dedicated to addressing today’s healthcare challenges.
By collaborating on research of common interest, it builds on a long-standing and extensive tradition of using QuintilesIMS information and expertise to support the advancement of evidence-based healthcare around the world.
31 | Lifetime Trends in Biopharmaceutical Innovation: Recent Evidence and Implications. Report by the QuintilesIMS Institute.
ABOUT THE QUINTILESIMS INSTITUTE
Research Agenda Guiding Principles
The effective use of information by healthcare stakeholders globally to improve health outcomes, reduce costs and increase access to available treatments.
Optimizing the performance of medical care through better understanding of disease causes, treatment consequences and measures to improve quality and cost of healthcare delivered to patients.
Understanding the future global role for biopharmaceuticals, the dynamics that shape the market and implications for manufacturers, public and private payers, providers, patients, pharmacists and distributors.
Researching the role of innovation in health system products, processes and delivery systems, and the business and policy systems that drive innovation.
Informing and advancing the healthcare agendas in developing nations through information and analysis.
The advancement of healthcare globally is a vital, continuous process.
Timely, high-quality and relevant information is critical to sound healthcare decision-making.
Insights gained from information and analysis should be made widely available to healthcare stakeholders.
Effective use of information is often complex, requiring unique knowledge and expertise.
The ongoing innovation and reform in all aspects of healthcare require a dynamic approach to understanding the entire healthcare system.
Personal health information is confidential and patient privacy must be protected.
The private sector has a valuable role to play in collaborating with the public sector related to the use of healthcare data.
The research agenda for the Institute centers on five areas considered vital to the advancement of healthcare globally:
The Institute operates from a set of Guiding Principles:
QuintilesIMS Institute100 IMS Drive, Parsippany, NJ 07054, [email protected] www.quintilesimsinstitute.org
©2017 QuintilesIMS and its affiliates. All rights reserved. Trademarks are registered in the United States and in various other countries.