recent economic developments - cbsl.gov.lk · ii published by the central bank of sri lanka 30,...
TRANSCRIPT


RECENT ECONOMIC DEVELOPMENTS
Highlights of 2017 andProspects for 2018
CENTRAL BANK OF SRI LANKANOVEMBER 2017

II
Published by the Central Bank of Sri Lanka30, Janadhipathi MawathaColombo 01Sri Lanka.
Printed by: M.D.Gunasena and Company Printers (Private) Limited.
ISBN 978 - 955 - 575 - 353 - 1

III
KEY ECONOMIC INDICATORS
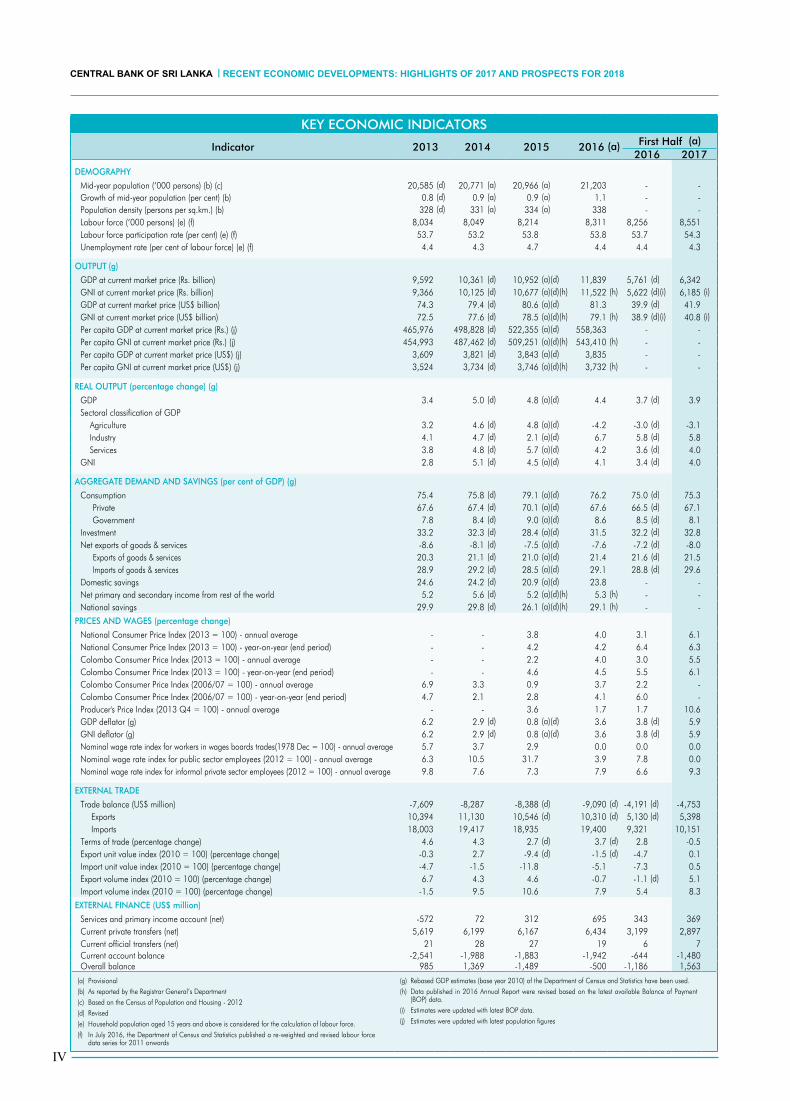
Key economic indicators
indicator 2013 2014 2015 2016 (a) First Half (a)2016 2017
demoGraPHy
Mid-year population (‘000 persons) (b) (c) 20,585 (d) 20,771 (a) 20,966 (a) 21,203 - -Growth of mid-year population (per cent) (b) 0.8 (d) 0.9 (a) 0.9 (a) 1.1 - -Population density (persons per sq.km.) (b) 328 (d) 331 (a) 334 (a) 338 - -Labour force (‘000 persons) (e) (f) 8,034 8,049 8,214 8,311 8,256 8,551Labour force participation rate (per cent) (e) (f) 53.7 53.2 53.8 53.8 53.7 54.3Unemployment rate (per cent of labour force) (e) (f) 4.4 4.3 4.7 4.4 4.4 4.3
oUtPUt (g)
GDP at current market price (Rs. billion) 9,592 10,361 (d) 10,952 (a)(d) 11,839 5,761 (d) 6,342GNI at current market price (Rs. billion) 9,366 10,125 (d) 10,677 (a)(d)(h) 11,522 (h) 5,622 (d)(i) 6,185 (i)GDP at current market price (US$ billion) 74.3 79.4 (d) 80.6 (a)(d) 81.3 39.9 (d) 41.9GNI at current market price (US$ billion) 72.5 77.6 (d) 78.5 (a)(d)(h) 79.1 (h) 38.9 (d)(i) 40.8 (i)Per capita GDP at current market price (Rs.) (j) 465,976 498,828 (d) 522,355 (a)(d) 558,363 - -Per capita GNI at current market price (Rs.) (j) 454,993 487,462 (d) 509,251 (a)(d)(h) 543,410 (h) - -Per capita GDP at current market price (US$) (j) 3,609 3,821 (d) 3,843 (a)(d) 3,835 - -Per capita GNI at current market price (US$) (j) 3,524 3,734 (d) 3,746 (a)(d)(h) 3,732 (h) - -
reaL oUtPUt (percentage change) (g)
GDP 3.4 5.0 (d) 4.8 (a)(d) 4.4 3.7 (d) 3.9Sectoral classification of GDP
Agriculture 3.2 4.6 (d) 4.8 (a)(d) -4.2 -3.0 (d) -3.1Industry 4.1 4.7 (d) 2.1 (a)(d) 6.7 5.8 (d) 5.8Services 3.8 4.8 (d) 5.7 (a)(d) 4.2 3.6 (d) 4.0
GNI 2.8 5.1 (d) 4.5 (a)(d) 4.1 3.4 (d) 4.0
aGGreGate demand and saVinGs (per cent of GdP) (g)
Consumption 75.4 75.8 (d) 79.1 (a)(d) 76.2 75.0 (d) 75.3 Private 67.6 67.4 (d) 70.1 (a)(d) 67.6 66.5 (d) 67.1 Government 7.8 8.4 (d) 9.0 (a)(d) 8.6 8.5 (d) 8.1Investment 33.2 32.3 (d) 28.4 (a)(d) 31.5 32.2 (d) 32.8Net exports of goods & services -8.6 -8.1 (d) -7.5 (a)(d) -7.6 -7.2 (d) -8.0
Exports of goods & services 20.3 21.1 (d) 21.0 (a)(d) 21.4 21.6 (d) 21.5 Imports of goods & services 28.9 29.2 (d) 28.5 (a)(d) 29.1 28.8 (d) 29.6
Domestic savings 24.6 24.2 (d) 20.9 (a)(d) 23.8 - -Net primary and secondary income from rest of the world 5.2 5.6 (d) 5.2 (a)(d)(h) 5.3 (h) - -National savings 29.9 29.8 (d) 26.1 (a)(d)(h) 29.1 (h) - -
Prices and WaGes (percentage change)
National Consumer Price Index (2013 = 100) - annual average - - 3.8 4.0 3.1 6.1National Consumer Price Index (2013 = 100) - year-on-year (end period) - - 4.2 4.2 6.4 6.3Colombo Consumer Price Index (2013 = 100) - annual average - - 2.2 4.0 3.0 5.5Colombo Consumer Price Index (2013 = 100) - year-on-year (end period) - - 4.6 4.5 5.5 6.1Colombo Consumer Price Index (2006/07 = 100) - annual average 6.9 3.3 0.9 3.7 2.2 -Colombo Consumer Price Index (2006/07 = 100) - year-on-year (end period) 4.7 2.1 2.8 4.1 6.0 -Producer's Price Index (2013 Q4 = 100) - annual average - - 3.6 1.7 1.7 10.6GDP deflator (g) 6.2 2.9 (d) 0.8 (a)(d) 3.6 3.8 (d) 5.9GNI deflator (g) 6.2 2.9 (d) 0.8 (a)(d) 3.6 3.8 (d) 5.9Nominal wage rate index for workers in wages boards trades(1978 Dec = 100) - annual average 5.7 3.7 2.9 0.0 0.0 0.0Nominal wage rate index for public sector employees (2012 = 100) - annual average 6.3 10.5 31.7 3.9 7.8 0.0Nominal wage rate index for informal private sector employees (2012 = 100) - annual average 9.8 7.6 7.3 7.9 6.6 9.3
eXternaL trade
Trade balance (US$ million) -7,609 -8,287 -8,388 (d) -9,090 (d) -4,191 (d) -4,753 Exports 10,394 11,130 10,546 (d) 10,310 (d) 5,130 (d) 5,398 Imports 18,003 19,417 18,935 19,400 9,321 10,151
Terms of trade (percentage change) 4.6 4.3 2.7 (d) 3.7 (d) 2.8 -0.5Export unit value index (2010 = 100) (percentage change) -0.3 2.7 -9.4 (d) -1.5 (d) -4.7 0.1Import unit value index (2010 = 100) (percentage change) -4.7 -1.5 -11.8 -5.1 -7.3 0.5Export volume index (2010 = 100) (percentage change) 6.7 4.3 4.6 -0.7 -1.1 (d) 5.1Import volume index (2010 = 100) (percentage change) -1.5 9.5 10.6 7.9 5.4 8.3
eXternaL Finance (Us$ million)
Services and primary income account (net) -572 72 312 695 343 369Current private transfers (net) 5,619 6,199 6,167 6,434 3,199 2,897Current official transfers (net) 21 28 27 19 6 7Current account balance -2,541 -1,988 -1,883 -1,942 -644 -1,480Overall balance 985 1,369 -1,489 -500 -1,186 1,563
(a) Provisional(b) As reported by the Registrar General’s Department(c) Based on the Census of Population and Housing - 2012(d) Revised(e) Household population aged 15 years and above is considered for the calculation of labour force.(f) In July 2016, the Department of Census and Statistics published a re-weighted and revised labour force
data series for 2011 onwards
(g) Rebased GDP estimates (base year 2010) of the Department of Census and Statistics have been used.(h) Data published in 2016 Annual Report were revised based on the latest available Balance of Payment
(BOP) data.(i) Estimates were updated with latest BOP data.(j) Estimates were updated with latest population figures
IV
CENTRAL BANK OF SRI LANKA | RECENT ECONOMIC DEVELOPMENTS: HIGHLIGHTS OF 2017 AND PROSPECTS FOR 2018

Key economic indicators (contd.)
indicator 2013 2014 2015 2016 (a) First Half (a)2016 2017
Current account balance (per cent of GDP) (g) (k) -3.4 -2.5 -2.3 -2.4 - -Total foreign assets (months of the same year imports) (l) 5.7 6.1 5.9 5.2 4.7 5.4Gross official reserves (months of the same year imports) 5.0 5.1 4.6 3.7 3.4 4.1Overall debt service ratio (m)
As a percentage of export of goods and services 26.8 20.8 27.3 25.0 26.4 31.7As a percentage of current receipts 18.7 14.5 19.2 17.6 18.5 23.0
Total external debt (per cent of GDP) (g) (k) 53.7 54.1 55.7 57.3 - -
eXcHanGe ratesAnnual average
Rs/US$ 129.11 130.56 135.94 145.60 144.47 151.54Rs/SDR (n) 196.19 198.35 190.16 202.39 202.24 206.67NEER (2010 = 100) (24 - currency basket) (o) 91.39 91.99 96.61 92.46 92.67 89.91REER (2010 = 100) (24 - currency basket) (o) (p) (q) 101.13 103.77 109.50 106.94 106.57 107.65
Year endRs/US$ 130.75 131.05 144.06 149.80 145.25 153.51Rs/SDR (n) 201.36 189.86 199.63 201.38 203.18 213.59
GoVernment Finance (per cent of GdP) (g) (r)Revenue and grants 12.0 11.6 13.3 14.3 6.0 6.8
Revenue 11.9 11.5 13.3 14.2 6.0 6.7o/w Tax revenue 10.5 10.1 12.4 12.4 5.6 6.3
Grants 0.2 0.1 0.1 0.1 ... ...Expenditure and net lending 17.4 17.3 20.9 19.7 8.7 9.3
Recurrent expenditure 12.6 12.8 15.5 14.8 6.8 7.1Capital expenditure and net lending 4.8 4.6 5.4 4.9 1.9 2.2
Current account surplus (+) / deficit (-) -0.7 -1.2 -2.3 -0.6 -0.8 -0.3Primary account surplus (+) / deficit (-) -0.8 -1.5 -2.9 -0.2 -0.3 0.1Overall fiscal surplus (+) / deficit (-) -5.4 -5.7 -7.6 -5.4 -2.7 -2.6Deficit financing 5.4 5.7 7.6 5.4 2.7 2.6
Foreign 1.3 2.1 2.2 3.3 -0.3 0.5Domestic 4.1 3.7 5.4 2.1 3.0 2.1
Central Government debt 70.8 71.3 77.6 79.3 - -Foreign 30.9 30.0 32.4 34.2 - -Domestic 40.0 41.3 45.3 45.1 - -
monetary aGGreGates (year-on-year percentage change)Reserve money 0.9 18.3 16.5 27.1 24.5 17.8Narrow money (M1) 7.7 26.3 16.8 8.6 12.1 6.8Broad money (M2b) (s) 16.7 13.4 17.8 18.4 17.0 21.2
Net foreign assets of the banking system -195.5 119.8 -2,071.2 22.4 -139.4 50.0Net domestic assets of the banking system 18.3 10.5 26.0 15.9 22.8 14.7Domestic credit from the banking system to
Government (net) 24.5 10.3 22.5 12.1 19.8 11.4Public corporations 24.8 22.2 17.2 -5.3 0.5 13.7Private sector 7.5 8.8 25.1 21.9 28.2 18.6
Money multiplier for M2b (end year) 7.00 6.71 6.78 6.31 6.40 6.59Velocity of M2b (average for the year) (g) 2.99 2.85 (d) 2.62 (d) 2.40 (d) - -
interest rates (per cent per annum at year end)Standing Deposit Facility Rate (SDFR) (t) 6.50 6.50 6.00 7.00 6.50 7.25Standing Lending Facility Rate (SLFR) (t) 8.50 8.00 7.50 8.50 8.00 8.75Money market ratesAverage weighted call money rate (AWCMR) 7.66 6.21 6.40 8.42 8.20 8.75Treasury bill yields
91 days 7.54 5.74 6.45 8.72 8.88 9.60364 days 8.29 6.01 7.30 10.17 10.55 10.47
Deposit ratesCommercial banks’ average weighted deposit rate (AWDR) 9.37 6.20 6.20 8.17 6.87 9.13Commercial banks’ average weighted fixed deposit rate (AWFDR) 11.78 7.33 7.57 10.46 8.64 11.66NSB savings rate 5.00 5.00 5.00 4.25 4.50 4.00NSB 12 month fixed deposit rate 9.50 6.50 7.25 11.00 10.00 11.00
Lending ratesCommercial banks’ average weighted prime lending rate (AWPR) 10.13 6.26 7.53 11.52 10.70 11.70Commercial banks’ average weighted lending rate (AWLR) 15.18 11.91 11.00 13.20 12.09 13.73
caPitaL marKetAll share price index (ASPI) (1985 = 100) 5,912.8 7,299.0 6,894.5 6,228.3 6,283.3 6,747.1S&P SL20 index (2004 Dec = 1,000) 3,263.9 4,089.1 3,625.7 3,496.4 3,300.2 3,933.5Value of shares traded (Rs. million) 200,468 340,917 253,251 176,935 87,378 110,531Net purchases by non nationals (Rs. million) 22,783 21,217 -5,372 338 -6,374 21,640Market capitalisation (Rs. billion) 2,459.9 3,104.9 2,938.0 2,745.4 2,677.6 3,041.2
(k) Based on GDP estimates in US dollars(l) Excludes foreign assets in the form of direct investments abroad and trade credit and advances received(m) Overall debt service ratios were reclassified to capture debt servicing in accordance with the External Debt
Statistics Manual (2003) of the International Monetary Fund (IMF).(n) Special Drawing Rights (SDR), the unit of account of the IMF(o) Exchange rates have been defined in terms of indices so that the appreciation/ depreciation of the rupee
relative to other currencies is directly reflected by a rise/fall in the values of the effective exchange rate indices.
(p) CCPI is used for the computation of the Real Effective Exchange Rate (REER). REER is computed by adjusting the Nominal Effective Exchange Rate (NEER) for inflation differentials with the countries whose currencies are included in the basket.
(q) With the rebasing of CCPI (2013=100) REER indices have been recalculated.(r) Based on revised GDP estimates for 2014 and 2015 made avaliable in 2017 by the Department of Census and
Statistics.(s) Figures for 2015 and 2016 include assets/liabilities of DFCC Bank PLC, which merged with DFCC Vardhana
Bank, with effect from 1 October 2015.(t) Repurchase rate and Reverse Repurchase rate were renamed as Standing Deposit Facility Rate (SDFR) and
Standing Lending Facility Rate (SLFR) respectively, with effect from 2 January 2014.
V
KEY ECONOMIC INDICATORS

VI
CENTRAL BANK OF SRI LANKA | RECENT ECONOMIC DEVELOPMENTS: HIGHLIGHTS OF 2017 AND PROSPECTS FOR 2018

VII
CONTENTS
cHaPters PaGes
1. Overview 1
2. National Output and Expenditure 15
3. Economic and Social Infrastructure 31
4. Prices, Wages, Employment and Productivity 45
5. External Sector Developments 59
6. Fiscal Policy and Government Finance 75
7. Monetary Policy, Interest Rates, Money and Credit 89
8. Financial Sector Performance and System Stability 107
APPENDIX 1 - Major Economic Policy Changes and Measures 129
APPENDIX 2 - Statistical Appendix 143
TABLE 1 - Gross Domestic Product by Industrial Origin at Current Market Prices 145
TABLE 2 - Gross Domestic Product by Industrial Origin at Constant (2010) Prices 146
TABLE 3 - Expenditure on Gross Domestic Product at Current Market Prices 147
TABLE 4 - Trends in Principal Agricultural Crops 148
TABLE 5 - Foreign Direct Investment of BOI Enterprises by Sector 149
TABLE 6 - Developments in Economic Infrastructure 150
TABLE 7 - Consumer Price Indices - National Consumer Price Index 151
TABLE 8 - Consumer Price Indices - Colombo Consumer Price Index 151
TABLE 9 - Wage Rate Indices 152
TABLE 10 - Labour Force, Employment and Unemployment 152
TABLE 11 - Developments in External Trade 153
TABLE 12 - Balance of Payments 154
TABLE 13 - International Investment Position 155
TABLE 14 - Outstanding External Debt Position 156
TABLE 15 - Exchange Rate Movements (Rupees per Unit of Foreign Currency) 157
TABLE 16 - Government Fiscal Operations 158
TABLE 17 - Developments in Monetary Aggregates and Underlying Factors 159
TABLE 18 - Commercial Banks’ Loans and Advances to the Private Sector 160
TABLE 19 - Selected Interest Rates 161
TABLE 20 - Expansion of Banking Activities 162
TABLE 21 - Money and Capital Market Developments 162
VIII
CENTRAL BANK OF SRI LANKA | RECENT ECONOMIC DEVELOPMENTS: HIGHLIGHTS OF 2017 AND PROSPECTS FOR 2018

OVERVIEW
1In response to macroeconomic stabilisation measures taken by fiscal and monetary authorities, the
Sri Lankan economy exhibited signs of improvement in the first nine months of the year, despite economy-wide effects arising from adverse weather conditions. The economy grew at a rate of 3.9
per cent in real terms in the first half of the year in comparison to the growth of 3.7 per cent in the first half of 2016. The drought- and flood-related disturbances mainly affected Agriculture activities, which contributed to overall growth negatively and spilled over to the other sectors of the economy as well. However, Industry and Services related activities positively contributed to the expansion of the economy. Activities in the Industry sector were led by the continued growth in construction and mining and quarrying activities. The growth in Services related activities was mainly supported by financial services, wholesale and retail trade activities and transportation. The negative spillover effects of adverse weather conditions were felt by the other sectors of the economy through increased expenditure on imports amidst rising international commodity prices, higher prices of domestic food supplies and costs incurred on relief measures. Both investment and consumption expenditure contributed to the expansion in economic activities, while net exports continued to weigh down the growth momentum. Meanwhile, unemployment declined in the first half of the year, on a year-on-year basis. Domestic supply disruptions, tax revisions, and increased prices of imported commodities caused consumer price inflation to remain at elevated levels during the year, but further tightening of the monetary policy stance helped curtail demand driven inflationary pressures and inflation expectations. The growth of credit extended to the private sector decelerated gradually during the year, although broad money growth remained high as a result of the buildup of both foreign assets and domestic assets of the banking system. In spite of increased earnings from exports, the expected improvement in the external current account did not materialise largely due to increased expenditure on weather related imports and the decline in workers’ remittances. However, inflows to the financial account amidst positive investor sentiments resulted in an improvement in the Balance of Payments (BOP). Increased foreign exchange inflows helped the Central Bank to replenish international reserves within a more market based exchange rate policy during the year. Meanwhile, in the fiscal sector, revenue collection as well as the government’s primary balance improved during the period under review. Nevertheless, some deviation from the envisaged budget deficit target is likely in 2017 mainly as a result of adverse weather related fiscal costs. Meanwhile, the financial sector remained sound. Furthermore, the performance under the Extended Fund Facility programme of the International Monetary Fund (IMF-EFF) progressed, helping to boost investor confidence. Going forward, it is expected that the forward looking approach to monetary policy, the market-based exchange rate policy, and the process of fiscal consolidation will continue. Priority is also being attached to institutionalising these processes to make them more durable. However, these processes should be complemented by the implementation of the envisaged structural adjustments aimed at promoting external trade, attracting foreign direct investments and improving the productivity and efficiency of the economy for the country to build on the improvements observed thus far during the year, enabling the economy to reach its potential.

1
2
CENTRAL BANK OF SRI LANKA | RECENT ECONOMIC DEVELOPMENTS: HIGHLIGHTS OF 2017 AND PROSPECTS FOR 2018
54.3 per cent in the first half of 2017 compared
to 53.7 per cent in the corresponding period of
2016. The increase in the LFPR was due to the
increase in the female LFPR while there was a
marginal decline in the male LFPR during the
first half of 2017. However, the female LFPR
continued to be significantly lower than the male
LFPR, emphasising the potential of the LFPR
to be improved through the increase in female
employment.
y Consumer price inflation remained higher
than the desired levels thus far in 2017 due
to the combined effect of tax revisions,
domestic weather related disturbances
and rising international commodity prices.
Headline inflation, measured using the National
Consumer Price Index (NCPI, 2013=100) as
well as the Colombo Consumer Price Index
(CCPI, 2013=100) remained high during the
first quarter of 2017, impacted by supply side
disruptions resulting from adverse weather
conditions as well as the effect of upward tax
revisions. However, a moderation in inflation
was observed during the second quarter of
2017, underpinned by improvements in supply
conditions and the government’s initiatives
to import essential food items. However, this
trend reversed since August 2017 mainly due
to a sharp acceleration in volatile food inflation
given continued adverse weather conditions.
Accordingly, NCPI based headline inflation
increased to 8.6 per cent, year-on-year, in
September 2017, mainly reflecting the high food
inflation while CCPI based headline inflation
also increased to 7.1 per cent, year-on-year.
Meanwhile, the movements in core inflation were
also impacted by tax revisions to some extent.
However, core inflation remained low on average,
indicating that demand driven inflationary
pressures were broadly contained as a result
of monetary policy measures adopted by the
Central Bank. Accordingly, NCPI based core
inflation declined to 4.6 per cent, year-on-year, by
September 2017 from 6.7 per cent at end 2016.
In contrast, CCPI based core inflation edged
up marginally to 6.0 per cent, year-on-year, in
September 2017 from 5.8 per cent at end 2016.
Sectoral Developments
Real Sector and Inflation
y The Sri Lankan economy grew by 3.9
per cent in real terms during the first half of
2017 compared to the 3.7 per cent growth
in the first half of 2016. As in the previous
year, adverse weather conditions hampered
economic expansion during the first half of
this year. Accordingly, value added growth in
Agriculture related activities contracted while
exerting spillover effects on other sectors of the
economy. The contraction in Agriculture related
activities was particularly witnessed in relation to
paddy, oleaginous fruits (coconut, king coconut,
oil palm), vegetables and cereals (except rice).
However, both Industry and Services activities
recorded an expansion during the first half of the
year. The expansion in Industry related activities
was mainly supported by the continued growth in
construction and mining and quarrying activities.
The growth in Services related activities was
mainly sustained by financial services, wholesale
and retail trade activities, and transportation.
Meanwhile, in terms of expenditure approach
estimates, the expansion in GDP was due to the
increase in both investment and consumption
expenditure during the first half of 2017. Net
external demand continued to dampen economic
growth during the first quarter of 2017, although
some improvement was observed in the second
quarter of the year.
y The unemployment rate declined marginally
to 4.3 per cent during the first half of 2017
from 4.4 per cent in the corresponding period
of 2016. This marginal improvement was due to
the decline in the male unemployment rate amidst
a marginal increase in the female unemployment
rate. Moreover, unemployment among youth and
educationally qualified remained high during the
period under review. Although the unemployment
rate declined, the total number of unemployed
persons increased marginally during the first
half of the year. Meanwhile, the overall Labour
Force Participation Rate (LFPR) increased to

11
3
OVERVIEW
Per
cen
t
Headline Core
Overall Balance Gross Official Reserves - RHSEnd Sep
Mar-1
5
Mar-1
6
Mar-1
7
May-1
5
May-1
6
May-1
7
Jul-1
5
Jul-1
6
Jul-1
7
Nov-1
5
Nov-1
6
Jan -
15
Jan -
16
Jan -
17
Sep-
15
Sep-
16
Chart 1.2 : NCPI based Inflation (Year-on-Year)Chart 1.1 : Quarterly Real GDP Growth (Year-on-Year)
Chart 1.3 : Trade Balance and Current Account Balance Chart 1.4 : Overall Balance and Gross Official Reserves
Sep-
17
The Sri Lankan economy grew amidst weather related disturbances…
In spite of the pick up in exports, adverse weather also forestalled the anticipated improvement in the current account…
Government revenue collection increased, but expenditure also expanded, particularly with relief measures…
With the tight monetary policy stance, market interest rates remained high...
Overall, many sectors of the economy responded well to the stabilisation measures taken, creating a conducive environment to focus more on economic growth in the period ahead.
…but continued foreign financial inflows helped improve the country’s BOP and foreign exchange reserves.
...and amidst challenges, fiscal consolidation continued.
...and the expansion of credit to the private sector decelerated gradually.
…while rising food prices pushed up headline inflation.
Chart 1.5 : Government Revenue Vs. Expenditure Chart 1.6 : Key Fiscal Balances
Chart 1.8 : Credit Granted by Commercial Banks to the Private Sector
Per c
ent
Per c
ent
USD
mnAs
a %
GDP
As a
% G
DPRs
. bn
USD
mn
USD
mn
Exports Imports Trade Balance Current Account Balance
Jan-Jun Jan-Jun
2016Jan-Aug
2017Jan-Aug
Jan-AugJan-Aug
Revenue & Grants
SLFR
AWDR AWFDR AWLR
364-day Treasury Bill Rate Monthly change in credit
(Absolute terms) Growth of credit (y-o-y) - RHS
SDFR Monthly AWPR
Expenditure & Net LendingCurrent Account Balance
Jan-
13
Sep-
14
May-1
6
May-
13
Jan-
15
Sep-
16
Sep-
13
May-1
5
Jan-
17
Jan-
14
Sep-
15
May-1
7
May-1
4
Jan-
16
Sep-
17
Dec-1
1Ap
r-12
Aug-1
2De
c-12
Apr-1
3Au
g-13
Dec-1
3
Apr-1
4
Aug-1
4
Dec-1
4
Apr-1
5
Aug-1
5
Dec-1
5Ap
r-16
Aug-1
6
Dec-1
6Ap
r-17
Aug-1
7
Primary Balance Overall Deficit
12
10
8
6
4
2
0
-2
2013
-Q1
Per c
ent
Agriculture Industry Services Taxes Less Subsidies GDP
2014
-Q2
2015
-Q3
2013
-Q2
2014
-Q3
2015
-Q4
2013
-Q3
2014
-Q4
2016
-Q1
2016
-Q4
2013
-Q4
2015
-Q1
2016
-Q2
2017
-Q1
2014
-Q1
2015
-Q2
2016
-Q3
2017
-Q2
10
8
6
4
2
0
-2
-15,000
-10,000
-5,000
0
5,000
2013 2014 2015 2016 2016 2017
10,000
15,000
20,000
-2,000-1,500
2013 2014 2015 2016 2017
-1,000-500
0
5001,0001,5002,0002,500
01,0002,0003,000
5,0004,000
6,0007,0008,0009,000
02013
-0.7 -0.8-1.2
-2.3
-0.6-0.2
-5.4
-1.2-0.6
-3.9
-0.9
0.0
-4.0
-2.9
-7.6
-1.5
-5.4-5.7
2014 2015 2016
-1-2-3-4-5-6-7-8
18
16
14
12
10
8
6
4
200 40
30
20
10
0
-10
-20
150
100
50
0
-50
-100
9.9
60.215.4
76.5
43.6
78.753.2
18.0
0
5
2013 2014 2015 2016 2016 2017
10
15
20
25
12.0
17.4
11.6
17.3
13.3
20.9
14.3
19.7
8.2
12.2
9.0
13.0
Chart 1.7 : Movements in Selected Market Interest Rates

1
4
CENTRAL BANK OF SRI LANKA | RECENT ECONOMIC DEVELOPMENTS: HIGHLIGHTS OF 2017 AND PROSPECTS FOR 2018
External Sector
y In the external sector, the gradual pick up
in export earnings contained the expansion
in the trade deficit in the first eight months
of 2017. Reversing the lacklustre performance
experienced during the past two years, exports
recovered from March 2017, registering a 7.6 per
cent growth in cumulative earnings, on a year-on-
year basis, to US dollars 7,413 million in the first
eight months of 2017. The gradual recovery in key
export markets, increased commodity prices in
international markets, the restoration of the GSP+
concessions from the European Union, conducive
external trade policies together with institutional
support and a more competitive exchange
rate contributed towards the increase in export
earnings. Accordingly, higher export earnings were
received from tea, petroleum products, transport
equipment, spices, seafood, and machinery
and mechanical appliances. However, export
earnings from textiles and garments declined
moderately during the first eight months of 2017,
due to the weak performance recorded in the first
half of the year. Nevertheless, a notable increase
in textiles and garments exports was seen during
the months of July and August 2017 following
the restoration of GSP+. Meanwhile, expenditure
on imports also grew substantially, recording a
year-on-year growth of 9.6 per cent to US dollars
13,599 million during this period. The increase
in import expenditure was mainly driven by the
significant increase in fuel imports, together
with gold and rice imports. Increased import
expenditure on fuel was mainly due to the higher
demand from the domestic power generation
sector in view of low hydropower generation as
a result of the drought. Increased fuel prices
in the international market also impacted the
fuel bill. Further, rice imports continued to
increase since January 2017 as a result of the
measures taken by the government to encourage
imports to meet the shortage in the weather
affected domestic supply. The removal of the
Ports and Airport Development Levy (PAL)
in the previous year may have contributed to
the increased volume of gold imports during
the year. However, import expenditure on machinery and equipment, personal vehicles, fertiliser and mineral products declined during the period. With these developments, the trade deficit widened to US dollars 6,186 million during the first eight months of 2017 from US dollars 5,515 million in the corresponding period of the previous year.
y In addition to developments in the trade account, the widening of the deficit in the primary income account together with the moderation of inflows to the services and secondary income accounts resulted in a widening of the external current account deficit in the first half of 2017. The deficit in the primary income account widened during the first half of 2017, mainly driven by increased interest payments on International Sovereign Bonds (ISBs). The surplus in the services account recorded a marginal increase during the first half of 2017, primarily due to the moderate growth of earnings from tourism. The partial closure of the Bandaranaike International Airport (BIA) owing to the re-surfacing of the runway and the breakout of dengue epidemic also affected tourist arrivals. Meanwhile, the transportation services sector remained positive with a healthy growth in transhipments. The sluggish performance of the Middle Eastern economies due to persistently low oil prices and geo-political uncertainties and changes in government policies resulted in a decline in workers’ remittances, leading to a reduction in the surplus of the secondary income account during the first half of the year vis-à-vis the corresponding period of 2016. The widening of the deficits in the trade and primary income accounts, together with the lacklustre performance in earnings from tourism and workers’ remittances, resulted in a notable current account deficit of US dollars 1,480 million in the first half of 2017, compared to a deficit of US dollars 644 million in the corresponding period of 2016.
y The financial account, which recorded significant outflows in the first quarter,
experienced substantial inflows in the second
quarter of 2017. Outflows from the financial

11
5
OVERVIEW
account in the first quarter were primarily driven
by significant withdrawals of foreign investments
from the government securities market. However,
a reversal in financial flows was witnessed in
the second quarter of the year with increased
investor confidence brought by the successful
conclusion of the Second Review of the
IMF-EFF programme as well as the gradual
stabilisation of the yields of US government
securities. Inflows to the government securities
market gradually improved from the second
quarter of the year, offsetting the outflow recorded
in the first quarter. The financial account also
benefitted from higher inflows to the Colombo
Stock Exchange (CSE), increased foreign
direct investments (FDI) and proceeds from
the eleventh ISB and the foreign currency term
financing facility obtained by the government.
Reflecting these developments in the external
sector accounts, the BOP, which registered an
overall surplus of US dollars 1,563 million by end
June 2017, further improved by end September to
record an estimated surplus of US dollars 2,027
million. By end 2016, the corresponding figure
was a deficit of US dollars 500 million.
y Meanwhile, gross official reserves of the
country increased to US dollars 7.3 billion at
end September 2017 from US dollars 6.0 billion
at end 2016. The level of gross official reserves
increased at end September 2017, primarily due
to net purchases of foreign currency by the Central
Bank amounting to US dollars 1,161 million from
the domestic foreign exchange market, together
with other foreign currency inflows such as the
proceeds from the ISB, foreign currency term
financing facility, net borrowings through Sri Lanka
Development Bonds (SLDBs) and the receipt of
the third tranche under the IMF-EFF programme.
The major outflows during this period included
the settlement of the RBI foreign currency swap
arrangement, foreign currency debt service
payments, including IMF Stand-By Arrangement
(SBA) principal payments, and net Asian Clearing
Union (ACU) outflows. Accordingly, the country’s
gross official reserve level at end September
2017 is estimated to be equivalent to 4.2 months
of imports. Reflecting the qualitative improvement
brought about by the build-up of reserves through
direct market purchases and the decline in short
term liabilities, reserve adequacy in terms of
short-term debt and liabilities improved to 62 per
cent at end September 2017 from 52 per cent at
end 2016.
y The improved external environment facilitated
the Central Bank to implement a more market
based exchange rate policy in 2017, under
which the Central Bank intervened in the
domestic foreign exchange market to build
up international reserves with minimal impact
on the exchange rate. Continued outflows
in terms of import expenditure, debt service
payments and unwinding of foreign investments
in rupee denominated government securities
exerted pressure on the rupee during the first
quarter of 2017. However, market conditions
improved thereafter, with inflows from foreign
investments to the CSE and the government
securities market, and the subsequent conversion
of export proceeds. This turnaround enabled the
Central Bank to absorb foreign exchange from
the domestic market on a net basis during this
period. Meanwhile, the depreciation pressure
on the rupee further eased gradually from
May 2017, with improved investor confidence
following the issuance of the ISB, the obtaining
of the term loan and the receipt of the third
tranche under the IMF-EFF programme. Overall,
the Sri Lankan rupee depreciated by 2.2
per cent against the US dollar during the year up
to end September 2017. Reflecting the nominal
movement of the Sri Lankan rupee against some
of the major currencies, both the 5-currency and
24-currency nominal effective exchange rate
(NEER) indices depreciated during the year up to
end September 2017. The real effective exchange
rate (REER) indices, which also take into account
the inflation differential amongst countries in the
currency basket, depreciated considerably during
the period under review, but remained above the
100 threshold, suggesting the need for further
depreciation to reach the level of competitiveness
that prevailed in 2010.

1
6
CENTRAL BANK OF SRI LANKA | RECENT ECONOMIC DEVELOPMENTS: HIGHLIGHTS OF 2017 AND PROSPECTS FOR 2018
Fiscal Sector
y Several policy measures were introduced by
the government during the year 2017 to further
strengthen the fiscal consolidation process
and public debt management. Accordingly,
a new Inland Revenue Bill was enacted by the
Parliament in September 2017 with a view to
simplify and rationalise the existing income tax
structure, broaden the direct tax collection by
removing exemptions and strengthening tax
administration. In this respect, the Revenue
Administration Management Information System
(RAMIS) has been set-up at the Inland Revenue
Department to enable tax payers to make online
payments in respect of several taxes. In addition,
initial steps were also taken to establish a National
Single Window System (NSWS) at the Sri Lanka
Customs to facilitate external trade, while the
Integrated Treasury Management Information
System (ITMIS) at the Ministry of Finance and
Mass Media (MOF) is expected to commence
from the last quarter of 2017 as a pilot project
for selected ministries. In relation to rationalising
recurrent expenditure, quarterly expenditure
and income outcome reports for the first and
second quarters of 2017 were presented to the
Parliament as announced in the Budget 2017 for
strengthening Parliamentary control on public
finances. Further, the National Agency for Public
Private Partnership (NAPPP) was established
at the MOF with a view to promoting public
private partnerships (PPPs). The government
also introduced several initiatives to implement
structural reforms in State Owned Business
Enterprises (SOBEs) in order to improve their
financial strength, thereby ensuring long term
financial viability. Accordingly, Statements of
Corporate Intent (SCIs) were signed with five
selected key SOBEs in order to improve the
oversight and fiscal discipline of these SOBEs,
while SCIs are expected to be signed with
another ten SOBEs. During the year, several
measures were taken to improve the public
debt management strategy and transparency in
the government securities market. A new Fiscal
Liability Management Bill is also being drafted to
create the space for proactive debt management.
y The performance of the fiscal sector showed some improvement in 2017, although weather related relief expenditure is likely to cause a deviation from the envisaged fiscal targets for the year. The government revenue to GDP ratio recorded a notable improvement increasing to 9.0 per cent during the first eight months of 2017 from 8.2 per cent in the corresponding period of 2016. This increase in government revenue was mainly due to the increase in the proceeds from goods and services related taxes, especially the Value Added Tax (VAT), excise duty on petroleum and motor vehicles, Nation Building Tax (NBT), Special Commodity Levy (SCL) and PAL. The revenue collection from income taxes also improved due to higher revenue from the Economic Service Charge (ESC). However, revenue from excise duty on liquor, cigarettes and tobacco declined during this period mainly due to the drop in sales of liquor and cigarettes. The increase in duties to an extremely high level is likely to be a significant causal factor. Total expenditure and net lending as a percentage of estimated GDP also increased to 13.0 per cent during the first eight months of 2017, in comparison to 12.2 per cent recorded in the same period of 2016, due to increases in both recurrent expenditure and public investment. As the increase in government expenditure was higher than the increase in government revenue, the overall budget deficit increased to 4.0 per cent of the estimated GDP during the first eight months of 2017 from 3.9 per cent in the corresponding period of 2016. However, both the current account and the primary account improved during this period vis-a-vis the corresponding period of the previous year and the IMF-EFF target as at 30 June 2017 was met.
y Both domestic and foreign sources were utilised to finance the overall budget deficit of Rs. 520.2 billion during the first eight months of 2017. However, net domestic financing at Rs. 273.5 billion during this period remained below the sum of Rs. 309.5 billion recorded during the first eight months of the previous year. Meanwhile, net foreign financing increased significantly to Rs. 246.7 billion during the period under consideration from Rs. 175.6 billion in the same period of 2016.

11
7
OVERVIEW
Monetary Sector
y The Central Bank continued to maintain a
tight monetary policy stance in the first nine
months of 2017 in view of the developments
in inflation as well as monetary and credit
aggregates. With a view to containing the
build-up of adverse inflation expectations and
reining in the excessive expansion of money
supply, the Central Bank further tightened its
monetary policy by raising policy interest rates by
25 basis points in March 2017. The Standing
Deposit Facility Rate (SDFR) and the Standing
Lending Facility Rate (SLFR) of the Central
Bank stood at 7.25 per cent and 8.75 per cent,
respectively, since then.
y In response to the monetary policy stance
maintained by the Central Bank and the high
financing requirement of the government
budget, most market interest rates moved
upwards during the first nine months of
2017, although short term rates adjusted
downwards with liquidity improvements in
the domestic money market since mid July
2017. The Average Weighted Call Money Rate
(AWCMR) hovered around the upper bound of the
policy rate corridor during the first seven months
of 2017, reflecting tight monetary conditions.
However, with improved liquidity conditions since
mid July 2017, the AWCMR adjusted downwards
towards the middle of the policy rate corridor by
end September 2017. Meanwhile, Sri Lanka Inter
Bank Offered Rates (SLIBOR) adjusted in line with
movements in the AWCMR. The deposit interest
rates of commercial banks increased particularly
during the first seven months of 2017, reflecting
the increased funding costs of commercial
banks. Lending rates of commercial banks also
increased further and stabilised at high levels by
end September 2017. Yields on Treasury bills in
the primary market, which increased during the
first four months of 2017 reflecting the increased
demand for funds by the government, declined
thereafter due to increased foreign inflows to the
government, improved confidence with the receipt
of the third tranche of the IMF-EFF and increased
government revenue collection. Similarly, yields
on Treasury bonds in the primary market also
declined since April 2017, reversing the upward
movement witnessed during the first quarter of
2017. Secondary market yields followed suit,
resulting in a downward shift in the yield curve
for government securities, particularly in the
long end, during the first nine months of 2017.
Meanwhile, interest rates applicable on corporate
debt instruments moved upwards during the first
eight months of 2017. In line with the movements
in global interest rates, interest rates applicable
on foreign currency deposits maintained with
commercial banks increased marginally during
the first nine months of 2017.
Source: Central Bank of Sri Lanka
Date Measure
10-May-2013 Repurchase rate and Reverse Repurchase rate reduced by 50 basis points to 7.00% and 9.00%, respectively.
26-Jun-2013 Statutory Reserve Requirement (SRR) reduced by 2 percentage points to 6% with effect from 1-Jul-2013.
15-Oct-2013 Repurchase rate and Reverse Repurchase rate reduced by 50 basis points to 6.50% and 8.50%, respectively.
2-Jan-2014 The Policy Rate Corridor was renamed as the Standing Rate Corridor (SRC), and the Repurchase rate and the Reverse Repurchase rate of the Central Bank were renamed as the Standing Deposit Facility Rate (SDFR) and Standing Lending Facility Rate (SLFR), respectively. SLFR reduced by 50 basis points to 8.00%. The Standing Deposit Facility (SDF) uncollateralised with effect from 1-Feb-2014.
23-Sep-2014 Access to the SDF of the Central Bank by OMO participants at 6.50% was rationalised to a maximum of three times per calendar month. Any deposits at the SDF window exceeding three times by an OMO participant was accepted at a special interest rate of 5.00%.
2-Mar-2015 The 5.00% special SDF rate was withdrawn.
15-Apr-2015 The SDFR and SLFR reduced by 50 basis points to 6.00% and 7.50%, respectively.
3-Sep-2015 The exchange rate was allowed to be determined based on demand and supply conditions in the foreign exchange market.
30-Dec-2015 SRR was increased by 1.50 percentage points to 7.50% to be effective from the reserve period commencing 16-Jan-2016.
19-Feb-2016 The SDFR and SLFR increased by 50 basis points to 6.50% and 8.00%, respectively.
28-Jul-2016 The SDFR and SLFR increased by 50 basis points to 7.00% and 8.50%, respectively.
24-Mar-2017 The SDFR and SLFR increased by 25 basis points to 7.25% and 8.75%, respectively.
Table 1.1Recent Monetary Policy Measures
1
8
CENTRAL BANK OF SRI LANKA | RECENT ECONOMIC DEVELOPMENTS: HIGHLIGHTS OF 2017 AND PROSPECTS FOR 2018
y Broad money supply (M2b
) continued to
expand during the first eight months of 2017.
By end August 2017, M2b
recorded a year-on-year
growth of 21.3 per cent in comparison to a growth
of 18.4 per cent at end 2016. Net domestic assets
(NDA) contributed 78 per cent to the year-on-year
expansion of broad money driven by credit flows
to the private sector, the government and public
corporations, despite the deceleration in private
sector credit growth observed since July 2016.
Net foreign assets (NFA) of the banking sector
also expanded during the first eight months of
2017, led mainly by the NFA of the Central Bank.
y The growth of credit extended to the private
sector decelerated during the first eight
months of 2017 responding to the monetary
policy stance and the resultant high market
interest rates. The year-on-year growth of credit
to the private sector decelerated to 18.0 per
cent by end August 2017 from 21.9 per cent at
end 2016 and its peak of 28.5 per cent in July
2016. In absolute terms, credit to the private
sector increased by Rs. 404.6 billion during the
first eight months of 2017 in comparison to an
increase of Rs. 456.3 billion in the corresponding
period of 2016. Credit to all major sectors of the
economy continued to expand, albeit at a slower
pace, during the first half of 2017 as reflected
by the Quarterly Survey of Commercial Banks’
Loans and Advances to the Private Sector. The
growth of credit to the private sector is expected
to moderate further and reach the envisaged level
of 15-16 per cent by end 2017.
y Borrowing by the public sector from the
banking system remained high in the first eight
months of 2017. Net credit to the government
(NCG) by the banking sector continued to
increase during the first eight months of 2017,
entirely on account of the expansion in NCG from
commercial banks. While NCG from commercial
banks increased significantly by Rs. 384.9 billion
during the first eight months of 2017, NCG from
the Central Bank contracted significantly by
Rs. 119.5 billion during this period. Accordingly,
the increase in NCG by the banking system at
Rs. 265.4 billion in the first eight months of 2017
was noticeably higher than the Rs. 178.4 billion
recorded in the corresponding period of 2016.
Meanwhile, the increasing trend in credit granted
to public corporations observed during the first
five months of 2017 moderated thereafter. Credit
obtained by public corporations rose by Rs. 7.8
billion by end August 2017 as against a contraction
of Rs. 81.5 billion recorded in the corresponding
period of 2016.
Financial Sector
y The financial sector continued to expand
during the first eight months of 2017 with all
major sectors remaining sound. The banking
system continued to expand while maintaining
capital and liquidity well above the regulatory
minimum requirements, thereby ensuring the
resilience of the sector. While the asset base of
the banking sector continued to grow, a marginal
deterioration was observed in asset quality, as
reflected in the increase in the non-performing
loans (NPL) ratio. The profitability of the sector
improved during this period mainly due to higher net
interest income and significant revaluation gains.
The banking sector also continued to contribute
to enhanced financial inclusion through the active
expansion of the branch and ATM networks
during this period. Moreover, implementation of
the Basel III framework would further enhance
the resilience of the banking sector. Although
the asset base of non-bank financial institutions
(NBFIs) expanded, it expanded at a slower pace
compared to the performance in 2016. Lending
activities of the sector were weighed down by
macroprudential policy measures, while asset
quality showed signs of stress although remaining
at manageable levels. Other sub sectors of
the financial sector such as the insurance and
the superannuation fund sectors recorded a
positive performance, while the unit trust sector
contracted. Amidst further strengthening of capital
regulations, the stock broker sector showed a
mixed performance during the first eight months
of 2017. While activities of financial institutions

11
9
OVERVIEW
engaged in microfinance expanded, rural poverty
and indebtedness remained key concerns though
the latest Household Income and Expenditure
Survey (HIES:2016) showed positive trends
in terms of incomes, poverty and the Gini
Coefficient. Meanwhile, the domestic money
market and foreign exchange market remained
sufficiently liquid during the year. The corporate
debt securities market performed moderately
during the first half of 2017. Some improvement
was observed in the share price indices, market
capitalisation and foreign inflows to the CSE thus
far during the year, although domestic investor
activity remained weak. The efficiency and safety
of the national payment system continued to be
enhanced during this period to effectively cater to
the payment needs of institutions, corporates and
individuals.
International Economic Environment
y The upswing in global economic activity
witnessed during the end of 2016 is expected
to be further strengthened in 2017 and
2018, according to the IMF World Economic
Outlook (WEO) – October 2017. Synchronised
growth is being experienced in Europe, Japan
and the US for the first time since the Global
Financial Crisis in 2007, while economic growth
is expected to expand in emerging market and
developing countries. The pick up in growth
is supported by notable improvements in
investment, trade and industrial production,
coupled with strengthening business and
consumer confidence. Accordingly, the IMF
forecasts global growth at 3.6 per cent in 2017
and 3.7 per cent in 2018. Stronger than previously
projected rebound in the Euro area, Japan
and Canada is expected to drive the growth
momentum of advanced economies in 2017 and
2018, while growth projections for the US and the
UK have been revised downward. Meanwhile,
growth in emerging market and developing
economies is projected to rise in 2017 and 2018
owing to strong growth expectations for China
and a host of other emerging market economies.
Weak productivity and adverse demographic
factors, mainly in advanced economies, remain
downside risks to medium term growth.
y Advanced economies are expected to
continue to grow at a moderate pace in 2017
and 2018, buoyed by the cyclical recovery
in manufacturing and trade and the upturn
in financial markets. These economies are
projected to grow by 2.2 per cent and 2.0 per
cent during 2017 and 2018, respectively. The IMF
revised the projected growth rates upwards for
2017 based on stronger than expected growth in
the Euro area and Japan, which are supported
by the pick up in global trade and manufacturing.
Nevertheless, the IMF revised downward the
projections for the US and the UK. In spite of
the downward revision, the US economy, Sri
Lanka’s largest export destination, is expected to
grow at a healthy rate of 2.2 per cent in 2017,
followed by a growth of 2.3 per cent in 2018. The
growth in the UK, which is Sri Lanka’s second
largest export destination, is projected at 1.7
per cent and 1.5 per cent, respectively, in 2017
and 2018. Growth prospects for the UK continue
to be marred by the uncertainty surrounding
post-Brexit arrangements.
y The growth momentum in emerging market
and developing economies is expected to
pick up markedly in 2017 and 2018, recovering
from slackened activity in 2016. This growth
is expected to be mainly supported by growth
enhancing structural reforms and spillover effects
of growth in advanced economies and China. The
IMF growth projection for emerging market and
developing economies is 4.6 per cent for 2017
and 4.9 per cent for 2018, rising from the growth
rate of 4.3 per cent estimated for 2016. The
annual economic growth of China is expected
to remain above 6.0 per cent over the medium
term, supported by supply side reforms, including
efforts to reduce excess capacity in the industrial
sector. India’s growth is projected to decelerate
to 6.7 per cent in 2017, reflecting the lingering
effects of the currency demonetisation in 2016

1
10
CENTRAL BANK OF SRI LANKA | RECENT ECONOMIC DEVELOPMENTS: HIGHLIGHTS OF 2017 AND PROSPECTS FOR 2018
and the imposition of the Goods and Services tax
in July 2017. These effects are expected to be
of a short term nature and growth is expected to
accelerate from 2018. The ASEAN-5 economies
are expected to sustain growth at 5.2 per cent in
2017 and 2018 propped by external demand from
China and Europe.
y Global growth projections may be affected
by numerous downside risks to the strength
and durability of the global economic
recovery, but could also be subject to upward
revisions, with stronger cyclical recovery and
stronger consumer and business confidence.
Uncertainties relating to macroeconomic policies
in the US could hinder the global growth, affecting
asset prices and global financial market stability.
Monetary policy normalisation in the US could
tighten global financial conditions as well. Such
an effect may result in capital outflows from
emerging economies. Persistently low inflation in
advanced economies could weigh on achieving
full employment and potential output, and
produce negative spillover effects on emerging
economies, amplified by restrictions on trade.
The IMF is also concerned that the strong credit
growth in China, unless addressed proactively by
Chinese authorities without allowing for sudden
market adjustments, could adversely affect the
global economy through trade and commodity
price channels. Meanwhile, non-economic factors
such as geopolitical tensions and terrorism, as
well as extreme weather events could hamper
global growth prospects as well.
y Inflation in advanced economies, which has
picked up since 2016, is expected to increase
further in 2017 and 2018, while inflation in
emerging market and developing economies is
projected to remain broadly stable. Consumer
price inflation that stood at 0.8 per cent, on
average, in advanced economies during 2016 is
expected to increase to 1.7 per cent in 2017 and
2018, albeit at a slower pace than anticipated at
the beginning of the year, partly reflecting weaker
than expected oil prices. Notably, the headline
inflation rates in all advanced economies,
particularly in Japan, which experienced deflation
in 2016, are expected to record positive levels
in 2017. Meanwhile, consumer price inflation in
emerging market and developing economies is
expected to stabilise over the medium term, with
forecasts reaching 4.2 per cent in 2017 and 4.4
per cent in 2018. However, several emerging
economies are expected to witness a decline in
inflation. Further, oil prices have become firmer
due to the reduction in oil inventories and the
supply limitations imposed by the Organization
of the Petroleum Exporting Countries (OPEC)
and Russia. The IMF projects average global oil
prices at US dollars 50.28 per barrel in 2017 and
US dollars 50.17 per barrel in 2018.
y Monetary policy in advanced economies
continued to move in diverse directions
given uneven economic recovery. Reflecting
these divergences, the US Federal Reserve
continued its policy normalisation programme,
while the Bank of England (BoE) and European
Central Bank (ECB) maintained accommodative
monetary policies. Further to raising the target
range for the Federal funds rate on two occasions
so far during 2017, the US Federal Reserve
has indicated its intention to reduce the size
of its balance sheet substantially in the period
Country Key Policy Rate End 2014
End 2015
End 2016 Sep-17
Sri Lanka Standing Deposit Facility Rate 6.50 6.00 7.00 7.25Standing Lending Facility Rate 8.00 7.50 8.50 8.75
Emerging Market Economies
India Repurchase rate 8.00 6.75 6.25 6.00Malaysia Overnight policy rate 3.25 3.25 3.00 3.00Thailand 1-day bilateral repo rate 2.00 1.50 1.50 1.50China 1-year yuan lending rate 5.60 4.35 4.35 4.35
Advanced EconomiesUSA Federal funds rate 0-0.25 0.25-0.50 0.50-0.75 1.00-1.25UK Bank rate 0.50 0.50 0.25 0.25ECB Refinance rate 0.05 0.05 0.00 0.00Japan Overnight call rate 0.00 0.00 -0.10 -0.10Canada Overnight rate 1.00 0.50 0.50 1.00Australia Cash rate 2.50 2.00 1.50 1.50Sweden Repo rate 0.00 -0.35 -0.50 -0.50
Source: Websites of respective central banks
Per cent
Table 1.2 Changes in the Policy Interest Rates of
Selected Central Banks

11
11
OVERVIEW
ahead. The UK is currently experiencing the
lowest level of unemployment in four decades
while inflation remains above the BoE’s target,
but the uncertainties arising from Brexit have
prevented monetary policy tightening in the
UK so far. Nevertheless, some withdrawal of
monetary stimulus by the BoE is expected in
order to maintain inflation at targeted levels
in the period ahead. The ECB is expected to
rationalise its asset purchase programme, given
the expected economic recovery in the Eurozone.
Meanwhile, the Bank of Japan (BoJ) continued
with Quantitative and Qualitative Monetary
Easing (QQE), aiming to achieve the inflation
target of 2 per cent. Further, the Reserve Bank
of Australia (RBA) also held its monetary policy
stance unchanged with a view to supporting the
achievement of the inflation target and sustain
growth in the economy.
y The monetary policy stances of the emerging
market economies also varied in the midst
of a complex global economic environment.
Some emerging economies eased monetary
policy with a view to boost economic growth. The
Reserve Bank of India (RBI) reduced its repo rate
under the liquidity adjustment facility (LAF) by
25 basis points to 6.0 per cent in August 2017,
in consonance with the objective of achieving
the medium term target for inflation of 4 per cent
within a band of +/- 2 per cent, while supporting
economic growth. The Central Bank of Chile
also reduced its benchmark rate by 100 basis
points to 2.50 per cent on three occasions during
the first half of 2017. Meanwhile, a number of
emerging market economies gradually tightened
their monetary policies to address issues such
as currency depreciation, capital outflows and
inflationary pressures. The Central Bank of Mexico
raised its benchmark rate on multiple occasions,
totaling 125 basis points to 7.0 per cent during
2017, with a view to curtailing demand pressures
of inflation. The Central Bank of the Republic of
Turkey also raised its overnight lending rate by
75 basis points to 9.25 per cent in January 2017,
and raised the late liquidity window’s lending
rate by 75 basis points and 50 basis points in
March and April 2017, respectively, to 12.25
per cent. Meanwhile, considering the improved
growth outlook and to maintain the current growth
momentum, Bank of Thailand decided to keep
its policy rates unchanged at 1.50 per cent in
2017. Bank Negara Malaysia also decided to
maintain its overnight policy rate unchanged at
3.0 per cent, citing improved performance of the
economy during the first half of 2017, supported
by stronger domestic demand and an additional
impetus from exports.
Expected Developments
y Sri Lanka’s growth trajectory is expected to
improve gradually in the medium term with the
support of ongoing structural adjustments,
improving macroeconomic stability and
consistent policies. Nevertheless, economic
growth during the second half of 2017 is expected
to be low, due to the effects of adverse weather
conditions, although it is expected to perform
better than the first half of the year. Accordingly,
real economic growth during 2017 is projected to
be between 4.0 - 4.5 per cent, on a year-on-year
basis, in comparison to the 4.4 per cent expansion
recorded in 2016. Growth is envisaged to
improve thereafter with the support of conducive
macroeconomic policies and the realisation of
growth promoting strategies of the government,
and the resultant increase in domestic and
foreign investments. The macroeconomic
environment is expected to improve with revenue
based fiscal consolidation measures, the market
based flexible exchange rate system, and mid-
single digit inflation. Furthermore, initiatives
aimed at harnessing higher economic growth
through the development of the country as an
export driven economic hub are expected to
provide a major impetus towards growth. This
would entail improving the production capacity of
the country through mechanisation of economic
activities, enhancing the skill level of the labour
force and digitalisation of the economy as well
as improving global linkages through entering
into trade agreements and global production
networks. The envisaged growth needs to be

1
12
CENTRAL BANK OF SRI LANKA | RECENT ECONOMIC DEVELOPMENTS: HIGHLIGHTS OF 2017 AND PROSPECTS FOR 2018
driven by the active participation of the private
sector, including higher FDI inflows, which would
facilitate the transfer of technological knowledge
as well as improved access to global markets.
The growth outlook of the country would also
benefit from complementary policies that would
exploit its geographical location in terms of port
and airport related activities. Major development
initiatives such as the Colombo International
Financial City, the Western Region Megapolis
Development project and the establishment of
Special Economic Zones are some of the activities
that would help realise the expected economic
expansion in the future. With these expected
developments, economic growth is projected to
gradually improve to 7.0 per cent by 2020.
y Sri Lanka’s external sector is expected to
improve gradually in the medium term, despite
the likely widening of the current account
deficit in 2017. Slower than expected adjustment
in the trade account, mainly due to the increased
fuel and food import requirements caused by
adverse weather conditions, and the slowdown
in workers’ remittances are anticipated to weigh
down on previously projected improvement in the
external current account in 2017. However, the
current account is projected to improve thereafter
with the support of the anticipated improvement
in trade in goods and services. With improved
global trade including growth in Sri Lanka's major
export markets; the US and EU, the reinstatement
of the EU GSP+ facility, enhanced trade relations
expected through bilateral trade agreements,
strong institutional support and consistent
policies that will result in increased domestic and
foreign investments in export oriented industries,
exports are projected to record an expansion
in the medium term. In line with the expected
economic growth, imports of investment and
intermediate goods are also projected to increase
over the period ahead, thereby leading to
increased expenditure on imports. However, the
growth in expenditure on imports are expected
be lower than the growth in export earnings, thus
contributing to a gradual rebalance in the trade
account. The services account is expected to
continue its momentum, with a positive growth
in tourism, transportation, and information
technology – business process outsourcing (IT-
BPO) sectors. However, workers’ remittances are
expected to remain broadly at the current levels
in the medium term, due to domestic and external
factors. The financial account is expected to
strengthen with higher direct investment inflows
as well as debt inflows to the government and the
private sector. The continuation of the IMF-EFF
programme is also expected to play a vital role
in supporting the government’s reform agenda
and improving investor confidence, leading to
increased foreign investment in the country.
Within an environment of rising global interest
rates, and in consideration of the government’s
debt servicing obligations falling due in the period
ahead, a cautious approach towards external
financing is necessary. In this regard, the pre-
emptive measures to be taken by the government,
particularly in terms of liability management, are
an essential step towards mitigating risks faced
by the external sector in the medium term, along
with attracting non-debt creating foreign inflows.
y Several decisive measures have been
introduced by the government to enhance
revenue while rationalising expenditure in
the process of fiscal consolidation, which
is aimed at improving the fiscal sector over
the medium term. Accordingly, the new Inland
Revenue Act, along with ongoing digitalisation
efforts, are expected to simplify and rationalise the
existing income tax structure, broaden the direct
tax collection by removing exemptions, strengthen
administration and introduce international best
practices to the Sri Lankan tax system. Further,
submission of Quarterly Expenditure and
Income Outcome Reports to the Parliament
would strengthen Parliamentary control over
public finances. In addition, the government has
taken several initiatives to implement structural
reforms, with a view to improving the financial
strength of SOBEs, thereby ensuring their long
term viability. With these developments, tax
revenue is expected to increase to around 16
per cent of GDP by 2020, while maintaining

11
13
OVERVIEW
public investment at 5-6 per cent of GDP in the
medium term. Consequently, the budget deficit is
expected to be reduced to 3.5 per cent of GDP
with a surplus in the primary balance and the
current account balance. Government debt is
also expected to decline to a sustainable level in
the medium term.
y The Central Bank will conduct monetary
policy within the current enhanced monetary
policy framework, with a view to transiting
towards Flexible Inflation Targeting (FIT)
in the medium term. The key stages of this
transition include introducing necessary legal
reforms, building institutional and technical
capacity, strengthening Central Bank credibility
and autonomy, enhancing monetary-fiscal policy
coordination, including through strengthening
of the Fiscal Management (Responsibility)
Act, allowing greater flexibility in the exchange
rate, improving monetary policy operations and
enriching public and stakeholder awareness.
Having met several prerequisites to adopt FIT,
the Central Bank intends to announce a Road
Map for the smooth transition towards the FIT
framework in the medium term, with the support
of the government. Despite the recent increase
in inflation due to supply disruptions and tax
adjustments, inflation is expected to remain
at mid-single digit levels in the medium-term,
provided that fiscal consolidation continues as
envisaged. However, considering the large share
of food items and imported components in the
consumption basket, domestic supply disruptions
and volatile international commodity prices pose
a threat to maintaining inflation at desired levels,
unless addressed by the government through
appropriate proactive measures. With regard to
monetary aggregates, it is expected that monetary
expansion will normalise from the current high
levels from 2018 onwards, with sufficient credit
flows to facilitate private sector led economic
growth.
y Developments in monetary, external and fiscal
sectors of the Sri Lankan economy during the
first three quarters of the year suggest that
macroeconomic stability is being gradually
restored, and increased attention is required to
boost economic growth to reach its potential
over the medium term. In addition to the conduct
of monetary policy to maintain inflation around
the targeted path of 4-6 per cent with due regard
to real sector stability, the Central Bank will also
maintain a competitive exchange rate driven by
market fundamentals with minimal intervention.
With the exchange rate acting as an automatic
stabiliser, and with the realisation of expected
non-debt creating foreign inflows, the external
sector is expected to strengthen further with
improved resilience. The structural reforms to be
implemented towards improving the government’s
revenue mobilisation, tax administration and
compliance, expenditure rationalisation, and the
active management of fiscal liabilities in a forward
looking framework as well as ensuring the viability
of SOBEs are essential for improved fiscal
discipline. In the meantime, the implementation
of growth enhancing reforms identified in various
country diagnostic studies must be expedited
to harness the benefits of improving global
economic conditions and increasing access to
global markets. In this regard, the implementation
of the policies aimed at improving the country’s
efficiency and competitiveness with a medium to
long term view, is essential for Sri Lanka to move
forward to become an enriched nation.

1
14
CENTRAL BANK OF SRI LANKA | RECENT ECONOMIC DEVELOPMENTS: HIGHLIGHTS OF 2017 AND PROSPECTS FOR 2018

NATIONAL OUTPUT AND EXPENDITURE
2T he Sri Lankan economy grew by 3.9 per cent during the first half of 2017 compared to
the growth of 3.7 per cent recorded during the same period of 2016. Industry related activities benefitted from the growth momentum in the construction activities, while
Services activities grew at a moderate pace supported by financial services and wholesale and retail trade activities. However, severe drought conditions that prevailed during the first half of the year adversely impacted the economic performance, downsizing value added growth in Agriculture activities with some spillover impact particularly on manufacturing activities. On the external front, growth remained tepid in some major export destinations, dampening the external demand. Going forward, an improvement in economic activities is expected during the rest of the year, as reflected by early indicators and business sentiment surveys conducted by the Central Bank, driven by industry activities, especially construction activities. Services activities would also push up overall growth, supported by trade related and financial services activities. Meanwhile, the realisation of expected benefits from GSP+ and other trade pacts would boost the performance of manufacturing as well as external trade activities. The downside risks to this positive outlook include the continuation of adverse weather conditions and possible delays in the implementation of envisaged structural reforms.

2
16
CENTRAL BANK OF SRI LANKA | RECENT ECONOMIC DEVELOPMENTS: HIGHLIGHTS OF 2017 AND PROSPECTS FOR 2018
rice, vegetables, coconut and other cereals owing to adverse weather conditions in areas where the majority of the Yala harvest is concentrated.
y There are downside risks to the expected growth prospects for 2017 arising from both internal and external developments. The continuation of the prolonged drought, resulting in low water availability in irrigation tanks, has restricted the extent of cultivation of major crops during the Yala season in 2017. Further, there would be some negative impact on Maha 2017/18 if the expected monsoons do not materialize. The adverse weather impact on agricultural activities would spillover to other activities, particularly to food processing related manufacturing activities. Further, any increase in commodity prices, including oil prices, would impact activities such as electricity generation, transportation as well as manufacturing, which particularly depend on imported intermediate goods. Meanwhile, the government’s commitments on fiscal consolidation measures would moderate both government consumption and investment expenditure during the year, which in turn would impact aggregate demand. Moreover, any downturn in global demand would cause further delay in accruing benefits of opened up market access from the external front. The uncertainty of the US trade and fiscal policies and expected monetary policy normalisation, ongoing rebalancing in China and continued geopolitical tensions in the Middle East would weigh on external demand.
Developments in 2017
Output
y The Gross Domestic Product (GDP) grew by 3.9 per cent in the first half of 2017 compared to 3.7 per cent growth recorded in the corresponding period of 2016. This growth was mainly driven by Industry activities, supported by the expansion in Services activities amidst the contraction recorded in the Agriculture activities. Accordingly, Industry activities grew by 5.8 per cent in value added terms during the first half of 2017 mainly backed by the significant increase in construction activities together with the expansion in mining and quarrying activities. Value added of Services related activities grew by 4.0 per cent in the first half of the year. This growth was largely attributable to the expansion in financial services, wholesale and retail trade activities, transportation, health and other personal services activities. However, the value added of Agriculture activities contracted by 3.1 per cent during the first half of 2017 primarily due to the contraction recorded in growing of rice, oleaginous fruits (coconut, king coconut, oil palm), vegetables and other cereals. In the meantime, taxes less subsidies on products increased by 3.0 per cent in the first half of 2017.
y The economy is projected to grow around 4.5 per cent in 2017 compared to the growth of 4.4 per cent recorded in 2016. This annual growth is expected to be fuelled by the expansion in Industry and Services activities while the contribution from Agriculture activities would be subdued largely due to the continuing adverse weather conditions. The significant growth momentum in construction activities is expected to continue during the latter part of the year contributing to Industry activities. Expansion in financial services activities and wholesale and retail trade activities are expected to be the key drivers of growth in Services activities. Meanwhile, agriculture activities are anticipated to contract mainly on account of the decline in major agricultural activities including growing of
Chart 2.1Quarterly GDP Growth Rates (a)
(a) The data is based on the base year 2010 GDP estimates of the Department of Census and Statistics.
Per c
ent
2013
-Q1
2013
-Q2
2013
-Q3
2013
-Q4
2014
-Q1
2014
-Q2
2014
-Q3
2014
-Q4
2015
-Q1
2015
-Q2
2015
-Q3
2015
-Q4
2016
-Q1
2016
-Q2
2016
-Q3
2016
-Q4
2017
-Q1
2017
-Q2
0
2
4
6
8
10
12

2
17
NatioNal output aNd ExpENditurE
Growth in Economic Activities
Agriculture, Forestry and Fishing
y As per the GDP estimates, the value added of Agriculture, Forestry and Fishing activities contracted by 3.1 per cent during the first half of 2017 compared to the contraction of 3.0 per cent recorded in the corresponding period of 2016. The contraction recorded in growing of rice, oleaginous fruits (coconut, king coconut, oil palm), vegetables, other cereals, rubber and sugar cane, tobacco and other non-perennial crops dampened the growth in the Agriculture activities. However, fishing activities, animal production, forestry and logging, growing of fruits, spices, tea, other perennial crops, and plant propagation and support activities to agriculture contributed positively to the Agriculture growth.
Production Trends and Institutional Support: Agriculture
Agriculture Production Index
y The output of the Agriculture and Fisheries sector, as measured by the Agriculture Production Index (API), recorded a sharp decline of 11.5 per cent during the first half of 2017 in comparison to the decline of 3.4 per cent during the corresponding period of 2016. All sub-indices with the exception of tea, fish and livestock contracted during the first half of 2017. The decrease in the paddy sub-index by 51.1 per cent was mainly due to the persistent adverse weather conditions coupled with the decline in the extent harvested. Meanwhile, the tea sub-index increased marginally by 0.8 per cent in line with the expansion in production. Rubber, coconut and other crops, however, posted a negative performance in comparison to the previous year, while the livestock subsector recorded a growth of 11.3 per cent, reflecting a positive performance in all its sub categories. Similarly fisheries activities expanded with a considerable increase in marine fish production.
Paddy
y According to available information, paddy production is estimated to drop significantly by around 46 per cent in 2017 compared to the previous year. Adverse weather conditions that prevailed during the 2016/17 Maha season and the 2017 Yala season are expected to cause a low production of 2.4 million metric tons during the year, which would be the lowest level of annual paddy production over the last decade. Paddy production during the 2016/17 Maha season was significantly impacted by dry weather conditions experienced in major paddy producing areas. This is expected to have resulted in a decline in the 2016/17 Maha paddy production by 51.1 per cent to 1.42 million metric tons according to the Department of Census and Statistics (DCS). Meanwhile, the estimated gross extent sown was 531,440 hectares, which is a 29.7 per cent reduction when compared with the previous Maha season. The drought conditions also had an impact on the island-wide extent of paddy harvested during the 2016/17 Maha season, resulting in a considerable decline of 44.4 per cent to 371,339 hectares, compared with the 2015/16 Maha season. Meanwhile, according to the DCS, paddy production during the 2017 Yala season, which is mainly irrigated by stored water is
2016First Half
(a)
2017First Half
(b)
Growth Rate (%)
Item2015/16
(a) 2016/17
(b)
Agriculture and Fishing 133.6 118.1 -3.4 -11.5
1 Agriculture 131.5 111.0 -2.6 -15.5 1.1 Agriculture Crops 128.6 103.3 -2.6 -19.7 Paddy 155.2 75.9 0.9 -51.1 Tea 99.0 99.8 -10.6 0.8 Rubber 71.4 67.2 - 4.9 -5.9 Coconut 104.8 91.0 -1.1 -13.2 Other Crops 154.0 143.4 -1.2 -6.9 Vegetables 157.9 154.2 - 4.1 -2.3 Fruits 145.8 149.2 - 4.6 2.3 Other Field Crops 167.8 146.6 -3.5 -12.6 1.2 Livestock 153.2 170.5 -3.3 11.3
2 Fisheries 143.4 151.6 -6.6 5.7
Table 2.1Agriculture Production Index (2007-2010=100)
(a) Revised(b) Provisional
Source: Central Bank of Sri Lanka

2
18
CENTRAL BANK OF SRI LANKA | RECENT ECONOMIC DEVELOPMENTS: HIGHLIGHTS OF 2017 AND PROSPECTS FOR 2018
estimated to have declined by 32.2 per cent in comparison to the previous Yala season, resulting in a production of 1.02 million metric tons. Lower output during the Yala season is mainly due to the effect of the widespread drought and the periodic floods in the wet zone. The estimated gross extent sown for the 2017 Yala season at 269,596 hectares, is a decline of 30.0 per cent from the previous Yala season. Meanwhile, the harvested extent is also estimated to have declined by 33.1 per cent to 229,929 hectares in comparison to the previous Yala season.
y Out of the stock of available paddy, about 1.5 million metric tons of rice is expected to be milled, resulting in a shortage of around 800,000 metric tons of rice for 2017. Low harvests and diminishing reserves drove up local prices, necessitating the government to take proactive measures to encourage rice imports. Accordingly, 337,769 metric tons have been imported at a total cost of US dollars 131.8 million during the first six months of this year, compared to 15,231 metric tons of rice imports during the first half of 2016. Meanwhile, the approval of the Cabinet of Ministers was granted to release stocks of paddy available with the Paddy Marketing Board (PMB) in a timely manner in order to dampen price pressures in the market. Accordingly, the Lanka Sathosa network sold rice milled from paddy purchased from the PMB.
y Although open market paddy prices were on a declining path in the first quarter with 2016/17 Maha season stocks entering the market, prices increased thereafter due to diminishing supplies. The average price of Samba paddy was Rs. 48.10 per kilogramme in the first half of 2017, which is an increase of 26.6 per cent in comparison with the first half of 2016. Meanwhile, the average price of Nadu paddy also increased by 51.1 per cent to Rs. 48.33 per kilogramme during the first six months of 2017 compared to the first half of 2016. The shortage in the paddy supply caused an increase in retail rice prices, which prompted the government to take various measures to stabilise rice prices. These measures included the introduction of a maximum retail price for rice, which was subsequently removed on 16 August 2017, while augmenting the supply with imported rice and the reduction of taxes imposed on imported rice varieties. The average retail price of Samba was Rs. 95.21 per kilogramme during the first half of 2017, recording a marginal increase of 1.8 per cent compared to the same period of 2016. The average retail price of Nadu was Rs. 87.03 per kilogramme, which was an increase of 11.9 per cent compared to the same period of the previous year.
Tea
y Tea production increased marginally during the first half of the year, mainly supported by the increased production from low elevations. Tea production during the first six months of 2017 at 155.5 million kilogrammes recorded a marginal increase of 0.8 per cent over the corresponding period in 2016. Low grown tea, which accounts for 62.0 per cent of the total tea production, increased by 2.6 per cent to 95.9 million kilogrammes during the first six months of 2017, while high grown and medium grown tea production dropped by 2.4 per cent and 1.1 per cent to 35.5 million kilogrammes and 24.1 million kilogrammes, respectively. The tea smallholder sector increased its contribution to the total tea
Chart 2.2Paddy Production
Source : Department of Census and Statistics
Maha Yala Expected 2017 Yala
6,000
5,000
4,000
3,000
2,000
1,000
0 2012 2013 2014 2015 2016 2017
mt '0
00
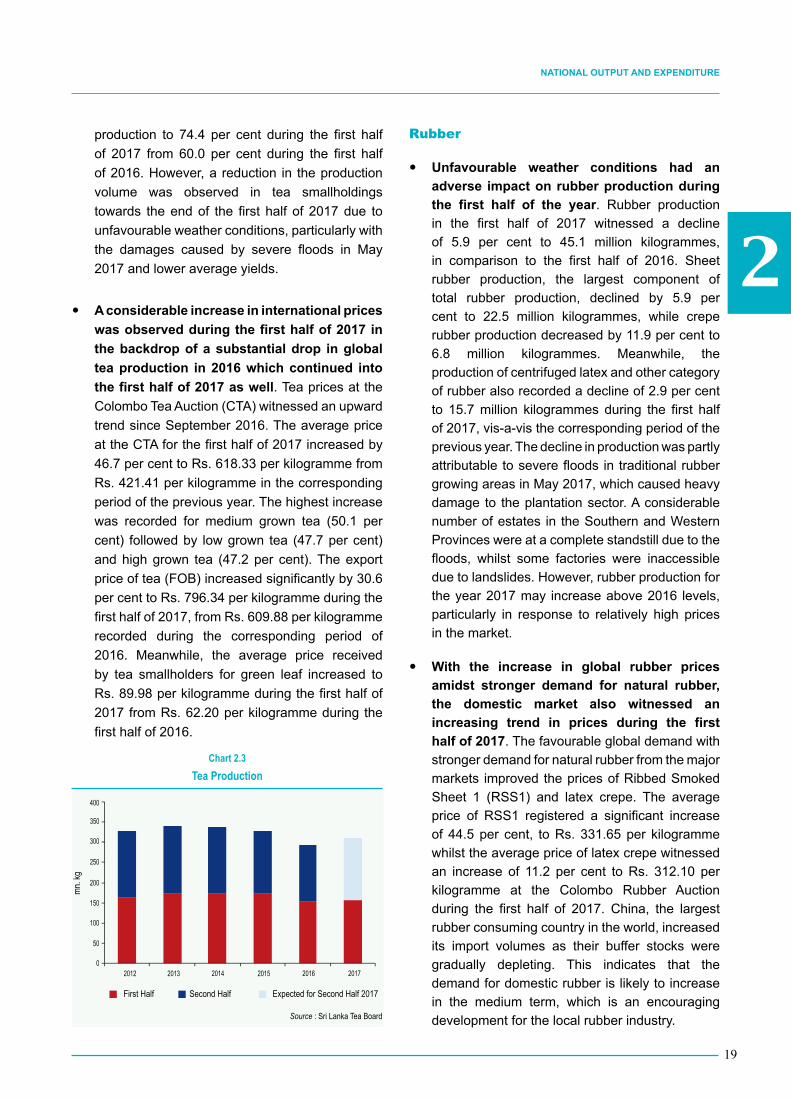
2
19
NatioNal output aNd ExpENditurE
production to 74.4 per cent during the first half of 2017 from 60.0 per cent during the first half of 2016. However, a reduction in the production volume was observed in tea smallholdings towards the end of the first half of 2017 due to unfavourable weather conditions, particularly with the damages caused by severe floods in May 2017 and lower average yields.
y A considerable increase in international prices was observed during the first half of 2017 in the backdrop of a substantial drop in global tea production in 2016 which continued into the first half of 2017 as well. Tea prices at the Colombo Tea Auction (CTA) witnessed an upward trend since September 2016. The average price at the CTA for the first half of 2017 increased by 46.7 per cent to Rs. 618.33 per kilogramme from Rs. 421.41 per kilogramme in the corresponding period of the previous year. The highest increase was recorded for medium grown tea (50.1 per cent) followed by low grown tea (47.7 per cent) and high grown tea (47.2 per cent). The export price of tea (FOB) increased significantly by 30.6 per cent to Rs. 796.34 per kilogramme during the first half of 2017, from Rs. 609.88 per kilogramme recorded during the corresponding period of 2016. Meanwhile, the average price received by tea smallholders for green leaf increased to Rs. 89.98 per kilogramme during the first half of 2017 from Rs. 62.20 per kilogramme during the first half of 2016.
Rubber
y Unfavourable weather conditions had an adverse impact on rubber production during the first half of the year. Rubber production in the first half of 2017 witnessed a decline of 5.9 per cent to 45.1 million kilogrammes, in comparison to the first half of 2016. Sheet rubber production, the largest component of total rubber production, declined by 5.9 per cent to 22.5 million kilogrammes, while crepe rubber production decreased by 11.9 per cent to 6.8 million kilogrammes. Meanwhile, the production of centrifuged latex and other category of rubber also recorded a decline of 2.9 per cent to 15.7 million kilogrammes during the first half of 2017, vis-a-vis the corresponding period of the previous year. The decline in production was partly attributable to severe floods in traditional rubber growing areas in May 2017, which caused heavy damage to the plantation sector. A considerable number of estates in the Southern and Western Provinces were at a complete standstill due to the floods, whilst some factories were inaccessible due to landslides. However, rubber production for the year 2017 may increase above 2016 levels, particularly in response to relatively high prices in the market.
y With the increase in global rubber prices amidst stronger demand for natural rubber, the domestic market also witnessed an increasing trend in prices during the first half of 2017. The favourable global demand with stronger demand for natural rubber from the major markets improved the prices of Ribbed Smoked Sheet 1 (RSS1) and latex crepe. The average price of RSS1 registered a significant increase of 44.5 per cent, to Rs. 331.65 per kilogramme whilst the average price of latex crepe witnessed an increase of 11.2 per cent to Rs. 312.10 per kilogramme at the Colombo Rubber Auction during the first half of 2017. China, the largest rubber consuming country in the world, increased its import volumes as their buffer stocks were gradually depleting. This indicates that the demand for domestic rubber is likely to increase in the medium term, which is an encouraging development for the local rubber industry.Source : Sri Lanka Tea Board
Chart 2.3Tea Production
400
350
300
250
200
150
100
50
2012 2013 2014 2015 2016 2017 0
mn. k
g
First Half Second Half Expected for Second Half 2017

2
20
CENTRAL BANK OF SRI LANKA | RECENT ECONOMIC DEVELOPMENTS: HIGHLIGHTS OF 2017 AND PROSPECTS FOR 2018
Coconut
y The decline in coconut production witnessed in the previous year was observed in the first half of 2017 as well. The output fell to 1,289.0 million nuts in the first half of 2017 from 1,483.8 million nuts in the corresponding period of 2016. The drop in production was mainly due to the lagged effect of the drought that prevailed during 2016. Meanwhile, dry conditions experienced in certain parts of the coconut triangle were conducive to the proliferation of mite infestation, which also had a negative impact on the output. The production and export of all three major kernel products declined considerably in the first half of 2017, mainly due to the depressed nut output during the period. Desiccated coconut (DC) production, declined by 32.5 per cent to 16,444 metric tons, from 24,361 metric tons in the first half of 2016. Coconut oil production, which reported a considerable decline in 2016, suffered a further setback during the first half of 2017 due to the low crop, which resulted in high fresh nut prices. Accordingly, coconut oil output declined by 61.2 per cent to 9,689 metric tons. Meanwhile, copra exports and fresh nut exports also declined by 52.9 per cent and 20.9 per cent, respectively, during the period. However, in contrast, coconut cream, milk powder and milk production, which together consume around 2 per cent of the total nut production, recorded a 1.2 per cent improvement compared to the previous year, reflecting a notable change in the traditional export structure of coconut products as well as in domestic lifestyles.
y With the decline in production, the average price of coconut and major coconut based commodities in the local market remained at elevated levels during the first half of 2017. In line with the shortfall in nut production, the average wholesale price of a nut increased by 71.7 per cent to Rs. 55.80 and the corresponding retail price increased by 32.8 per cent to Rs. 61.71 per nut. Compared to the first half of 2016, the local market price of a kilogramme of DC and a bottle of 750 millilitres of coconut
oil rose by 55.7 per cent and 44.4 per cent, respectively. Meanwhile, the average export price (FOB) of DC increased by 31.6 per cent to Rs. 318.18 per kilogramme. However, Sri Lanka could not benefit from high international prices due to inadequate stocks of nuts. Furthermore, the average FOB price of coconut oil and copra also reported significant increases of 8.2 per cent and 34.8 per cent, respectively, in rupee terms. In the wake of increasing coconut oil prices in the domestic market, the government reduced the Special Commodity Levy on the import of edible oils by Rs. 20.00 per kilogramme with effect from 23 February 2017. This led to a large volume of palm oil imports, which increased by 23.7 per cent to 91,497 metric tons during the first half of 2017. In the meantime, the government allowed a consignment of coconut imports for experimental purposes. Attractive farm gate prices received during the period coupled with the assistance extended to revive the coconut sector, are expected to encourage growers to increase fertiliser application and improve management practices to achieve higher yields, which is expected to impact future coconut production favourably.
Other Field Crops
y Almost all the other field crops (OFCs) showed a decline in production during the 2016/17 Maha season due to the impact of unfavourable weather conditions that prevailed at the commencement of the agricultural seasons. Accordingly, production of OFCs at 317,647 metric tons registered a decline of 20.9 per cent during the 2016/17 Maha season compared to the previous Maha season, while the extent cultivated declined by 25.0 per cent to 87,004 hectares. However, production of sorghum, soya bean and meneri recorded an increase during the 2016/17 Maha season vis-a-vis the previous Maha season. Meanwhile, weather related disturbances delayed OFC cultivation during the 2017 Yala season as well and the cultivated extent was also considerably lower than the 2016 Yala season.

2
21
NatioNal output aNd ExpENditurE
Vegetables
y According to estimates of the DCS, vegetable production during the first half of 2017 increased by about 3 per cent to 950,467 metric tons, compared with the first half of 2016. However, up-country vegetable production was affected by adverse weather conditions and, as a result, recorded a decline in the 2016/17 Maha season. In contrast, the production of low-country vegetables such as luffa, ladies’ fingers, bitter gourd, red pumpkin, long bean, winged bean and vatana increased considerably. With the delay in the onset of the North-Eastern monsoons, the commencement of the Maha season cultivation, particularly in the up-country areas, was also delayed. Meanwhile, both up-country and low-country vegetable prices remained high during the reference period, except during January where supplies increased with the peak Maha harvesting season reaching the market. Further, heavy rainfall resulted in floods and landslides and hampered the supply of vegetables, contributing to a sharp increase in prices during June. Prices continued to remain high thereafter with the approach of the off-season. In addition to the general consumption demand for vegetables, there was an increased demand from the export markets as well. Vegetable exports in the first half of 2017 increased by 2.4 per cent to 10,887 metric tons from the corresponding period of the previous year.
Sugar
y Sugar production declined to 14,654 metric tons during the first half of 2017, which was a decline of 36.8 per cent over the corresponding period of 2016. The lower production is a combined outcome of the decrease in the volume of sugarcane crushed at all factories and the decline in the Sugar Recovery Rate.1 Sugar production at Sevanagala factory decreased by 39.7 per cent, while the output at Pelwatte and Gal Oya factories decreased by 39.1 per cent and 29.0 per cent, respectively.
1 Sugar Recovery Rate = Sugar Produced
Quantity of Cane Crushed x 100
Low rainfall that occurred intermittently with erratic weather patterns created unexpected dry conditions in Sevanagala, Pelwatte, Siyabalanduwa and Hingurana during the first half of 2017. Adverse weather conditions increased the severity of moisture stress while retarding crop growth, which lowered the sugar recovery rate. The total cane input crushed at the three factories decreased by 29.6 per cent to 217,264 metric tons. The overall sugar recovery rate declined from 7.7 per cent in the first half of 2016 to 6.7 per cent in the first half of 2017, mainly due to the lower recovery rate at Pelwatte and Sevanagala factories. Sugar imports also decreased by 8.9 per cent to 265,384 metric tons during the first half of 2017 compared to the corresponding period in 2016. It is expected that the total sugar production would increase by 13.5 per cent to 61,000 metric tons in 2017, which would be adequate to meet around 9 per cent of the national requirement. Meanwhile, the Board of Investment of Sri Lanka entered into an investment agreement with a new investor to revive and restructure the Kantale sugar factory. The restructured Kantale sugar factory is expected to process 4,000 metric tons of sugarcane per day, resulting in producing 72,000 metric tons of sugar per year, while also generating electricity by burning sugarcane fibre and produce dairy products.
Fisheries
y During the first half of 2017, total fish production increased by 5.7 per cent to 252,940 metric tons. Production in the marine sector, which accounts for 90 per cent (227,890 metric tons) of total fish production, increased by 4.8 per cent. The growth recorded in the marine sector is partly due to the lifting of the European Union (EU) ban for Sri Lankan fish exports in June 2016. Furthermore, policy measures which were implemented towards the removal of the fish ban will ensure the sector’s sustainability in the long run by limiting overexploitation of marine resources. However, the growth in the marine sector was affected by the loss of fishing days due to adverse weather conditions experienced in the Western and Southern coastal areas during

2
22
CENTRAL BANK OF SRI LANKA | RECENT ECONOMIC DEVELOPMENTS: HIGHLIGHTS OF 2017 AND PROSPECTS FOR 2018
May 2017. Meanwhile, inland and aquaculture fish production increased by 15.0 per cent to 25,050 metric tons in the first half of 2017. The increase in inland and aquaculture fish production could be mainly attributed to the improved management of the water bodies with community participation, establishing community based mini-hatcheries and free issue of fingerlings.
Livestock
y The livestock sector recorded a favourable performance during the first half of 2017. According to estimates of the Department of Animal Production and Health (DAPH), milk production increased by 13.5 per cent, to 222.3 million litres during the first half of 2017, from the corresponding period in 2016. Cattle milk production, which accounted for around 83 per cent of total milk production, increased by 13.6 per cent to 185.5 million litres, whilst buffalo milk production increased by 13.1 per cent to 36.8 million litres. Meanwhile, according to DAPH projections, overall milk production would increase by 8.0 per cent to 490 million litres in 2017, which would be sufficient to meet around 63 per cent of the total domestic demand. Meanwhile, egg production registered an increase of 9.4 per cent to 1,233.5 million in the first half of 2017, prompted by increased imports of layer parents in 2016, resulting in a higher pullet and egg production in the country. However, layer parent imports reduced from 66,597 in the first half of 2016 to 53,146 during the corresponding period of 2017. In the meantime, poultry meat production at 93,000 metric tons recorded an increase of 15.1 per cent during the first half of 2017. Production of pork increased by 11.3 per cent, while beef production witnessed a decline of 4.4 per cent during the first half of 2017. The average cost of poultry meat production experienced a decline during this period, mainly due to the reduction in prices of day-old chicks. The broiler parent imports were affected by the spread of highly pathogenic avian influenza in bird exporting countries, resulting in a 42.7 per cent decline in imports. However, the local production of broiler parents increased by 7.0 per cent in the first half of 2017 compared to the same period of 2016.
Industries
y As per GDP estimates, Industry activities expanded by 5.8 per cent in value added terms during the first half of 2017, at the same pace of growth recorded in the corresponding period of 2016. This growth was largely attributable to the continued expansion in construction activities supported by thriving mining and quarrying activities during this period. Meanwhile, manufacturing activities also contributed positively, yet at a slower pace compared to the first half of 2016. In the meantime, sewerage, waste treatment and disposal activities, and water collection, treatment and supply activities grew substantially during the first half of the year. However, electricity, gas, steam and air conditioning supply activities grew marginally during the first half of 2017.
y The expansion in Industry activities was supported by the considerable increase in construction activities, which grew by 12.8 per cent in value added terms during the first half of 2017 in comparison to 13.5 per cent growth recorded in the corresponding period of 2016. This upsurge in construction activities also provided stimulus for the substantial growth in mining and quarrying activities, which grew by 18.1 per cent in value added terms during the first half of 2017 in comparison to a growth of 4.9 per cent recorded in the same period of 2016. Meanwhile, the value added of manufacturing activities, which is the largest segment of industrial activities, recorded a modest growth of 0.9 per cent during this period compared to a 2.2 per cent growth in the first half of 2016. The slower growth in manufacturing activities was mainly attributed to the setback recorded in the manufacture of food, beverages and tobacco products, and manufacture of coke and refined petroleum products, which contracted by 1.1 per cent and 15.2 per cent, respectively, during the first half of 2017 compared to the corresponding period of 2016. However, positive contributions particularly from the manufacture of other non-metallic mineral products, textiles, wearing apparel and leather related products, furniture, machinery and equipment, and rubber and plastic

2
23
NatioNal output aNd ExpENditurE
products were large enough to offset negativity in key activities to record a positive growth in manufacturing activities. Accordingly, the manufacture of furniture expanded while other non-metallic mineral products and manufacture of textile, wearing apparel and leather related products recovered during the first half of 2017 compared to the same period in 2016. Considering other Industrial activities, sewerage, waste treatment and disposal activities grew by 10.7 per cent in value added terms during the first half of 2017 compared to the growth of 21.0 per cent in the corresponding period of 2016. Meanwhile, the value added of water collection, treatment and supply activities expanded significantly by 13.3 per cent during the period compared to the growth of 3.8 per cent recorded in the first half of 2016. Further, the value added of electricity, gas, steam and air conditioning supply activities recorded relatively slow growth of 1.2 per cent in the first half of 2017 in comparison to the growth of 8.9 per cent recorded during the same period of 2016.
Production Trends and Institutional Support: Manufacturing Activities
Factory Industry Production Index2
y The Factory Industry Production Index (FIPI) registered a decline of 1.8 per cent during the first half of 2017 compared to decline of 2.3 per cent in the same period of 2016. Production disturbances that occurred due to adverse weather conditions coupled with stagnant levels of productivity and competitiveness, lack of product and market diversification, labour shortages and the competition from cheap imports in some industries contributed to this decline. Meanwhile, the increased cost of credit and the overvalued exchange rate may also have discouraged new investments to some extent. Consequently, the sub-indices of the FIPI relating to apparel, beverages, tobacco products, leather and related products, refined petroleum products
2 The weights in this index have been assigned using 2010 as the base year. Industries have been categorised according to the International Standard Industrial Classification (ISIC) Revision 4. The Department of Census and Statistics compiles the Index of Industrial Production (IIP) with 2015 as the base year and has commenced using the IIP for National Accounts compilation as well. Accordingly, the IIP will be used as the basis for analysis from the next issue of the Recent Economic Developments publication.
and basic metals declined during the first half of 2017 compared to the corresponding period in 2016. However, production of food, chemicals and chemical products, rubber and plastic products, other non-metallic mineral products, fabricated metal products, wood products except furniture and electrical equipment recorded a modest increase in output.
y The food products subsector, which is the largest subsector in the FIPI, recorded a modest increase of 2.6 per cent during the first half of 2017 compared to the first half of 2016. This subsector was severely affected by floods that occurred during May 2017 as well as the resultant reduction in supplies, disruption to production, supply and distribution networks and low employee attendance. Nevertheless, prepared meals, margarine, cocoa, chocolate and confectionery, starch products, bakery products, dairy products and animal feed recorded an increase during the first half of 2017 compared to the first half of 2016. Factory processing of tea recorded a marginal decline as a result of adverse weather.
y The wearing apparel subsector, which is the second largest subsector in the FIPI, experienced a setback during the first half of 2017, reporting a reduction of 5.4 per cent in the sub-index compared to the first half of 2016. Lower demand for selected categories of apparel exports from traditional export destinations such as the USA and the EU was
Chart 2.4Factory Industry Production Index (FIPI)
140
130
120
110
100
90
Index
Valu
e (20
10=1
00)
Jan
Feb
Mar
Apr
May
Jun Jul
Aug
Sep
Oct
Nov
Dec
2016 2017
Source : Central Bank of Sri Lanka

2
24
CENTRAL BANK OF SRI LANKA | RECENT ECONOMIC DEVELOPMENTS: HIGHLIGHTS OF 2017 AND PROSPECTS FOR 2018
the key reason for the poor performance of this subsector. However, the apparel subsector is expected to rebound during the second half of the year, supported by an increase in export volumes with the reinstatement of the GSP+ and the competitive strategies pursued by the industry to compete in high-end apparel segments.
y The rubber and plastic products subsector grew by 4.9 per cent during the first half of 2017, compared to the first half of 2016. Increased production of air tyres and solid tyres to cater to international markets in the USA, Germany and Brazil as well as the local market contributed to this growth. Export demand for industrial and surgical gloves too expanded considerably.
y The output of the tobacco products subsector declined by 29.3 per cent during the first half of 2017 compared to the first half of 2016. This was primarily due to lower consumer demand arising from higher cigarette prices caused by the increase in excise duties during the latter part of 2015 and further price increases during 2016.
y The beverages subsector contracted by 14.7 per cent during the first half of 2017 compared to the first half of 2016. A reduction in production volumes of alcohol, malted drinks and soft drinks contributed to the decline in the
output of this subsector. Alcohol production was adversely affected by the increase in import duties for alcohol imports for blending purposes and the imposition of the VAT. However, the mineral and bottled water subsector recorded a substantial growth owing to increased distribution of bottled water to areas affected by adverse weather conditions.
y The non-metallic mineral products subsector grew by 4.7 per cent during the first half of 2017. Increased manufacturing of cement was the key contributory factor towards this improved performance. The production of roofing tiles and ready-mix concrete declined significantly due to new regulations on sand excavation as well as lower mining and excavation activities in the flood-affected areas. Manufacturing of porcelain and ceramic products declined during the reference period. High costs of production in Sri Lanka compared to its Asian competitors adversely affected the competitiveness of Sri Lankan products in the local and foreign porcelain and ceramic market. Manufacturing of glass products picked up due to the increase in production capacity.
y The chemicals and chemical products subsector grew by a significant 24.2 per cent during the first half of 2017 largely due to the increased output in paints, varnishes, printing ink, and soap and detergent products. In the meantime, the production of fertiliser for some plant categories gained momentum under the new fertiliser subsidy scheme. However, the slowdown in agricultural activities as a result of drought conditions suppressed the demand for some fertiliser products. Meanwhile, the fabricated metal products, except machinery and equipment subsector, which consists mainly of ship building and repair activities, experienced an increase in production with a growth of 33.4 per cent during the first half of 2017.
y The electrical equipment subsector expanded by about 12.4 per cent during the first half of 2017 compared to the corresponding period of 2016. The manufacturing of wires, cables and optical isolators recorded an increase while the
Source : Central Bank of Sri Lanka
Other Non-metallic Mineral Products
8%
Chemical and Chemical Products
6%
Rubber and Plastic Products
13%
Fabricated Metal Products
3%
Refined Petroleum Products
1%Other 7%
Beverages 6%
Wearing Apparel 31%
Chart 2.5Composition of Factory Industry Production Index (FIPI)
First Half 2017
Food Products 20%
Tobacco Products 5%

2
25
NatioNal output aNd ExpENditurE
production of transformers declined marginally. Manufacturing of batteries increased during this period, highlighting the need to setup a mechanism for recycling used batteries in Sri Lanka urgently as these contain toxins and hard metals which severely pollute soil and water.
y The output in the refined petroleum products subsector, which solely consists of the production in the refinery of Ceylon Petroleum Corporation (CPC), declined by 16.4 per cent during the first half of 2017 as against the positive performance witnessed during the same period of 2016. The reduced importation of crude oil by the CPC and the increased imports of refined petroleum products, as well as a temporary shutdown of some facilities for repairs contributed to this outcome.
y Production in the textiles subsector increased during the first half of 2017 recording a growth of 3.3 per cent. This increase was mainly driven by the increase in the production of knitted fabric used in the production of wearing apparel for the export market.
y Leather and related products, which showed signs of recovery during 2016, declined by 3.2 per cent during the first half of 2017. The growth in the manufacturing of finished leather as well as the manufacturing of footwear considerably declined. Although global competition is necessary, it is important to address dumping of such products in order to support the sector to provide high-quality products to the local as well as the export market.
y Public sector institutions that support the manufacturing sector continued to implement measures aimed at increasing output and productivity of the sector. The Ministry of Industry and Commerce implemented measures to further develop infrastructure facilities in the existing 32 industrial estates as well as establish an Accredited Food Laboratory to promote the food manufacturing industry. Meanwhile, initial steps were taken for the establishment of the National Business Registry and the Office of
the Trade Prosecutor. The National Enterprise Development Authority established an Incubation Technology Transfer Centre at Makandura with the Wayamba University to facilitate micro and small industries in the area and start-up businesses of graduates until these firms attain self-sustainability. The Ministry of Finance and Mass Media took initial steps towards implementing a National Credit Guarantee Scheme and a Venture Capital Fund to improve equity funding for small and medium enterprises (SMEs). The Industrial Technology Institute and the National Science Foundation implemented various measures to improve technological research and knowledge transfer towards manufacturing institutions and undertook many new product development activities and support activities for industries which utilise local raw materials. The Ministry of Skills Development and Vocational Training took measures to improve technical and vocational training activities and to address the acute labour shortage issue in manufacturing and construction industries. The Sri Lanka Chamber of Small and Medium Enterprises, Ceylon Chamber of Commerce, the National Chamber of Commerce of Sri Lanka and the Federation of Chambers of Commerce and Industry of Sri Lanka facilitated the manufacturing sector by organising seminars on areas such as economic matters, trade, exports, innovation and skills development. In order to promote the export of manufactured products, the Export Development Board (EDB) held a symposium to assist in the development of the National Export Strategy and provided technical support to all concerned stakeholders. The other initiatives of the EDB during the first half of 2017 included the “2000 exporters development programme”, the Ornamental Fish Trade Conference, product development programme for footwear manufacturers, technical training and exposure programme for rubber product manufacturers and the facilitation of inbound and outbound international trade delegations. In order to support apparel manufacturing, the Joint Apparel Association Forum (JAAF) and the Sri Lanka Institute of Apparel and Textiles provided training facilities on 3D printing and multi-task machinery handling for small scale apparel manufacturers.

2
26
CENTRAL BANK OF SRI LANKA | RECENT ECONOMIC DEVELOPMENTS: HIGHLIGHTS OF 2017 AND PROSPECTS FOR 2018
Services
y The value added of Services related economic activities expanded by 4.0 per cent during the first half of 2017 in comparison to the growth of 3.6 per cent recorded in the corresponding period of 2016. This growth was mainly attributable to the continuous expansion in financial services, and wholesale and retail trade activities. Further, transportation, human health, other personal services, real estate activities, education, accommodation related services, insurance related activities and telecommunication services contributed positively to growth. However, public administration, professional services, and programming and broadcasting activities contracted during the first half of the year, dampening the Services growth.
Wholesale and Retail Trade, Transportation and Storage, Accommodation and Food Service Activities
y The wholesale and retail trade, transportation and storage, accommodation and food service activities grew by 3.4 per cent in value added terms during the first half of 2017 compared to the growth of 2.4 per cent recorded in the corresponding period of 2016. All sub activities within this segment contributed positively to this growth. The continuous expansion in wholesale and retail trade activities, which grew by 4.2 per cent in value added terms during the first half of 2017, compared to 1.9 per cent growth recorded in the same period of 2016, largely supported this growth. Further, transportation of goods and passengers including warehousing activities expanded by 2.3 per cent in value added terms during the period, compared to the growth of 2.7 per cent recorded in the corresponding period of 2016. Furthermore, accommodation, food and beverage service activities, and postal and courier activities grew by 3.5 per cent and 6.0 per cent, respectively, in value added terms during the first half of 2017 compared to the expansion of 3.7 per cent and 7.3 per cent, respectively, recorded in the same period of 2016.
Information and Communication Activities
y The value added of information and communication activities grew by 6.3 per cent during the first half of 2017 compared to 10.8 per cent growth recorded in the corresponding period of 2016. This growth was largely attributable to the development in telecommunication services, which grew by 7.9 per cent in value added terms in the first half of 2017 compared to the growth of 12.1 per cent recorded in the corresponding period of 2016. Further, value added of IT programming consultancy and related activities continued to increase by 3.3 per cent during the period under consideration, on top of the 6.9 per cent growth recorded in the same period of 2016, contributing positively to the growth within the segment. However, programming and broadcasting activities and audio video production activities contracted marginally by 0.7 per cent in value added terms during the first half of the year as opposed to the growth of 12.4 per cent recorded in the corresponding period of 2016.
Financial, Insurance and Real Estate Activities, including Ownership of Dwellings
y The financial, insurance and real estate activities including ownership of dwellings expanded by 9.4 per cent in value added terms during the first half of the year, in comparison to a growth of 8.4 per cent recorded in the corresponding period of 2016. This expansion was mainly fuelled by the continuous development in financial service activities and auxiliary financial services, which grew by 15.8 per cent in value added terms during the period, compared to the growth of 14.5 per cent in the corresponding period of 2016. Further, real estate activities, including ownership of dwellings, grew by 2.7 per cent in value added terms during the first half of the year, compared to the growth of 2.5 per cent in the same period of 2016. Moreover, value added of insurance, reinsurance and pension funding activities grew by 6.5 per cent in the first half of 2017 compared to a growth of 8.7 per cent in the corresponding period of 2016.

2
27
NatioNal output aNd ExpENditurE
Professional Services and Other Personal Service Activities
y Professional services and other personal service activities grew by 1.6 per cent in value added terms during the first half of 2017 in comparison to a growth of 0.9 per cent in the corresponding period of 2016. This growth was mainly driven by the improvement in other personal services activities, which grew by 2.0 per cent in value added terms during the period, compared to the growth of 1.8 per cent recorded in the corresponding period of 2016. However, professional services activities contracted by 0.8 per cent during the first half of 2017 compared to the contraction of 3.9 per cent posted in the same period of 2016, thus continuing its declining trend and dampening the overall growth within this segment.
Public Administration, Defence, Education, Human Health and Social Work Activities
y The public administration, defence, education, human health and social work activities grew marginally by 0.8 per cent in value added terms during the first half of 2017 in comparison to the growth of 3.4 per cent recorded in the corresponding period of 2016. This slowdown was largely attributable to the contraction of 4.8 per cent recorded in value added of public administration and defence, compulsory social security activities during the period as opposed to the growth of 5.2 per cent recorded in the corresponding period of 2016. However, the value added of human health, residential care and social work activities significantly grew by 12.4 per cent during the period, recovering from the contraction of 3.1 per cent recorded in the corresponding period of 2016. Further, education services grew by 4.3 per cent in value added terms during the first half of 2017 compared to the growth of 5.1 per cent recorded in the same period of 2016.
Expenditure
y Gross Domestic Expenditure (GDE), which consists of consumption and investment expenditure that represent the domestic demand in the economy, grew by 10.9 per cent in nominal terms during the first half of 2017, compared to the growth of 7.3 per cent recorded in the corresponding period of 2016. The substantial growth in both investment and consumption expenditure contributed to this expansion. The investment expenditure grew by 12.0 per cent in nominal terms during the first half of 2017 compared to the growth of 12.5 per cent in the corresponding period of 2016, while consumption expenditure grew by 10.5 per cent in nominal terms during the period vis-à-vis a growth of 5.2 per cent in the first six months of 2016. However, net external demand worsened during the first half of 2017, contracting significantly by 22.7 per cent in nominal terms in comparison to a contraction of 2.8 per cent recorded in the corresponding period of 2016. This decline was attributable to the higher growth in imports relative to exports during the period. Consequently, GDP, which comprises of the aggregate of domestic demand and external demand, grew by 10.1 per cent in nominal terms during the first half of 2017 compared to the growth of 7.6 per cent recorded in the corresponding period of 2016.
y GDE in 2017 is projected to grow by 8.7 per cent in nominal terms to Rs. 13,850 billion in comparison to a growth of 8.2 per cent recorded in 2016. The increase in investment activities in tandem with the expansion in consumption expenditure is expected to contribute to the growth in GDE. However, net external demand is projected to contract by 8.3 per cent in 2017 although at a slower pace than 9.6 per cent contraction recorded in the previous year. Consequently, GDP is projected to grow by 8.7 per cent in nominal terms during 2017 registering Rs. 12,871 billion, in comparison to a 8.1 per cent growth recorded in 2016.

2
28
CENTRAL BANK OF SRI LANKA | RECENT ECONOMIC DEVELOPMENTS: HIGHLIGHTS OF 2017 AND PROSPECTS FOR 2018
Consumption
y Consumption expenditure, which accounts for the highest share in aggregate demand, is projected to grow by 7.9 per cent in nominal terms in 2017 compared to a 4.1 per cent growth in 2016. Private consumption expenditure, which witnessed some slowdown in 2016 is anticipated to increase during the year, continuing the trend observed in the first half of 2017. Accordingly, the private consumption expenditure is projected to grow by 8.3 per cent in nominal terms in 2017 compared to 4.3 per cent growth recorded in 2016. Based on the approved budget estimates and progress during the first half of 2017, public consumption expenditure is expected to increase at a moderate pace during the year, in line with the fiscal consolidation path of the government.
Investment
y Investment expenditure in nominal terms is expected to grow by 10.6 per cent during 2017 compared to the 19.6 per cent 2016. Investment expenditure is expected to be mainly driven by private investment activities while public investment activities would increase at a moderate pace. Construction activities have expanded substantially as reflected by the significant increase in cement availability and building material imports during the first six months of 2017. Further, the Cost of Construction Index also recorded a positive growth during the first half of 2017, indicating the expansion in construction activities in nominal terms. Moreover, credit granted by commercial banks to the private sector for personal housing, including purchase/construction/repair activities, also grew at a higher rate by end June 2017 compared to the corresponding period of 2016. Meanwhile, the importation of investment goods including machinery and equipment and other investment goods, increased both in volume and value terms as reflected by trade indices during the first half of 2017. It is envisaged that these developments would continue during the rest of the year stimulating investment growth. Accordingly,
investment expenditure as a percentage of GDP is expected to increase to 32.0 per cent in 2017, from 31.5 per cent in 2016.
y Inflows of Foreign Direct Investments (FDI) to projects approved by the Board of Investment (BOI), including loans to such projects, amounted to US dollars 601.3 million in the first half of 2017 compared to US dollars 332.2 million in the first half of 2016, reflecting a year-on-year growth of 81.0 per cent. FDI inflows relating to infrastructure projects, services and manufacturing increased respectively by 138.2 per cent, 15.1 per cent and 93.8 per cent. Majority of FDI during the period was on account of infrastructure related projects representing around 46 per cent of total FDI (US dollars 276.6 million). FDI in the manufacturing sector amounted to around 31 per cent of total FDI inflows (US dollars 185.6 million), whereas FDI in the services sector amounted to US dollars 138.5 million representing about 23 per cent of total FDI during the first half of 2017.
Savings
y Domestic savings as a percentage of GDP, are projected to increase while national savings would remain marginally below the level recorded in the previous year. Domestic savings are expected to increase to 24.4 per cent of GDP in 2017 from 23.8 per cent of
Chart 2.6Investment and Savings as a Percentage of GDP (a)
35
2013 2014 2015 2016 2017
30
25
20
15
10
5
0
Per c
ent.
Investment National Savings(a) The data is based on the base year 2010 GDP estimates of the Department of Census
and Statistics(b) CBSL estimates based on the medium term macroeconomic framework
Proj. (b)

2
29
NatioNal output aNd ExpENditurE
GDP in 2016. It is envisaged that the government dis-savings would decline, contributing to the expected improvement in domestic savings in 2017. In the meantime, in rupee terms, net primary income from the rest of the world is anticipated to contract at a slower pace in 2017 compared to the previous year, while net current transfers from the rest of the world are projected to grow at a slower rate during 2017 mainly on account of the slow growth in workers’ remittances. Accordingly, national savings as a percentage of GDP are projected at 29.0 per cent in 2017 compared to 29.1 per cent recorded in 2016.
Expected Developments
y The Sri Lankan economy is expected to grow by around 6.0 per cent in real terms in 2018 as per the medium term macroeconomic framework. The growth is expected to be broad based buoyed by all major economic activities. Further, improvements in the investment climate are expected to boost domestic and foreign private investments in the country.
y The agriculture activities are expected to recover partially in 2018 from the impact of adverse weather conditions experienced in 2017, amidst favourable domestic and global conditions. The tea industry is expected to gather momentum in 2018 with perceived higher international prices, encouraging domestic tea producers to increase production. However, the cost of tea production is expected to increase, adversely affecting profit margins while yield per hectare is expected to remain at low levels. Meanwhile, the export demand for rubber, amidst depleting global stocks, is expected to provide an impetus for the local rubber industry in 2018. However, it is imperative that rubber cultivation is extended to non-traditional areas to ensure the long-term viability of the industry as per the Rubber Sector Master Plan that would address disruptions to tapping operations caused by the persistent heavy rainfall in traditional rubber growing areas. Although the lagged effect of the drought that prevailed since the second half of 2016 resulted in a substantial decline in coconut
production in 2017, intermittent rainfall received during this year would stimulate nut setting leading to an increase in coconut production in 2018 compared to 2017. Subsequent to the lifting of the EU ban on fish exports from Sri Lanka, the fisheries sector performance is expected to further improve during 2018. Growth in inland and aquaculture fish production is envisaged to increase due to better management practices adopted for inland water bodies during 2017. Measures taken through the effective implementation of the Livestock Sector Master Plan would enable the dairy and poultry sectors to move in to a higher level of production in 2018. It is expected that the domestic dairy production, which has seen an increasing trend during recent years, would be sufficient to meet around 60 per cent of the local requirement in 2018.
y The industry related economic activities are expected to continue the positive momentum in 2018. Manufacturing activities are expected to provide a high contribution to industry activities supported by the improvement in macroeconomic conditions, continuous efforts of the government to attract FDI and the favourable impact of the GSP+ concession. Regaining of GSP+ is expected to increase apparel exports. In addition, the envisaged development of industrial corridors and logistic facilities are likely to help attract FDI and provide an environment for industrial development in the country. These are expected to be supplemented through conducive and consistent policies on taxation, land administration, labour regulations, along with increased digitalisation and other incentives offered by the government. Meanwhile, SMEs are envisaged to benefit from the new credit guarantee and SME funding schemes introduced by the government. Although trade agreements are a vital linkage in obtaining access to global value chains, the government will have to take necessary steps to enforce the planned anti-dumping policies expeditiously to ensure the growth prospects of the Micro, Small and Medium Enterprises (MSMEs). Another policy priority is the need to upgrade the manufacturing sector as a technologically intensive high value adding sector. Meanwhile,

2
30
CENTRAL BANK OF SRI LANKA | RECENT ECONOMIC DEVELOPMENTS: HIGHLIGHTS OF 2017 AND PROSPECTS FOR 2018
it is expected that the private sector would drive construction activities absorbing the demand for residential and commercial buildings, while government construction activities on essential areas related to infrastructure development are expected to continue, particularly on a PPP basis. Nevertheless, capacity constraints such as skilled labour shortages, skill mismatches, and the increase in the cost of labour and utilities have been identified as issues that need to be addressed in order to unleash the full potential of the industry activities.
y Services activities are expected to maintain the high growth momentum in 2018, supported by all major economic activities within this segment. This broad-based growth is expected to be supported by traditional economic activities such as wholesale and retail trade and transport activities as well as more dynamic activities such as financial services, professional services, IT programming, telecommunication and personal services, which have gathered momentum in line with global developments. Initiatives in enhancing supportive services such as transportation, financial services, communication, etc., which provide significant synergy effects in boosting value added of other economic activities, are essential in moving towards this broad-based growth. Implementation of policies to develop the existing road network and to supply better public transportation modes would enhance transport activities. Further, professional services have an enormous potential to contribute towards the growth in this segment through services exports. Appropriate strategies to attract foreign and local ventures and to provide institutional support, together with an enabling environment are essential in promoting such services exports. This would be further facilitated by introducing modern technology to improve education standards, and providing government support to boost innovation, R&D and other technological enhancements related investments. Tourism related activities are also expected to provide positive impetus to the growth within services activities. Thus, policies
should focus on developing marketing strategies to promote specific tourism segments with low price elasticity of demand such as medical tourism in addition to traditional tourism segments. Services and Industry oriented activities, which have the potential of contributing to a significant growth in the foreseeable future, currently face a labour shortage, both skilled and unskilled, which is expected to aggravate by 2020. Therefore, attracting foreign investments and developing public–private partnerships to establish demand driven training centres that cater to market needs are crucial at this juncture to address the skills gap and to create a knowledge hub that meets both domestic and international skill requirements.
y Investment activities, mainly driven by private investment expenditure are expected to maintain its positive growth momentum in 2018, accounting for about 32.5 per cent of GDP. Private investment expenditure is expected to increase with the prudent government policy measures that would eventually boost investor confidence. Private investment activities specifically related to the construction of condominium and commercial building schemes are expected to contribute towards this growth. Government investment expenditure is also expected to grow at a moderate pace, with prioritised investments on infrastructure development projects to facilitate economic growth.
y The level of savings in the economy needs to be sustained at a favourable level in stepping to a higher growth trajectory. In this regard, both private and government savings need to be improved. The government’s continuous commitment towards fiscal consolidation and positive real interest rates are expected to improve domestic savings. Meanwhile, adopting appropriate macroeconomic policies to facilitate domestic investments and promote FDIs would help reduce the savings-investment gap of the economy.

Economic and Social infraStructurE
3W hile recognising the importance of engaging the private sector for the provision
of economic and social infrastructure, the government utilised its limited fiscal space to make qualitative and quantitative improvements to these much-needed
facilities during the first half of 2017. Continuous progress was witnessed in telecommunication, road development, transportation and ports sectors, as well as in social infrastructure, such as education and health service provision. Amidst severe drought conditions, the country met the growing electricity demand during this period through increased thermal power generation. A Long-Term Electricity Generation Expansion Plan that covers the next 20-year period is expected to be implemented with the aim of ensuring energy security through a sustainable energy policy. With the aim of improving the quality of physical connectivity across regions, development work on the road network of the country, such as expressways and highways, and the i-Road programme, continued during the first half of 2017. Activities under the Western Region Megapolis Master Plan, including those for addressing issues that arise due to rapid urbanisation such as poor housing conditions and waste accumulation, were carried out during this period. On the social infrastructure front, efforts to modernise the education system and enhance equitable access to education for all students across the country continued. In the health sector, several projects were in progress during this period to enhance physical infrastructure. Going forward, ensuring a higher quality standard in social infrastructure delivery by both public and private sectors is vital to enhance the wellbeing of the general public and for overall economic development. Therefore, the government needs to expeditiously implement quality assurance mechanisms, particularly in the education and health sectors, while planning for future challenges. Further encouraging the participation of the private sector in developing economic and social infrastructure would be essential in the coming years due to government budget constraints in the context of rising health care costs associated with an ageing population and increasing costs linked to improving education outcomes, especially in Science, Technology, Engineering and Mathematics, as well as the need to expand training and skills related tertiary education. In this regard, measures should also be expedited to create an enabling environment for public-private partnerships (PPPs) for such service provision.

3
32
CENTRAL BANK OF SRI LANKA | RECENT ECONOMIC DEVELOPMENTS: HIGHLIGHTS OF 2017 AND PROSPECTS FOR 2018
684 GWh in the first seven months of 2017 in comparison to the same period of 2016. This was mainly due to the reduction in power generation by mini hydropower plants owing to drought conditions. During the period under review, the Ceylon Electricity Board (CEB) contributed 72.9 per cent of the total electricity generation in the country while the remainder was generated by Independent Power Producers (IPPs). The transmission and distribution losses declined in the first seven months of 2017 to 7.4 per cent of the total generation in comparison to 9.7 per cent loss in the first seven months of 2016.
y The total electricity sales in the first seven months of 2017 increased by 5.5 per
cent to 7,756 GWh from 7,349 GWh in the
corresponding period in 2016. The growth in demand for electricity was mainly driven by the demand from ‘Industry’ and ‘General Purpose’ categories, which absorbed 29.8 per cent and 20.8 per cent of the total electricity sales, respectively. Meanwhile, the electricity consumption by the ‘Domestic’ category, which accounted for 32.6 per cent of the total electricity sales, also grew in the first seven months of 2017 in comparison to the corresponding period in the preceding year. Further, the electrification level of the country reached 99.43 per cent by end June 2017.
y The Ministry of Power and Renewable Energy continued its efforts to promote renewable
energy generation in the country. The ‘Soorya Bala Sangramaya’ programme aims at installing 200MW solar roof-top projects by 2020 and ultimately convert 1 million households to solar energy roof-top plants. In addition, solar power projects of 1MW each, which are expected to generate 60MW in total, will be connected to the national grid under this programme. Competitive bidding and the evaluation process are in progress to select private sector participants for these small-scale power projects. Since the inception of the ‘Soorya Bala Sangramaya’ programme in September 2016, 2,038 consumers have commenced solar roof-top energy generation through the Net Metering, Net Accounting and Net Plus plans,
Developments in Economic Infrastructure
Electricity
y During the first seven months of 2017, the total electricity generation increased by 2.9 per cent to 8,374 GWh compared to 8,141 GWh recorded in the corresponding period
of 2016. The drought that prevailed during the first half of the year had an adverse impact on hydropower generation, which declined substantially by 48.5 per cent to 1,243 GWh (excluding mini hydro) in the first seven months of 2017 in comparison to the same period in 2016. Consequently, thermal power generation increased notably to compensate for the reduction in hydropower generation. Accordingly, fuel oil-based power generation and coal power generation increased by 40.0 per cent and 18.5 per cent, to 3,122 GWh and 3,325 GWh, respectively, during the first seven months of 2017, compared to the corresponding period of the previous year. Meanwhile, power generation through Non-Conventional Renewable Energy (NCRE) sources declined by 1.2 per cent to
Chart 3. 1Electricity Generation Mix (Jan-Jul)
2016
2017
Hydro (excluding mini hydro) 29.6%
Hydro (excluding mini hydro) 14.8%
Fuel Oil27.4%
Fuel Oil 37.3%
Coal 34.5%
Coal 39.7%
NCRE 8.5%
NCRE 8.2%
Source: Ceylon Electricity Board

3
33
Economic and Social infraStructurE
adding 16.3MW to the national grid by end June 2017. Further, two 10MW solar energy parks in Valaichchenai in the Batticaloa district and Welikanda in the Polonnaruwa district are expected to be commissioned in 2019. Meanwhile, a 100MW solar energy park is being constructed at Siyambalanduwa in the Monaragala district, which is expected to commence energy generation by 2020, while another 100MW solar energy park will be commissioned in Pooneryn in the Kilinochchi district by 2020. Moreover, a 300MW wind energy park is expected to be constructed in Mannar island. Initially, a 100MW wind power plant is planned to be constructed at the site. Meanwhile, the Public Utilities Commission of Sri Lanka (PUCSL) approved the Least Cost Long-Term Generation Expansion Plan of the CEB for the 2018-2037 period with the view of ensuring energy security and continuous supply of electricity in the country. The approved
generation plan recommends adding 242MW of
major hydro, 215MW of mini hydro, 1,389MW
of solar, 1,205MW of wind, 85MW of biomass,
4,800MW of natural gas, 320 MW of furnace
oil based, and 105MW of gas turbine capacity
to the electricity generation system of the CEB
during the next 20-year period. The approved
plan is in line with the government’s policy target
of generating 70 per cent of the country’s energy
requirement through renewable sources by 2030.
Petroleum
y The declining trend in global crude oil (Brent)
prices observed during the first five months
of the year reversed since mid-June, resulting
in the average price to remain at an elevated
level in the first three quarters of 2017 in
comparison to the corresponding period of
2016. In December 2016, the Organisation of
Petroleum Exporting Countries (OPEC) agreed to
cut crude oil production for a period of six months
from January 2017. Meanwhile, non-OPEC
members, including Russia, also announced
to reduce their output. In May 2017, OPEC
members and several non-OPEC countries such
as Russia and Venezuela decided to extend
their production cut until March 2018 to curb the
oil supply glut in the global market. However,
during the first half of 2017, the average daily
oil production of the US was more than 4 per
cent higher than that of in mid-2016, creating a
downward pressure on crude oil prices despite
the production cut by OPEC. Consequently,
the monthly average Brent price declined from
Source: Ceylon Electricity Board
Table 3.1Electricity Sales
(a) Provisional
Item 2015 2016 (a) 2016Jan-Jul
2017Jan-Jul (a)
Change%
Total Sales by CEB (GWh) 11,786 12,785 7,349 7,756 5.5Domestic 3,876 4,198 2,431 2,542 4.6Religious 67 74 42 45 6.5Industrial 3,608 3,864 2,190 2,311 5.5General Purpose 2,324 2,579 1,489 1,617 8.5Government 152 160 94 99 5.5Hotel 205 247 140 153 8.9Bulk Sales to LECO 1,446 1,553 899 927 3.1Street Lighting 108 109 63 63 -0.7
Chart 3.2New Electricity Connections and Electrification Level
New Connections Electrification Level (Right Axis)
2013
H1
2013
H2
2014
H1
2014
H2
2015
H1
2015
H2
2016
H1
2016
H2
2017
H1
2017
H2
(Pro
j.)
Source: Ceylon Electricity Board
'000
Per c
ent
90
92
94
96
98
100
020
40
60
80
100
120140
160
180200

3
34
CENTRAL BANK OF SRI LANKA | RECENT ECONOMIC DEVELOPMENTS: HIGHLIGHTS OF 2017 AND PROSPECTS FOR 2018
US dollars 55.67 per barrel in January 2017 to US dollars 47.71 per barrel in June 2017. However,
an upward trend in prices was observed since
mid-June 2017, supported by a slowdown in the
US drilling activities and perceptions of stronger
global demand. Nevertheless, an unexpected
temporary decline in crude oil prices was observed
in end August due to Hurricane Harvey, which
hit and damaged major US refineries in the US
Gulf coast, and worries over Hurricane Irma, one
of the most powerful storms of the century. With
the gradual restart of refineries, crude oil prices
began to increase, and was also supported by
the higher demand forecasts for 2018 by OPEC.
According to major oil producing countries, the
global market was on its way to rebalancing the
crude oil prices. Reflecting this, the crude oil
(Brent) prices recorded its highest value since
July 2015, of US dollars 59.14 per barrel at end
September 2017. Accordingly, the average price
of crude oil (Brent) increased by 22.1 per cent
to US dollars 52.60 per barrel in the first nine
months of 2017 compared to the average price of
US dollars 43.08 per barrel in the corresponding
period of 2016. With these developments, the
Ceylon Petroleum Corporation’s (CPC’s) average
import price of crude oil increased by 25.4 per
cent to US dollars 54.81 per barrel in the first nine
months of 2017 from US dollars 43.72 per barrel
in the corresponding period of the preceding year.
y Domestic petroleum sales increased in the first eight months of 2017 mainly driven by the demand from the power generation sector. The drought conditions prevailing in the country since mid-2016 and continuous disruptions to the operations of the Norochcholai coal power plant resulted in an increased dependence on fuel oil-based thermal power generation Accordingly, petroleum sales to the energy generation sector grew by 40.4 per cent during the first eight months of 2017 relative to the corresponding period in the previous year. Further, domestic petroleum sales to the transportation sector, which accounts for a share of 61.4 per cent of the total petroleum consumption in the country, grew by 6.6 per cent in the first eight months of 2017 in comparison to the same period in 2016, owing to the increased demand for petrol and diesel from the transportation sector. Moreover, the sale of furnace oil, a product that is mainly used in the energy generation sector, grew by 42.6 per cent during the reference period. In the meantime, domestic sales of kerosene grew by 9.7 per cent during the first eight months of 2017 relative to the corresponding period in 2016.
Road Development
y The Road Development Authority (RDA) continued with the upgrading and maintenance activities related to the national road network during the first half of 2017. Accordingly, the RDA incurred a total expenditure of Rs. 48.8 billion during the period on maintenance, rehabilitation and development of roads and bridges. This was an increase of 27.1 per cent compared to the expenditure of Rs. 38.4 billion incurred by the RDA during the corresponding period of 2016. The RDA maintained a total length of 12,380 km of national highways including expressways as well as around 4,662 bridges during the first half of 2017.
y Projects that commenced in the previous years with the aim of improving the road network, continued during the first half of 2017. These included the Integrated Road
US$/b
bl
Chart 3.3Average Price of Crude Oil (Brent) in the International Market
and the Crude Oil Import Price of the CPC
Sources: Bloomberg Ceylon Petroleum Corporation
Brent CPC Import Price
Jan.-
14
Jan.-
15
Jan.-
16
Jan.-
17
May-1
4
May-1
5
May-1
6
May-1
7
Sep.-
14
Sep.-
15
Sep.-
16
Sep.-
17
20
40
60
80
100
120
140

3
35
Economic and Social infraStructurE
Investment Programme (i-Road), which was identified as one of the key projects in developing the road network that supports and facilitates the enhancement of the economic and social status of the people living in rural areas in lagging provinces. Meanwhile, preliminary work in relation to the construction of a new bridge over the Kelani River with a view to minimising the traffic congestion and thereby improving the transport network in the Colombo city continued during the period with the assistance of Japan International Cooperation Agency (JICA). The Colombo National Highways Project commenced two new rehabilitation and improvement projects, namely, Kottawa–Thalagala Road and Kotte–Bope Road in February 2017. Meanwhile, the construction work of the Polgahawela, Ganemulla and Rajagiriya flyovers registered a progress of 93.5 per cent by end June 2017. The extension of the Southern Expressway Project (ESEP) from Matara to Hambantota with a link to the Mattala International Airport continued in 2017. Meanwhile, construction work of the Central Expressway that extends from Kadawatha to Dambulla with its Pothuhera-Galagedara link continued during the first half of 2017. Also, construction work of Phase III of the Outer Circular Highway (OCH) which connects the Kadawatha interchange and Kerawalapitiya interchange with a link to the Colombo-Katunayake Expressway continued in 2017. It is expected that the completion of the OCH would reduce the traffic congestion within the Colombo metropolitan region. At the same time, rehabilitation and improvement of some roads and bridges continued during the first half of 2017.
y Several other measures were undertaken to reduce traffic congestion and improve road safety in major cities. Currently, a technical assistance project under a Korea International Cooperation Agency (KOICA) grant for the establishment of an Advanced Traffic Management System (ATMS) in Colombo metropolitan region is in progress. Under this project, a Centralised Traffic Control System with advanced traffic management features is expected to be developed aiming to support economic activity of Colombo metropolitan region
by relieving traffic congestion, strengthening road safety and improving public transport. Further, 79 locations have been identified for the installation of pelican crossings covering 211.4 km of road length and the basic design has been completed.
Road Passenger Transportation
y Public passenger transportation showed a negative performance during the first half of 2017. The total operated kilometres of the Sri Lanka Transport Board (SLTB) decreased by 1.6 per cent to 219.4 million km and total passenger kilometrage was 7,737 million km, registering a marginal decline of 0.4 per cent during the first half of 2017 in comparison to the corresponding period of 2016. The total number of buses owned by the SLTB stood at 7,608 by end June 2017 while the average number of buses operated per day decreased by 87 to 5,219 during the period. Meanwhile, the number of buses owned by private operators declined by 2.0 per cent to 19,917 while their average bus fleet operated declined by 3.4 per cent to 17,728 during the first half of 2017 compared to the corresponding period of 2016. The operated kilometres of private buses declined by 3.6 per cent to 523.1 million km, while the passenger kilometres showed a decline of 3.5 per cent to 26,345.5 million km, during the period under review. The reduction of bus operations by both public and private operators was mainly due to the impact of floods in many parts of the island during the latter part of the second quarter. Meanwhile, bus fares were revised as per the annual national bus fares policy with effect from 1 July 2017. Accordingly, the minimum bus fare was increased to Rs. 10.00 from Rs. 9.00 and fares for other categories were revised upwards by 6.28 per cent, on average.
y During the first half of 2017, the National Transport Commission (NTC) continued several road passenger transportation projects. The NTC implemented three major services, namely, Sisu Sariya, Gami Sariya and Nisi Sariya, under a budget of Rs. 690 million for 2017. Under the ‘Sisu Sariya’ project, which is aimed to facilitate school children's attendance to school on time and return home safely, 45 new

3
36
CENTRAL BANK OF SRI LANKA | RECENT ECONOMIC DEVELOPMENTS: HIGHLIGHTS OF 2017 AND PROSPECTS FOR 2018
bus services were launched during the first half of 2017. The ‘Gami Sariya’ service continued to provide transport facilities in relatively uneconomical routes in rural areas. The NTC has initiated 11 new services under the ‘Gami Sariya’ project during the first half of 2017. Under the ‘Nisi Sariya’ project, the NTC plans to launch 35 new bus services during the year 2017. The subsidy granted by the Treasury to the SLTB for the operations in uneconomical routes and subsidised season tickets amounted to Rs. 2.9 billion and Rs. 2.5 billion, respectively, during the first half of 2017.
y New registration of motor vehicles witnessed a reduction during the first nine months of 2017 compared to the corresponding period of the previous year. The decline in vehicle registration was mainly observed in motor vehicles under the categories of motor cars, three wheelers, and dual-purpose vehicles. The deceleration of vehicle registration during the first nine months of 2017 was mainly due to the increase in import duty, depreciation of the Sri Lankan rupee against the US dollar, the increase in market interest rates with tight monetary policy, and tightened macroprudential policies to discourage borrowings to purchase certain categories of motor vehicles.
Rail Transportation
y Transportation services provided by Sri Lanka Railways (SLR) recorded an expansion in terms of both passenger and freight transportation during the first half of 2017.
During the first half of 2017, rail passenger
kilometrage witnessed an increase of 1.5 per
cent to reach 3.6 billion km, incomparison to the
corresponding period of 2016. Further, goods
kilometrage registered an increase of 4.9 per cent
recording 70.6 million MT km during the first half
of 2017, and this was largely supported by
increased coal, oil and cement transportation
services. Meanwhile, the SLR continued the
project on improving the Kalani Valley Railway
line. In addition, steps were taken to commence
the rehabilitation of 200 passenger carriages.
Another major project of the SLR during the first
half of 2017 was the initiation of the procurement
process for a rolling stock with the assistance of
an Indian line of credit. The feasibility study of the
Colombo Suburban Railway project continued in
2017 as well, under the financial assistance of
the Asian Development Bank (ADB). Meanwhile,
the feasibility study with regard to the railway
electrification project from Veyangoda to
Panadura continued during the period under
review.
Civil Aviation
y The civil aviation sector showed a marginal
growth during the first half of 2017 amidst
the renovation activities that took place at
the Bandaranaike International Airport (BIA).
Although the BIA was closed during the day time
from January to early April this year for runway
resurfacing activities, air passenger movements
through the BIA increased to 4.5 million during
Item 2015 2016 (a) 2016Jan-Sep
2017Jan-Sep (a)
Change%
New Registration of Motor Vehicles 668,907 493,328 355,155 342,215 -3.6Buses 4,140 2,685 2,011 2,356 17.2Motor Cars 105,628 45,172 33,198 29,684 -10.6
Cars Less than 1,000cc 60,641 24,593 17,256 14,806 -14.2Three Wheelers 129,547 56,945 40,314 17,519 -56.5Dual Purpose Vehicles 39,456 26,887 19,336 12,613 -34.8Motor Cycles 370,889 340,129 245,350 262,012 6.8Goods Transport Vehicles 7,142 7,563 5,326 8,503 59.7Land Vehicles 12,105 13,947 9,620 9,528 -1.0
Source: Department of Motor Traffic
Table 3.2New Registration of Motor Vehicles
(a) Provisional

3
37
Economic and Social infraStructurE
first half of 2017, recording a marginal growth of
0.5 per cent in comparison to the corresponding
period of the preceding year. However, transit
passenger movements at the BIA witnessed a
decline of 0.6 per cent to 0.6 million during the
first half of 2017 compared to the same period
of the previous year. Meanwhile, total volume
of cargo handled by the BIA decreased by 10.0
per cent to 121,816 MT, which consisted of
74,182 MT of export cargo and 47,633 MT of
import cargo. In response to the closure of the
BIA, the total number of aircraft departures at the
BIA during the first half of 2017 declined by 9.8
per cent to 15,037 from 16,670 in the first half of
2016. However, with the temporary closure of the
BIA, the Mattala Rajapaksa International Airport
(MRIA) handled 980 aircraft departures during
this period compared to 670 recorded during the
first half of 2016. At the same time, passenger
movements at the MRIA significantly increased to
52,905 during the period under review, compared
to the 1,652 recorded in the corresponding period
of the previous year. Total cargo handled at the
MRIA was 60 MT during the first half of 2017.
Meanwhile, the passenger kilometres pertaining
to domestic services witnessed an increase of
19.6 per cent to 2.32 million km during the first half
of 2017 from 1.94 million km in the comparable
period of 2016.
y The construction work of the project to
expand passenger handling capacity at the
BIA continued in 2017. The existing terminal
has a handling capacity of 6 million passengers
per annum, and in 2016 it handled almost 9.3
million passengers, which is an excess of 56
per cent. The current oversaturation at the BIA
is an impediment to improve the tourism sector
of the country. During the first half of 2017, the
expansion project was carried out under two
packages. Financial bids for the first package,
which focuses on passenger terminal building
and associated work, are currently under review.
In addition, a technical proposal was completed
with the support of JICA to construct a multi-
level terminal where arrivals and departures are
separated vertically. The second package, which
focuses on the remote apron and taxiways outside
the second terminal and the related construction
activities, commenced in April 2017. Moreover,
the government is in the process of finding a
suitable investor to form a PPP to restructure
SriLankan Airlines (SLA) and to minimise losses
incurred by the airline.
Port Services
y Port sector performance improved during the
first nine months of 2017, mainly reflecting
increased commercial operations of the
Colombo International Container Terminal
(CICT). The total container handling at the
CICT and South Asia Gateway Terminal (SAGT)
registered growth rates of 19.2 per cent and
12.1 per cent, recording 1,742,889 Twenty-
foot Equivalent Container Units (TEUs) and
1,330,863 TEUs, respectively, during the first nine
months of 2017. Meanwhile, container handling
at both the Jaye Container Terminal (JCT) and
Unity Container Terminal (UCT), which are fully
owned by the Sri Lanka Ports Authority (SLPA),
continued its negative growth, registering a
decline of 8.4 per cent to 1,471,679 TEUs during
the first nine months of 2017 compared to the
corresponding period of the previous year. By end
September 2017, the shares of the SLPA, CICT
and SAGT in the overall container handling were
32.4 per cent, 38.3 per cent and 29.3 per cent,
respectively. The poor performance of terminals
owned by the SLPA is mainly due to CICT’s ability
Chart 3.4Container Handling, Transshipments and Cargo Handling
2013
H1
2013
H2
2014
H1
2014
H2
2015
H1
2015
H2
2016
H1
2016
H2
2017
H1
2017
H2
(Pro
j.)
mn T
EUs
mn M
T
Container Handling Transshipments Cargo Handling (Right Axis)
Sources: Sri Lanka Ports Authority Central Bank of Sri Lanka
0
10
20
30
40
50
0.0
0.5
1.0
1.5
2.0
2.5
3.0
3.5
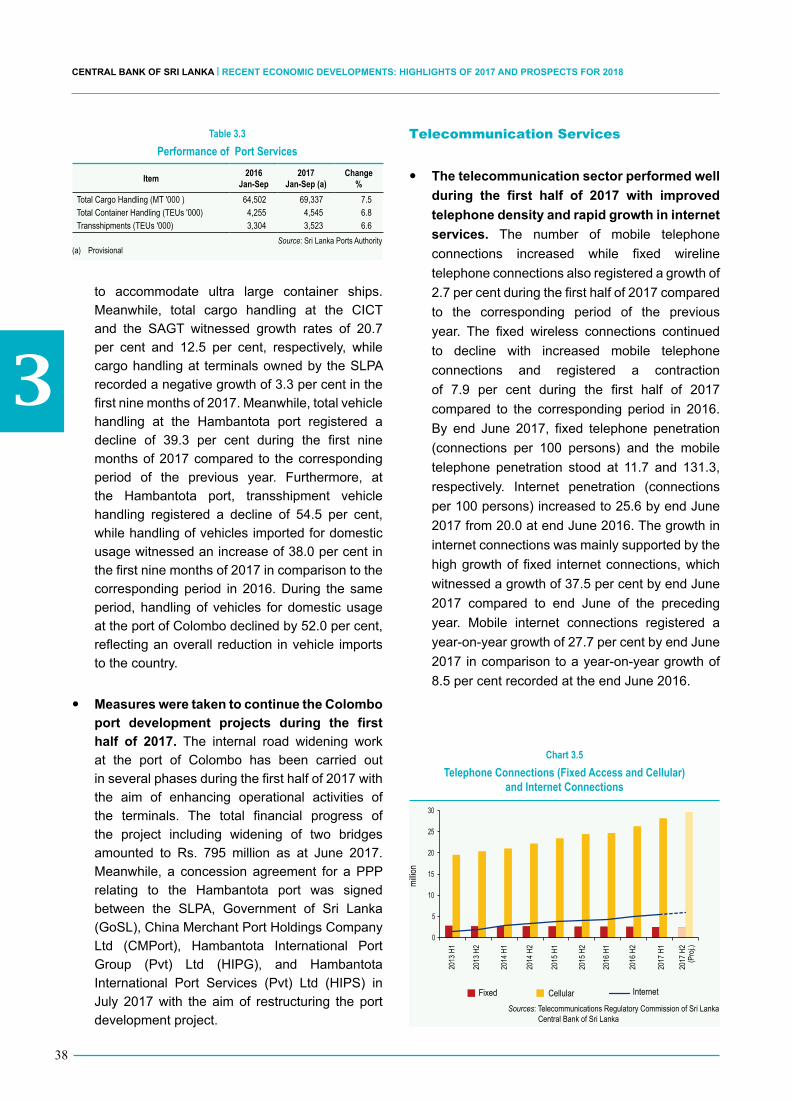
3
38
CENTRAL BANK OF SRI LANKA | RECENT ECONOMIC DEVELOPMENTS: HIGHLIGHTS OF 2017 AND PROSPECTS FOR 2018
to accommodate ultra large container ships. Meanwhile, total cargo handling at the CICT and the SAGT witnessed growth rates of 20.7 per cent and 12.5 per cent, respectively, while cargo handling at terminals owned by the SLPA recorded a negative growth of 3.3 per cent in the first nine months of 2017. Meanwhile, total vehicle handling at the Hambantota port registered a decline of 39.3 per cent during the first nine months of 2017 compared to the corresponding period of the previous year. Furthermore, at the Hambantota port, transshipment vehicle handling registered a decline of 54.5 per cent, while handling of vehicles imported for domestic usage witnessed an increase of 38.0 per cent in the first nine months of 2017 in comparison to the corresponding period in 2016. During the same period, handling of vehicles for domestic usage at the port of Colombo declined by 52.0 per cent, reflecting an overall reduction in vehicle imports to the country.
y Measures were taken to continue the Colombo port development projects during the first half of 2017. The internal road widening work at the port of Colombo has been carried out in several phases during the first half of 2017 with the aim of enhancing operational activities of the terminals. The total financial progress of the project including widening of two bridges amounted to Rs. 795 million as at June 2017. Meanwhile, a concession agreement for a PPP relating to the Hambantota port was signed between the SLPA, Government of Sri Lanka (GoSL), China Merchant Port Holdings Company Ltd (CMPort), Hambantota International Port Group (Pvt) Ltd (HIPG), and Hambantota International Port Services (Pvt) Ltd (HIPS) in July 2017 with the aim of restructuring the port development project.
Telecommunication Services
y The telecommunication sector performed well
during the first half of 2017 with improved
telephone density and rapid growth in internet
services. The number of mobile telephone
connections increased while fixed wireline
telephone connections also registered a growth of
2.7 per cent during the first half of 2017 compared
to the corresponding period of the previous
year. The fixed wireless connections continued
to decline with increased mobile telephone
connections and registered a contraction
of 7.9 per cent during the first half of 2017
compared to the corresponding period in 2016.
By end June 2017, fixed telephone penetration
(connections per 100 persons) and the mobile
telephone penetration stood at 11.7 and 131.3,
respectively. Internet penetration (connections
per 100 persons) increased to 25.6 by end June
2017 from 20.0 at end June 2016. The growth in
internet connections was mainly supported by the
high growth of fixed internet connections, which
witnessed a growth of 37.5 per cent by end June
2017 compared to end June of the preceding
year. Mobile internet connections registered a
year-on-year growth of 27.7 per cent by end June
2017 in comparison to a year-on-year growth of
8.5 per cent recorded at the end June 2016.
Item 2016Jan-Sep
2017Jan-Sep (a)
Change%
Total Cargo Handling (MT '000 ) 64,502 69,337 7.5Total Container Handling (TEUs '000) 4,255 4,545 6.8Transshipments (TEUs '000) 3,304 3,523 6.6
Source: Sri Lanka Ports Authority
Table 3.3Performance of Port Services
(a) Provisional
0
5
10
15
20
25
30
Chart 3.5Telephone Connections (Fixed Access and Cellular)
and Internet Connections
millio
n
Fixed Cellular Internet
2013
H1
2013
H2
2014
H1
2014
H2
2015
H1
2015
H2
2016
H1
2016
H2
2017
H1
2017
H2
(Pro
j.)
Sources: Telecommunications Regulatory Commission of Sri Lanka Central Bank of Sri Lanka
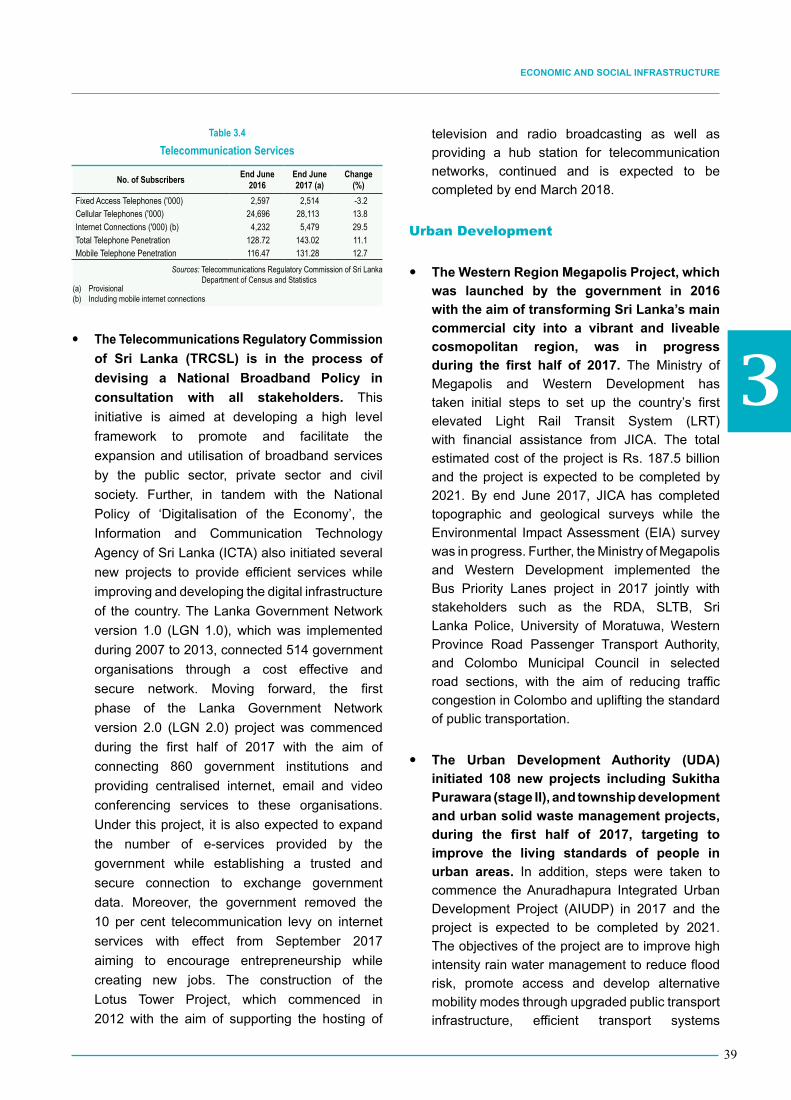
3
39
Economic and Social infraStructurE
y The Telecommunications Regulatory Commission
of Sri Lanka (TRCSL) is in the process of
devising a National Broadband Policy in
consultation with all stakeholders. This
initiative is aimed at developing a high level
framework to promote and facilitate the
expansion and utilisation of broadband services
by the public sector, private sector and civil
society. Further, in tandem with the National
Policy of ‘Digitalisation of the Economy’, the
Information and Communication Technology
Agency of Sri Lanka (ICTA) also initiated several
new projects to provide efficient services while
improving and developing the digital infrastructure
of the country. The Lanka Government Network
version 1.0 (LGN 1.0), which was implemented
during 2007 to 2013, connected 514 government
organisations through a cost effective and
secure network. Moving forward, the first
phase of the Lanka Government Network
version 2.0 (LGN 2.0) project was commenced
during the first half of 2017 with the aim of
connecting 860 government institutions and
providing centralised internet, email and video
conferencing services to these organisations.
Under this project, it is also expected to expand
the number of e-services provided by the
government while establishing a trusted and
secure connection to exchange government
data. Moreover, the government removed the
10 per cent telecommunication levy on internet
services with effect from September 2017
aiming to encourage entrepreneurship while
creating new jobs. The construction of the
Lotus Tower Project, which commenced in
2012 with the aim of supporting the hosting of
television and radio broadcasting as well as providing a hub station for telecommunication networks, continued and is expected to be completed by end March 2018.
Urban Development
y The Western Region Megapolis Project, which was launched by the government in 2016 with the aim of transforming Sri Lanka’s main commercial city into a vibrant and liveable cosmopolitan region, was in progress during the first half of 2017. The Ministry of Megapolis and Western Development has taken initial steps to set up the country’s first elevated Light Rail Transit System (LRT) with financial assistance from JICA. The total estimated cost of the project is Rs. 187.5 billion and the project is expected to be completed by 2021. By end June 2017, JICA has completed topographic and geological surveys while the Environmental Impact Assessment (EIA) survey was in progress. Further, the Ministry of Megapolis and Western Development implemented the Bus Priority Lanes project in 2017 jointly with stakeholders such as the RDA, SLTB, Sri Lanka Police, University of Moratuwa, Western Province Road Passenger Transport Authority, and Colombo Municipal Council in selected road sections, with the aim of reducing traffic congestion in Colombo and uplifting the standard of public transportation.
y The Urban Development Authority (UDA) initiated 108 new projects including Sukitha Purawara (stage II), and township development and urban solid waste management projects, during the first half of 2017, targeting to improve the living standards of people in urban areas. In addition, steps were taken to commence the Anuradhapura Integrated Urban Development Project (AIUDP) in 2017 and the project is expected to be completed by 2021. The objectives of the project are to improve high intensity rain water management to reduce flood risk, promote access and develop alternative mobility modes through upgraded public transport infrastructure, efficient transport systems
No. of Subscribers End June 2016
End June 2017 (a)
Change (%)
Fixed Access Telephones ('000) 2,597 2,514 -3.2Cellular Telephones ('000) 24,696 28,113 13.8Internet Connections ('000) (b) 4,232 5,479 29.5Total Telephone Penetration 128.72 143.02 11.1Mobile Telephone Penetration 116.47 131.28 12.7
Sources: Telecommunications Regulatory Commission of Sri Lanka Department of Census and Statistics
(a) Provisional(b) Including mobile internet connections
Table 3.4Telecommunication Services

3
40
CENTRAL BANK OF SRI LANKA | RECENT ECONOMIC DEVELOPMENTS: HIGHLIGHTS OF 2017 AND PROSPECTS FOR 2018
and quality public spaces, and strengthen
urban and heritage management practices to
preserve and enhance the attractiveness of the
Anuradhapura district. Under the Strategic Cities
Development Project, the Ministry has planned
to commence the Trincomalee Integrated Urban
Development Project (TIUDP), which consists of
urban regeneration, heritage conservation and
environment preservation in the Trincomalee
district, during the second half of 2017 with
financial assistance from the ADB. Meanwhile,
Strategic City Development Projects in Kandy,
Galle and Jaffna were in progress during the
first half of 2017. The UDA has already identified
around 200 projects to be implemented during
the period 2018-2020 covering the entire country.
y The Colombo Financial City (Port City)
Development project was in progress during
the first half of 2017. As at end July 2017, the
physical progress of reclamation work through
sea sand dredging was around 32 per cent while
the progress of rock delivery, compaction work,
and construction of offshore breakwaters, which
are financed through Foreign Direct Investments
(FDIs), were recorded at 22 per cent, 15 per cent
and 15 per cent, respectively. Around 21 million
cubic metres of sea sand has been extracted
since the commencement of dredging in
September 2016. Construction and development
work of the project is expected to be completed
within 20 years from the completion of sea bed
reclamation work.
Developments in Social Infrastructure
Education
y The government implemented numerous
measures to improve the general education
sector during the first half of 2017. The
student net enrolment ratio (NER) for the 5-14
age group (Grade 1-9) of the country stood at
97.35 per cent by end June 2017. The NER for
male and female students were 98.38 per cent
and 96.31 per cent, respectively. During the
first half of 2017, approximately 9,600 teachers
have been evaluated through the Ministry of
Education, Provincial Departments of Education,
Zonal Education offices and Divisional Education
offices. In addition, the government allocated
approximately Rs. 25.8 billion in 2017 for physical
infrastructure development under the ‘Nearest
school is the best school’ programme. Under this
programme, 13,087 infrastructure development
activities in 7,887 provincial schools and 280
national schools have commenced, and 5,030
activities have been completed by end June
2017. In addition, infrastructure in 451 schools, 19
National Colleges of Education, 7 Teacher Training
Colleges and 75 Teacher Training Centres and
Pirivenas are being developed under the annual
budget allocation of the Ministry of Education. A
pilot project for implementing the ‘guaranteed 13
years of education’ policy through the introduction
of new Advanced Level subject streams was
commenced in September 2017. The pilot project
is initially carried out in 42 national schools and
the new reforms will be introduced to all schools
from 2019. In addition, the government plans
to establish 300 digital classrooms with smart
devices in 150 schools. To this end, the process
of procurement of equipment was commenced
during the first half of 2017 to establish 50 digital
classrooms by the end of the year. Supervision of
government approved private schools continued
during the first half of 2017 through the provincial
and zonal education authorities.
y The government has taken various measures
to improve university education in the
country during the first half of 2017. In 2017,
online application was made compulsory for
university admission to reduce application
processing time and to release cut-off marks
early. Accordingly, in spite of initial glitches, the
University Grants Commission (UGC) was able
to release the university admission cut-off marks
for the Academic Year 2016/2017 in June 2017,
three months earlier than the previous academic
year. The computer-based application process
has reduced the time taken to fill vacancies and

3
41
Economic and Social infraStructurE
consequently, all universities could commence
their academic sessions for the Academic Year
2016/2017 simultaneously from October 2017.
Meanwhile, 29,696 students have been selected
for university admission under the normal intake
for this academic year. During the first half of 2017,
four new undergraduate degree programmes
and 12 new postgraduate degree programmes
have been approved by the UGC. Further, two
faculties, 20 departments and one postgraduate
institute have been approved by the UGC during
this period. In addition, the UGC Centre for
Gender Equity and Equality was established to
give policy direction to universities, undertake
capacity building among women for leadership
in management, facilitate gender sensitive
university cultures, and reduce gender-based
violence, oppression and discrimination in the
university environment. Moreover, an ICT-based
Ragging Complaints Mechanism was established
and operationalised to prevent ragging, sexual
and gender-based violence in universities.
y The private sector continued to engage in the
provision of tertiary education alongside the
government. As of end June 2017, there were 15
Non-State Higher Education Institutes (NSHEIs)
recognised as degree awarding institutes that
offer 95 locally accredited degree programmes.
During the first half of 2017, two bachelors’ degree
programmes and one postgraduate diploma
offered by two NSHEIs were accredited. The
Ministry of Higher Education and Highways took
initiatives to establish an independent body to
regulate the quality assurance and accreditation
of the courses offered by the state universities as
well as NSHEIs, and the relevant legislation is in
the process of being drafted.
y There were 740 registered institutions in
the Technical and Vocational Education
and Training (TVET) sector, which include
142 public institutions and 598 private and
non-governmental institutions as at end June
2017. These institutions offered 1,950 accredited
TVET courses, while 17,491 National Vocational
Qualification (NVQ) certificates were issued by
these institutions in the first half of 2017. During
the same period, an assessment monitoring
programme was introduced by the Tertiary and
Vocational Education Commission to ensure
the trainees’ competencies are in line with the
National Competency Standards.
y The issue pertaining to the medical education
provided by the South Asian Institute of
Technology and Medicine (SAITM) caused
serious disruptions to the university education
system and the health sector. Medical students
in all state universities have abstained from
attending lectures, tutorials and clinical training
as a result of student union action against
SAITM since January 2017. A Presidential
Commission was appointed to resolve the
issues related to SAITM and the Commission
submitted an interim report to the government,
recommending the establishment of the proposed
Independent Quality Assurance and Accreditation
Authority (IQAAA) expeditiously. The IQAAA, in
consultation and collaboration with the Sri Lanka
Medical Council, is expected to evaluate the
medical degree programmes for accreditation
purposes. Nevertheless, the issue remains
unresolved, significantly delaying the graduation
of medical students and new student enrolments
in the state medical faculties. Therefore, a
workable solution to this issue is urgently required
to enable private sector provision of higher
education, including medical education, within a
quality assurance mechanism acceptable to the
public.
Health
y The government continued its efforts to
strengthen the physical and human resources
of the health sector during the first half of
2017. There were 20,575 qualified doctors
and 33,363 nurses in government hospitals,
representing one doctor for every 1,041 persons

3
42
CENTRAL BANK OF SRI LANKA | RECENT ECONOMIC DEVELOPMENTS: HIGHLIGHTS OF 2017 AND PROSPECTS FOR 2018
and one nurse for 642 persons, by end June
2017. Further, there were 76,829 beds in
government hospitals, which convert to 3.6
beds for every 1,000 persons. Meanwhile, there
were 100 government Ayurvedic hospitals with
5,114 beds and 23,180 registered Ayurvedic
physicians as at end June 2017. Numerous
projects were in progress during the first half of
2017 to improve the physical infrastructure in the
health sector. The extension of the Premature
Baby Unit of the De Soyza Maternity hospital
and Accident Ward Complex of the Ragama
Teaching Hospital are expected to be completed
during 2017. Further, development projects at
the District General Hospitals in Hambantota
and Nuwara Eliya, and the Maternity Hospital in
Karapitiya were in progress during the first half
of the year. The construction and upgrading of
17 peripheral blood banks that are under the
purview of National Blood Transfusion Services
of the Ministry of Health, Nutrition and Indigenous
Medicine (MoH) have been completed during
the first half of 2017. Development of the
Ambulatory Care Centre at the National Hospital
commenced in April 2017. In addition, three
Cancer Hospitals are proposed to be constructed
in Thellipalei, Kandy and Matara. Moreover, plans
are also being made to establish Renal Units
in Batticaloa, Hambantota, Trincomalee and
Jaffna and to develop infrastructure related to
dialysis services in 38 hospitals in the Chronic
Kidney Disease (CKD) prevalent areas. The
Cabinet has decided in October 2017 to establish
the ‘Suvaseriya’ Foundation and to extend the
1990 ambulance service to all provinces of the
country.
y The dengue epidemy continued to be a
serious public health issue with the country’s
worst-ever dengue outbreak reported in
2017. The number of dengue cases reported
during January to end August 2017 was 149,126,
which corresponds to a rate of 696 per 100,000
population. Dengue prevalence was 186 per
100,000 population in the corresponding period
of 2016. Over 40 per cent of the dengue cases
were reported from the Western Province while
most affected areas are Colombo, Gampaha,
Kandy, Ratnapura, Kurunegala, Kalutara,
Kegalle, Matara, Galle, Puttalam, Trincomalee
and Batticaloa. Heavy monsoon rains during
the month of May, failure to clear rain-soaked
garbage, and standing water and other potential
breeding grounds for mosquito larvae led to the
spread of the epidemy in urban and suburban
areas. The number of dengue related deaths
during the first eight months was 389, indicating
a fatality rate of 0.26 per cent, in comparison to
0.17 per cent in the corresponding period of 2016.
The MoH has implemented numerous activities
to minimise and control the burden of dengue
epidemy by vector control, early diagnosis and
proactive case management. A series of mass
scale premises inspection programmes was
continued, targeting government institutions,
private institutions, religious places, schools and
higher education institutions, residential houses,
construction sites, fisheries harbours and fishing
boats, etc., by mobilising personnel from the
armed forces and the Police as well as from Health
Services. Further, High-Dependency Unit (HDU
facilities were established and other facilities
were upgraded to strengthen dengue case
management in many hospitals throughout the
country. Rs. 68 million was allocated to establish
HDUs in 10 selected hospitals covering four
provinces of the country. In addition, 500 mosquito
prevention field assistants were recruited during
the first half of 2017, while a further 1,000 will be
recruited in a phased-out manner.
y The private sector continued to play a key
role in the healthcare sector. There were 198
registered private hospitals with the capacity of
6,196 beds in the country including 20 Ayurvedic
hospitals with 430 beds, by the end of the first
half of 2017. Moreover, there were 110 registered
medical and channelling centres, 292 registered
medical laboratories, 190 full time and part time
medical clinics operating around the country by
end July 2017.

3
43
Economic and Social infraStructurE
Safety Nets and Poverty Alleviation
y The overall poverty level has declined
considerably reflecting improved household
income and living standards in the country,
but poverty pockets and income disparity
still remain as key social issues. According to
the Household Income and Expenditure Survey
(HIES)–2016 conducted by the Department
of Census and Statistics, the poverty level, as
measured by the Poverty Head Count Ratio
(PHCR) reduced to 4.1 per cent from 6.7 per
cent in 2012/13. Although disparities in poverty
levels among the urban, rural and estate sectors
continued, an improvement was recorded in 2016
compared to 2012/13. Accordingly, PHCRs of
urban, rural and estate sectors improved to 1.9 per
cent, 4.3 per cent and 8.8 per cent, respectively,
from 2.1 per cent, 7.6 per cent and 10.9 per cent,
respectively, in 2012/13. Moreover, at the district
level, Colombo continued to record the lowest
level of poverty while Killinochchi recorded the
highest PHRC in 2016. In terms of the number
of the poor, the Kandy (9.1 per cent), Ratnapura
(8.6 per cent), Kegalle (7.2 per cent), Batticaloa
(7.2 per cent), and Badulla (6.7 per cent) districts
recorded the highest contribution to the total poor
population in the country. Meanwhile, the income
disparity as measured by the Gini coefficient
based on household income declined to 0.45 in
2016 from 0.48 in 2012/13. The Gini coefficients
of urban, rural and estate sectors stood at 0.48,
0.44 and 0.36, respectively, in 2016, suggesting
higher income disparity in the urban and rural
areas. As per the HIES-2016, the poorest 20 per
cent and the richest 20 per cent of the population
received 4.8 per cent and 50.8 per cent of the total
income of the population, respectively, reflecting
the severity of income disparity in the country.
y The government continued the existing
social protection programmes in 2017 with
the aim of supporting the livelihood of the
low-income and economically vulnerable
households. During the first half 2017, Rs.19.9
billion has been disbursed under the Samurdhi
subsidy programme, while Rs. 382 million has
been granted to 76,011 beneficiaries under
the Samurdhi Social Security Benefit Scheme.
Moreover, 239,226 loans, amounting to
Rs. 23.6 billion, have been disbursed through
the Samurdhi community-based banks during
the first half of 2017. In addition, the Ministry
of Women and Child Affairs continued to provide
nutritional food packages for expectant mothers
incurring a total value of Rs. 1.4 billion during this
period. The aim of this programme is to reduce
the incidence of low weight births and improve
the nutritional status of the pregnant and lactating
mothers. Furthermore, the government took
numerous measures with the assistance of civil
society, private sector and multilateral agencies
to ease the burden of the people affected by
natural disasters.
Per c
ent
Chart 3.6Poverty Headcount Ratio
Source: Department of Census and Statistics
Urban Rural Estate Sri Lanka
32
24
16
8
01990/91
26.1
15.2
8.9 6.7
4.1
2006/07 2009/10 2012/13 2016
'000
2013 2014 2015 2016 2017 0
10,000
20,000
30,000
40,000
50,000
1,300
1,350
1,400
1,450
1,500
'000
H1
Chart 3.7Performance of the Samurdhi/Divineguma Subsidy Programme
Rs. m
illion
Number of Beneficiary Families
Total Expenditure (Right Axis)
Number of Beneficiary Families upto June
Sources: Department of Samurdhi Development Ministry of Finance and Mass Media

3
44
CENTRAL BANK OF SRI LANKA | RECENT ECONOMIC DEVELOPMENTS: HIGHLIGHTS OF 2017 AND PROSPECTS FOR 2018
y In line with the sustainable development goals
of alleviating poverty, ensuring zero hunger
and gender equality, the Year 2017 was
declared as the ‘Year of Poverty Alleviation’
in Sri Lanka. The Department of Samurdhi
Development (DSD) prepared an empowerment
plan to be implemented from 2017 onwards
with the view of alleviating poverty in Sri Lanka
by 2030. Accordingly, the DSD has targeted
to empower 10 per cent of the families that
have been identified as those having a higher
potential to be empowered, which amounted
to 125,385 families. This initiative is to be
carried out through livelihood development,
marketing promotion and model village
programmes and providing micro-finance facilities
for poor families. The strategy of empowerment
is through education, entrepreneurship and
employment. In order to achieve the above target,
Samurdhi Officers are in the process of selecting
nine families from each Grama Niladhari (GN)
division.
Expected Developments
y The growth momentum in electricity demand
is expected to continue over the medium term,
necessitating lasting solutions for the energy
sector. The lower hydropower generation and
higher fuel oil-based power generation during
the first half of 2017 have adversely affected the
financial performance of the CEB substantially.
Therefore, the effects of frequent adverse
weather conditions on electricity generation
highlight the need for diversifying the country’s
energy mix while expanding the generation
capacity to meet the future demand for electricity.
y It is expected that the government will
introduce cost reflective pricing policies for
public utilities in the near future. In particular,
a cost reflective pricing formula is expected for
domestic petroleum prices, which will induce
domestic users to internalise fluctuations in global
market prices directly, rather than through fiscal
costs associated with losses made by the CPC.
y In line with the fiscal consolidation process
and with a view to enhancing the financial
viability of the state-owned business
enterprises (SOBEs), the government is
in the process of establishing PPPs for
selected state-owned ventures such as the
Hambantota port, SLA and MRIA. These
PPPs are expected to reduce the burden on the
government budget, reduce contingent liabilities
of the government, increase the operational
efficiency while attracting much-needed non-debt
creating FDIs to the country. In addition to the five
key SOBEs that signed Statements of Corporate
Intent (SCIs) during the first half of 2017, the
government is planning to introduce SCIs for 10
more SOBEs, selected based on their size and
strategic importance. These SCIs are intended to
improve transparency, accountability, operational
efficiency and financial viability of the SOBEs in
the long-run.
y The government is in the process of reforming
the upper secondary education with the aim of
making 13 years of school education available
to all students. Accordingly, a diversified
subject stream that offers a new set of general
and applied subjects will be introduced for the
Advanced Level stage. The new subject stream
will allow the students who do not pass the GCE
Ordinary Level to proceed to Advanced Level and
pursue vocational studies to succeed in the future.
While providing opportunities for all the students
to complete 13 years of school education, the
new education reform is expected to address the
mismatch between school education, job market
requirements and student expectations.

Prices, Wages, emPloyment and Productivity
4The general price level, in terms of both the National Consumer Price Index (NCPI,
2013=100) and the Colombo Consumer Price Index (CCPI, 2013=100) compiled by the Department of Census and Statistics (DCS), followed an overall increasing trend,
with mixed movements during the first nine months of the year. The movement of both NCPI and CCPI was largely in line with the price movements of the Food category which was subjected to severe supply side disruptions. Meanwhile, inflation, as measured by the year-on-year change in NCPI and CCPI also reflected mixed movements during the observed period. These movements in the general price level and inflation were mainly due to the base effect caused by the significant fluctuations in indices as a result of the changes in taxes in 2016. Meanwhile, underlying inflation as reflected by the movements in NCPI Core and CCPI Core indices generally followed a decreasing trend during the period, on a year-on-year basis highlighting the comparatively low volatility in prices of Non-food category during the observed period. Furthermore, year-on-year producer price inflation was driven by the overall increasing trend of the Agriculture sub-index resulting in high rates of producer price inflation during the first eight months of the year. Meanwhile, nominal wages in the economy increased at a slower pace compared to inflation, leading to a decline in overall real wages during the first half of 2017. This signals possible pressures for wages to increase and also possible deterioration in labour productivity in the near future. On the employment front, the unemployment rate declined amidst an increase in the Labour Force Participation Rate (LFPR) during the first half of 2017, compared to the same period of 2016, indicating that the capacity to absorb labour in the economy has increased. The increase in LFPR was solely due to the increase in female LFPR. Departures for foreign employment declined as a result of continued policy efforts of the government to reduce the departures in unskilled categories and also due to the ongoing geo-political tensions in major Sri Lankan migrant employment destinations. Meanwhile, labour relations improved as reflected by lower number of strikes reported to the Labour Department by private industries, although an increasing trend in disturbances was observed with regard to public services in the recent past. During the first quarter of 2017, labour productivity declined in all three major sectors: Agriculture, Industry and Services, leading to an overall decline in labour productivity in the economy.

4
46
CENTRAL BANK OF SRI LANKA ǀ RECENT ECONOMIC DEVELOPMENTS: HIGHLIGHTS OF 2017 AND PROSPECTS FOR 2018
Colombo Consumer Price Index (CCPI)
y CCPI (2013=100), which measures the price developments of urban areas of the Colombo district also moved on an increasing trend with mixed movements during the first nine months of 2017. CCPI which was 116.1 index points in January 2017, peaked at 120.1 index points in June 2017 and recorded 119.7 index points in September 2017. The movement of CCPI was mainly led by the movements in the Food category during the observed period. Although the Non-food category has a higher weight in the index, contribution from the Non-food category towards the movement in CCPI was minimal. Year-on-year CCPI inflation also followed a similar movement to NCPI inflation, following an increasing trend with mixed movements. As such, year-on-year CCPI inflation, which was 5.5 per cent in January 2017, peaked at 7.3 per cent in March 2017 and declined gradually
Developments in 2017
Prices
National Consumer Price Index (NCPI)
y The general price level, as measured by the movement in NCPI (2013=100), which covers the entire island, followed an overall increasing trend, with mixed movements during the period from January to September 2017. NCPI was 119.3 index points in January 2017, peaked at 123.4 index points in June 2017 and recorded 123.3 index points in September 2017. NCPI largely followed the movements of prices of the Food category during the observed period while the Non-food category which moved on an increasing trend also contributed towards the increase in NCPI.
y Inflation as measured by the year-on-year change in NCPI also followed an overall increasing trend with mixed movements during the first nine months of 2017. Year-on-year NCPI inflation increased during the first three months of the year, moderated by mid-year and thereafter increased until September 2017, settling above mid-single digit levels. The increase in year-on-year inflation during the first two months was mainly driven by both the monthly increases in NCPI and the low base in the corresponding months of the previous year. However, its movements during the period from March 2017 to June 2017, was solely driven by the base effect. The monthly decline recorded in July 2017 helped maintain the year-on-year inflation at the same level recorded in June 2017. Meanwhile, the low base in August 2016 caused the year-on-year NCPI inflation to increase significantly in August 2017 albeit a monthly decline was recorded in the same month. The year-on-year NCPI inflation increased further in September 2017 with a monthly increase in NCPI. Meanwhile, the annual average NCPI inflation gradually increased from 4.6 per cent in January 2017 to 6.8 per cent in September 2017.
Chart 4.1Movements of Headline Inflation (2016-2017) NCPI (2013=100)
-2
0
2
4
6
8
10
2016 2017
Jan
Jan
Per c
ent
Annual Average changeYear-on-year change
Feb
Feb
Mar
Mar
Apr
Apr
Jun
JunJul
Jul
Aug
Aug
Sep
Sep
Oct
Nov
Dec
May
May
Sep
Chart 4.2Movements of Headline Inflation (2016-2017) CCPI (2013=100)
0
1
2
3
4
5
6
7
8
2016 2017
Per c
ent
Jan
Jan
Feb
Feb
Mar
Mar
Apr
Apr
May
May
Jun
JunJul
Jul
Aug
Aug
Sep
Oct
Nov
Dec
Year-on-Year Change Annual Average Change

4
47
Prices, Wages, emPloyment and Productivity
until June 2017. Reflecting the moderation in prices in the Food category during July 2017 and the high base that prevailed in July 2016, the year-on-year CCPI inflation declined significantly to 4.8 per cent in July 2017. However, despite a monthly decline in the index in August 2017, the low base that prevailed in August 2016 resulted in an increase in CCPI inflation to 6.0 per cent. Contributed by both the lower base and increased food prices, year-on-year CCPI inflation increased further to 7.1 per cent in September 2017. Meanwhile, annual average CCPI inflation increased from 4.3 per cent in January 2017 to 5.8 per cent in September 2017.
Price Movements in the Food Category
y On average, prices in the Food category increased, with mixed movements in line with the supply conditions of Volatile Food1 items during the first nine months of the year. Prices of rice on average increased at a higher rate during the first nine months of the year compared to the same period of the previous year, primarily due to drought driven supply disruptions. Furthermore, prices of fresh fish also increased at a higher rate during the observed period compared to the same period of the previous year. This was mainly due to the sharp price increase recorded in June 2017 driven by adverse weather conditions. The prolonged drought conditions that prevailed in the past caused a continuous low coconut production, which led to the rapid increase of coconut prices since September 2016. Accordingly, coconut prices remained high during the first nine months of 2017 compared to the same period of 2016. Even though, the prices of vegetables showed an increasing trend, the average price that prevailed during the first nine months of 2017 was lower than that prevailed during the corresponding period of the previous year. Nevertheless, prices of potatoes, red onions and big onions increased at a higher rate during the first nine months of 2017 compared to the same period of the previous year. The increasing trend of the prices of items in the volatile food category caused significant upward pressure on the general price level during the period under review.
1. VolatileFoodincludesrice,meat,freshfishandseafood,coconuts,freshfruits,vegetables, potatoes, onions and selected condiments.
y The domestic prices of key imported food items increased at a slower rate during the first nine months of 2017 compared to the same period of the previous year. The price of sugar increased marginally while the prices of wheat flour and dhal declined during the observed period of 2017 compared to the same period of 2016. The Special Commodity Levy (SCL) on rice imports was reduced on several occasions, to contain rice prices and complement lower domestic supply conditions. In addition, maximum retail prices were also imposed on prices of some food items, including rice, dhal, dried sprats, sugar and potatoes to contain price pressures in the market. However, the maximum retail price imposed on rice prices was removed in August 2017.
y Year-on-year food inflation in terms of both NCPI and CCPI moved on an increasing trend with mixed movements. The year-on-year NCPI food inflation increased significantly from January 2017 to February 2017 mainly due to the base effect, and also due to the monthly increases in prices of the items in the Food category. Despite the decline in food prices in March 2017, NCPI food inflation increased in March 2017 due to the low base in the previous year. NCPI food inflation increased further in April 2017, driven by the increase in food prices during the month. Even though the food prices continued to increase during May and June 2017, the year on-year NCPI food inflation declined due to the base effect. Meanwhile, Food prices declined during July 2017 as a result of favourable supply conditions, leading a further decline in the year-on-year food inflation in July 2017. However, it recorded a significant increase amid a monthly decline during August 2017, driven by the low base that prevailed in August 2016. It increased further in September 2017 owing to the base effect and the monthly increase in food prices. The year-on-year CCPI food inflation also showed an increasing trend with mixed movements during the observed period. Meanwhile, the annual average food inflation moved on an increasing trend during this period.

4
48
CENTRAL BANK OF SRI LANKA ǀ RECENT ECONOMIC DEVELOPMENTS: HIGHLIGHTS OF 2017 AND PROSPECTS FOR 2018
Price Movements in Non-food Category
y Prices in Non-food category exhibited an overall upward trend during the observed period. All sub-categories contributed towards this increase during the observed period. In terms of administered Non-food prices, the bus fares were increased by 6.28 per cent with effect from 1st July 2017 and the price of a 12.5 kg cylinder of LP Gas was increased by Rs.110 with effect from 26th September 2017. These developments resulted in an overall increasing trend in the Non-food prices during the period. Nevertheless, the year-on-year Non-food inflation in terms of both NCPI and CCPI recorded a decreasing trend with mixed movements, due to the base effect caused by tax adjustments in 2016. The annual average NCPI Non-food inflation showed an increasing trend with mixed movements while the annual average CCPI Non-food inflation moved on a steadily increasing trend.
Core Inflation
y Year-on-year core inflation in terms of both the NCPI Core (2013=100) and CCPI Core (2013=100) moved on an overall decreasing trend during the period. The decline in core inflation during the period reflects the lagged effect of the tight monetary policy stance of the Central Bank since early 2016. Furthermore, the base effect resulted by the changes introduced to taxes during 2016 also contributed to the decline in core inflation during the period, amid the increasing
trend recorded during the observed period by both NCPI Core and CCPI Core. Accordingly, year-on-year NCPI core inflation decreased from 7.1 per cent in January 2017 to 4.6 per cent in September 2017 with mixed movements in between months. Annual average NCPI core inflation declined from 6.2 per cent in January 2017 to 5.7 per cent in September 2017, exhibiting mixed movements. Meanwhile, year-on-year CCPI core inflation exhibited a declining trend from 7.0 per cent in January 2017 to 6.0 per cent in September 2017, with mixed movements. Nevertheless, annual average CCPI core inflation increased from 4.7 per cent in January 2017 to 5.8 per cent in September 2017.
Producer Price Inflation
y Producer price inflation exhibited an increasing trend in general during the first eight months of 2017. Producer price inflation is measured by the year-on-year change in the Producer’s Price Index (PPI) (2013 Q4=100), which is compiled by the DCS. The year-on-year changes in the Agriculture, Electricity and Water (Utilities) sub-indices exhibited overall increasing trends with mixed movements. Year-on-year producer price inflation largely followed the trend of the inflation in the Agriculture sub-index during the period, a trend which was also observed in consumer price inflation. Meanwhile, the year-on-year change in the Manufacturing sub-index moved on a decreasing trend during the first eight months of the year.
Chart 4.3Movements of Core Inflation (2016-2017) NCPI (2013=100)
0
1
2
3
4
5
6
7
8
2016 2017
Per c
ent
Jan
Jan
Feb
Feb
Mar
Mar
Apr
Apr
May
May
Jun
JunJul
Jul
Aug
Aug
Sep
Oct
Nov
Dec
Year-on-Year Change Annual Average Change
Sep
Chart 4.4Movements of Core Inflation (2016-2017) CCPI (2013=100)
8
7
6
5
4
3
2
1
0
2016 2017
Per c
ent
Jan
Jan
Feb
Feb
Mar
Mar
Apr
Apr
May
May
Jun
JunJul
Jul
Aug
Aug
Sep
Sep
Oct
Nov
Dec
Annual Average Change Year-on-Year Change

4
49
Prices, Wages, emPloyment and Productivity
Impact of Fiscal Policy Measures on Prices
y There were several fiscal policy measures that had a direct impact on consumer prices during the period under review. The changes in the Value Added Tax (VAT) rate, which were effected since May 2016 led to both upward and downward movements in the consumer price indices in 2016. The impact of changes in the VAT also contributed to the consumer price inflation in 2017 through the base effect. Furthermore, to balance the effect of supply side deteriorations in the Food category, maximum retail prices were imposed on prices of several essential food items including rice. However, the effect of the maximum retail price on observed market prices was marginal. Nevertheless, the maximum retail price imposed on rice prices was removed in August 2017. Moreover, the SCL of several imported food commodities was revised on several occasions to balance supply side developments.
Inflation Expectations
y Inflation expectations respond to changes in Monetary and Fiscal measures, at times with a time lag. Corporate sector inflation expectations reflected an increasing trend since the beginning of 2017 to April 2017. However, a stabilisation of expectations was observed with the exception of the month of June 2017, which had an impact on expectations due to the policy rate change introduced in March 2017. Expectations marginally edged higher in September 2017 as a result of the increase in food items being largely felt by the respondents. Meanwhile, the gap between the near term and long-term expectations of the corporate sector narrowed during the observed period.
Wages
y Wage indices indicate signs of wage pressures in the economy with real wages being on a downward trend due to a slower increase in nominal wages than the increase in inflation. This scenario indicates that nominal wage increases have not been sufficient to match the increase in the rate of inflation, particularly in the Public and Formal Private sectors in the period
January to July 2017. It signals an increase in the wage pressure in the near future leading to possible deteriorations in the labour productivity.
y Nominal wages of public sector employees, as measured by the public sector wage rate index (2012=100), remained unchanged in the first seven months of 2017. However, public sector employees experienced a real wage erosion of 6.9 per cent during the same period. This development is observed subsequent to the growth in nominal and real wages in the public sector by 6.7 per cent and 2.9 per cent, respectively, during the same period of 2016.
y Nominal wages of the employees in the formal private sector, as measured by the minimum wage rate index (1978 December=100) of employees whose wages are governed by the wages boards trades, increased marginally in the first seven months of 2017. Real wages
Chart 4.5Inflation Expectations of the Corporate Sector
8
7 6
5
4 3
2
1
0
2016 2017
Rate
Jan
Jan
Feb
Feb
Mar
Mar
Apr
Apr
May
May
Jun
JunJul
Jul
Aug
Aug
Sep
Sep
Oct
Nov
Dec
Current MonthSurvey Month
3 Months Ahead
Chart 4.6Movements in Real Wage Rate Indices
80.0
90.0
100.0
110.0
120.0
130.0
140.0
150.0
160.0
2015 2016 2017
Jan
Feb
Mar
Apr
May
Jun Jul
Aug
Sep
Oct
Oct
Nov
Nov
Dec
Dec
Jan
Jan
Feb
Feb
Mar
Mar
Apr
Apr
May
May
Jun
JunJul
Jul
Aug
Sep
Public Sector Formal Private Sector Informal Private Sector
Index
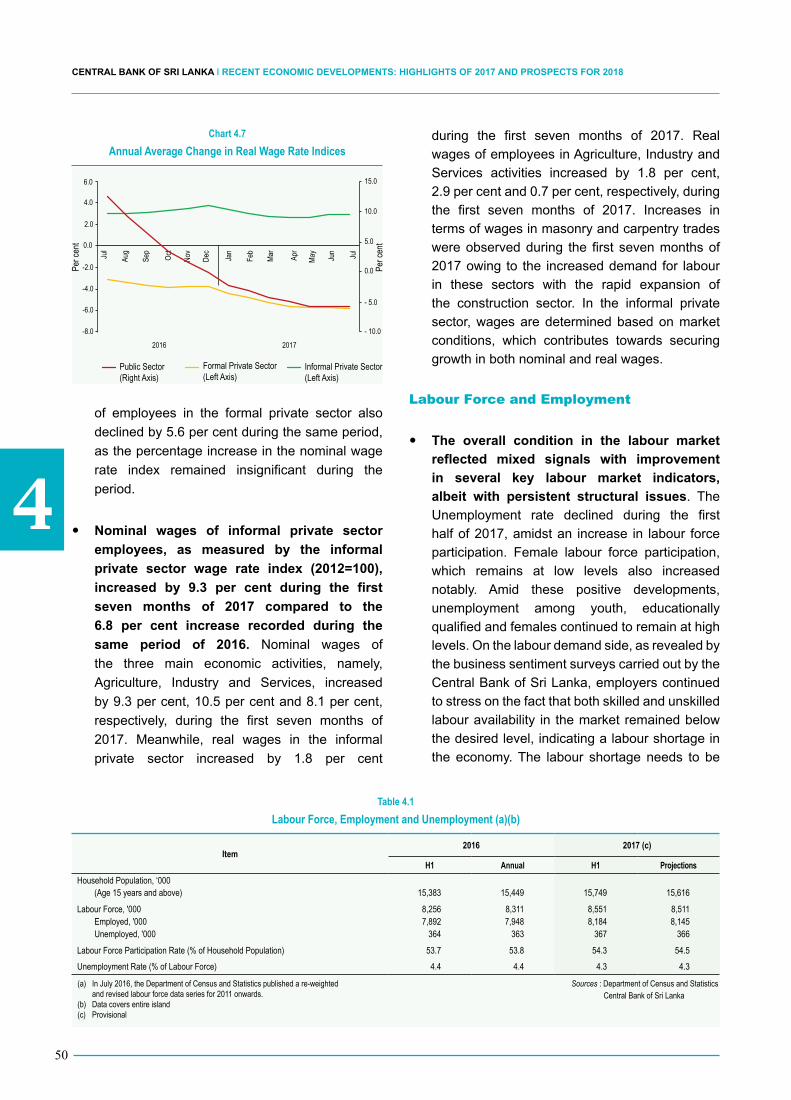
4
50
CENTRAL BANK OF SRI LANKA ǀ RECENT ECONOMIC DEVELOPMENTS: HIGHLIGHTS OF 2017 AND PROSPECTS FOR 2018
of employees in the formal private sector also declined by 5.6 per cent during the same period, as the percentage increase in the nominal wage rate index remained insignificant during the period.
y Nominal wages of informal private sector employees, as measured by the informal private sector wage rate index (2012=100), increased by 9.3 per cent during the first seven months of 2017 compared to the 6.8 per cent increase recorded during the same period of 2016. Nominal wages of the three main economic activities, namely, Agriculture, Industry and Services, increased by 9.3 per cent, 10.5 per cent and 8.1 per cent, respectively, during the first seven months of 2017. Meanwhile, real wages in the informal private sector increased by 1.8 per cent
during the first seven months of 2017. Real wages of employees in Agriculture, Industry and Services activities increased by 1.8 per cent, 2.9 per cent and 0.7 per cent, respectively, during the first seven months of 2017. Increases in terms of wages in masonry and carpentry trades were observed during the first seven months of 2017 owing to the increased demand for labour in these sectors with the rapid expansion of the construction sector. In the informal private sector, wages are determined based on market conditions, which contributes towards securing growth in both nominal and real wages.
Labour Force and Employment
y The overall condition in the labour market reflected mixed signals with improvement in several key labour market indicators, albeit with persistent structural issues. The Unemployment rate declined during the first half of 2017, amidst an increase in labour force participation. Female labour force participation, which remains at low levels also increased notably. Amid these positive developments, unemployment among youth, educationally qualified and females continued to remain at high levels. On the labour demand side, as revealed by the business sentiment surveys carried out by the Central Bank of Sri Lanka, employers continued to stress on the fact that both skilled and unskilled labour availability in the market remained below the desired level, indicating a labour shortage in the economy. The labour shortage needs to be
(a) In July 2016, the Department of Census and Statistics published a re-weighted and revised labour force data series for 2011 onwards.
(b) Data covers entire island(c) Provisional
Sources : Department of Census and Statistics Central Bank of Sri Lanka
Item2016 2017 (c)
H1 Annual H1 ProjectionsHousehold Population, ‘000
(Age 15 years and above) 15,383 15,449 15,749 15,616
Labour Force, '000 8,256 8,311 8,551 8,511Employed, '000 7,892 7,948 8,184 8,145Unemployed, '000 364 363 367 366
Labour Force Participation Rate (% of Household Population) 53.7 53.8 54.3 54.5Unemployment Rate (% of Labour Force) 4.4 4.4 4.3 4.3
Table 4.1Labour Force, Employment and Unemployment (a)(b)
Chart 4.7Annual Average Change in Real Wage Rate Indices
May
Jun Jul
Jul
Aug
Sep
Oct
Nov
Dec
Jan
Feb
Mar
Apr
Formal Private Sector (Left Axis)
Public Sector (Right Axis)
Informal Private Sector(Left Axis)
0.0
6.0
4.0
2.0
-2.0
-4.0
-6.0
-8.0
0.0
15.0
10.0
5.0
- 5.0
- 10.0
2016 2017
Per c
ent
Per c
ent

4
51
Prices, Wages, emPloyment and Productivity
supplemented by an infusion of economically inactive working aged to the economically active category with an improved skill profile, and the creation of a conducive environment to engage in work.
Labour Force
y The working age (15 years and above) household population, which is the key indicator of the potential labour supply in the country increased by around 0.4 million persons (2.4 per cent) during the first half of 2017, compared to the same period of 2016. This increase could be due to the increase in the inward migration of persons and also the internal movement of persons from institutional living to household living2. Meanwhile, females accounted for a share of 54 per cent of the total working age household population, reflecting the importance of increasing the participation of females in the labour force.
y Along with the increase in the working age household population, the labour force, which is the key indicator of the current supply of labour in the economy, increased significantly by 3.6 per cent to 8.551 million persons in the first half of 2017, from 8.256 million in the corresponding period of 2016. The labour force comprises the economically active population aged 15 years and above. In other words, labour force is defined as persons who were employed or unemployed during the reference period of the Labour Force Survey (LFS). Increases in both female and male entrants to the labour force were observed during the period. Labour force in the estate sector and urban sector has increased notably, while that in the rural sector increased only marginally in the first half of 2017 compared to the same period in 2016. Subsequent to the Census of Population and Housing conducted by the DCS in 2012 covering the entire island, the LFS estimates were re-weighted, and published in July 2016 for the first time in Sri Lanka by the
2. The Labour Force Survey (LFS) conducted by the Department of Census and Statistics (DCS) is a household survey which captures the labour force trends in the population that live in households (non-institutional population). Institutional population includes persons living in institutions such as welfare camps, hostels, etc.
DCS, using the rebased Mid-Year Population Estimate (MYPE) published by the Registrar General Department (RGD)3. The intention behind re-weighting was to keep LFS estimates in line with latest population data as practiced by many other countries. Thus, the re-weighted labour market estimates could differ from estimates reported prior to 2016.
y The Labour Force Participation Rate (LFPR), which is the ratio of the labour force to the working age population, increased to 54.3 per cent in the first half of 2017 compared to the 53.7 per cent in the corresponding period of 2016, as a result of a higher increase in the labour force compared to the increase in the working age population. The increase in female LFPR to 36.7 per cent in the first half of 2017 from 35.7 per cent in the first half of 2016 mainly contributed to this development. The male LFPR declined to 74.8 per cent from 75.2 per cent as a result of the higher growth in the male household population than the growth observed in the male labour force during the same period. Overall LFPR and female LFPR have recorded the highest quarterly rate in the first quarter of 2017 compared to past five years, after which a moderation was observed in the second quarter of 2017. There is further potential for the LFPR to be increased particularly through the increase in female LFPR, supporting the desired growth momentum in the economy.
Employment
y The number employed, which reflects the fulfilled labour demand in the economy, increased by 3.7 per cent to 8.184 million in the first half of 2017 compared to 7.892 million in the corresponding period of 2016. This increase was mainly led by the 10.0 per cent increase in the number employed in the Industry sector while numbers employed in the Agriculture and Services sectors increased by 2.3 per cent
3. The Mid-Year Population Estimates (MYPE) published by the Registrar General Department subsequent to the Census of Population and Housing 2012 indicated a decline in mid-year population from 2011 to 2012. Accordingly, Labour Force Estimates were re-weighted to reflect the changes introduced to the mid-yearpopulation and a new series of labour force estimates for the period from 2011 to 2016 was published by the DCS in July 2016, which is in line with international practices.

4
52
CENTRAL BANK OF SRI LANKA ǀ RECENT ECONOMIC DEVELOPMENTS: HIGHLIGHTS OF 2017 AND PROSPECTS FOR 2018
0.9 per cent, respectively, in the first half of 2017. The increase observed in the number employed in the Industry and Service sectors underpin the recent trends in increasing economic activities of those sectors. However, despite the deceleration in economic activities of the Agriculture sector, an increase in the number employed in the Agricultural activities was observed, particularly in the second quarter of 2017. Meanwhile, the Services sector continued to be the foremost employment generator accounting for a 45 per cent share of total employment. The Agriculture and Industry sectors contributed to 26 per cent and 28 per cent shares of total employment, respectively, during the first half of 2017. A possible temporary shift in employment from Agriculture to other sectors can be observed, since farming in certain rural areas of the country no longer remains a viable option, particularly to the youth who are in areas affected by a series of extreme weather conditions in the recent past.
y In terms of employment status, the number employed in all categories increased during the first half of 2017. The increase in employment was prominent in the Employer category, which is encouraging as it would lead to multiple employment generation, as reflected by the 6.2 per cent increase in private sector employment. However, in absolute terms, the private sector employee category mostly contributed to the increase in the number employed in the first half of 2017 compared to the corresponding period of 2016. Employment in the contributing family worker category also increased by 5.1 per cent, which signals an increase in
vulnerable employment4, as these employees are not covered under any labour laws. Meanwhile, the number employed in the self-employed category increased by 0.9 percent. On the other hand, informal employment accounted for 60.2 per cent of total employment in 2016.
y As per the Semi-annual Public Sector Employment Survey conducted by the Central Bank of Sri Lanka, public sector employment stood at 1.398 million at the end of the first half of 2017. The semi-government sector accounted for 17.4 per cent of the total public sector employment, while other types of government institutions accounted for the remaining 82.6 per cent. Ministries, departments and provincial councils accounted for 10.4 per cent, 39.7 per cent, and 29.3 per cent of the total public sector employment, respectively. District secretariats and divisional secretariats accounted for 3.3 per cent of the total public sector employment.
Unemployment
y The unemployment rate reached 4.3 per cent in the first half of 2017 compared to 4.4 per cent in the corresponding period of the previous year. The total number of unemployed persons during the period under review was estimated at 366,734 compared to 363,843 recorded in the same period of the last year, which is an increase of 0.8 per cent. However, the percentage increase in the number unemployed was lower than the percentage increase in the labour force during the period under review, which resulted in a decline in the unemployment rate. Amid these developments, the increase in the number employed indicates that employment opportunities in the economy have increased during this period. The increase in employment opportunities were largely secured by males, as the increase in the number of employed males is greater than that of females. The male unemployment rate declined to 2.9 per cent from 3.1 per cent, reflecting that the increase in male labour force was surpassed
4. Vulnerableemploymentisdefinedasthesumofown-accountworkersandcon-tributing family workers – International Labour Organisation
Chart 4.8Structure of Employment
Informal
60.2 39.817.6
22.2
Formal Public Private

4
53
Prices, Wages, emPloyment and Productivity
by the increase in employment opportunities secured by males. Meanwhile, the female unemployment rate increased to 6.8 per cent from 6.7 per cent. This reflects that the increase in employment opportunities secured by females was lesser than the increase in female labour force. These developments continued to highlight that the employability of females remains low and/or that there is a gap in terms of expectations of female job seekers.
y Disparities among age wise unemployment rates continued to remain notable during the first half of 2017. Youth5 unemployment continued to remain at a significantly high level of 19.3 per cent during the first half of 2017. On the other hand, age groups between 30-39 years, and 40 years and above recorded relatively low unemployment rates of 2.7 per cent and 1.0 per cent, respectively, mainly due to higher human skills and working experience in those groups.
y In terms of the education level, the highest unemployment rate of 8.0 per cent was reported among persons with GCE (A/L) and higher level of educational attainment. High unemployment among the educationally qualified persons can be largely attributed to skills mismatch and lack of experience, variations in expected and actual remuneration packages, gender stereotypes in certain professions and career breaks in the employment history. It could
5. Age between 15-24 years
also be due to the preference to be employed in the public sector with conventional social security arrangements and other benefits rather than seeking opportunities in the more vibrant private sector. Meanwhile, the unemployment rate among the persons with 6-10 years of schooling decreased to 3.2 per cent from 3.4 per cent, while it increased to 5.9 per cent from 5.8 per cent among those who have passed GCE (O/L) during the first half of 2017, compared to the same period of the previous year.
Foreign Employment
y Departures for foreign employment declined in the first half of 2017 by 14.6 per cent, compared to the corresponding period of 2016, leading to a decline in workers remittances by 7.2 per cent for the same period. The continuation of severed ties between Qatar and Saudi Arabia, United Arab Emirates, Bahrain and several other Middle Eastern and African countries, slowdown of the growth of major oil exporting countries and the measures taken to streamline departures under the housemaid category by local authorities mainly contributed to the decline in departures for foreign employment. Male departures and female departures in the first half of 2017 accounted for 66 per cent and 34 per cent of total departures, respectively, while the number of departures in both genders declined by approximately 15 per cent compared to that of the first half of 2016.
y With regard to skill categories, worker departures under all categories declined in the first half of 2017 compared to the corresponding period of 2016. Skill categories, which mainly contributed to the decline were Semi-Skilled, Clerical & Related and Housemaid categories. Implementation of policies to encourage departures under higher skill categories need to be further strengthened to ensure a sustainable growth in remittance inflows in the future. With the objective of improving the skill profile of Sri Lankan migrant workers, three Memorandums of Understanding (MoUs) were signed during the first half of 2017. The first MoU
Chart 4.9Unemployment Rate (2013-2017)
4.7 4.4 4.4
4.1 4.1
4.6
4.2 4.4
4.7 4.5
5.1
4.4 4.2
4.6 4.5 4.5 4.2 4.1
3.0
3.5
4.0
4.5
5.0
5.5
2013 2014 2015 2016 2017
Per c
ent
Q1 Q2 Q2 Q2 Q2 Q2Q3 Q3 Q3 Q3Q4 Q4 Q4 Q4Q1 Q1 Q1 Q1
2013 2014 2015 2016 2017

4
54
CENTRAL BANK OF SRI LANKA ǀ RECENT ECONOMIC DEVELOPMENTS: HIGHLIGHTS OF 2017 AND PROSPECTS FOR 2018
was signed with Singapore to streamline the recruitment and provide protection for overseas workers. The second MoU was signed to provide training to health workers of Sri Lanka and facilitate health sector employment for the trained workers in hospitals of the Kingdom of Saudi Arabia. A third MoU was signed with the Federal Ministry of Economic Affairs and Energy of Germany to facilitate training and employment opportunities in the elderly care sector in Germany.
y A notable decline in the number of licensed employment agencies was observed due to stringent action taken by the Sri Lanka Bureau of Foreign Employment (SLBFE) against foreign employment agencies which have failed to comply with stipulated standards. Continuing the trend observed in the recent past, departures for foreign employment through licensed agents accounted for 36 per cent while departure through private sources accounted for 64 per cent of total departures in the first half of 2017. The SLBFE issued only 3 new licenses in the first half of 2017 compared to 50 new licensed issued in the same period of 2016. The number of licenses renewed fell by 16 to reach 449 in the first half of 2017. The SLBFE conducted 69 raids on illegal recruitment activities during the first six months of 2017 and filed 127 court cases against illegal and licensed agencies which are alleged to have violated the law, in order to ensure trustworthy foreign employment for Sri Lankan migrants. A total of 2,194 new complaints received from migrant workers and 3,079 complaints were settled during the first half of 2017.
y Minimum wages to be paid for migrant workers were increased for all countries with effect from 01st February 2017. Accordingly, the minimum wage to be paid to skilled and unskilled migrants has been raised to USD 450 and USD 350 per month, respectively. The objectives of this measure were to increase the remittance flow from migrant workers, discourage foreign employment in lower salary scales and to encourage skill development of migrant workers. However, a minimum wage regulation will raise the cost of Sri Lankan migrant labour, thereby
affecting the competitiveness of Sri Lankan migrant employees in the international labour market.
Labour Relations
y As per the data reported to the Labour Department pertaining to private industries, labour relations improved in the first half of 2017 in terms of the number of strikes, workers involved and man days lost due to strikes. The number of man days lost declined by 63 per cent to 20,454 in the first half of 2017, compared to 55,219 in the corresponding period of 2016, mainly as a result of the decline in the man days lost in the Plantation sector. Workers involved in strikes declined to 4,559 during the period under review, compared to 13,628 workers involved in the same period, in the previous year. Apart from the strikes in the private industries, publicly available data revealed a number of strikes (14 strikes since the beginning of 2017) in sectors such as health, education, petroleum, postal and transportation, which could have had a significant negative impact on the daily lives of the general public and the social and economic activities of the country.
y The Ministry of Labour and Trade Union Relations implemented a number of programmes to enhance industrial harmony. This includes the introduction of new Acts, amendments to Acts and legal provisions, and the adoption of several precautionary measures to address issues relating to labour, employment and existing regulatory framework. As agreed in the National Labour Advisory Council (NLAC), decisions have been made to amend necessary legislation to address the issues such as low female labour participation, restriction of night work for women, comparatively lower maternity benefits, employment injury, unemployment and the ineffectiveness of the Industrial Dispute Settlement Mechanism. With the purpose of managing the industrial disputes, a decision was made to establish a special Median Unit at the Department of Labour to ensure productivity and sustainability of businesses.

4
55
Prices, Wages, emPloyment and Productivity
Labour Productivity
y Labour productivity measured in terms of Gross Value Added (in 2010 prices) per hour worked decreased by 1.4 per cent to reach Rs. 446.57 per hour worked in the first quarter of 2017 compared to Rs.452.82 in the corresponding period of 2016. All three sectors reported a negative growth in labour productivity when compared to the same period in 2016. In terms of the level of productivity, the Services sector exhibited the most efficient use of the labour resource, recording the highest productivity level of Rs. 524.96 per hour worked, and was closely followed by the Industry sector with a productivity level of Rs 522.26 per hour worked. The decline in productivity in these two sectors during the first quarter of 2017, compared to the corresponding period of the previous year, was mainly due to the addition of new labour to those sectors, as observed by the increase in the number of persons employed in the two sectors. Continuing the trend observed in recent past, the Agriculture sector registered the lowest productivity levels. Accordingly, the Agriculture sector recorded a productivity level of Rs. 159.61 per hour worked during the first quarter of 2017, which is a decline compared to the level recorded in the corresponding period of the previous year. This is largely due to the decline in the Gross Value Added in the Agriculture sector, caused by adverse weather conditions despite the decline in the number employed.
Expected Developments
Prices
y Inflation is expected to remain above the mid-single digit levels during the remainder of 2017. Disturbed weather patterns in the recent past led to significant persistent supply disruptions of fresh food. Particularly, prices of vegetables, rice and coconuts, which already caused the general price level to reach an elevated level are expected to exhibit downward rigidities in the short run. If revisions to administered prices are introduced, inflation in the Non-food category would also
increase. Furthermore, international commodity prices, which remained at benign levels in the recent past also show signs of increase. Along with the weakening of the domestic currency, the impact of the price developments in imported commodities will be more prominent on the domestic price level. Nevertheless, well anchored inflation expectations and forward-looking demand management policies are expected to contain inflation at single digits in the short run.
Wages and Productivity
y The real wage erosion in both the formal private and public sectors signals a buildup of wage pressures and also possible productivity deteriorations in the near future. The composite wage rate index, which measures the weighted average real wage growth across the public, formal private and informal private sectors has experienced a real wage erosion from the beginning of 2017. In such an environment, pressures remain high for wages to increase and productivity to decline. With respect to attracting Foreign Direct Investments (FDIs), Sri Lanka should focus more on cost competitiveness and productivity. In order to benefit from the available opportunities through regained market access to a greater global consumer base through GSP+ and upcoming trade agreements, the production capacities as well as productivity must be improved. As such, a range of measures has to be taken to improve productivity in the economy including skill upgrading, adoption of new technology, alignment of attitudes of the workforce and adjustments to wages associated with productivity linked incentives.
y Low productivity levels in the Agriculture sector amid the real wage erosion would lead to further declines in productivity in the sector, contributing to other social and economic disturbances. Considering the significant percentage of people employed in the Agriculture sector, the living standards of a large number of persons who are depending on the sector would also deteriorate. Apart from lack of new technologies, the decline in productivity in the Agriculture sector is also caused by

4
56
CENTRAL BANK OF SRI LANKA ǀ RECENT ECONOMIC DEVELOPMENTS: HIGHLIGHTS OF 2017 AND PROSPECTS FOR 2018
frequent extreme weather conditions. Ultimately, the volatilities in the Agriculture sector affect the prices of fresh food, leading to high inflation, affecting the economy and the people.
y Real wage erosion in the economy can be remedied through correcting the skewness of the current tax structure from indirect to direct taxes. The current tax structure’s skewness towards indirect taxes cause real wage erosion through the increase in inflation. Irrespective of the income level, the average consumer is compelled to pay a certain amount of taxes at the point of purchasing/consuming goods and services. These indirect taxes raise the cost of goods and services and in turn, inflation, leading to a real wage erosion. Thus, apart from remedying the real wage erosion through arrangements such as increasing the nominal wage levels, the erosion should be looked at from different aspects in which remedies can be offered, such as expedited reforms to the tax structure and productivity linked compensation packages.
Labour Force and Employment
y The skills gaps and other deficiencies in the labour market need to be addressed through public private partnerships, and should reach the rural youth. The persistent skill gaps and high level of unemployment among youth and females need to be continuously remedied through critical involvement by the private sector through need analysis based employment opportunities. The current initiatives by both the Government and Private sector institutions to address this issue is encouraging. Large scale campaigns on breaking the stigmas and gender stereotypes around certain professions are occurring at a leveraged scale through the participation of both government and private institutions. However, these campaigns should continue to reach the rural and poverty ridden youth with an intention of providing well targeted sustainable solutions. Such arrangements would lead to reducing the youth NEET (Not in Employment, Education or Training) ratio, and would address issues such as long term unemployment and underemployment. Further, it is important that the upskilling initiatives
are carried out with proper coordination of all agencies involved. The training institutions and programme curricula need to be dynamic and should focus on the employability of participants in labour shortage and emerging sectors while phasing out obsolete courses in the consultation and participation of private sector institutions. If the training is not linked to labour market needs, it may create unrealistic expectations and will not provide income generating opportunities. Furthermore, if the domestic skilled labour supply does not cater to the emerging industries, it is necessary to facilitate the import of labour through appropriate legal provisions to support such industries.
y The existence of a large informal sector would need to be addressed gradually to reduce vulnerability of employment and also to ensure that labour standards of the country are maintained at desirable levels. The current employment structure of the country reflects 60.2 per cent of employees in the informal sector, of which a part of this segment might not have the benefit of proper superannuation schemes. Facilitating the availability of self-contributory superannuation schemes and increasing the awareness on the importance of such measures have to be mobilised for the workers to retire gracefully and also be able to meet the future challenges of an ageing population. Policy reforms need to be introduced to support innovative entrepreneurs in the informal economy through improved access to finance. An arrangement to standardize all professions through a process of progressive licensing based on their competencies will remove informality of employment, provide recognition and acceptance towards certain professions and also improve labour standards in the economy. This will also help to stipulate minimum wages for workers based on selected brand categories of professional skills supporting to improve the quality of labour available in the country.
y Labour law reforms need to be initiated with a borderless international focus to facilitate new initiatives including the Hub Concept and the Colombo International Financial Center (CIFC). Labour laws are required to promote the

4
57
Prices, Wages, emPloyment and Productivity
creation of sustainable, productive and permanent employment while discouraging unprotected part-time and casual employment. As such, reforms should be initiated facilitating flexible and night time work (with adequate incentives and facilities ensuring safety and suitable working conditions for workers), spread over of working hours, market determination of wages and productivity linked incentives that would create novel working conditions which are beneficial for both employers and employees. Such initiatives would stimulate productivity progression, improve the potential to attract FDIs and ultimately improve the living standards through facilitating the economic growth.
y As per the Gender Statistics published by the DCS, there is high potential for the female population to contribute towards enhancing economic activities. Although females make up more than half of the success events at most education levels from Grade 5 scholarship examination through university entry, their contribution to economic activity is far below the potential, as reflected by persistently low female LFPRs. National level action has to be taken to attract females in to the labour force through increasing the availability of affordable and reliable child care facilities, safe transportation and accommodation facilities, enabling working from home, part time and flexible work options and also encouraging the private sector in expanding economic activities to the regional level, as well as strengthening the labour contracts including regulations to address gender discrimination.
y Current demographics of the country indicate very high potential for child care and elderly care industries. Since females make up the majority in the working age population amid a
very low LFPR due to engaging in household responsibilities, it is required to attract more females into the labour force to meet the labour demand in the economy. Relieving household responsibilities from females will contribute in encouraging females to be economically active. Facilitating the creation of child care facilities for young children and day hostels for children of higher ages will generate employment opportunities for interested service providers and will provide time and space for service receivers also to be economically active. Furthermore, it is predicted that elderly persons will consist of 20 per cent of the population in Sri Lanka by 2030, which reflects the potential for elderly care facilities in the future. Furthermore, differently abled persons consist of around 7.9 per cent (1.6 million persons) of the population6. Inclusion of differently abled persons in income generating activities depending on their abilities will empower them by creating self-reliance, financial strength and dignity, while providing them an opportunity to contribute in the development process of the country.
y The subjects introduced in the Professional Stream under the pilot project to certify 13 year education by the Government adds value to the free education system by trying to ensure readiness to labour market requirements. Under this scheme, the students will be able to pursue a stream of education of their interest after sitting for the G.C.E. Ordinary Level Examination while the subjects introduced target on developing the soft skills of students. If implemented with proper resources, the young generation will be ready to take up opportunities in the domestic labour market after the successful completion of a 13 year education.
6. Census of Housing and Population (2012) conducted by the DCS

4
58
CENTRAL BANK OF SRI LANKA ǀ RECENT ECONOMIC DEVELOPMENTS: HIGHLIGHTS OF 2017 AND PROSPECTS FOR 2018

ExtErnal SEctor DEvElopmEntS
5S ri Lanka’s external sector showed signs of improvement in 2017 as the pressure on the
Balance of Payments (BOP) continued to ease with higher inflows to the financial account, despite the increased current account deficit. The current account deficit increased to US
dollars 1,466 million during the first half of 2017, from US dollars 644 million in the corresponding period of 2016. This expansion in the current account deficit was particularly due to the widened trade deficit owing to higher imports recorded during the first half of the year, amidst the gradual pickup in exports since March, moderate earnings from tourism with the partial closure of the Bandaranaike International Airport (BIA) for resurfacing of the runway as well as health advisories related to an increase in dengue cases and the decline in workers’ remittances amidst the slowdown in the Middle Eastern economies. Conversely, the financial account, which was under pressure due to higher foreign exchange outflows during the first quarter of 2017, improved substantially during the second quarter. Increased investor confidence brought about by the successful completion of the Second Review of the IMF Extended Fund Facility (IMF - EFF) and the gradual stabilisation of US bond yields positively contributed to this improvement in the financial account. Accordingly, foreign investment in the government securities market increased substantially in the second quarter of 2017, offsetting the impact of higher withdrawals during the first quarter. The financial account was also augmented by inflows to the Colombo Stock Exchange (CSE), foreign direct investment (FDI), and proceeds of the eleventh International Sovereign Bond (ISB) and the foreign currency term financing facility obtained by the government. Reflecting these developments, the BOP recorded an overall surplus of US dollars 2,037 million by end September 2017. Improved external sector performance facilitated the Central Bank’s policy of implementing a more market-based exchange rate. Accordingly, the Central Bank limited its intervention in the foreign exchange market only to build up international reserves with a minimal impact on the exchange rate. With the Central Bank purchases of US dollars 1,161 million from the market, on a net basis during the first nine months of the year, the level of gross official reserves improved to US dollars 7.3 billion, equivalent to 4.2 months of imports, by end September 2017, from US dollars 6.0 billion at end 2016. During the year up to end September, the external value of the Sri Lankan rupee remained relatively stable, depreciating only by 2.2 per cent against the US dollar. However, an adjustment in the current account through an improved trade balance and higher foreign investment inflows, particularly in the form of export-oriented FDI, is needed for the recent positive developments in the external sector to be sustained in the medium term.

5
60
CENTRAL BANK OF SRI LANKA ǀ RECENT ECONOMIC DEVELOPMENTS: HIGHLIGHTS OF 2017 AND PROSPECTS FOR 2018
months of 2016, increased significantly by 20.1 per cent to US dollars 1,003 million during the first eight months of 2017. This was mainly due to high average export prices of tea despite the decline in export volumes by 3.6 per cent. Reflecting the higher tea prices in the international market, the average export price of tea increased by 24.6 per cent to US dollars 5.27 per kg during the first eight months of 2017 compared to US dollars 4.23 per kg recorded in the same period of 2016. Export earnings from spices increased by 28.1 per cent (year-on-year) to US dollars 249 million during the first eight months of 2017 mainly due to the increase in export volumes of cloves and cinnamon. Export earnings from cloves increased more than four-fold during the first eight months of 2017, while earnings from cinnamon increased by 18.7 per cent (year-on-year). Further, earnings from seafood exports rose by 40.4 per cent (year-on-year) to US dollars 155 million during the first eight months of 2017 following the removal of the ban on exports of fisheries products to the EU market in June 2016 together with the regaining of the GSP+ facility. Accordingly, earnings from seafood exports to the EU market increased significantly by 118.3 per cent (year-on-year), benefiting from the high demand from France, the UK, Italy, Germany and Netherlands. In addition, earnings from minor agricultural products, such as betel leaves and fruits as well as rubber and unmanufactured tobacco contributed to the growth in earnings from agricultural exports during this period. Earnings from coconut exports also increased marginally by 0.7 per cent
Trade in Goods and Trade Balance
y External trade, which indicated a sluggish performance during the past two years, rebounded during the first eight months of 2017. Both earnings from exports and expenditure on imports increased during this period. However, the overall trade deficit expanded during the first eight months of 2017, owing to a significant increase in import expenditure compared to export earnings. Accordingly, the deficit in the trade account widened to US dollars 6,186 million during the first eight months of 2017 from US dollars 5,515 million in the corresponding period of 2016.
y Benefitting from several positive developments, earnings from exports revived during the first eight months of 2017. Earnings from exports increased by 7.6 per cent to US dollars 7,413 million during the first eight months of 2017, from US dollars 6,888 million in the corresponding period of 2016. This was owing to the recovery in key export markets, increased commodity prices in the international market, conducive external trade policies together with institutional support, the gradual depreciation of the exchange rate, the removal of the ban on exports of Sri Lankan fisheries products to the European Union (EU) and the reinstatement of the EU GSP+ facility.1 Exports of all major categories increased during this period and the highest contribution to the growth in exports was from agricultural exports (56.1 per cent), followed by industrial exports (42.8 per cent).
y Earnings from agricultural exports, which account for about a quarter of total exports, showed a strong performance during the first eight months of 2017, registering a 19.4 per cent year-on-year growth to reach US dollars 1,815 million. Higher export earnings from tea, spices and seafood largely contributed to this growth. Earnings from tea exports, which declined by 7.3 per cent (year-on-year) during the first eight
1 EU GSP+ was granted to Sri Lanka from July 2005. However, the lack of progress in 27 specified international conventions in the fields of core human and labour rights, the environment and good governance led to Sri Lanka losing the GSP+ facility in August 2010. This facility was regained in May 2017 allowing the country to export 66 per cent of its products tax-free to the European market.
Sources : Sri Lanka Customs Central Bank of Sri Lanka
Chart 5.1 External Trade Performance
2013 2014 2015 2016 2016 Jan-Aug
2017 Jan-Aug
ImportsExports Trade Balance
US$ b
illion
-15
-10
-5
0
5
10
15
20
25

5
61
ExtErnal SEctor DEvElopmEntS
(year-on-year) to US dollars 240 million, owing to an increase in earnings from non-kernel coconut products exports by 7.0 per cent, despite the poor performance registered in coconut kernel products, particularly in desiccated coconut exports.
y Earnings from industrial exports, which account for around 75 per cent of total exports, increased by 4.2 per cent (year-on-year) to US dollars 5,562 million during the first eight months of 2017. This was mainly due to higher export earnings from petroleum products, transport equipment, and machinery and mechanical appliances. Earnings from exports of petroleum products increased by 36.3 per cent (year-on-year) during the first eight months of 2017, owing to the increased export volumes and high prices for bunkering fuel in the international market. Earnings from transport equipment increased by 70.7 per cent (year-on-year) to US dollars 138 million during the first eight months of 2017, due to the export of three ships to Singapore. Further, earnings from machinery and mechanical appliances registered a 20.9 per cent growth (year-on-year) during this period due to increases recorded in all sub categories except for electronic equipment. In addition, export earnings from food, beverages and tobacco, rubber products, base metals and articles, and wood and paper products also increased during this period. However, earnings from textiles and garments, which account for more than 44 per cent of total exports, declined by 1.5 per cent (year-on-year) to US dollars 3,283 million during the first eight months of 2017, reflecting the decline in the exports of garments to the EU and USA, the main traditional markets for Sri Lankan garment exports, particularly in the first half of the year. In contrast, garment exports to non-traditional markets such as Canada, Australia, Hong Kong, Mexico and the UAE increased during this period. Although, export earnings from textiles and garments reported a decline in the first eight months of the year, on a cumulative
basis, a notable increase was recorded during the months of July and August 2017, signalling the positive impact of the restoration of the GSP+ facility in May 2017. Meanwhile, earnings from gems, diamonds and jewellery, and leather, travel goods and footwear declined by 11.0 per cent and 7.5 per cent to US dollars 167 million and US dollars 107 million, respectively, during the period under review.
y Earnings from the export of mineral products increased by 24.6 per cent (year-on-year) to US dollars 25 million during the first eight months of 2017. All sub categories, particularly exports of earths and stones, contributed to the growth in earnings from mineral exports during this period.
y Expenditure on imports increased by 9.6 per cent (year-on-year) to US dollars 13,599 million during the first eight months of 2017. High commodity prices in the international market, increased reliance on thermal power generation due to drought conditions and measures taken to import rice to meet the shortage in the domestic supply led to an increase in expenditure on imports during the first eight months of 2017. Meanwhile, expenditure on non-fuel imports grew by 5.0 per cent to US dollars 11,446 million during this period.
Chart 5.2Composition of Exports (Jan-Aug 2017)
Mineral and Other Exports 1% (US$ 36 mn)
Textiles and Garments 44% (US$ 3,283 mn)
Spices 3% (US$ 249 mn)
Rubber Products 7% (US$ 538 mn)
Other Agricultural Products 4%(US$ 324 mn)
Gems, Diamonds and Jewellery 2% (US$ 167 mn)
Tea 14% (US$ 1,003 mn)
Petroleum Products 3% (US$ 253 mn)
Coconut 3% (US$ 240 mn)
Machinery and Mechanical Appliances 3% (US$ 242 mn)
Food, Beverages and Tobacco 4% (US$ 259 mn)
Other Industrial Exports 12%
(US$ 820 mn)
Sources : Ceylon Petroleum Corporation and Other Exporters of Petroleum
National Gem and Jewellery Authority Sri Lanka Customs Central Bank of Sri Lanka

5
62
CENTRAL BANK OF SRI LANKA ǀ RECENT ECONOMIC DEVELOPMENTS: HIGHLIGHTS OF 2017 AND PROSPECTS FOR 2018
y Imports of intermediate goods largely contributed to the expansion in expenditure on imports. Expenditure on intermediate goods, which accounts for more than half of total imports, increased by 15.3 per cent (year-on-year) to US dollars 7,272 million during the first eight months of 2017, mainly driven by high fuel imports. Expenditure on fuel imports increased by 43.4 per cent (year-on-year) to US dollars 2,153 million during this period, mainly due to the increase in import expenditure on refined petroleum products by 54.0 per cent (year-on-year) to US dollars 1,588 million, reflecting the impact of price increases in the international market as well as the increase in import volumes. Import expenditure on crude oil and coal also increased during the period, owing to increased prices in the international market and increased demand from the domestic power generation sector. The average import price of crude oil increased by 25.2 per cent to US dollars 54.38 per barrel during the first eight months of 2017, in comparison to US dollars 43.44 per barrel recorded during the corresponding period of 2016. Meanwhile, import expenditure on diamonds, precious stones and metals grew by 58.6 per cent (year-on-year) to US dollars 475 million during the first eight months of 2017, mainly due to the increase in gold imports by 90.6 per cent to US dollars 403 million, owing to the high volumes imported following the removal of the Port and Airport Development Levy (PAL) on gold imports with effect from January 2016. Increases in expenditure on imports of base metals (41.5 per cent), wheat and maize (36.9 per cent) and food preparation (29.7 per cent) also contributed towards the increase in intermediate goods imports during the first eight months of 2017. Expenditure on textiles and textile articles imports increased marginally by 0.9 per cent (year-on-year) during the first eight months of 2017. In line with the improved performance observed in export earnings from textiles and garments, following the restoration of the GSP+ facility, the import of raw material for textiles and garment industry is expected to increase in the future. However, import expenditure on fertiliser, mineral products and chemical products decreased by 35.4 per cent, 22.4 per cent and 3.2 per cent, respectively, during the period concerned.
y With respect to the consumer goods category, import expenditure on food and beverages increased during the first eight months of 2017, while expenditure on non-food consumer goods declined. The overall import expenditure on consumer goods, which accounts for around 22 per cent of total imports, increased by 4.5 per cent to US dollars 2,952 million during the first eight months of 2017 from US dollars 2,825 million in the corresponding period of 2016. Import expenditure on food and beverages increased by 15.9 per cent to US dollars 1,204 million, mainly due to the high expenditure on rice and dairy products. A continuous increase in rice imports was recorded since January 2017, as a result of the measures taken by the government to encourage rice imports to meet the shortage in the domestic supply. Accordingly, the import volume of rice increased to 446 million kg during the first eight months of 2017 from 18 million kg recorded during the corresponding period of 2016. The import expenditure on dairy products also increased by 29.2 per cent (year-on-year) during the first eight months of 2017, reflecting to a larger extent higher average import prices for milk powder that prevailed in the international market amidst global supply disturbances. In addition, expenditure on fruits, and oils and fats contributed towards the higher import outlays on food and beverages during the period. However, import expenditure on spices and vegetables declined during the first eight months of 2017. Meanwhile,
Other Imports 1% (US$ 137 mn)
Food and Beverages 9% (US$ 1,204 mn)
Non - Food Consumer Goods 13%(US$ 1,748 mn)
Fuel 16%(US$ 2,153 mn)
Textiles and Textile Articles 13%(US$ 1,781 mn)
Other Intermediate Goods 24%
(US$ 3,338 mn)
Investment Goods 24% (US$ 3,238 mn)
Chart 5.3 Composition of Imports (Jan-Aug 2017)
Sources : Ceylon Petroleum Corporation Lanka IOC PLC Sri Lanka Customs Central Bank of Sri Lanka

5
63
ExtErnal SEctor DEvElopmEntS
expenditure on non-food consumer goods imports declined by 2.1 per cent (year-on-year) to US dollars 1,748 million, mainly due to the decline in vehicles for personal use, and medical and pharmaceutical items. However, import expenditure on telecommunication devices, and clothing and accessories increased during the period under review.
y Expenditure on investment goods imports declined marginally during the first eight months of 2017. Expenditure on imports of investment goods decreased by 0.7 per cent to US dollars 3,238 million during the first eight months of 2017 due to reduced imports of machinery and equipment, which declined by 4.2 per cent (year-on-year). This was driven by a reduction in the imports of machinery for the textile industry and agricultural activities, electric motors and generating sets, turbines and telecommunication devices, despite the increase in imports of engineering equipment as well as machines for office work. However, import expenditure on building materials increased by 2.8 per cent to US dollars 1,055 million during the first eight months of 2017, due to higher import expenditure on iron and steel, aluminium articles, wood products, and insulated wires and cables. Import expenditure on transport equipment also increased by 5.9 per cent, due to higher imports of tankers, bowsers and vans.
Terms of Trade
y The terms of trade, on average, increased during the first eight months of 2017 in comparison to the corresponding period in 2016, reflecting a higher increase in the export price index relative to the increase in the import price index. The overall export price index rose moderately by 1.5 per cent (year-on-year) to 95.8 index points during the first eight months of 2017 due to increases in prices of agricultural exports. The export price index for agricultural products increased by 13.1 per cent (year-on-year) during the first eight months of 2017, mainly on account of a 23.3 per cent increase in tea prices, in line with the high prices
prevailing in the international market. However, the export price index for industrial products decreased by 1.8 per cent (year-on-year) due to the decline in the average price of many sub categories, particularly transport equipment, machinery and mechanical appliances, base metals and articles, wood and wood products, and plastics and articles. Reflecting higher fuel prices in the international market, the price index of petroleum product exports increased substantially by 27.4 per cent during the first eight months of 2017. Meanwhile, the overall import price index increased marginally by 0.4 per cent during the first eight months of 2017, due to higher prices of intermediate goods despite the decline in prices of investment and consumer goods. The intermediate goods import price index increased by 2.9 per cent, reflecting a 21.6 per cent increase in the fuel price index, despite the reduction in prices of most of the other intermediate goods imports, particularly fertiliser, mineral products, plastic and articles thereof, and diamonds, precious stones and metals. Meanwhile, the price index for investment goods imports declined during the first eight months of 2017, indicative of lower prices in machinery and equipment, and building materials. The price index for consumer goods declined during the period as a result of lower prices, on average, for food and beverages, and non-food consumer goods. Accordingly, the terms of trade improved by 1.0 per cent to 103.7 index points during the first eight months of 2017 over the corresponding period in 2016. Further, excluding oil-related products, the terms of trade recorded an increase of 2.8 per cent.
85.0
95.0
105.0
115.0
125.0
Source : Central Bank of Sri Lanka
Chart 5.4Terms of Trade and Trade Indices
Terms of TradeImport Unit Value Index
Export Unit Value Index
2014 2015 2016 2017 Jan - Aug
Index
Poin
ts (2
010=
100)

5
64
CENTRAL BANK OF SRI LANKA ǀ RECENT ECONOMIC DEVELOPMENTS: HIGHLIGHTS OF 2017 AND PROSPECTS FOR 2018
Trade in Services
y The surplus in the services account increased during the first half of 2017, as earnings from services exports outgrew expenditure on services imports. Accordingly, the services account of the BOP, which mainly consists of travel, transport and telecommunication, computer and information services, recorded a surplus of US dollars 1,407 million during the first half of 2017 compared to a surplus of US dollars 1,314 million during the corresponding period of 2016.
y Gross inflows on account of transport services, which consist of passenger fares, freight charges, and port and airport related activities, grew moderately during the first half of the year 2017. Accordingly, gross earnings from transport services registered a growth of 3.9 per cent to reach US dollars 1,182 million during this period. Meanwhile, outflows on account of transportation services increased at a higher rate of 5.3 per cent to US dollars 872 million, largely due to the increased port and airport related service payments, particularly the higher spending incurred on freight and air travel services. Inflows relating to passenger fares increased by 2.9 per cent to US dollars 568 million during the first half of 2017. The slowdown of earnings from passenger fares particularly in the first quarter of the year could be mainly attributed to the drop in the number of passengers travelling to Sri Lanka as a result of the partial closure of the Bandaranaike International Airport (BIA) during January to April 2017 for the re-laying of the runway. Meanwhile, with the expansion in port related activities, inflows on account of freight charges, with respect to both port and airport related activities, increased during the first half of 2017. Gross inflows from freight charges increased by 4.9 per cent to US dollars 614 million, mainly due to the increased cargo, container and transhipment volumes handled at the port of Colombo.
y The tourism industry indicated some moderation during the first nine months of 2017 while remaining a major foreign exchange earner to the country. Although tourist arrivals crossed the 2 million milestone for the first time in 2016, the performance of the industry during the first nine months of 2017 was moderate, as tourist arrivals recorded a subdued growth of 2.9 per cent (1,551,931 arrivals) over the corresponding period of 2016. Flight cancellations and delays at the BIA until April 2017, caused by partial operations of the airport owing to the repair and upgrade of the runway, and the breakout of dengue epidemic partly contributed to the sluggish performance in the tourism industry. Tourists from Western Europe dominated arrivals, followed by South Asia and East Asia. However, tourist arrivals from the South Asian region recorded a marginal decline compared to the first nine months of 2016, mainly due to the decline in arrivals from Maldives by 17.3 per cent. In terms of country origin, arrivals from India, the major tourist origin for Sri Lanka, increased by 6.1 per cent to 267,601, while a moderate decline was recorded in arrivals from China.
y Following the trend in tourist arrivals, earnings from tourism2 recorded a moderate growth during the first half of 2017. On a cumulative basis, earnings from tourism increased by 4.8 per cent to US dollars 1,733.6 million during the first
2 This provisional estimate may be revised once the Sri Lanka Tourism Development Authority releases its survey results on average stay period and average spending per day estimates for 2017.
Chart 5.5 Tourist Arrivals and Earnings from Tourism
Tour
ist A
rriva
ls ('0
00)
Earn
ings f
rom
Tour
ism (U
S$ m
illion
)
Arrivals Earnings (Right Axis)
2014 2015 2016 2016Jan-Sep
2017Jan-Sep
4,000
500
0
1,000
1,500
2,000
2,500
3,000
3,500
2,2002,0001,8001,600
1,4001,2001,000 800 600 400 200 0
Sources : Sri Lanka Tourism Development Authority Central Bank of Sri Lanka
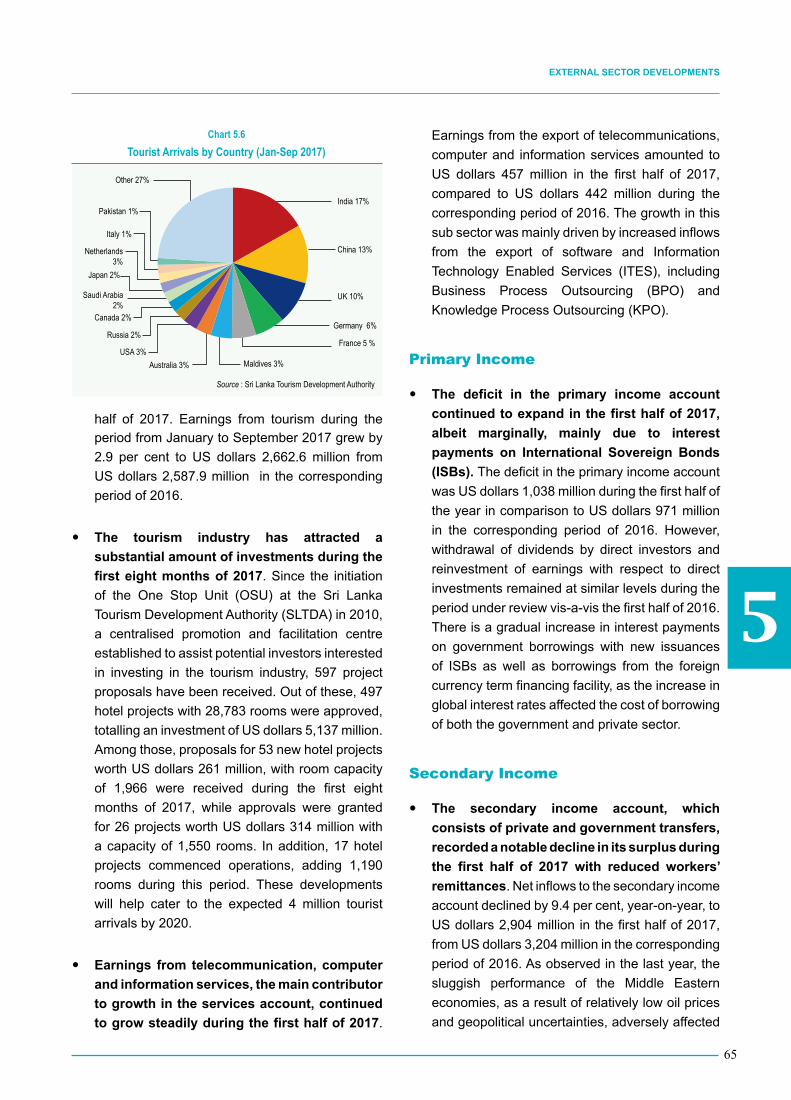
5
65
ExtErnal SEctor DEvElopmEntS
half of 2017. Earnings from tourism during the period from January to September 2017 grew by 2.9 per cent to US dollars 2,662.6 million from US dollars 2,587.9 million in the corresponding period of 2016.
y The tourism industry has attracted a substantial amount of investments during the first eight months of 2017. Since the initiation of the One Stop Unit (OSU) at the Sri Lanka Tourism Development Authority (SLTDA) in 2010, a centralised promotion and facilitation centre established to assist potential investors interested in investing in the tourism industry, 597 project proposals have been received. Out of these, 497 hotel projects with 28,783 rooms were approved, totalling an investment of US dollars 5,137 million. Among those, proposals for 53 new hotel projects worth US dollars 261 million, with room capacity of 1,966 were received during the first eight months of 2017, while approvals were granted for 26 projects worth US dollars 314 million with a capacity of 1,550 rooms. In addition, 17 hotel projects commenced operations, adding 1,190 rooms during this period. These developments will help cater to the expected 4 million tourist arrivals by 2020.
y Earnings from telecommunication, computer and information services, the main contributor to growth in the services account, continued to grow steadily during the first half of 2017.
Earnings from the export of telecommunications, computer and information services amounted to US dollars 457 million in the first half of 2017, compared to US dollars 442 million during the corresponding period of 2016. The growth in this sub sector was mainly driven by increased inflows from the export of software and Information Technology Enabled Services (ITES), including Business Process Outsourcing (BPO) and Knowledge Process Outsourcing (KPO).
Primary Income
y The deficit in the primary income account continued to expand in the first half of 2017, albeit marginally, mainly due to interest payments on International Sovereign Bonds (ISBs). The deficit in the primary income account was US dollars 1,038 million during the first half of the year in comparison to US dollars 971 million in the corresponding period of 2016. However, withdrawal of dividends by direct investors and reinvestment of earnings with respect to direct investments remained at similar levels during the period under review vis-a-vis the first half of 2016. There is a gradual increase in interest payments on government borrowings with new issuances of ISBs as well as borrowings from the foreign currency term financing facility, as the increase in global interest rates affected the cost of borrowing of both the government and private sector.
Secondary Income
y The secondary income account, which consists of private and government transfers, recorded a notable decline in its surplus during the first half of 2017 with reduced workers’ remittances. Net inflows to the secondary income account declined by 9.4 per cent, year-on-year, to US dollars 2,904 million in the first half of 2017, from US dollars 3,204 million in the corresponding period of 2016. As observed in the last year, the sluggish performance of the Middle Eastern economies, as a result of relatively low oil prices and geopolitical uncertainties, adversely affected
India 17%
UK 10%
China 13%
Germany 6%
France 5 %
Maldives 3%
Russia 2%
Australia 3%
Japan 2%
USA 3%
Saudi Arabia 2%
Canada 2%
Netherlands 3%
Pakistan 1%
Italy 1%
Other 27%
Chart 5.6 Tourist Arrivals by Country (Jan-Sep 2017)
Source : Sri Lanka Tourism Development Authority

5
66
CENTRAL BANK OF SRI LANKA ǀ RECENT ECONOMIC DEVELOPMENTS: HIGHLIGHTS OF 2017 AND PROSPECTS FOR 2018
the growth in workers’ remittances during 2017 as well. Moreover, according to data provided by the Sri Lanka Bureau of Foreign Employment, labour migration for foreign employment under each skill category declined, reducing the overall labour migration rate significantly by 14.6 per cent during the first half of 2017, in comparison to the corresponding period of the previous year. This may have also contributed towards the decline of workers’ remittances. Meanwhile, workers’ remittances have declined by 7.4 per cent to US dollars 4,985 million during the first nine months of 2017 compared to US dollars 5,382 million recorded during the corresponding period in 2016.
Current Account Balance
y Sri Lanka’s current account deficit further widened in the first half of 2017, deviating from the expected improvement for the year, mainly due to increased drought related imports, slower pick up in exports, moderation in tourist earnings and decline in workers’ remittances. The trade balance deteriorated significantly despite the pickup in export earnings since March 2017, as exports proceeds were insufficient to offset the substantial increase in import expenditure. The increase in import expenditure during the first half of the year was mainly due to higher expenditure on drought related imports of fuel and rice. The higher importation of gold also contributed to the increase in import expenditure during the period under review. Moreover, the deficit in the primary income account widened during the year up to end June, driven mostly by increased interest payments. The surplus in the services account also moderated during the period primarily due to the subdued performance of the travel and transport subsectors, while inflows to the secondary income account, which mainly consists of workers’ remittances, declined considerably, exerting more pressure on the current account of the BOP. As a result, the current account deficit
widened to US dollars 1,480 million in the first half of 2017, from a deficit of US dollars 644 million in the corresponding period of 2016.
Capital Account Balance
y Net inflows to the capital account remained modest in the first half of 2017. Net inflows to the capital account amounted to US dollars 8 million in the first half of the year from US dollars 1 million in the first half of 2016. The significance of the capital account in the overall context of the balance of payments has diminished over the past few years as capital grants to the government have reduced with Sri Lanka’s elevation to a lower middle-income country status in 2010.
Financial Account
y The financial account recorded a mixed performance in the first half of 2017. The financial account witnessed significant outflows in the first quarter of 2017, primarily due to considerable foreign investment outflows from the government securities market. Low foreign investments in the CSE as well as low levels of direct investments during the first quarter of the year also affected the performance of the financial account. However, a reversal in financial flows was witnessed in the second quarter of the year, with increased investor confidence brought by the continuation of the IMF-EFF program as well as the gradual stabilisation of US government bond yields. Consequently, there were steady inflows to the government securities market in the second quarter of the year, while net foreign inflows to the CSE were also witnessed during this period. The eleventh international sovereign bond (ISB) and the foreign currency term financing facility obtained by the government were the major sources of foreign inflows to the financial account of the BOP.
y Foreign Direct Investment (FDI) inflows improved substantially in the first half of 2017 compared to the first half of 2016. Total FDI inflows, inclusive of foreign loans to BOI
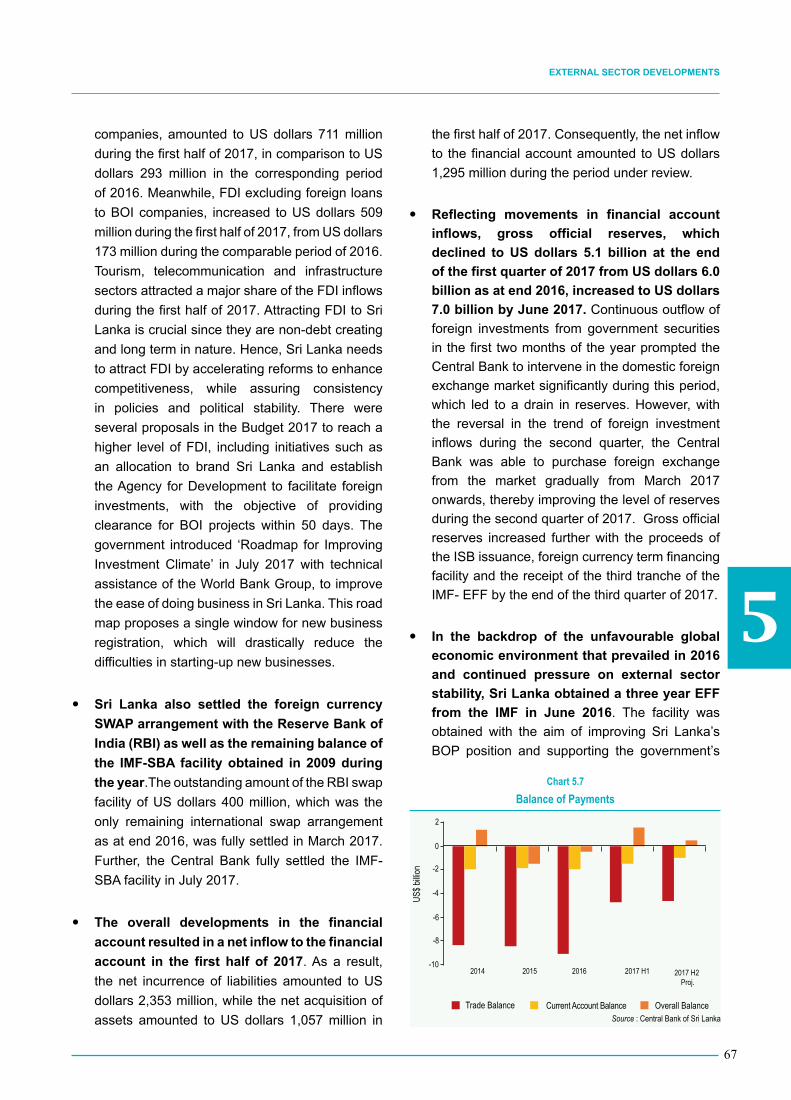
5
67
ExtErnal SEctor DEvElopmEntS
companies, amounted to US dollars 711 million during the first half of 2017, in comparison to US dollars 293 million in the corresponding period of 2016. Meanwhile, FDI excluding foreign loans to BOI companies, increased to US dollars 509 million during the first half of 2017, from US dollars 173 million during the comparable period of 2016. Tourism, telecommunication and infrastructure sectors attracted a major share of the FDI inflows during the first half of 2017. Attracting FDI to Sri Lanka is crucial since they are non-debt creating and long term in nature. Hence, Sri Lanka needs to attract FDI by accelerating reforms to enhance competitiveness, while assuring consistency in policies and political stability. There were several proposals in the Budget 2017 to reach a higher level of FDI, including initiatives such as an allocation to brand Sri Lanka and establish the Agency for Development to facilitate foreign investments, with the objective of providing clearance for BOI projects within 50 days. The government introduced ‘Roadmap for Improving Investment Climate’ in July 2017 with technical assistance of the World Bank Group, to improve the ease of doing business in Sri Lanka. This road map proposes a single window for new business registration, which will drastically reduce the difficulties in starting-up new businesses.
y Sri Lanka also settled the foreign currency SWAP arrangement with the Reserve Bank of India (RBI) as well as the remaining balance of the IMF-SBA facility obtained in 2009 during the year.The outstanding amount of the RBI swap facility of US dollars 400 million, which was the only remaining international swap arrangement as at end 2016, was fully settled in March 2017. Further, the Central Bank fully settled the IMF-SBA facility in July 2017.
y The overall developments in the financial account resulted in a net inflow to the financial account in the first half of 2017. As a result, the net incurrence of liabilities amounted to US dollars 2,353 million, while the net acquisition of assets amounted to US dollars 1,057 million in
the first half of 2017. Consequently, the net inflow to the financial account amounted to US dollars 1,295 million during the period under review.
y Reflecting movements in financial account inflows, gross official reserves, which declined to US dollars 5.1 billion at the end of the first quarter of 2017 from US dollars 6.0 billion as at end 2016, increased to US dollars 7.0 billion by June 2017. Continuous outflow of foreign investments from government securities in the first two months of the year prompted the Central Bank to intervene in the domestic foreign exchange market significantly during this period, which led to a drain in reserves. However, with the reversal in the trend of foreign investment inflows during the second quarter, the Central Bank was able to purchase foreign exchange from the market gradually from March 2017 onwards, thereby improving the level of reserves during the second quarter of 2017. Gross official reserves increased further with the proceeds of the ISB issuance, foreign currency term financing facility and the receipt of the third tranche of the IMF- EFF by the end of the third quarter of 2017.
y In the backdrop of the unfavourable global economic environment that prevailed in 2016 and continued pressure on external sector stability, Sri Lanka obtained a three year EFF from the IMF in June 2016. The facility was obtained with the aim of improving Sri Lanka’s BOP position and supporting the government’s
2017 H2Proj.
Chart 5.7Balance of Payments
Trade Balance Current Account Balance Overall BalanceSource : Central Bank of Sri Lanka
2014 2015 2016 2017 H1
US$ b
illion
2017 H2 Proj.
-10
-8
-6
-4
-2
0
2

5
68
CENTRAL BANK OF SRI LANKA ǀ RECENT ECONOMIC DEVELOPMENTS: HIGHLIGHTS OF 2017 AND PROSPECTS FOR 2018
economic reform agenda. The total value of the facility at SDR 1.1 billion (approximately US dollars 1.5 billion), is equivalent to 185 per cent of the country’s current quota with the IMF. The first tranche under the EFF amounting to SDR 119.9 million (approximately USD 169 million) was made available to Sri Lanka in June 2016. Two more tranches have been disbursed thereafter, with the latest being the third tranche received in July 2017. Consequently, Sri Lanka has received SDR 360 million (approximately US dollars 500 million) from the IMF-EFF program as at end September 2017 and the fourth tranche is to be disbursed in December 2017. The remaining portion of the facility is expected to be disbursed in three more tranches over the next two years, with the final tranche expected in April 2019.
International Investment Position (IIP)
y In terms of the International Investment Position (IIP), Sri Lanka’s external asset position and the liability position increased at end June 2017 from the position at end 2016. The stock position of assets increased primarily as a result of the increase in gross official reserves. The reserve asset position, which stood at US dollars 6,019 million at end December 2016, increased to US dollars 6,959 million by end June 2017, as a result of continuous foreign exchange purchases from the market by the Central Bank in addition to proceeds from the ISB and the foreign currency term financing facility. Further, the outstanding position of trade credit and advances given by Sri Lankan exporters increased marginally while the outstanding position of other accounts receivable of deposit-taking corporations declined at end June 2017 in comparison to end 2016. The asset position of direct investments also increased marginally during the period.
y Sri Lanka’s total external liability position at end June 2017 registered an increase from the previous year. The increase in external liabilities was primarily an outcome of the issuance of
the ISB of US dollars 1.5 billion as well as the increase in the outstanding government foreign loans position with the proceeds of the foreign currency term financing facility. Consequently, the total external liability position increased from US dollars 55,036 million at end December 2016 to US dollars 58,094 million at end June 2017. The stock position of direct investments increased due to the increase in the outstanding position of direct investment equity and investment fund shares as at end June 2017. The increase in the stock position of equity and investment fund shares can be attributed to higher direct investment transactions during the period and the valuation gains, particularly of companies listed in the CSE. The total outstanding position of portfolio investments increased with the issuance of the ISB and moderate inflows to the CSE during the first half of 2017. Continuous foreign investment inflows to the primary and secondary markets of the CSE resulted in increasing the equity stock position during the first half of 2017, despite valuation losses in market prices in publicly listed companies. The portfolio investment stock position of debt securities increased with the issuance of the ISB as well as the marginal increase in outstanding rupee denominated debt securities in the form of treasury bills and treasury bonds.
y The total outstanding position of foreign loans increased with the foreign currency term financing facility obtained by the government in June 2017 and other project loans to the government as well as the increase in long term loans by deposit taking corporations during the first half of 2017. The outstanding position of government foreign loans, which represent the largest component of the outstanding liability position of the IIP, increased with higher government project loans, including the foreign currency term financing facility obtained during the first half of the year. The outstanding position of foreign loans obtained by deposit taking corporations has also increased,

5
69
ExtErnal SEctor DEvElopmEntS
particularly due to the increase in long term loan facilities obtained by the banking sector. Meanwhile, the Central Bank completed paying off the IMF-SBA facility obtained in 2009 by July 2017.
y The outstanding position of currency and deposit liabilities and other payables declined while payables on trade credit and advances increased during the first half of 2017. The outstanding currency and deposit liability position of deposit taking corporations declined significantly with deposit taking corporations opting for higher foreign loan liabilities during the period. Outstanding trade credit and advances increased during the period particularly due to an increase in trade credit obtained by the Ceylon Petroleum Corporation (CPC).
External Debt Position
y Sri Lanka’s external debt increased during the first half of 2017. Consequently, the total external debt stock increased from US dollars 46.6 billion as at end 2016 to US dollars 49.1 billion at end June 2017. The external debt position of the government, which is the major component of external debt of the country, increased to US dollars 29,697 million as at end June 2017 from US dollars 27,197 million at end 2016, primarily due to the proceeds of the eleventh ISB issuance of US dollars 1.5 billion and proceeds from the first tranche of the foreign currency term financing facility of US dollars 450 million. Project loan inflows to the government also increased, contributing to the higher government external debt position. However, the outstanding external debt position of the Central Bank reduced with the settlement of the currency swap agreement with the RBI amounting to US dollars 400 million, net repayment of the Asian Clearing Union (ACU) liabilities amounting to US dollars 50 million and IMF-SBA payments amounting to US dollars 187 million during the first half of 2017. Meanwhile, the external debt stock of deposit taking corporations increased primarily due to higher inflows of long
term loans. Further, the external debt position of the private sector also increased mainly due to the increase in trade credit and advances.
Reserve Asset Position
y Gross official reserves of the country increased to US dollars 7.3 billion at end September 2017 from US dollars 6.0 billion at the end of 2016. This significant increase was observed at end of first nine months of 2017, amidst the settlement of US dollars 400 million under the RBI currency swap agreement in March 2017, foreign currency debt service payments of around US dollars 1.3 billion, IMF-SBA principal payment of around US dollars 187 million and net ACU outflows of around US dollars 319 million. Apart from the receipt of the ISB, proceeds of the foreign currency term financing facility and net borrowings through Sri Lanka Development Bonds, the Central Bank’s net absorption of US dollars 1,161 million from the domestic foreign exchange market contributed to the significant increase in gross official reserves during the first nine months of the year. Consequently, the level of gross official reserves increased to US dollars 7.3 billion by end September 2017, equivalent to 4.2 months of imports. This, in turn, enabled the Central Bank to build up reserves to meet the Net International Reserve (NIR) targets under the
US$ m
illion
Jan-
13
Jan-
15
Jan-
14
Jan-
16
Jan-
17
May-1
3
May-1
5
May-1
4
May-1
6
May-1
7
Sep-
13
Sep-
15
Sep-
14
Sep-
16
Sep-
17
Gross Official Reserves Months of Imports (Right Axis)
Chart 5.8 Gross Official Reserves and Months of Imports
Source : Central Bank of Sri Lanka
0
1
2
3
4
5
6
7
8
0
1,000
2,000
3,000
4,000
5,000
6,000
7,000
8,000
9,000
10,000
Month
s

5
70
CENTRAL BANK OF SRI LANKA ǀ RECENT ECONOMIC DEVELOPMENTS: HIGHLIGHTS OF 2017 AND PROSPECTS FOR 2018
IMF-EFF. The build-up of reserves through direct market purchases and the reduction in short-term liabilities led to a qualitative improvement in international reserves during the year. As such, the reserve adequacy as a percentage of short-term debt and liabilities improved to 62 per cent by end September 2017 from 52 per cent at end 2016.
y Total international reserves, which comprise gross official reserves and foreign assets of commercial banks, increased to US dollars 9.8 billion at end August 2017 from US dollars 8.4 billion at end 2016. The increase was a combined effect of the increase in gross official reserves by US dollars 1,675 million and the decrease in holdings of commercial bank foreign assets by US dollars 276 million. By end August 2017, the coverage of total international reserves was equivalent to 5.7 months.
Balance of Payments (BOP)
y The BOP recorded an overall surplus of US dollars 1,563 million during the first half of 2017 against an overall deficit of US dollars 1,186 million recorded during the corresponding period of 2016. The BOP surplus is estimated to have further improved to US dollars 2,027 million at end September 2017. Reflecting the pressure on the external sector, the BOP was in deficit during the past two years and in the first quarter of 2017, but turned in to a surplus during the second quarter of the year. The receipt of the proceeds of the ISB amounting to US dollars 1.5 billion, foreign currency term financing facility of US dollars 1.0 billion, net borrowing of around US dollars 410 million through Sri Lanka Development Bonds, the net absorption of US dollars 1,161 million from the domestic foreign exchange market and the receipt of the third tranche of the IMF-EFF at US dollars 167 million in mid-July helped strengthen the external position throughout the year up to end September 2017.
Exchange Rate Movements
y As stated in the Road Map 2017, the Central Bank implemented a more market based exchange rate policy during the year, which limited the Central Bank intervention in the foreign exchange market only to build-up international reserves with a minimal impact on the exchange rate. Accordingly, the external value of the Sri Lankan rupee remained relatively stable during the year up to end September 2017 amidst substantial absorption of foreign exchange liquidity by the Central Bank. The significant depreciation pressure on the rupee that existed particularly during the first quarter of 2017, was mainly due to continued outflows in terms of import expenditure, debt service payments and unwinding of foreign investments in the government securities market. The depreciation pressure that prevailed during the first two months of the year necessitated the Central Bank to supply foreign currency liquidity to the domestic foreign exchange market to defend the external value of the Sri Lankan rupee. However, this situation turned around since March 2017, particularly with increased foreign investments in the CSE and the government securities market and the conversion of export proceeds, and provided an opportunity for the Central Bank to absorb foreign exchange liquidity from the market. This contributed towards the relative stability of the rupee against the US dollar during the period March to September 2017. The depreciation pressure on the rupee further eased gradually from May onwards with the issuance of the ISB, the receipt of the foreign currency term financing facility and the disbursement of the third tranche of the IMF-EFF programme, which helped improve investor confidence. Overall, the Sri Lankan rupee depreciated by 2.2 per cent against the US dollar during 2017 up to end September. The Sri Lankan rupee also depreciated by 10.4 per cent against the pound sterling, 5.3 per cent against the Japanese yen, 12.5 per cent against the euro and 5.7 per cent against the Indian rupee, based on cross currency movements.

5
71
ExtErnal SEctor DEvElopmEntS
600
400
200
0
-200
-400
-600
155
150
145
140
135
130
125Rs
./ US$
Chart 5.9Central Bank Intervention in the Domestic Foreign Exchange
Market and the Exchange Rate
Source : Central Bank of Sri Lanka
Jan-
13
Jan-
14
Jan-
15
Jan-
16
Jan-
17
Mar-1
3
Mar-1
4
Mar-1
5
Mar-1
6
Mar-1
7
May-1
3
May-1
4
May-1
5
May-1
6
May-1
7
Jul-1
3
Jul-1
4
Jul-1
5
Jul-1
6
Jul-1
7
Sep-
13
Sep-
14
Sep-
15
Sep-
16
Sep-
17
Nov-1
3
Nov-1
4
Nov-1
5
Nov-1
6
Net Absorption End-month Exchange Rate (Right Axis)
US$ m
illion
88 86 84
90 92 94 96 98
100 102 104 106 108 110 112 114
Index
Poin
ts
Nominal Effective Exchange Rate Real Effective Exchange Rate
Jan-
15
Jan-
16
Jan-
17
Sep-
15
Sep-
16
Sep-
17
Mar-1
5
Mar-1
6
Mar-1
7
Nove
-15
Nove
-16
May-1
5
May-1
6
May-1
7
Jul-1
5
Jul-1
6
Jul-1
7
Chart 5.10Effective Exchange Rate Indices :
24 - Currency (2010 = 100) (a)
Source : Central Bank of Sri Lanka
(a) With the rebasing of CCPI (2013=100) REER indices have been recalculated.
y The Central Bank intervened in the domestic foreign exchange market to ease the pressure on the exchange rate by supplying foreign exchange to the market on a net basis during the first two months of 2017, while absorbing on a net basis thereafter. Accordingly, the Central Bank supplied US dollars 292 million, on a net basis, during the months of January and February 2017, while absorbing US dollars 1,453 million during the period from March to September 2017. Consequently, the Central Bank absorbed US dollars 1,161 million, on a net basis, during the first nine months of 2017, in comparison to US dollars 693 million supplied during the corresponding period of 2016, which contributed towards replenishing the level of official international reserves. The implementation of a more market-based exchange rate policy along with foreign currency inflows has helped the external value of the rupee to be relatively stable during the first nine months of the year. As such, the rupee which depreciated by 1.0 per cent against the US dollar during the first two months, depreciated only by another 1.2 per cent during the period from March to end September, even with the absorption of a significant amount of foreign exchange liquidity from the market. Notably, the rupee appreciated albeit marginally, against the US dollar in August and September.
y Both the 5-currency and 24-currency Nominal and Real Effective Exchange Rate indices depreciated during the first nine months of 2017. Nominal Effective Exchange Rate (NEER) indices depreciated, reflecting the nominal depreciation of the Sri Lankan rupee against some of the major currencies together with the movements in cross currency exchange rates. Accordingly, 5-currency and 24-currency NEER indices depreciated by 7.6 per cent and 6.7 per cent, respectively, during the year up to end September 2017. Meanwhile, Real Effective Exchange Rate (REER) indices, an indicator of Sri Lanka’s external competitiveness that takes into account the inflation differentials among countries in addition to the variation in nominal exchange rates, also depreciated based on 5-currency and 24-currency REER indices, by 4.2 per cent and 4.7 per cent, respectively. However, REER indices remained above the threshold of 100 index points, indicating the need for further depreciation of the external value of the rupee, to arrive at the level of external competitiveness that prevailed in 2010, given the relatively high inflation experienced by the country at present.
y During the first three quarters of 2017, the domestic foreign exchange market recorded an expansion in terms of spot and forward transactions. By end September 2017, the

5
72
CENTRAL BANK OF SRI LANKA ǀ RECENT ECONOMIC DEVELOPMENTS: HIGHLIGHTS OF 2017 AND PROSPECTS FOR 2018
total volume of spot transactions was US dollars 6,193 million in comparison to US dollars 4,779 million during the corresponding period of 2016. Meanwhile, the total volume of forward transactions also increased to US dollars 6,557 million during the first nine months of 2017 from US dollars 6,462 million during the corresponding period of 2016. The average forward premia for one-month transactions remained above the level of average interest rate differential, while the average NOP of commercial banks stood at a positive level by end September 2017.
Expected Developments
y With the envisaged adjustments in the current account of the BOP and the continuation of inflows to the financial account, the external sector is expected to improve further during the latter part of 2017 and in 2018. The overall BOP, which recorded a surplus by end September 2017, is expected to be maintained at similar levels by end 2017 and improve further in 2018. Accordingly, the overall BOP is projected to record a surplus of around US dollars 1.5 billion and international reserves are expected to remain at around US dollars 7.3 billion by end 2017. However, sluggish global growth, possible increase in commodity prices including crude oil, lower than expected FDI inflows, declining trend in workers’ remittances and geopolitical tensions in Sri Lanka’s trading partners are downside risks to the envisaged path in the external sector accounts.
y Reversing the lacklustre performance experienced during the past two years, exports are projected to continue their increasing trend in the remainder of 2017 and 2018. The trade deficit is expected to remain at 11.2 per cent of GDP in 2017 with the envisaged increase in both exports and imports. As per the forecast of World Trade Organization (WTO) in April 2017, the volume of world merchandise trade is expected to increase in a range of 1.8 - 3.6 per cent in 2017 and 2.1 - 4.0 per cent in 2018. Improved
global trade, the reinstatement of the EU GSP+ facility from May 2017, enhanced trade relations expected through multilateral trade agreements, strong institutional support and consistent policies that will result in increased domestic and foreign investments in export oriented industries, are expected to drive the momentum in exports. The revival of fish exports, following the removal of the ban on fisheries products by the EU for Sri Lankan fish exports with effect from mid-2016, is expected to yield a strong growth in fish exports. With the gradual recovery of global commodity prices, earnings from tea and spices are also expected to increase in 2018. Meanwhile, import expenditure is projected to grow moderately in 2018. Higher commodity prices in the international market, particularly petroleum prices, would affect the expenditure on imports as well. In addition, import volumes are also expected to increase in 2018 in line with the expected growth of exports and domestic economic activities. Reflecting these developments, the trade deficit is estimated to improve to around 10.8 per cent of GDP in 2018.
y The services account of the BOP is expected to expand further during the second half of 2017 and beyond. The tourism sector is expected to rebound with the expansion in the number of arrivals complemented by the resumption of full-scale operations of the BIA. The growth in earnings from tourism would be supported by efforts to uplift Sri Lanka’s brand value through targeted promotional campaigns and continued investments in enhancing the tourism infrastructure of the country. Foreign investments are expected to contribute towards the expansion in services exports, particularly transportation and IT/BPO, by capitalising on Sri Lanka’s strategic location and availability of skilled work force. Moreover, earnings from computer and information services are also projected to improve further, with a move towards mobile and cloud based applications beyond traditional software development and leveraging

5
73
ExtErnal SEctor DEvElopmEntS
the trend. Gaining momentum from these positive developments, the services account is expected to expand further in 2018.
y The growth in workers’ remittances is expected to moderate in the period ahead. The declining trend observed in workers’ remittances is expected to revive during 2018, albeit at a lower rate, with improvements in economic activity in source countries. Even though an upward trend in labour migration under skilled and professional categories was witnessed during the past few years, there exists a large mismatch between the international demand for jobs and Sri Lanka’s supply capabilities, especially with regard to specific skills demanded by the foreign employers. Therefore, investments in competency development through vocational training, providing high quality training on par with international standards, is beneficial in securing employment opportunities with higher earnings. In addition, attention should also be drawn to improving the language proficiency of migrant employees. It is equally important to explore new labour markets and enter into bilateral agreements with other advanced economies, including Singapore, Japan and European countries, rather than relying on the Middle Eastern countries, in the backdrop of rising economic and geopolitical uncertainties in the region.
y The current account deficit as a percentage of GDP is projected to widen in 2017 to 3.0 per cent of GDP, but is expected to improve to 2.5 per cent of GDP in 2018. The trade deficit is expected to widen only moderately in
the second half of the year with an expected increase in exports and a moderate growth in imports, compared to the corresponding period in 2016. The rebalancing of the trade account is expected to continue and improve further in 2018. Inflows to the services account are expected to grow at a faster rate in 2018, although it grew at a lower rate in 2017 due to lower growth in tourist earnings. Growth in workers’ remittances, which are projected to be lower in 2017 as a result of adverse economic and geopolitical conditions in the Middle Eastern region, are expected to exhibit some improvement in 2018. Limited diversification of exports, greater reliance on tourist earnings and workers’ remittances to finance the trade and primary income account deficit will remain challenges in curtailing the current account deficit.
y The financial account is expected to remain strong during 2017 and beyond. Thus far during the second half of 2017, the financial account was strengthened with proceeds from the foreign currency term financing facility and inflows to the government securities market. The current positive momentum in inflows to the government securities market is expected to continue in 2018, while the CSE is expected to attract more foreign investments. The financial account is expected to be further strengthened in 2018 with higher non-debt creating inflows by way of FDI, supplemented by policy consistency, political stability and stable macro-economic conditions. However, expected developments around the world, including probable interest rate hikes and tax policy reforms in the United States, may pose challenges in attracting financial flows.

5
74
CENTRAL BANK OF SRI LANKA ǀ RECENT ECONOMIC DEVELOPMENTS: HIGHLIGHTS OF 2017 AND PROSPECTS FOR 2018

Fiscal Policy and Government Finance
6R eflecting the government’s commitment towards revenue based fiscal consolidation,
the fiscal sector showed some improvement during the first eight months of 2017. Government revenue as a percentage of estimated GDP increased to 9.0 per cent during
this period from 8.2 per cent in the corresponding period of 2016 mainly due to higher tax revenue generated, particularly from the Value Added Tax (VAT). Total expenditure and net lending as a percentage of estimated GDP also increased to 13.0 per cent during the first eight months of 2017 in comparison to 12.2 per cent in the same period of 2016, due to increases in both recurrent expenditure and public investment. The overall budget deficit increased to 4.0 per cent of the estimated GDP during the first eight months of 2017 from 3.9 per cent in the corresponding period of 2016 as the increase in the government expenditure was higher than the increase in government revenue. However, the current account deficit, which indicates the government dis-savings, declined to 0.9 per cent of the estimated GDP during the first eight months of 2017 from 1.2 per cent recorded in the same period of 2016. A salutary feature of budgetary operations during 2017 was the surplus in the primary account witnessed during the first six months of the year. The primary account, which reflects the difference between revenue and non-interest expenditure, was in surplus to the tune of Rs. 16.1 billion by June 2017 indicating a marked improvement in budgetary operations this year, while meeting the quantitative performance criteria (QPC) of the IMF Extended Fund Facility (EFF) programme for the fiscal sector. However, expenses related to flood and drought reduced the surplus in the primary balance to a deficit of Rs. 1.6 billion by August 2017. In financing the budget deficit, the government relied on both domestic and foreign sources. In domestic financing, borrowings from the banking sector on a net basis increased to Rs. 236.5 billion during the first eight months of 2017 from Rs. 138.1 billion during the same period of 2016, while financing from the non banking sector declined significantly to Rs. 37.0 billion during the first eight months of 2017 from Rs. 171.4 billion during the same period of 2016. In spite of improvements, achieving fiscal targets stipulated in the Budget 2017 would be challenging. Delays in the implementation of the new Inland Revenue Bill, lower revenue collection from import duties and excise taxes on liquor and cigarettes, increased expenditure on interest payment and fiscal expenses on drought and flood relief schemes would hinder the performance of the fiscal sector in 2017.

6
76
CENTRAL BANK OF SRI LANKA ǀ RECENT ECONOMIC DEVELOPMENTS: HIGHLIGHTS OF 2017 AND PROSPECTS FOR 2018
y A new Inland Revenue Bill was enacted by the Parliament on 7 September 2017 with the objective of increasing the ratio of direct taxes.The new Act is expected to simplify and rationalise the existing income tax structure, broaden the income tax base by removing exemptions, strengthen tax administration, while enhancing the direct tax collection. On the individual income tax front, tax free threshold is proposed to be maintained at the prevailing level of Rs. 500,000. However, for employment income, the tax free threshold will be increased to Rs. 1.2 million from the current Rs. 750,000. The corporate income tax structure is to be streamlined with the introduction of three tier tax structure, i.e., 40 per cent for liquor, tobacco, lottery, and betting and gaming, 28 per cent for banking, finance, insurance industry and trading activities and 14 per cent for all other sectors. In addition, a Capital Gains Tax is proposed to be introduced at a rate of 10 per cent upon the gains of the realisation of capital assets. Further, the withholding tax rate on interest earnings of resident individuals will be increased to 5 per cent from the current 2.5 per cent, while the withholding tax will be introduced for specified fees and contract payments at a rate of 5 per cent and 14 per cent with a view of broadening the tax base. Meanwhile, amendments were made to the Economic Service Charge (ESC) with effect from 01 April 2017. Accordingly, threshold of ESC was reduced to Rs. 12.5 million per quarter from Rs. 50 million per quarter. Further, ESC was charged in advance on the Cost, Insurance and Freight (CIF) value certified by the Director General of Customs, of an importer, in respect of every consignment of imports of motor vehicles.
y The VAT (Amendment) Act was approved by the Parliament in October 2016. Accordingly, the VAT rate was raised to 15 per cent from 11 per cent with effect from 01 November 20161. In addition to the revision of rates, the threshold for registration of VAT was reduced to Rs. 3 million per quarter from Rs. 3.75 million per quarter. Further, VAT was imposed on several items, namely
1 As per the VAT (Amendment) Act No 20 of 2016, VAT changes were valid for the period 02 May 2016 to 11 July 2016 and from 01 November 2016.
Fiscal Policy Measures
y Government continued its revenue based fiscal consolidation process in 2017 with the aim of gradually reducing the budget deficit and the government debt to GDP ratio in the medium term. The medium term framework envisages to reduce the budget deficit to 3.5 per cent of GDP and debt to GDP ratio to a sustainable level by 2020. In order to achieve these targets, several policy measures were introduced to enhance government revenue and rationalise recurrent expenditure while maintaining public investment at a sustainable level. Accordingly, a new Inland Revenue Bill was enacted by the Parliament in September 2017 aimed at simplifying the existing tax system and broadening the tax base while introducing reforms to tax administration. In addition, under the Revenue Administration Management Information System (RAMIS) tax payers were enabled to make payments online for several taxes. In addition, quarterly expenditure and income outcome reports for the first and second quarters of 2017 were presented to the Parliament as announced in the Budget 2017 for strengthening Parliamentary control on public finances. Further, the National Agency for Public Private Partnership (NAPPP) was established at the Ministry of Finance and Mass Media (MOF) with a view to promoting public private partnerships (PPPs). Statements of Corporate Intent (SCIs) were signed with selected five main State Owned Business Enterprises (SOBEs) in order to improve the oversight and fiscal discipline of these SOBEs, while it is expected to sign SCIs with another ten SOBEs. During the year, several measures were taken to improve the transparency in the government securities market while a new Fiscal Liability Management Act is also being drafted for better liability management. In moving towards the medium term targets, the government in its 2017 Budget announced a reduction in the deficit to 4.6 per cent of GDP in 2017 from 5.4 per cent in 2016. Moreover, the current account balance of the Budget is expected to be in surplus at 0.5 per cent of GDP. Similarly the primary balance is also envisaged at positive levels in 2017 with a surplus of 0.4 per cent of GDP.

6
77
Fiscal Policy and Government Finance
liquor, cigarettes, coal, perfumes, electrical and electronic goods, and telecommunication equipment with a view to broadening the VAT base. The full impact of VAT amendments on revenue generation is expected in 2017. In addition to the changes introduced by the VAT (Amendment) Act on 01 November 2016, several other measures were also proposed with regard to VAT in the Budget 2017. Plant, machinery and accessories for generation of renewable energy, supply of geriatric care services and child care services and certain electrical goods were proposed to be exempted from VAT, and the amendments to the VAT Act in relation to these proposals have been submitted to the Legal Draftsman (LD).
y Several amendments were also made to the Nation Building Tax (NBT) Act with effect from 01 November 2016 to enhance the revenue collection from NBT. Accordingly, the liable threshold for NBT registration was reduced to Rs. 3 million per quarter from Rs. 3.75 million per quarter while removing the NBT exemptions on telecommunication, supply of electricity and lubricants. Meanwhile, as proposed in the Budget 2017, the NBT exemption on goods required for services of international transportation, supply of residential apartments and the supply of goods and services by any Co-operative Society or Lak Sathosa Limited was removed with effect from 01 August 2017.
y Harmonized System (HS) codes2 and some tariff lines were adjusted as per international guidelines. Accordingly, HS Code National Sub Divisions have been created as directed by the World Customs Organization (WCO) and duty rates of 96 tariff lines have been adjusted based on Sri Lanka’s rate commitments to the World Trade Organization (WTO) in November 2016. In addition, the Ports and Airports Development Levy (PAL) on printed books, magazines, journals, and periodicals was removed while PAL on certain pharmaceutical products was reduced to 2.5 per cent with effect from 11 November 2016.
2 The Harmonized Commodity Description and Coding System generally referred to as “Harmonized System” or simply HS is a multipurpose international product nomenclature developed by the World Customs Organization.
y The Special Commodity Levy (SCL) on the importation of several food items was revised a number of times during 2017 to provide necessary protection for domestic agricultural producers during harvesting seasons and reduce volatility in domestic market prices. Accordingly, SCL was introduced on imported raw rice (kekulu), nadu rice and samba rice at Rs. 15 per kg with effect from 07 January 2017. However, it was reduced to Rs. 5 per kg with effect from 28 January 2017 and further reduced to 25 cents per kg with effect from 27 July 2017 due to supply shortages that prevailed in the domestic market resulting from drought conditions experienced in several districts of the country. In addition, SCL on the importation of vegetable oils was reduced by Rs. 20 per kg with effect from January 2017. It was further reduced by Rs. 20 per kg with effect from 24 February 2017 for a period of six months. Further, SCL applicable on 12 items, including dried fish, yoghurt, butter, garlic, oranges, apples, salt, kurakkan flour, etc. was extended for a period of six months with effect from 02 April 2017. Meanwhile, SCL on fish, green gram, mangosteen, dried oranges, kiwifruit, pear, cherries, plums and soles was also extended for a period of six months with effect from 08 May 2017.
y Several measures were introduced to improve tax administration in the Budget 2017 with a view to strengthening revenue collecting agencies. Registered taxpayers were able to make online payments for personal and partnership taxes with effect from March 2017 through banks to the RAMIS System, which is being set up at the Inland Revenue Department (IRD). Meanwhile, VAT payments on financial services through RAMIS commenced in September 2017. In addition, web based instructions and other e-services to facilitate taxpayers were made available for VAT, SVAT, NBT, Pay-As-You-Earn (PAYE), and Corporate Income Tax (CIT). Meanwhile, Sri Lanka Customs took initial steps to establish a National Single Window System (NSWS) to provide a better service to facilitate importers and exporters. The Integrated Treasury

6
78
CENTRAL BANK OF SRI LANKA ǀ RECENT ECONOMIC DEVELOPMENTS: HIGHLIGHTS OF 2017 AND PROSPECTS FOR 2018
Management Information System (ITMIS), which was set up at the MOF, envisages to modernise the Public Financial Management (PFM) through the automation of key Treasury operations such as budget preparation, budget execution, accounting for public expenditure and revenues, treasury management and cash management while supporting the government in the preparation of financial statements. The rolling-out of ITMIS is expected to start in the last quarter of 2017 as a pilot project for a few selected ministries. However, rolling-out to cover all ministries, departments and other spending agencies of the government is expected to be implemented gradually in 2018. ITMIS will help strengthen the link between the planning and the budgeting process, implement commitment accounting, centralise payments in the Treasury Operations Department, move to accrual accounting and implement a Unified Chart of Accounts.
y On the expenditure front, several measures were introduced in order to minimise fiscal slippages. Accordingly, quarterly expenditure and income outcome reports for the first and second quarters of 2017 were presented to the Parliament as announced in the Budget for 2017 for strengthening the Parliamentary control on public finances. In line with the fiscal consolidation path, any revenue shortfall in a particular quarter will warrant the government to realign its expenditure with the approval of the Parliament. According to these reports, both revenue and expenditure outcomes in the first and second quarters of 2017 remained below the targeted levels. Under the National Budget Circular No. 01/2017, a decision has been taken to continue the monitoring process on the utilisation of budgetary provisions allocated to spending agencies with the objective of achieving efficiency in resource allocation. The Budget Review and Implementation Committee (BRIC) established under the MOF monitored the performance of major capital projects of fourteen selected ministries. Based on their performance, monthly cash releases were made in order to rationalise government expenditure.
y While the government continued with its pension scheme for retired public officials, necessary steps were taken to grant the “Ranaviru Surakum Allowance” for disabled officers of Tri Forces while granting a pension to defence personnel who have not completed 10/12 years of service. Accordingly, under the Pension Circular No. 01/2017, the officers in Tri Forces are entitled to the “Ranaviru Surakum Allowance” with effect from 01 January 2017. This allowance is granted as a fixed allowance with the pension to officers in Tri Forces (i) who became disabled during the active service due to terrorist activities (ii) their spouses after their demise, and (iii) the widows of war heroes who died during active service due to terrorist activities. Further, a pension was granted to defence personnel who had been sent on retirement after becoming disabled due to terrorist activities without completing 10/12 years in the service. Accordingly, officers who have not completed 10 years service in the Sri Lanka Police and Tri Forces and 12 years service in the other ranks of armed forces were granted pension. In addition, under the Public Administration Circular No. 06/2017, the compulsory retirement age for officers in the Sri Lanka Engineering Service was extended up to 61 years with effect from 01 January 2017.
y The government maintained its public investment programme during the first eight months of 2017 with the continuation of several major infrastructure projects. Accordingly, the construction of Phase III of the Kadawatha to Kerawalapitiya section of the Outer Circular highway and the Matara to Hambantota section of the Southern Expressway Extension Project continued during the first eight months of 2017. Further, investments were also made for the acquisition of lands for the construction of the Central Expressway from Kadawatha to Dambulla and the linked Expressway from Pothuhera to Galagedara during the same period. Construction work related to Phase II of the Central

6
79
Fiscal Policy and Government Finance
Expressway from Meerigama to Kurunagala commenced in early 2017. Meanwhile, public investments in the health sector were focused mainly on the construction and the improvement of hospitals while investments for education infrastructure within the first eight months of 2017 were channeled towards the development of both human resources and physical infrastructure under the “Nearest School is the Best School (NSBS)” Programme.
y With a view to promoting PPPs as a national strategy to address the infrastructure requirement in the country amidst the limited fiscal space available for public investments, the NAPPP was established in 2017. The main objective of the NAPPP is to create a central agency with adequate legal, administrative and financial authority to identify suitable projects, which can be executed as PPP’s, prepare required guidelines and invite bids and select investors, in consultation with relevant line ministries. This central agency is located within the MOF.
y Several initiatives were taken during the first eight months of 2017 to strengthen the financial position and operations of major SOBEs. Accordingly, SCIs were signed with selected five main SOBEs, namely Ceylon Electricity Board, Ceylon Petroleum Corporation, National Water Supply and Drainage Board (NWS&DB), Airport and Aviation Services (Sri Lanka) Ltd., and Sri Lanka Ports Authority (SLPA), in March 2017 in order to improve the oversight and financial discipline of these SOBEs. Further, it is expected to sign SCIs with another ten SOBEs, namely, Urban Development Authority (UDA), State Pharmaceuticals Corporation (SPC), Sri Lanka State Plantation Corporation (SLSPC), State Timber Corporation, Sri Lanka Transport Board (SLTB), MILCO Ltd., National Livestock Development Board (NLDB), Central Engineering Consultancy Bureau (CECB), Lanka Sathosa Ltd., and Lankaputhra Development Bank (LDB) in order to improve their efficiency.
y The government successfully issued the 11th International Sovereign Bond (ISB), reflecting investors’ continued confidence and positive outlook for the economy. Under this, the government was able to raise US dollars 1.5 billion in May 2017 with a 10-year maturity at a yield of 6.20 per cent per annum. In addition, a Foreign Currency Term Financing Facility (FCTFF) of US dollars 1.0 billion was obtained during the year and funds were received in two tranches; US dollars 450 million in May 2017 and US dollars 550 million in August 2017.
y Complementing the improved fiscal performance of the country, the Central Bank also implemented several measures during the year to improve the transparency in the government securities market. Accordingly, the Central Bank mandated the Primary Dealers (PDs) and licensed banks to use the Bloomberg electronic bond trading platform on secondary market transactions in government securities on 26 April 2017. The PDs are also required to quote and engage in repurchase transactions (repos) within PDs through the trading platform and report repos of Rs. 100 million or above carried out over-the-counter with investors through the trading platform, within 30 minutes of the completion of each repo transaction. The Central Bank releases the daily summary trade information of repo volumes and yield rates based on standardised tenures such as overnight, one week and two weeks shortly for the information of the market participants. These measures are expected to help improve transparency while facilitating price discovery, increasing market liquidity and outreach, thereby reducing the cost of borrowing in the medium term. A new primary issuance system for Treasury bonds was introduced with effect from 27 July 2017. The new system replaced the fully auction based issuance system for Treasury bonds that had been in practice since February 2015. The more structured newly introduced system includes regular monthly Treasury bond auctions. Each monthly auction offers two

6
80
CENTRAL BANK OF SRI LANKA ǀ RECENT ECONOMIC DEVELOPMENTS: HIGHLIGHTS OF 2017 AND PROSPECTS FOR 2018
Treasury bond series of different maturities and tenures of the series are expected to match the resource availability in the market. Issuance under each series takes effect in three or less sequential phases depending on the outcome of each preceding phase. The Phase I explores issuance of the entire announced volume in a competitive multiple price auction system through reasonable market bids. However, in the event of any under allocation at the Phase I, the Phase II opens for voluntary, volume based bidding. Issuance under the Phase II is made at the Weighted Average Yield Rate (WAYR) determined at the Phase I and is limited to the under allocated quantum in the Phase I. All PDs and other authorised participants at primary issuances are eligible for submission of bids under the Phase II. Any under allocation during Phases I and II, is issued on a mandatory basis at WAYR only among PDs in the Phase III. A new performance review mechanism will also be introduced to assess the effective participation of PDs. Meanwhile, in order to improve the investment planning of PDs and investors at large, a quarterly Treasury bond auction calendar will be published in advance. As such, the newly introduced system will further enhance the efficiency and transparency of domestic borrowings of the government.
y Sovereign credit ratings for Sri Lanka were revised by international sovereign rating agencies in 2017. On 09 February 2017, Fitch affirmed Sri Lanka’s long-term foreign and local currency issuer Default Ratings (IDR) at “B+”, and revised the outlook to “stable” from “negative” highlighting improving fiscal finances, improved policy coherence and credibility, and stable growth. Standard and Poor’s (S&P) affirmed its “B+” long-term rating and “B” short-term sovereign credit rating on 07 March 2017, highlighting improvements in the fiscal performance. However, its outlook remained “negative”, citing the weak external sector performance and the rising exchange rate pressure on public debt. Moody’s Investor Services also affirmed Sri Lanka’s sovereign rating at “B1” with a “negative” outlook on 13 July 2017.
Government Budgetary Operations
Government Revenue and Grants
Revenue
y According to the estimates for 2017, total government revenue in 2017 is expected to increase by 19.2 per cent to Rs. 2,010.3 billion. As a percentage of GDP, total revenue is estimated at 14.9 per cent in 2017 comprising 13.5 per cent of tax revenue and 1.4 per cent of non tax revenue.
y During the first eight months of 2017, government revenue as a percentage of estimated GDP increased to 9.0 per cent from 8.2 per cent in the corresponding period in 2016 due to increased tax revenue. Accordingly, total government revenue in nominal terms increased by 15.7 per cent to Rs. 1,172.4 billion during the first eight months of 2017 from Rs. 1,013.4 billion recorded in the corresponding period of the previous year. This was mainly due to the increase in revenue from goods and services related taxes, especially VAT, excise duty on petroleum and motor vehicles, NBT, SCL, and PAL. Meanwhile, the revenue collection from income taxes also improved due to increased revenue from the ESC. However, revenue from excise duty on liquor and cigarettes and tobacco declined during this period mainly due lower sales of liquor and cigarettes. Non tax revenue declined by 4.9 per cent to Rs. 77.4 billion during the first eight months of 2017 as a result of the decline in profit and dividend transfers from SOBEs. However, non tax revenue realised from rent and interest, fees and charges and social security contributions increased during the period concerned vis-a-vis to the previous year. Overall, the total revenue collection during the first eight months was 58.3 per cent of the annual estimate of Rs. 2,010.3 billion in comparison to 55.6 per cent generated in the corresponding period of 2016. However, the average monthly revenue during this period was only around Rs. 146.5 billion in comparison to the estimated average monthly revenue of Rs. 167.5 billion in the Budget 2017.

6
81
Fiscal Policy and Government Finance
y In nominal terms, revenue from income taxes increased by 9.1 per cent during the first eight months of 2017 mainly due to higher revenue from ESC. As a percentage of the estimated GDP however, revenue from income taxes remained unchanged at 1.3 per cent from the corresponding period of 2016. Corporate and non corporate income taxes declined by 1.3 per cent in nominal terms to Rs. 81.2 billion during the first eight months of 2017 from Rs. 82.3 billion recorded in the same period of 2016. However, revenue from PAYE tax increased considerably to Rs. 22.4 billion during the first eight months of 2017 from Rs. 18.9 billion in the first eight months of the previous year, mainly due to strengthening of the monitoring process related to the submission of PAYE returns and payments with the initiation of the RAMIS system. During this period, revenue from withholding taxes at Rs. 36.2 billion declined by 18.6 per cent in comparison to the corresponding period of previous year due to the reduced issuance of government securities. Revenue from ESC increased significantly to Rs. 31.2 billion during the period under review from Rs. 11.1 billion in the first eight months of 2016 mainly due to the increase in ESC from 0.25 per cent to 0.5 per cent, the removal of the maximum liability of Rs. 120 million and the extension of the coverage of the ESC to profit making businesses of which the turnover exceeds Rs. 50 million per quater.
y Revenue from VAT as a percentage of the estimated GDP increased to 2.2 per cent in the first eight months of 2017 from 1.4 per cent in the first eight months of 2016. In nominal terms also, revenue from VAT increased by 65.0 per cent to Rs. 290.0 billion during this period from Rs. 175.8 billion in the corresponding period of 2016. Accordingly, revenue from VAT on both domestic economic activity and import related activity increased significantly during the first eight months of 2017. The increase in revenue from VAT was an outcome of the hike in the VAT rate to 15 per cent from 11 per cent and the expansion of the VAT base with the removal of several exemptions in the latter part of 2016 and the enhanced compliance with the initiation
of RAMIS. Accordingly, revenue from VAT on domestic economic activity increased by 67.5 per cent to Rs. 181.4 billion from Rs. 108.3 billion in the first eight months of the previous year. Similarly, revenue from VAT on import related activities also increased by 61.0 per cent to Rs. 108.6 billion during the period in comparison to a sum of Rs. 67.5 billion mobilised during the first eight months of 2016. Further, VAT revenue as a percentage of total tax revenue increased to 26.5 per cent during the first eight months of 2017 from 18.9 per cent in the corresponding period of 2016. Meanwhile, the contribution of VAT revenue to total revenue rose to 24.7 per cent in the first eight months of 2017 from 17.3 per cent in the same period of 2016.
y Revenue from excise duties as a percentage of the estimated GDP remained unchanged at 2.4 per cent during the first eight months of 2017 in comparison to the corresponding period of 2016. However, in nominal terms, revenue from excise tax increased by 5.2 per cent to Rs. 312.5 billion from Rs. 297.2 billion recorded during the same period of 2016. Revenue from excise duty at Rs. 50.1 billion on petroleum rose by 35.2 per cent during this period due to the increased importation of petroleum products during the first eight months of 2017. Meanwhile, despite the decline in imports of motor vehicles during the first eight months of 2017, revenue from excise duty on motor vehicles also increased by 8.0 per cent in comparison to the previous year to Rs. 129.5 billion due to the revision of excise duty rates in
(a) Provisional
Rs. billion
Table 6.1Economic Classification of Government Revenue
Item 2015 2016 (a)
2017 ApprovedEstimates
2016Jan - Aug
(a)
2017Jan - Aug
(a)Tax Revenue 1,355.8 1,463.7 1,827.0 932.0 1,094.9
Income Taxes 262.6 258.9 334.6 156.7 171.0VAT 219.7 283.5 380.0 175.8 290.0Excise Taxes 497.7 455.0 579.0 297.2 312.5Import Duties 132.2 156.5 165.5 100.8 92.5PAL 58.6 88.8 106.0 56.7 65.6NBT 45.0 57.4 66.0 35.4 45.0SCL 52.3 55.8 65.0 39.9 49.2Cess 46.3 61.7 60.0 38.9 39.5Other Taxes 41.4 46.1 70.9 30.6 29.5
Non Tax Revenue 99.1 222.4 183.3 81.4 77.4Total Revenue 1,454.9 1,686.1 2,010.3 1,013.4 1,172.4
Source: Ministry of Finance and Mass Media

6
82
CENTRAL BANK OF SRI LANKA ǀ RECENT ECONOMIC DEVELOPMENTS: HIGHLIGHTS OF 2017 AND PROSPECTS FOR 2018
2016. Reflecting the decline in sales of hard and malt liquor, the collection of excise tax revenue from liquor reduced to Rs. 73.7 billion registering a decline of 5.9 per cent from Rs. 78.3 billion recorded in the corresponding period of 2016. Meanwhile, revenue from tobacco and cigarettes at Rs. 54.6 billion in the first eight months of 2017, also declined by 8.1 per cent due to lower sales of cigarettes during this period.
y Revenue from import duties during the first eight months of 2017 declined marginally to 0.7 per cent of the estimated GDP from 0.8 per cent recorded during the same period of 2016. In nominal terms, revenue from import duties declined by 8.3 per cent to Rs. 92.5 billion in comparison to Rs. 100.8 billion recorded in the first eight months of 2016 mainly due to the decline in imports which are subject to import duties. However, revenue from SCL in nominal terms increased by 23.4 per cent to Rs. 49.2 billion from Rs. 39.9 billion in the corresponding period of the previous year with the increase in SCL on several commodities with a view to safeguarding the interests of the farming community.
y In nominal terms, revenue from NBT and Cess increased during the first eight months of 2017. Accordingly, revenue from NBT in nominal terms increased by 27.1 per cent to Rs. 45.0 billion. As a percentage of estimated GDP, revenue from NBT in the first eight months of the year, remained unchanged at 0.3 per cent in comparison to the corresponding period of 2016. Revenue from NBT on both domestic economic activity and import related activity increased during the first eight months of 2017. Accordingly, revenue from NBT on domestic economic activities increased by 37.6 per cent to Rs. 32.6 billion in comparison to Rs. 23.7 billion in the first eight months of 2016 as a result of the reduction of the NBT threshold to Rs. 12 million per annum from Rs. 15 million per annum and the removal of several exemptions mainly during the latter part of 20163. The collection of NBT on import related activities also increased by 6.0 per cent
3 As per the NBT (Amendment) Act No. 22 of 2016, NBT changes were valid from 02 May 2016 to 11 July 2016 and from 01 November 2016.
to Rs. 12.4 billion from Rs. 11.7 billion in the first eight months of 2016. Revenue from PAL increased by 15.8 per cent to Rs. 65.6 billion from Rs. 56.7 billion recorded during the same period of 2016. Revenue from Cess also increased by 1.7 per cent during the first eight months of 2017 to Rs. 39.5 billion from Rs. 38.9 billion recorded during the same period of 2016.
y During the first eight months of 2017, non tax revenue as a percentage of the estimated GDP, declined to 0.6 per cent from 0.7 per cent recorded in the same period of 2016. Further, non tax revenue in nominal terms was also lower declining by 4.9 per cent to Rs. 77.4 billion from Rs. 81.4 billion in the corresponding period of 2016. The decline in profit and dividend transfers of SOBEs, despite the increase in the other non tax revenue sources, namely fees and charges, rent, interest, and social security contributions, was the main reason for this reduction. Profit and dividend transfers from SOBEs at Rs. 12.5 billion during this period was lower by 58.4 per cent to Rs. 29.9 billion mobilised during the same period of 2016. This was largely due to the deteriorated financial performance of major SOBEs during the first eight months of 2017. Revenue through fees and charges increased by 25.0 per cent to Rs. 41.6 billion in the first eight months of 2017 due to the increase in the embarkation levy and the imposition of licensing fees on firearms and
Chart 6.1Composition of Government Revenue
(Jan-Aug 2017)
Source: Ministry of Finance and Mass Media
Excise Taxes26.7%
Other Taxes19.5%
VAT24.7%
Income Taxes14.6%
Import Duties 7.9% Tax
93.4%
Non Tax6.6%

6
83
Fiscal Policy and Government Finance
beedi leaves. Revenue generated from rent and interest also increased by 25.9 per cent and 35.2 per cent, respectively, to Rs. 2.6 billion and Rs. 4.2 billion, as a result of increased revenue collections from rentals on regional plantation companies and interest payments received from on-lending to SOBEs.
Grants
y Disbursement of foreign grants during the first eight months of 2017 was significantly below the annual estimate for 2017. Accordingly, the realised amount of foreign grants in the first eight months of 2017 was Rs. 2.3 billion in comparison to the annual estimate of Rs. 10.0 billion for 2017, although foreign grant disbursements showed some improvement over the sum of Rs. 0.7 billion witnessed in the same period of 2016.
Expenditure and Net Lending
y As per the budget estimates for 2017, total expenditure and net lending is estimated to decline to 19.6 per cent from GDP to 19.7 per cent of GDP in 2016. Recurrent expenditure is estimated to decline to 14.4 per cent of GDP from 14.8 per cent in 2016 whereas capital expenditure and net lending is estimated to increase to 5.2 per cent of GDP in 2017 from 4.9 per cent in 2016. In nominal terms, total expenditure and net lending in 2017 is estimated to increase by 13.3 per cent to Rs. 2,645.3 billion from Rs. 2,333.9 billion in 2016. Recurrent expenditure is expected to increase by 10.7 per cent to Rs. 1,946.0 billion in 2017, while capital expenditure and net lending is also expected to increase by 21.4 per cent to Rs. 699.3 billion.
y Total expenditure and net lending during the first eight months of 2017 increased to 13.0 per cent of the estimated GDP from 12.2 per cent during the same period in 2016, due to increases in both recurrent expenditure and capital expenditure and net lending. In nominal terms, government expenditure and net lending increased by 13.1 per cent to Rs. 1,694.9
billion during the first eight months of 2017 from Rs. 1,499.1 billion recorded during the corresponding period of 2016. Total expenditure and net lending in the first eight months of 2017 accounted for 64.1 per cent of the annual estimate for 2017, higher than the share recorded in the first eight months of 2016.
y During the first eight months of 2017, recurrent expenditure increased to 10.0 per cent of the estimated GDP from 9.4 per cent in the same period in 2016 mainly due to the increase in interest payments. In nominal terms, recurrent expenditure increased by 11.6 per cent to Rs. 1,294.4 billion during the first eight months of 2017 in comparison to Rs. 1,159.5 billion in the same period of 2016. Expenditure on interest payments increased by 25.1 per cent to Rs. 518.6 billion during the first eight months of 2017 from Rs. 414.6 billion during the corresponding period in 2016, mainly due to the relatively high interest rates prevailing in the domestic market and the gradual increase in interest rates in international markets which affected interest payments of loans obtained at variable interest rates. Expenditure on salaries and wages increased by 3.6 per cent to Rs. 392.5 billion while pension payments also increased by 5.9 per cent to Rs. 120.3 billion. Meanwhile, expenditure on the fertiliser subsidy declined by 18.2 per cent to Rs. 16.8 billion during the first eight months of 2017 reflecting the effectiveness of the rationalisation of the fertiliser subsidy.
Table 6.2Economic Classification of Expenditure
(a) ProvisionalSource: Ministry of Finance and Mass Media
Rs. billion
Item 2015 2016(a)
2017 Approved Estimates
2016Jan - Aug
(a)
2017Jan - Aug
(a)Recurrent Expenditure 1,701.7 1,757.8 1,946.0 1,159.5 1,294.4
o/w Salaries and Wages 561.7 576.5 615.0 378.9 392.5Interest Payments 509.7 610.9 680.1 414.6 518.6
Foreign 115.4 126.7 123.3 71.9 97.6Domestic 394.3 484.2 556.8 342.7 421.0
Samurdhi 40.0 40.7 44.0 27.3 26.6Pensions 155.3 171.9 180.8 113.5 120.3Fertiliser Subsidy 49.6 27.8 36.5 20.6 16.8
Capital and Net Lending 588.7 576.1 699.3 339.7 400.5Total Expenditure and Net Lending 2,290.4 2,333.9 2,645.3 1,499.1 1,694.9

6
84
CENTRAL BANK OF SRI LANKA ǀ RECENT ECONOMIC DEVELOPMENTS: HIGHLIGHTS OF 2017 AND PROSPECTS FOR 2018
y Capital expenditure and net lending increased to 3.1 per cent of estimated GDP during the first eight months of 2017 from 2.8 per cent of GDP in the corresponding period of 2016. In nominal terms, capital expenditure and net lending increased by 17.9 per cent to Rs. 400.5 billion. This was mainly due to the efforts by the government to implement the planned infrastructure development projects. The realised capital expenditure and net lending in the first eight months of 2017 accounted for 57.3 per cent of the annual estimate for the year in comparison to the share of 39.5 per cent recorded during the corresponding period of 2016.
Key Fiscal Balances
y Although budget deficit increased marginally during the first eight months of 2017 both current account balance and primary balance improved. Accodingly, the overall budget deficit increased to 4.0 per cent of the estimated GDP during the first eight months of 2017 from 3.9 per cent of the GDP in the corresponding period of the previous year. In nominal terms, the overall budget deficit increased to Rs. 520.2 billion in the first eight months of 2017 from Rs. 485.1 billion during the same period of 2016. The current account deficit, which reflects government
dissavings, declined to 0.9 per cent of the estimated GDP during the first eight months of 2017 from 1.2 per cent in the same period of 2016. The primary account (overall deficit net of interest payments) was recorded at 0.0 per cent of GDP (deficit of Rs. 1.6 billion) during the period under review, in comparison to a deficit of 0.6 per cent of GDP (deficit of Rs. 70.5 billion) recorded during the same period of 2016.
Financing the Budget Deficit
y The government relied on both domestic sources and foreign sources to finance the budget deficit during the first eight months of 2017. Net domestic financing during this period, which amounted to Rs. 273.5 billion, remained below the level of Rs. 309.5 billion observed in the first eight months of 2016. Meanwhile, net foreign financing increased significantly, amounting to Rs. 246.7 billion during the period under review in comparison to Rs. 175.6 billion recorded in the same period of 2016.
y Domestic borrowings to finance the budget deficit were mainly sourced from the banking sector, while the reliance placed on the non banking sector declined significantly during the first eight months of 2017 compared to the same period in 2016. Bank financing amounted
Chart 6.2Composition of Government Expenditure
(Jan-Aug 2017)
Source: Ministry of Finance and Mass Media
Interest Payments30.6%
Salaries and Wages23.2%
Other13.9%
Pensions7.1%
Samurdhi1.6%
Recurrent76.4%
Capital andNet Lending23.6%
Source: Ministry of Finance and Mass Media
Chart 6.3Major Fiscal Indicators
1
2014 2015 2016 20162017 2017
-1-2-3 -4
-8
-5-6-7
0
Perce
ntage
of G
DP
(Prov.)
Current Account Balance Primary Balance Overall Balance
Est. Jan - Aug(Prov.)
Jan - Aug(Prov.)

6
85
Fiscal Policy and Government Finance
to Rs. 236.5 billion, accounting for 86.5 per cent of total domestic financing in comparison to Rs. 138.1 billion during the first eight months of 2016. The substantial increase in commercial bank financing at Rs. 355.9 billion in the first eight months of 2017 as against a repayment of Rs. 28.5 billion made during the same period of 2016 largely contributed to the higher financing from the banking sector. However, Central Bank financing reduced significantly to a net repayment of Rs. 119.5 billion in the first eight months of 2017 from a borrowing of Rs. 166.6 billion in the same period of 2016. Meanwhile, net financing from the domestic non banking sector declined significantly to Rs. 37.0 billion in the first eight months of 2017 from Rs. 171.4 billion in the same period of 2016.
y While advances from the Central Bank contributed largely to net domestic borrowings, the contribution from financing through debt instruments such as Treasury bills and Treasury bonds was lower in the first eight months of 2017 compared to the first eight months of 2016. Net borrowings from Treasury bills amounted to Rs. 7.4 billion in the first eight months of 2017 compared to Rs. 57.3 billion in the same period of the previous year. Meanwhile, net borrowings from Treasury bonds also declined significantly to Rs. 48.7 billion in the first eight months of 2017 from Rs. 314.3
billion in the same period of 2016. There was a net repayment of Rs. 239.8 billion in respect of Central Bank holdings of Treasury bills during the first eight months of 2017 in comparison to a net borrowing of Rs. 133.0 billion witnessed during the same period of 2016. However, government borrowings through Central Bank provisional advances increased significantly by Rs. 120.3 billion during the period under review from Rs. 33.5 billion in the same period of 2016. Meanwhile, net borrowings by way of Sri Lanka Development Bonds (SLDBs) amounted to Rs. 53.3 billion during the period under consideration in comparison to a repayment of Rs. 56.0 billion in the first eight months of 2016.
y Foreign financing increased considerably during the first eight months of 2017. With the issuance of the ISBs during the first eight months of 2017, foreign borrowings to finance the budget deficit increased to Rs. 246.7 billion during the first eight months of 2017 as against a borrowing of Rs. 175.6 billion recorded in the corresponding period of 2016. Net foreign financing comprised Rs. 15.1 billion of net borrowings related to foreign project loans, Rs. 224.6 billion of ISBs, Rs. 7.1 billion of foreign investments in Treasury bonds and net repayments of Treasury bills of Rs. 39.0 million.
Table 6.3Sources of Financing
Item 2015 2016 (a)
2016Jan - Aug
(a)
2017Jan - Aug
(a)Domestic Financing (b) 592.7 248.4 309.5 273.5
Bank 291.8 140.0 138.1 236.5Non Bank 300.9 108.5 171.4 37.0
Foreign Financing 236.8 391.9 175.6 246.7Loans 131.3 109.3 37.6 15.1Commercial Loans 232.8 319.7 136.8 224.6Non Resident Investments in Treasury Bonds -79.9 -44.3 -2.9 7.1
Non Resident Investments in Treasury Bills -47.3 7.2 4.0 ....Total Financing 829.5 640.3 485.1 520.2
(a) Provisional(b) Excludes funds raised through Treasury bonds
issued for restructuring of SOBEs in 2015.
Rs. billion
Sources: Ministry of Finance and Mass Media Ministry of National Policies and Economic Affairs Central Bank of Sri Lanka
Chart 6.4Deficit Financing
0
1
2
3
4
2014 2015 2016 2017 2016 2017
Perce
ntage
of G
DP
Domestic Non Bank Foreign Domestic Bank
Jan - Aug(Prov.)
Jan - Aug(Prov.)
(Prov.) Est.
Sources: Ministry of Finance and Mass Media Ministry of National Policies
and Economic Affairs Central Bank of Sri Lanka
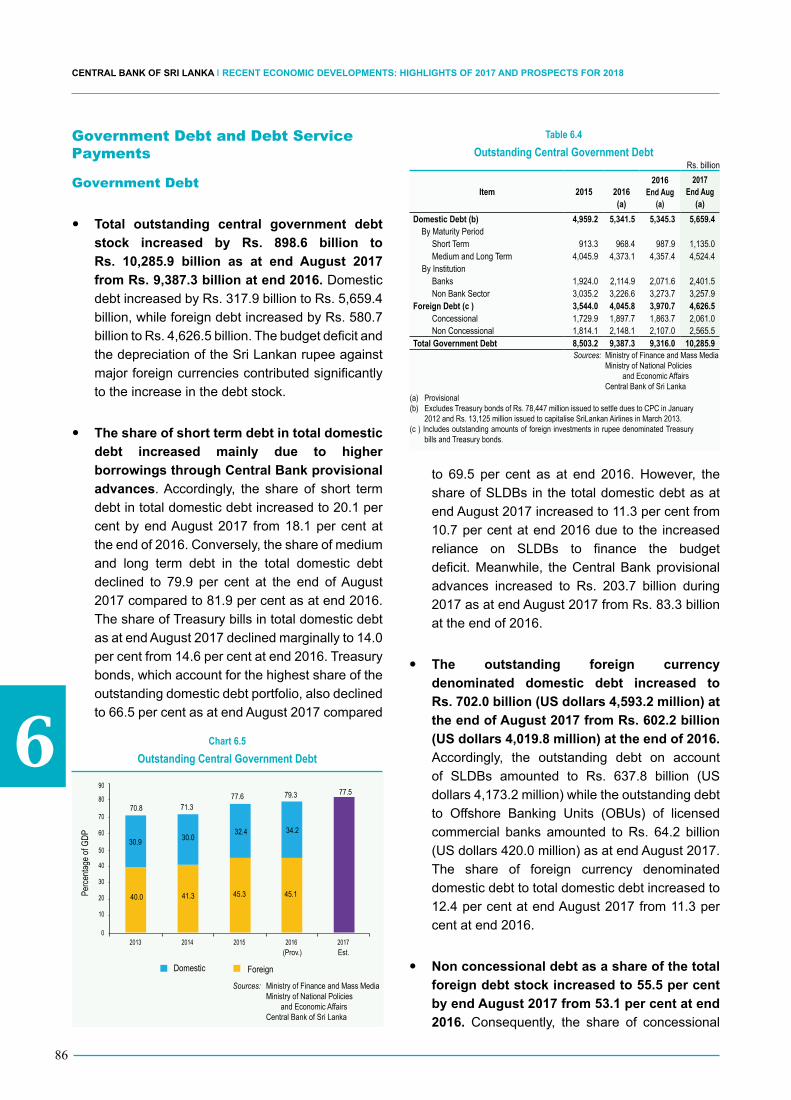
6
86
CENTRAL BANK OF SRI LANKA ǀ RECENT ECONOMIC DEVELOPMENTS: HIGHLIGHTS OF 2017 AND PROSPECTS FOR 2018
Government Debt and Debt Service Payments
Government Debt
y Total outstanding central government debt stock increased by Rs. 898.6 billion to Rs. 10,285.9 billion as at end August 2017 from Rs. 9,387.3 billion at end 2016. Domestic debt increased by Rs. 317.9 billion to Rs. 5,659.4 billion, while foreign debt increased by Rs. 580.7 billion to Rs. 4,626.5 billion. The budget deficit and the depreciation of the Sri Lankan rupee against major foreign currencies contributed significantly to the increase in the debt stock.
y The share of short term debt in total domestic debt increased mainly due to higher borrowings through Central Bank provisional advances. Accordingly, the share of short term debt in total domestic debt increased to 20.1 per cent by end August 2017 from 18.1 per cent at the end of 2016. Conversely, the share of medium and long term debt in the total domestic debt declined to 79.9 per cent at the end of August 2017 compared to 81.9 per cent as at end 2016. The share of Treasury bills in total domestic debt as at end August 2017 declined marginally to 14.0 per cent from 14.6 per cent at end 2016. Treasury bonds, which account for the highest share of the outstanding domestic debt portfolio, also declined to 66.5 per cent as at end August 2017 compared
to 69.5 per cent as at end 2016. However, the share of SLDBs in the total domestic debt as at end August 2017 increased to 11.3 per cent from 10.7 per cent at end 2016 due to the increased reliance on SLDBs to finance the budget deficit. Meanwhile, the Central Bank provisional advances increased to Rs. 203.7 billion during 2017 as at end August 2017 from Rs. 83.3 billion at the end of 2016.
y The outstanding foreign currency denominated domestic debt increased to Rs. 702.0 billion (US dollars 4,593.2 million) at the end of August 2017 from Rs. 602.2 billion (US dollars 4,019.8 million) at the end of 2016. Accordingly, the outstanding debt on account of SLDBs amounted to Rs. 637.8 billion (US dollars 4,173.2 million) while the outstanding debt to Offshore Banking Units (OBUs) of licensed commercial banks amounted to Rs. 64.2 billion (US dollars 420.0 million) as at end August 2017. The share of foreign currency denominated domestic debt to total domestic debt increased to 12.4 per cent at end August 2017 from 11.3 per cent at end 2016.
y Non concessional debt as a share of the total foreign debt stock increased to 55.5 per cent by end August 2017 from 53.1 per cent at end 2016. Consequently, the share of concessional
Chart 6.5Outstanding Central Government Debt
0
10
20
30
40
50
60
70
80
90
2013 2014 2015 2016 2017
Perce
ntage
of G
DP
ForeignDomestic(Prov.) Est.
Sources: Ministry of Finance and Mass Media Ministry of National Policies
and Economic Affairs Central Bank of Sri Lanka
70.8 71.377.6 79.3 77.5
30.9
40.0 41.3 45.3 45.1
32.4 34.230.0
Item 2015 2016(a)
2016 End Aug
(a)
2017End Aug
(a)Domestic Debt (b) 4,959.2 5,341.5 5,345.3 5,659.4
By Maturity PeriodShort Term 913.3 968.4 987.9 1,135.0Medium and Long Term 4,045.9 4,373.1 4,357.4 4,524.4
By InstitutionBanks 1,924.0 2,114.9 2,071.6 2,401.5Non Bank Sector 3,035.2 3,226.6 3,273.7 3,257.9
Foreign Debt (c ) 3,544.0 4,045.8 3,970.7 4,626.5Concessional 1,729.9 1,897.7 1,863.7 2,061.0Non Concessional 1,814.1 2,148.1 2,107.0 2,565.5
Total Government Debt 8,503.2 9,387.3 9,316.0 10,285.9
Table 6.4Outstanding Central Government Debt
Sources: Ministry of Finance and Mass Media Ministry of National Policies and Economic Affairs Central Bank of Sri Lanka
Rs. billion
(a) Provisional (b) Excludes Treasury bonds of Rs. 78,447 million issued to settle dues to CPC in January
2012 and Rs. 13,125 million issued to capitalise SriLankan Airlines in March 2013.(c ) Includes outstanding amounts of foreign investments in rupee denominated Treasury
bills and Treasury bonds.

6
87
Fiscal Policy and Government Finance
debt in total foreign debt declined to 44.5 per cent by end August 2017 from 46.9 per cent at end 2016. Non concessional debt increased by 19.4 per cent to Rs. 2,565.5 billion mainly due to higher commercial borrowings, largely on account of ISBs.
Debt Service Payments
y During the first eight months of 2017, domestic and foreign debt service payments amounted to Rs. 1,304.4 billion. This consists of amortisation payments of Rs. 785.8 billion (60.2 per cent) and interest payments of Rs. 518.6 billion (39.8 per cent). Further, debt service payments to domestic and foreign sources amounted to Rs. 1,065.4 billion and Rs. 239.0 billion, respectively. By end August 2017, total debt service payments amounted to 88.1 per cent of the original budget estimate.
Expected Developments
y Although some deviation from the envisaged budget deficit target of 4.6 per cent of GDP is likely in 2017, mainly as a result of flood and drought related fiscal expenses, medium term fiscal targets will be met through the revenue based fiscal consolidation. Implementation of new Inland Revenue Act from April 2018 will be a major step in this direction. Accordingly, tax
revenue is expected to increase to around 16 per cent of GDP by 2020 and public investment will be maintained at 5-6 per cent of GDP during 2017-2020 while unproductive expenditure will be eliminated. Further, the budget deficit is expected to reduce to 3.5 per cent of GDP by 2020 while the debt to GDP ratio is expected to reduce to a more sustainable level. However, meeting these medium term targets will be challenging without focused efforts by the government and other stakeholders. In this regard, the government is expected to strengthen the Fiscal Management Responsibility Act as stated in the Vision 2025 policy document.
Chart 6.6Government Debt Service Payments vs Revenue
0
2
4
6
8
10
12
14
16
2014 2015 2016 2017 2016 2017
Perce
ntage
of G
DP
(Prov.) Est. Jan - Aug(Prov.)
Jan - Aug(Prov.)
Government Revenue AmortisationInterestSources: Ministry of Finance and Mass Media Ministry of National Policies
and Economic Affairs Central Bank of Sri Lanka
6.1
4.3
7.4
4.74.0
6.0
3.4
4.5
5.0
5.9
5.2
6.3

6
88
CENTRAL BANK OF SRI LANKA ǀ RECENT ECONOMIC DEVELOPMENTS: HIGHLIGHTS OF 2017 AND PROSPECTS FOR 2018

Monetary Policy, interest rates, Money and credit
7T he Central Bank maintained a tight monetary policy stance during the first nine months
of 2017 to preempt the buildup of excessive demand pressures and adverse inflation expectations in the economy. The policy interest rates of the Central Bank were
increased by 25 basis points (bps) in March 2017, in addition to the 100 bps increase in policy interest rates and the 1.50 percentage point increase in the Statutory Reserve Ratio (SRR) in 2016. The year-on-year headline inflation, measured using the Colombo Consumer Price Index (CCPI) and the National Consumer Price Index (NCPI), remained in single digits, but above the desired levels during most months, mainly reflecting the impact of tax adjustments made in 2016 as well as high food inflation driven by adverse weather conditions. Meanwhile, broad money supply continued to expand at an elevated pace, caused by the gradual buildup of net foreign assets of the banking system as well as the continued, but slower, expansion in domestic credit disbursed by the banking system to both the private and public sectors. Credit obtained by the government from the Central Bank declined, although net credit to the government from commercial banks remained high. Credit extended to public corporations by the banking system expanded in 2017, although some moderation has been observed since June 2017. Credit extended to the private sector by commercial banks decelerated gradually during the year responding to tighter monetary conditions in the economy as reflected by high nominal and real interest rates. The monetary policy stance, along with the decline in market liquidity conditions, caused further upward adjustments in market interest rates, during the first half of the year. However, surplus rupee liquidity, which was observed in the market since July 2017, resulted in a moderation of interest rates in the interbank call money market and prompted other bank interest rates to stabilise at high levels. Increased foreign financial inflows to the government, improved revenue collection, and improvements to the auction system for government securities, caused a notable reduction in the yields of government securities since April 2017. Going forward, monetary expansion is expected to decelerate with the gradual moderation of the growth of private sector credit and envisaged fiscal consolidation. Although inflation is expected to remain elevated in the near term due to food price volatility, inflation outlook remains favourable in the medium term.

7
90
CENTRAL BANK OF SRI LANKA | RECENT ECONOMIC DEVELOPMENTS: HIGHLIGHTS OF 2017 AND PROSPECTS FOR 2018
Moreover, the Monetary Policy Consultative
Committee (MPCC) comprising academics,
professionals and private sector representatives
was re-established in 2017, enabling the Central
Bank to obtain views of the private sector to be
used in the monetary policy formulation process.
y Consumer price inflation remained at higher
than desired levels thus far in 2017 due to the
combined effect of tax revisions, domestic
weather related disturbances and rising
commodity prices in the global market.
Headline inflation, as measured by the year-on-
year change in the National Consumer Price
Index (NCPI, 2013=100), remained high during
the first quarter of 2017, mainly reflecting the
impact of supply side disruptions on account of
adverse weather conditions as well as the impact
of tax revisions. However, improvements in supply
conditions with the dissipation of weather related
disturbances and the government’s initiatives to
facilitate imports of essential food items eased
price pressures in the domestic market, helping
inflation to gradually moderate during the second
quarter of the year. However, NCPI based
headline inflation increased again and reached
8.6 per cent in September 2017, mainly reflecting
high food inflation. On an annual average basis,
NCPI based headline inflation was 6.8 per cent
in September 2017, compared to 4.0 per cent
recorded at end 2016. Meanwhile, Colombo
Consumer Price Index (CCPI 2013=100)
based headline inflation also recorded a similar
movement and peaked at 7.3 per cent, year-on-
year, in March 2017 before gradually declining to
4.8 per cent in July 2017 due to the decline in
food inflation with the moderation of the impact
of supply disruptions. Thereafter, CCPI based
headline inflation increased again to 7.1 per cent
in September 2017, mainly due to the sharp
increase in food inflation. On an annual average
basis, CCPI based headline inflation stood at 5.8
per cent in September 2017 compared to 4.0
per cent at end 2016.
Monetary Policy Stance of the Central Bank
y The Central Bank of Sri Lanka conducted
its monetary policy within an enhanced
monetary policy framework with the intention
of transiting to Flexible Inflation Targeting
(FIT) in the medium term to stabilise inflation
in mid-single digits of 4 - 6 per cent, thereby
facilitating a sustainable growth trajectory.
Under the current enhanced monetary policy
framework, the conduct of monetary policy is
grounded on market based monetary policy
instruments, particularly policy interest rates and
open market operations, to guide the average
weighted call money rate (AWCMR), which is the
operating target of the framework. Broad money
(M2b
) remains a key indicative intermediate
variable of this framework to guide the conduct
of monetary policy. To facilitate the transition
towards FIT, the monetary policy formulation
process is being enriched with more forward
looking monetary policy analysis complemented
by several institutional changes within the Central
Bank. Further, the Central Bank adopted a more
flexible exchange rate policy during the first nine
months of 2017, as announced, to complement
the current monetary policy measures and
support the transition to FIT. At the same time,
as the successful implementation of FIT hinges
on reliable medium term forecasts of key
macroeconomic variables and macroeconomic
simulation and policy analysis, a Forecasting
and Policy Analysis System (FPAS) has been
developed by the Central Bank with the
assistance of the International Monetary Fund
(IMF), which is currently being integrated into
the monetary policy formulation process of the
Central Bank. Further, as announced in the
“Road Map: Monetary and Financial Sector
Policies for 2017 and beyond” (Road Map 2017),
the number of Monetary Policy Committee (MPC)
meetings was reduced to eight meetings per
year in order to provide staff sufficient time for
deeper macroeconomic analysis and forecasting.
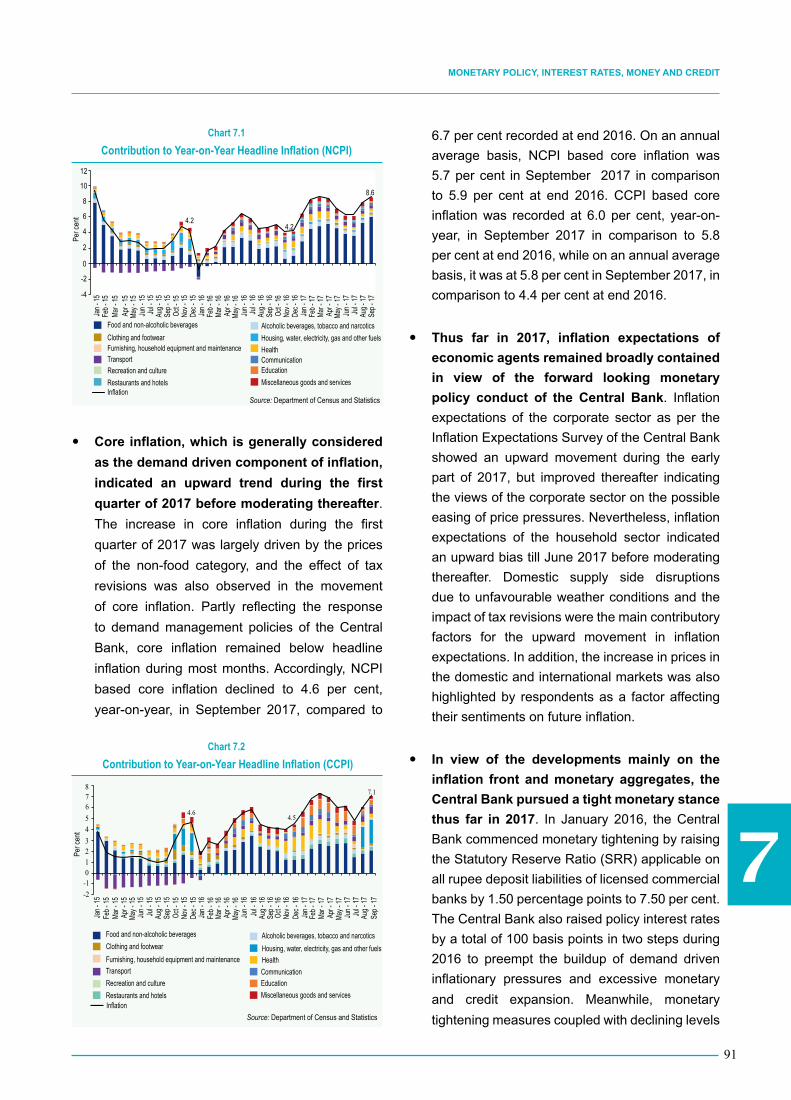
7
91
Monetary Policy, interest rates, Money and credit
y Core inflation, which is generally considered
as the demand driven component of inflation,
indicated an upward trend during the first
quarter of 2017 before moderating thereafter.
The increase in core inflation during the first
quarter of 2017 was largely driven by the prices
of the non-food category, and the effect of tax
revisions was also observed in the movement
of core inflation. Partly reflecting the response
to demand management policies of the Central
Bank, core inflation remained below headline
inflation during most months. Accordingly, NCPI
based core inflation declined to 4.6 per cent,
year-on-year, in September 2017, compared to
6.7 per cent recorded at end 2016. On an annual
average basis, NCPI based core inflation was
5.7 per cent in September 2017 in comparison
to 5.9 per cent at end 2016. CCPI based core
inflation was recorded at 6.0 per cent, year-on-
year, in September 2017 in comparison to 5.8
per cent at end 2016, while on an annual average
basis, it was at 5.8 per cent in September 2017, in
comparison to 4.4 per cent at end 2016.
y Thus far in 2017, inflation expectations of
economic agents remained broadly contained
in view of the forward looking monetary
policy conduct of the Central Bank. Inflation
expectations of the corporate sector as per the
Inflation Expectations Survey of the Central Bank
showed an upward movement during the early
part of 2017, but improved thereafter indicating
the views of the corporate sector on the possible
easing of price pressures. Nevertheless, inflation
expectations of the household sector indicated
an upward bias till June 2017 before moderating
thereafter. Domestic supply side disruptions
due to unfavourable weather conditions and the
impact of tax revisions were the main contributory
factors for the upward movement in inflation
expectations. In addition, the increase in prices in
the domestic and international markets was also
highlighted by respondents as a factor affecting
their sentiments on future inflation.
y In view of the developments mainly on the
inflation front and monetary aggregates, the
Central Bank pursued a tight monetary stance
thus far in 2017. In January 2016, the Central
Bank commenced monetary tightening by raising
the Statutory Reserve Ratio (SRR) applicable on
all rupee deposit liabilities of licensed commercial
banks by 1.50 percentage points to 7.50 per cent.
The Central Bank also raised policy interest rates
by a total of 100 basis points in two steps during
2016 to preempt the buildup of demand driven
inflationary pressures and excessive monetary
and credit expansion. Meanwhile, monetary
tightening measures coupled with declining levels
Chart 7.1 Contribution to Year-on-Year Headline Inflation (NCPI)
Per c
ent
Food and non-alcoholic beverages Alcoholic beverages, tobacco and narcotics Clothing and footwear Housing, water, electricity, gas and other fuels Furnishing, household equipment and maintenance Health Transport Communication Recreation and culture Education Restaurants and hotels Miscellaneous goods and services Inflation
Jan -
15
Jan -
16
Jan -
17
Aug -
15
Aug -
16
Aug -
17Se
p - 17
Feb -
15
Feb -
16
Feb -
17
Sep -
15
Sep -
16
Mar -
15
Mar -
16
Mar -
17
Oct -
15
Oct -
16
Apr -
15
Apr -
16
Apr -
17
Nov -
15
Nov -
16
May -
15
May -
16
May -
17
Dec -
15
Dec -
16
Jun -
15
Jun -
16
Jun -
17
Jul -
15
Jul -
16
Jul -
17
Source: Department of Census and Statistics
-4
-2
0
2
4
6
8
10
12
4.2 4.2
8.6
Per c
ent
Food and non-alcoholic beverages Alcoholic beverages, tobacco and narcotics Clothing and footwear Housing, water, electricity, gas and other fuels Furnishing, household equipment and maintenance Health Transport Communication Recreation and culture Education Restaurants and hotels Miscellaneous goods and services Inflation
Chart 7.2 Contribution to Year-on-Year Headline Inflation (CCPI)
Jan -
15
Jan -
16
Jan -
17
Aug -
15
Aug -
16
Aug -
17Se
p - 17
Feb -
15
Feb -
16
Feb -
17
Sep -
15
Sep -
16
Mar -
15
Mar -
16
Mar -
17
Oct -
15
Oct -
16
Apr -
15
Apr -
16
Apr -
17
Nov -
15
Nov -
16
May -
15
May -
16
May -
17
Dec -
15
Dec -
16
Jun -
15
Jun -
16
Jun -
17
Jul -
15
Jul -
16
Jul -
17
Source: Department of Census and Statistics
-2 -10
2 1
3 4 56 78
4.6 4.5
7.1

7
92
CENTRAL BANK OF SRI LANKA | RECENT ECONOMIC DEVELOPMENTS: HIGHLIGHTS OF 2017 AND PROSPECTS FOR 2018
of market liquidity caused an upward adjustment
in market interest rates. However, amidst upward
adjustment in lending rates, credit disbursements
to the private sector by commercial banks
continued to expand beyond the desired levels.
Driven by the excessive domestic credit flows
to the private sector as well as to the public
sector, monetary expansion continued to be
high during the latter part of 2016 and early
2017. Considering these developments, and to
contain second round effects of price increases,
which were driven by supply side factors and tax
adjustments, the Central Bank further tightened
the monetary policy stance by raising its policy
interest rates by 25 basis points in March 2017.
The Standing Deposit Facility Rate (SDFR) and
the Standing Lending Facility Rate (SLFR) of the
Central Bank remained at 7.25 per cent and 8.75
per cent, respectively, thereafter. Reflecting the
transmission of the tight monetary policy stance
of the Central Bank, market interest rates
increased, and a gradual deceleration in the
growth of credit to the private sector was observed
thus far in 2017.
y In order to steer overnight interest rates
consistent with monetary policy objectives,
the Central Bank conducted open market
operations (OMO) effectively. Rupee liquidity
in the domestic money market showed a mixed
movement in view of the domestic and foreign
currency operations of the Central Bank and the
government treasury operations, but remained
mostly negative during the first seven months of
2017. At the beginning of the year, the Central
Bank conducted repurchase auctions and outright
sales of Treasury bills to absorb the excess
liquidity that prevailed in the market. As market
liquidity remained mostly at deficit levels during
February to mid July 2017, the Central Bank
injected liquidity into the market through reverse
repurchase auctions and standing facilities. The
deficit liquidity levels prompted the AWCMR to
remain around the upper bound of the policy
rate corridor. As a result of tight monetary policy
measures amidst deficit liquidity conditions,
deposit and lending rates of commercial banks
also increased gradually. However, in line with
the improvements in market liquidity conditions
from mid July 2017, short term interest rates,
particularly AWCMR and Sri Lanka Inter Bank
Offered Rates (SLIBOR) indicated a moderation.
y The communication strategy of the Central
Bank continued to aim at enhancing the
transparency of communicating monetary
policy decisions to the general public, while
guiding expectations of economic agents
appropriately. Through its Road Map, the
Central Bank published an advance release
calendar for monetary policy announcements at
the beginning of the year. Moreover, the press
release on the review of the monetary policy
stance, which explained the rationale for the
monetary policy decision, continued to be the key
mode of announcing monetary policy decisions
to the market. In addition, each monetary policy
review announcement was followed by a media
conference chaired by the Governor and attended
by senior officials of the Central Bank. This move
is critical in helping to build and maintain policy
credibility of the Central Bank, which is crucial to
ensure the effectiveness of monetary policy. At
the same time, issuing regular and occasional
communiqués, conducting of seminars and
lectures as well as delivering speeches by the
Per c
ent
Chart 7.3 Standing Rate Corridor and Average Weighted
Call Money Rate (AWCMR)
Jan -
13
Jan -
14
Jan -
15
Jan -
16
Jan -
17
Sep -
13
Sep -
14
Sep -
15
Sep -
16
Sep -
17
Nov -
13
Nov -
14
Nov -
15
Nov -
16
Mar -
13
Mar -
14
Mar -
15
Mar -
16
Mar -
17
May -
13
May -
14
May -
15
May -
16
May -
17
Jul -
13
Jul -
14
Jul -
15
Jul -
16
Jul -
17
Standing Rate Corridor AWCMR Special SDF Rate
4
6
8
10
12
Source: Central Bank of Sri Lanka

7
93
Monetary Policy, interest rates, Money and credit
Governor and the senior officials of the Central
Bank enabled managing inflation expectations
of the public. Meanwhile, the Central Bank
continued to release its regular publications and
useful economic information on a daily, weekly,
monthly, quarterly and annual basis in all three
languages, through online and print media.
Movements in Interest Rates
Market Liquidity, Market Operations and Short Term Interest Rates
y Rupee liquidity in the domestic
money market remained mostly tight
until mid July 2017 and turned to positive
levels thereafter. The money market, which
operated with deficit liquidity conditions
mostly in the latter part of 2016, recorded
surplus overnight liquidity for a short period
during December 2016-January 2017 mainly
due to the return of currency to the banking
system after the festive season, the release of
provisional advances to the government as well
as the maturing term repurchase agreements
with the Central Bank. Since the early part
of February 2017, however, excess liquidity
declined significantly and remained in the
negative territory as a result of the maturing of
Treasury bill holdings of the Central Bank as
well as the net foreign exchange sales by the
Central Bank in the first quarter of 2017 in view
of capital outflows. Even though liquidity turned
to surplus levels occasionally due to the returning
of currency into the banking system after the New
Year season, foreign exchange purchases by the
Central Bank on a net basis and conversion of
a part of the International Sovereign Bond (ISB)
proceeds, liquidity remained mostly in deficit
levels averaged around Rs. 7.9 billion during the
early February to mid July 2017 period due to the
substantial retirements of Treasury bill holdings
of the Central Bank. Continued foreign exchange
purchases by the Central Bank and further
conversions of ISB proceeds and foreign loans
received by the government led to a turnaround
in domestic money market liquidity into a surplus
level since mid July 2017. Accordingly, the liquidity
surplus in the domestic money market during
mid July to September 2017 averaged around
Rs. 25.0 billion. In line with these developments,
the Central Bank engaged in conducting OMO
through auctions and providing standing facilities
as required, to ensure the stability in overnight
interest rates.
y Overnight money market rates hovered
around the upper bound of the policy rate
corridor during the first seven months of 2017
reflecting tight monetary conditions, and a
downward movement towards the middle
of the policy rate corridor was observed
since mid July 2017 in response to improved
liquidity conditions. AWCMR, which adjusted
downwards in January 2017 with the transitory
improvements in market liquidity levels, moved
upwards and remained around the upper bound
of the policy rate corridor thereafter, as market
liquidity levels declined and policy interest rates
were increased in March 2017. Nevertheless,
with the improvements in money market liquidity
levels, AWCMR, which was at 8.75 per cent,
started adjusting downwards since mid July 2017
and reached 8.11 per cent by end September
2017. Following a similar trend, weighted average
Chart 7.4 Rupee Liquidity in the Domestic Money Market and Liquidity
Management
Overnight Repo Auctions Overnight Rev. Repo Auctions Long Term Auctions Standing Facility Short Term Auctions
AWCMR (Right Axis)
Per c
ent
Rs. b
illion
Sep -
14
Sep -
15
Sep -
16
Sep -
17
Dec -
13
Dec -
14
Dec -
15
Dec -
16
Mar -
14
Mar -
15
Mar -
16
Mar -
17
Jun -
14
Jun -
15
Jun -
16
Jun -
17
Source: Central Bank of Sri Lanka
4
5
6
7
8
9
10
-100 -50
50 0
100 150
200 250 300 350 400

7
94
CENTRAL BANK OF SRI LANKA | RECENT ECONOMIC DEVELOPMENTS: HIGHLIGHTS OF 2017 AND PROSPECTS FOR 2018
yields at the daily OMO auctions adjusted upwards
gradually until mid July 2017 responding to the
movements in policy interest rates and liquidity
shortage, before moving downwards since mid
July 2017 with improved liquidity conditions in the
money market. Meanwhile, the SLIBOR adjusted
in line with the movements in the AWCMR and
liquidity conditions, and overnight and 12-months
SLIBOR were at 8.11 per cent and 11.99 per cent,
respectively, by end September 2017, compared
to 8.44 per cent and 12.00 per cent recorded at
end 2016.
Yields on Government Securities
y Although an increase was observed during
the first four months of 2017, yields on
government securities declined considerably
thereafter, in response to favourable market
sentiments arising from improved fiscal
performance, availability of foreign financing
and the improvements made to the auction
system. Yields on Treasury bills in the primary
market showed an upward movement during the
first four months of 2017, reflecting the impact of
increased demand for funds by the government
within a purely auction based system for issuing
government securities as well as the transmission
of tight monetary conditions. Accordingly, by end
April 2017, yields on 91- day, 182-day and 364-
day Treasury bills increased by 101 basis points,
107 basis points and 85 basis points, respectively,
compared to the yields that prevailed at end
2016. However, due to increased foreign inflows
to the government securities market since March
2017 as well as the receipt of the proceeds of the
ISB amounting to US dollars 1.5 billion and the
syndicate loan proceeds totaling US dollars 1.0
billion, the pressure in the government securities
market reduced substantially. Further, increased
government revenue collection and the receipt of
the third tranche of the IMF-EFF Programme also
helped enhance market expectations. In response
to these developments, yields of 91-day, 182-day
and 364-day Treasury bills decreased by 102,
169 and 192 basis points to 8.71 per cent, 9.01
per cent, and 9.10 per cent, respectively, by end
September 2017 compared to the yields recorded
at end April 2017.
y Following short term yields, rates on Treasury
bonds in the primary market also declined
since April 2017. In view of the high borrowing
requirements of the government, yields on
Treasury bonds displayed an increasing trend
during the first quarter of 2017, before declining
thereafter. Considering the high interest rates,
the government relied more on short and
medium term Treasury bonds during the first
nine months of 2017. Yields on 5-year Treasury
bonds, which increased from 12.16 per cent in
early January 2017 to 12.60 per cent by early
April 2017, moderated to 10.09 per cent by end
September 2017. Yields on 10-year Treasury
bonds also declined from 12.11 per cent by end
2016 to 10.31 per cent by end September 2017.
Similar movements were observed in the yields
pertaining to Treasury bonds of other maturities
as well. Meanwhile, the government issued short
and medium term US dollar denominated Sri
Lanka Development Bonds (SLDBs) at various
fixed and floating rates. Further, a 10-year ISB
was issued in May 2017 at a relatively low rate
of 6.20 per cent. The issuance of these foreign
Source: Central Bank of Sri Lanka
Jan -
13
Jan -
14
Jan -
15
Feb -
16
Mar-
17
Apr -
13
Apr -
14
May-
15
May -
16
Jun -
17
Jul -
13
Jul -
14
Aug -
15
Aug -
16
Sep-
17
Oct -
13
Oct -
14
Nov-
15
Nov -
16
Chart 7.5Primary Market Treasury Bill Yields (a)
5
6
7
8
9
10
11
12
Per c
ent
91-Day 182-Day 364-Day
(a) Yield rates for some weeks are not available.

7
95
Monetary Policy, interest rates, Money and credit
currency denominated debt securities helped to
ease the pressure on yields of domestic debt
instruments to a great extent. Meanwhile, in
order to enhance the efficiency and transparency
of domestic borrowings of the government, the
Central Bank introduced a new primary issuance
system for Treasury bonds in July 2017.
y The secondary market yields that increased
during the first four months of 2017, declined
thereafter, leading to a sharp downward shift
in the yield curve for government securities,
particularly from the long end. The yields on
short term maturities declined marginally, while
the long term yields declined substantially.
Accordingly, the yields on 91-day, 182-day and
364-day Treasury bills declined by 8 basis points,
68 basis points and 106 basis points, respectively,
by end September 2017, in comparison to the
yields observed at end 2016. Secondary market
yields on Treasury bonds declined within a range
of 196 to 242 basis points by end September
2017, in comparison to the yields observed at end
2016. This downward shift in the yield curve could
be attributed to favourable market expectations
in view of continued fiscal consolidation and
improved debt management strategies as well as
favourable inflation expectations over the medium
term, as a result of forward looking monetary
policy decisions.
Chart 7.6Secondary Market Yield Curve for Government Securities
5
6
7 8
9
10 11
12
13
14
Per c
ent
1 Yea
r
End 2014 End 2015 End 2016 End Sep 2017
5 Yea
r
10 Ye
ar
Source: Central Bank of Sri Lanka
Table 7.1 Movements in Interest Rates
Per cent per annum
Sources: Colombo Stock Exchange Respective financial institutions Central Bank of Sri Lanka
(a) Weighted average yield rates at the latest available auction.
(b) Based on the rates quoted by commercial banks.(c) Maximum rate is a special rate offered by certain
Commercial banks.(d) As at end August 2017.(e) Based on the rates quoted by other selected
Financial Institutions.(f) Interest rate ranges are based on the average
maximum and average minimum rates quoted by LFCs. Data for 2017 are provisional.
(g) Lending for housing purposes only.
Interest Rate End 2016 End September 2017
Policy Interest Rates Standing Deposit Facility Rate 7.00 7.25 Standing Lending Facility Rate 8.50 8.75
Average Weighted Call Money Rate (AWCMR) 8.42 8.11Yield Rates on Government Securities Primary Market (a)
Treasury bills 91-day 8.72 8.71 182-day 9.63 9.01 364-day 10.17 9.10
Treasury bonds 2-year 11.04 9.83 3-year 11.62 - 4-year 11.94 11.14 5-year 11.76 10.09 10-year 12.11 10.31
Secondary Market Treasury bills 91-day 8.69 8.61 182-day 9.60 8.92 364-day 10.17 9.11
Treasury bonds 2-year 11.38 9.42 3-year 11.80 9.71 4-year 12.04 9.94 5-year 12.18 10.04 10-year 12.55 10.28
Licensed Commercial Banks (b) Interest Rates on Deposits
Savings Deposits 0.50-9.00 0.50-9.50 1 Year Fixed Deposits (c) 4.50-15.00 4.89-15.00 Average Weighted Deposit Rate (AWDR) 8.17 9.25 Average Weighted Fixed Deposit Rate (AWFDR) 10.46 11.81
Average Weighted New Deposit Rate (AWNDR) 11.17 11.04 (d)Interest Rates on Lending
Average Weighted Prime Lending Rate (AWPR) 11.73 11.42 Average Weighted Lending Rate (AWLR) 13.20 13.90 (d) Average Weighted New Lending Rate (AWNLR) 14.37 15.12 (d)
Other Financial Institutions (e)Interest Rates on Deposits
National Savings BankSavings Deposits 4.25 4.001 - year Fixed Deposits 11.00 11.00
Licensed Finance Companies (f)Savings Deposits 5.38-7.74 5.44-7.84 (d)1 - year Fixed Deposits 12.13-14.06 12.53-14.08 (d)
Interest Rates on Lending National Savings Bank 9.75-15.00 13.00-16.00State Mortgage and Investment Bank (g) 10.50-20.00 10.50-20.00Licensed Finance Companies (f)
Finance Leasing 17.48-25.97 17.52-29.29 (d)Hire Purchase 17.51-22.65 16.83-20.77 (d)Loans against Real Estate 19.12-20.80 18.03-20.23 (d)
Corporate Debt MarketDebentures 9.60-13.75 12.75-15.00 (d)Commercial Paper 8.70-14.80 14.25-16.50 (d)
15 Ye
ar
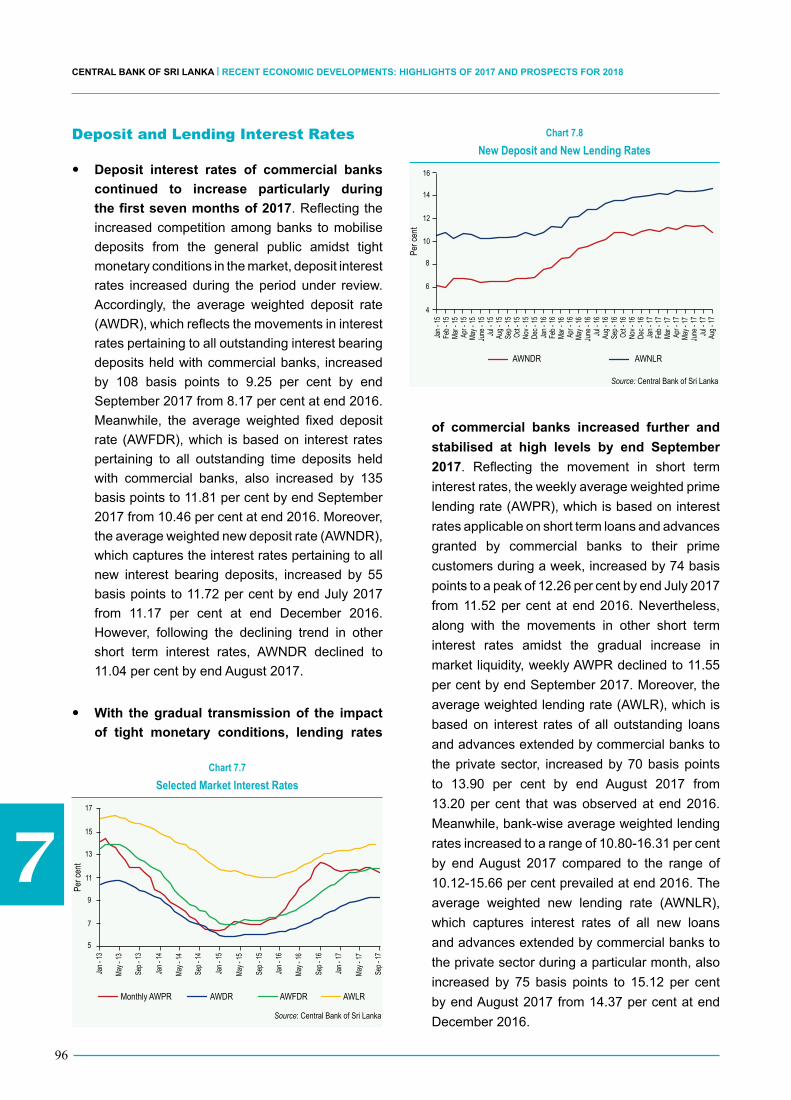
7
96
CENTRAL BANK OF SRI LANKA | RECENT ECONOMIC DEVELOPMENTS: HIGHLIGHTS OF 2017 AND PROSPECTS FOR 2018
Deposit and Lending Interest Rates
y Deposit interest rates of commercial banks
continued to increase particularly during
the first seven months of 2017. Reflecting the
increased competition among banks to mobilise
deposits from the general public amidst tight
monetary conditions in the market, deposit interest
rates increased during the period under review.
Accordingly, the average weighted deposit rate
(AWDR), which reflects the movements in interest
rates pertaining to all outstanding interest bearing
deposits held with commercial banks, increased
by 108 basis points to 9.25 per cent by end
September 2017 from 8.17 per cent at end 2016.
Meanwhile, the average weighted fixed deposit
rate (AWFDR), which is based on interest rates
pertaining to all outstanding time deposits held
with commercial banks, also increased by 135
basis points to 11.81 per cent by end September
2017 from 10.46 per cent at end 2016. Moreover,
the average weighted new deposit rate (AWNDR),
which captures the interest rates pertaining to all
new interest bearing deposits, increased by 55
basis points to 11.72 per cent by end July 2017
from 11.17 per cent at end December 2016.
However, following the declining trend in other
short term interest rates, AWNDR declined to
11.04 per cent by end August 2017.
y With the gradual transmission of the impact
of tight monetary conditions, lending rates
of commercial banks increased further and
stabilised at high levels by end September
2017. Reflecting the movement in short term
interest rates, the weekly average weighted prime
lending rate (AWPR), which is based on interest
rates applicable on short term loans and advances
granted by commercial banks to their prime
customers during a week, increased by 74 basis
points to a peak of 12.26 per cent by end July 2017
from 11.52 per cent at end 2016. Nevertheless,
along with the movements in other short term
interest rates amidst the gradual increase in
market liquidity, weekly AWPR declined to 11.55
per cent by end September 2017. Moreover, the
average weighted lending rate (AWLR), which is
based on interest rates of all outstanding loans
and advances extended by commercial banks to
the private sector, increased by 70 basis points
to 13.90 per cent by end August 2017 from
13.20 per cent that was observed at end 2016.
Meanwhile, bank-wise average weighted lending
rates increased to a range of 10.80-16.31 per cent
by end August 2017 compared to the range of
10.12-15.66 per cent prevailed at end 2016. The
average weighted new lending rate (AWNLR),
which captures interest rates of all new loans
and advances extended by commercial banks to
the private sector during a particular month, also
increased by 75 basis points to 15.12 per cent
by end August 2017 from 14.37 per cent at end
December 2016.
Chart 7.7Selected Market Interest Rates
Per c
ent
Monthly AWPR AWDR AWFDR AWLR
Jan -
13
Jan -
14
Jan -
15
Jan -
16
Jan -
17
May -
13
May -
14
May -
15
May -
16
May -
17
Sep -
13
Sep -
14
Sep -
15
Sep -
16
Sep -
17
Source: Central Bank of Sri Lanka
5
7
9
11
13
15
17
Chart 7.8New Deposit and New Lending Rates
Per c
ent
AWNDR AWNLR
Jan -
15
Jan -
16
Jan -
17
Sep -
15
Sep -
16
Mar -
15
Mar -
16
Mar -
17
Nov -
15De
c - 15
Dec -
16
Oct -
15
Oct -
16No
v - 16
May -
15
May -
16
May -
17
Jul -
15
Jul -
16
Jul -
17
Source: Central Bank of Sri Lanka
4
6
8
10
12
14
16
Feb -
15
Feb -
16
Feb -
17
Apr -
15
Apr -
16
Apr -
17
June
- 15
June
- 16
June
- 17
Aug -
15
Aug -
16
Aug -
17

7
97
Monetary Policy, interest rates, Money and credit
Interest Rates on Debt Instruments
y In line with other market interest rates,
interest rates applicable on corporate
debt securities increased during the first
eight months of 2017. Interest rates on
commercial paper, which is a short term debt
instrument, increased substantially to a range of
14.25-16.50 per cent during the first eight
months of 2017 compared to the range of
8.70 - 14.80 per cent observed in 2016. Meanwhile,
there were seven listings of debentures by two
corporates during the first eight months of 2017
with maturities of 5-8 years at various fixed and
floating rates. Fixed interest rates applicable on
debentures were in the range of 12.75-15.00 per
cent by end August 2017 compared to a range of
9.60-13.75 per cent recorded at end 2016.
Interest Rates on Foreign Currency Deposits
y Interest rates applicable on foreign currency
deposits maintained with commercial banks
increased marginally during the first nine
months of 2017. Following the increase in the
Federal funds target rate in March and June 2017,
interest rates on US dollar denominated savings
deposits were recorded in a range of 0.02-4.23
per cent by end September 2017 compared to
the range of 0.02-3.62 per cent observed at end
2016. Moreover, interest rates pertaining to US
dollar denominated time deposits were in the
range of 0.15-6.15 per cent by end September
2017 compared to the range of 0.15-5.00
per cent at end 2016. Meanwhile, interest rates
on savings deposits denominated in pound
sterling remained broadly unchanged in a range
of 0.10-2.00 per cent by end September 2017
compared to the range of 0.05-2.01 per cent at
end 2016. Interest rates applicable on pound
sterling denominated time deposits were in the
range of 0.20-4.52 per cent by end September
2017 in comparison to the range of 0.25-4.02
per cent at end 2016.
Movements in Monetary and Credit Aggregates
Reserve Money
y Reserve money, which increased at a high
rate in 2016, moderated during the first eight
months of 2017 mainly on account of the
high base observed in the corresponding
period of 2016 due to upward adjustment in
SRR in January 2016. The year-on-year growth
of reserve money decelerated to 16.0 per cent
by end August 2017 compared to 27.1 per cent
recorded at end 2016. In absolute terms, reserve
money increased by Rs. 55.2 billion to Rs. 911.4
billion during the first eight months of 2017
compared to the increase of Rs. 112.3 billion
recorded in the corresponding period of 2016,
reflecting a significant moderation in the increase
of commercial bank deposits with the Central
Bank. From the liability side of reserve money,
commercial banks’ deposits with the Central Bank
increased by Rs. 26.4 billion to Rs. 329.7 billion
by end August 2017 compared to the increase
of Rs. 82.3 billion during the corresponding
period of 2016. Currency in circulation also
increased by Rs. 28.9 billion to Rs. 581.7 billion
by end August 2017. Although the movements
in currency in circulation followed historical
patterns with a sharp pickup during festive
seasons, the year-on-year growth of currency in
circulation was at 11.5 per cent by end August
2017 compared to 12.4 per cent during the
corresponding period of 2016. With these
developments, reserve money, which is
considered as an indicative target under the
current IMF-EFF Programme, remained below
the target for the third quarter of 2017.
y Viewed from the assets side, the increase in
reserve money during the first eight months
of 2017 was entirely due to the expansion in
net foreign assets (NFA) of the Central Bank,
while net domestic assets (NDA) of the Central
Bank contracted during the period under
review. NFA of the Central Bank increased by

7
98
CENTRAL BANK OF SRI LANKA | RECENT ECONOMIC DEVELOPMENTS: HIGHLIGHTS OF 2017 AND PROSPECTS FOR 2018
Rs. 187.2 billion during the first eight months of
2017 compared to the decline of Rs. 77.2 billion in
the corresponding period of 2016. The expansion
in NFA of the Central Bank was attributable to
the increase in Central Bank’s foreign currency
financial assets, particularly with the foreign
exchange purchases of the Central Bank from
the domestic foreign exchange market as well as
the conversions of proceeds of the ISB and the
syndicated loans obtained by the government. In
contrast to the buildup of NFA, NDA of the Central
Bank contracted by Rs. 131.9 billion to reach
Rs. 165.6 billion during the first eight months of
2017 in comparison to the significant increase of
Rs. 200.3 billion recorded during 2016. The
decline in NDA was mainly due to the contraction
in net credit to the government (NCG) by the
Central Bank. With the Central Bank retiring its
Treasury bill holdings, NCG by the Central Bank
declined by Rs. 119.5 billion to Rs. 293.5 billion
during the first eight months of 2017 compared
to an increase of Rs. 166.6 billion during the
corresponding period of 2016. Significantly
contributing to the contraction in NCG, Central
Bank Treasury bill holdings (net of repurchase
transactions) declined by Rs. 239.8 billion to
Rs. 90.2 billion by end August 2017, compared
to the historically highest level of Rs. 330.0 billion
recorded at end 2016. In addition to allowing
the Treasury bill holdings to mature, the Central
Bank conducted auctions to sell its Treasury
bills on an outright basis to absorb excess
liquidity in the market permanently since mid
July 2017. Nevertheless, provisional advances
to the government by the Central Bank increased
by Rs. 120.3 billion to Rs. 203.7 billion by end
August 2017.
Narrow Money (M1)
y The year-on-year growth of narrow money
(M1) continued to moderate during the first
eight months of 2017 reflecting the increased
opportunity cost of holding money in an
environment of high market interest rates. M1,
which consists of the most liquid financial assets
such as currency and demand deposits, recorded
a moderate growth of 6.3 per cent, year-on-year,
by end August 2017 compared to 8.6 per cent
by end 2016. With regard to the components
of M1, currency held by the public grew by 9.7
per cent, year-on-year, during the first eight
months of 2017 compared to a growth of 10.7 per
cent in 2016, and accounted for around 87 per
cent of the expansion in M1. Demand deposits held
by the public with commercial banks grew only by
1.9 per cent, year-on-year, during the first eight
months of 2017 compared to 6.2 per cent recorded
in 2016. In absolute terms, demand deposits held
by the public with commercial banks increased by
Rs. 6.0 billion during the 12 months ending August
2017 compared to the increase of Rs. 23.5 billion
recorded in the preceding 12 months.
Broad Money (M2b) and Domestic Credit
y Broad money supply (M2b
) continued to
expand at a high rate during the first eight
months of 2017. The year-on-year growth of M2b
was 21.3 per cent by end August 2017 compared
to a growth of 18.4 per cent by end 2016, while
the average growth stood at 20.1 per cent during
the first eight months of 2017 compared to 18.1
per cent in 2016. The expansion in M2b
is
attributable to both NDA and NFA of the banking
Chart 7.9Daily Reserve Money (a)
Rs . b
illion
2015 2016 2017
Jan
Aug
Feb
Sep
Mar
Oct
Apr
Nov
May
Dec
Jun Jul
520
620
720
820
920
1,020
Source: Central Bank of Sri Lanka
(a) Sudden changes in the movement of reserve money are due to SRR adjustments and seasonal factors.
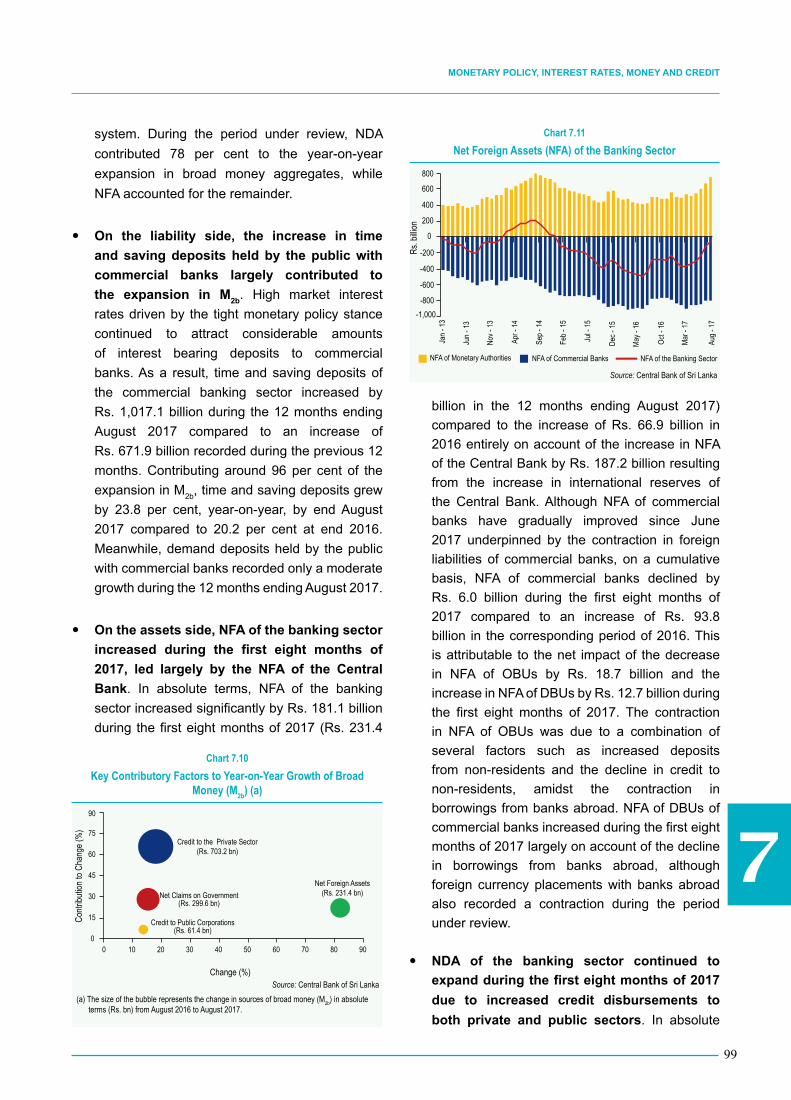
7
99
Monetary Policy, interest rates, Money and credit
system. During the period under review, NDA
contributed 78 per cent to the year-on-year
expansion in broad money aggregates, while
NFA accounted for the remainder.
y On the liability side, the increase in time
and saving deposits held by the public with
commercial banks largely contributed to
the expansion in M2b
. High market interest
rates driven by the tight monetary policy stance
continued to attract considerable amounts
of interest bearing deposits to commercial
banks. As a result, time and saving deposits of
the commercial banking sector increased by
Rs. 1,017.1 billion during the 12 months ending
August 2017 compared to an increase of
Rs. 671.9 billion recorded during the previous 12
months. Contributing around 96 per cent of the
expansion in M2b
, time and saving deposits grew
by 23.8 per cent, year-on-year, by end August
2017 compared to 20.2 per cent at end 2016.
Meanwhile, demand deposits held by the public
with commercial banks recorded only a moderate
growth during the 12 months ending August 2017.
y On the assets side, NFA of the banking sector
increased during the first eight months of
2017, led largely by the NFA of the Central
Bank. In absolute terms, NFA of the banking
sector increased significantly by Rs. 181.1 billion
during the first eight months of 2017 (Rs. 231.4
billion in the 12 months ending August 2017)
compared to the increase of Rs. 66.9 billion in
2016 entirely on account of the increase in NFA
of the Central Bank by Rs. 187.2 billion resulting
from the increase in international reserves of
the Central Bank. Although NFA of commercial
banks have gradually improved since June
2017 underpinned by the contraction in foreign
liabilities of commercial banks, on a cumulative
basis, NFA of commercial banks declined by
Rs. 6.0 billion during the first eight months of
2017 compared to an increase of Rs. 93.8
billion in the corresponding period of 2016. This
is attributable to the net impact of the decrease
in NFA of OBUs by Rs. 18.7 billion and the
increase in NFA of DBUs by Rs. 12.7 billion during
the first eight months of 2017. The contraction
in NFA of OBUs was due to a combination of
several factors such as increased deposits
from non-residents and the decline in credit to
non-residents, amidst the contraction in
borrowings from banks abroad. NFA of DBUs of
commercial banks increased during the first eight
months of 2017 largely on account of the decline
in borrowings from banks abroad, although
foreign currency placements with banks abroad
also recorded a contraction during the period
under review.
y NDA of the banking sector continued to
expand during the first eight months of 2017
due to increased credit disbursements to
both private and public sectors. In absolute
Chart 7.11Net Foreign Assets (NFA) of the Banking Sector
-1,000 -800
-600
-400
-200
0
200
400
600
800
Rs. b
illion
Jan -
13
Dec -
15
Jun -
13
May -
16
Nov -
13
Oct -
16
Apr -
14
Mar -
17
Sep -
14
Aug -
17
Feb -
15
Jul -
15
NFA of Monetary Authorities NFA of Commercial Banks NFA of the Banking Sector
Source: Central Bank of Sri Lanka
Chart 7.10Key Contributory Factors to Year-on-Year Growth of Broad
Money (M2b) (a)
Contr
ibutio
n to C
hang
e (%
)
Change (%)
Credit to Public Corporations(Rs. 61.4 bn)
Credit to the Private Sector (Rs. 703.2 bn)
Net Claims on Government (Rs. 299.6 bn)
Net Foreign Assets (Rs. 231.4 bn)
Source: Central Bank of Sri Lanka(a) The size of the bubble represents the change in sources of broad money (M2b) in absolute
terms (Rs. bn) from August 2016 to August 2017.
0
15
30
45
60
75
90
0 10 20 30 40 50 60 70 80 90

7
100
CENTRAL BANK OF SRI LANKA | RECENT ECONOMIC DEVELOPMENTS: HIGHLIGHTS OF 2017 AND PROSPECTS FOR 2018
terms, NDA of the banking system increased by
Rs. 463.8 billion during the first eight months of
2017 (Rs. 830.6 billion in the 12 months ending
August 2017) contributing towards 78 per cent
of the monetary expansion compared to an
increase of Rs. 406.0 billion observed during the
corresponding period of 2016. The expansion in
NDA of the banking sector thus far in 2017 was
driven by credit flows to the private sector, the
government as well as to public corporations,
despite the deceleration in private sector credit
growth observed since July 2016 and the
moderate increase in credit to public corporations
during the first eight months of 2017.
y NCG by the banking sector continued to
increase during the first eight months of
2017 contributing around 57 per cent of the
expansion in NDA. NCG from the banking
system increased by Rs. 265.4 billion during
the first eight months of 2017 compared to the
increase of Rs. 178.4 billion in the corresponding
period of 2016. The increase in NCG is entirely
attributable to the expansion in NCG from
commercial banks, while NCG from the Central
Bank contracted considerably during the
period under review. Accordingly, NCG from
commercial banks increased significantly by
Rs. 384.9 billion in the first eight months of
2017 in comparison to the increase of Rs. 11.8
billion in the corresponding period of 2016. The
increase in NCG of commercial banks was driven
by the credit disbursed by both DBUs and OBUs
of commercial banks. NCG by DBUs increased
by Rs. 323.6 billion in the first eight months of
2017 following the increase of Rs. 96.6 billion in
2016 mainly driven by investments in Treasury
bills and SLDBs amounting to Rs. 255.4 billion
and Rs. 39.5 billion, respectively. Meanwhile,
government overdraft balances with commercial
banks also increased by Rs. 50.6 billion
during the period under review. Nevertheless,
investments in Treasury bonds by commercial
banks contracted by Rs. 14.7 billion during the
first eight months of 2017. Moreover, NCG by
OBUs increased by Rs. 61.3 billion during the
first eight months of 2017, following a contraction
of Rs. 67.1 billion by end 2016. This was mainly
due to an increase in investments in SLDBs by
Rs. 22.1 billion and the increase in foreign
currency loans to the government amounting to
Rs. 39.2 billion. Meanwhile, reversing the trend
observed during 2016, NCG of the Central Bank
declined significantly by Rs. 119.5 billion during
the first eight months of 2017. This decline was
entirely due to the notable reduction in Treasury
bill holdings (net of repurchase transactions) of
the Central Bank by Rs. 239.8 billion during the
first eight months of 2017 to reach Rs. 90.2 billion.
The Central Bank allowed a considerable amount
of Treasury bills to mature during the period under
review, while outright sales of Treasury bills by
the Central Bank during the months of July and
August 2017 to absorb excess liquidity in the
market on permanent basis also contributed to
the recorded contraction in Treasury bill holdings
of the Central Bank. Meanwhile, provisional
advances to the government by the Central
Period
Absolute Change (Rs. billion) Share of Domestic Credit (%)
Domestic Credit (a)
Credit to Private Sector
Net Credit to the Government
Credit to Public Corporations
Credit to Private Sector
Net Credit to the Government
Credit to Public Corporations
2013 504.7 175.9 256.1 72.6 34.9 50.7 14.4 2014 439.4 223.9 134.6 80.9 51.0 30.6 18.4 2015 1,091.9 691.4 323.6 76.9 63.3 29.6 7.0 2016 939.6 754.9 212.6 -27.9 80.3 22.6 -3.0 Jan - Aug 2016 553.3 456.3 178.4 -81.5 82.5 32.3 -14.7 Jan - Aug 2017 677.8 404.6 265.4 7.8 59.7 39.2 1.2
(a) Domestic Credit includes Credit to the Private Sector, Net Credit to the Government and Credit to Public Corporations. Source: Central Bank of Sri Lanka
Table 7.2Domestic Credit Expansion and Contributory Factors

7
101
Monetary Policy, interest rates, Money and credit
Bank, which recorded a sharp increase of around
Rs. 120 billion to Rs. 203.7 billion in January 2017
with the full utilisation of the entitlement for the
year, remained almost unchanged by end August
2017.
y The increasing trend in credit to public
corporations since September 2016 continued
during the first five months of 2017, but
moderated thereafter. The total cumulative
increase in credit obtained by public corporations
in 2017, which amounted to Rs. 66.6 billion by
end May, subsequently reduced to Rs. 7.8 billion
by end August 2017, compared to a contraction
of Rs. 81.5 billion recorded in the corresponding
period of 2016. The increase in credit to public
corporations during the first eight months of 2017
was largely driven by borrowings by National
Water Supply and Drainage Board (NWS&DB)
amounting to Rs. 16.2 billion, Road Development
Authority (RDA) amounting to Rs. 7.8 billion and
SriLankan Airlines amounting to Rs. 7.6 billion.
Although, Ceylon Petroleum Corporation (CPC)
repaid around Rs. 52.8 billion of its loan liabilities
during the period from May to August 2017,
containing the overall expansion in credit to public
corporations, net repayment by CPC was limited
to Rs. 10.8 billion during the first eight months of
2017 as a result of their borrowings during the first
four months of 2017. Further during the first eight
months of 2017, Urban Development Authority,
Ceylon Fertilizer Corporation, Ceylon Electricity
Board (CEB), Paddy Marketing Board, Colombo
Commercial Fertilizer Corporation and Sri Lanka
Ports Authority also partially settled their loan
liabilities to commercial banks by Rs. 6.5 billion,
Rs. 2.7 billion, Rs. 2.6 billion, Rs. 1.8 billion,
Rs. 1.3 billion and Rs. 1.1 billion, respectively.
y In an environment of high nominal and real
interest rates, the growth of credit to the
private sector by commercial banks showed
signs of deceleration during the first eight
months of 2017. In addition to the upward
adjustment in policy interest rates in view of high
credit expansion, macroprudential measures and
tariff adjustments to discourage selected imports
also contributed to the deceleration of private
sector credit growth. Accordingly, the year-on-year
growth of credit to the private sector was at 18.0
per cent by end August 2017 compared to 21.9
per cent at end 2016 and the peak level of 28.5
per cent recorded in July 2016. In absolute terms
also, the growth of credit to the private sector in
the first eight months of 2017 remained below the
expansion observed in the corresponding period
of 2016. Accordingly, credit to the private sector
increased by Rs. 404.6 billion during the first
eight months of 2017 compared to the increase of
Rs. 456.3 billion in the corresponding period of
2016. Meanwhile, the removal of interest rate
caps on credit cards, other loans and advances
and penal interest rates charged on overdue
loans and advances by licensed banks with effect
from 01 July 2017 could also dampen the demand
for credit by the private sector to some extent in
the period ahead.
y Credit granted to all major sectors continued
to expand during the first half of 2017,
although at a slower rate than in 2016. As
per the Quarterly Survey of Commercial Banks’
Loans and Advances to the private sector, credit
to the Industry sector and the Agriculture sector
grew by 21.1 per cent and 20.5 per cent, on a
year-on-year basis, respectively, by end June
2017. In the Agriculture sector, credit to all sub
Chart 7.12Credit Granted by Commercial Banks to the Private Sector
15.4
76.5
43.6
78.7 18.0
-20
-10
0
10
20
30
40
(100)
(50)
50
100
150
200
Rs. b
illion
Monthly Change in Credit (Left Axis)
Year-on-Year Growth of Credit (Right Axis)
Per c
ent
Jan -
13
Dec -
15
Jun -
13
May -
16
Nov -
13
Oct -
16
Apr -
14
Mar -
17
Sep -
14
Aug -
17
Feb -
15
Jul -
15
Source: Central Bank of Sri Lanka

7
102
CENTRAL BANK OF SRI LANKA | RECENT ECONOMIC DEVELOPMENTS: HIGHLIGHTS OF 2017 AND PROSPECTS FOR 2018
sectors recorded positive growth rates, and credit
to Coconut, Paddy, Livestock and Dairy Farming
and Fisheries grew by more than 35 per cent,
year-on-year, by end June 2017. This increase
in growth of credit to the Agriculture sector could
be, in part, a reflection of increased borrowings
to support the recovery from weather related
disruptions in certain regions. Meanwhile, credit
flows towards all sub sectors of the Industry
sector recorded positive growth rates, with
the Construction sector, which accounts for
around 48 per cent of the total credit flows to the
Industry sector and around 20 per cent of total
private sector credit, recording a growth of 21.8
per cent, year-on-year, by end June 2017.
Growth in credit to the Services sector moderated
to 15.8 per cent by end June 2017 compared to
the growth of 46.1 per cent recorded during the
corresponding period of 2016 largely on account
of the moderation in credit flows to the Financial
and Business Services sub-sector. Further,
credit flows to sub sectors of Tourism, Transport,
Printing and Publishing, and Education recorded
relatively high growth rates, while credit to the
sub-sector of Shipping, Aviation and Freight
Forwarding contracted by 12.9 per cent by end
June 2017. Credit under the Personal Loans and
Chart 7.13Year-on-Year Growth of Credit Granted by Commercial Banks
to Key Sectors
-20
-10
0 10
20
30
40
50
60
Per c
ent
Mar-
13
Mar-
14
Mar-
15
Mar-
16
Mar-
17
Jun -
13
Jun -
14
Jun -
15
Jun -
16
Jun -
17
Sep -
13
Sep -
14
Sep -
15
Sep -
16
Dec -
13
Dec -
14
Dec -
15
Dec -
16
Agriculture and Fishing Industry Services Personal Loans and AdvancesTotal Loans and Advances to the Private Sector
Source: Central Bank of Sri Lanka
Sector End June 2016 (c)
End June 2017 (d)
Year-on-Year Change
Amount %
Agriculture and Fishing 317.0 382.0 65.0 20.5of which, Tea 78.1 84.6 6.6 8.4
Rubber 20.4 25.3 4.9 23.8 Coconut 12.5 19.6 7.0 56.0 Paddy 23.5 32.3 8.9 37.8 Vegetables, Fruit and Minor Food Crops 22.0 27.2 5.2 23.6 Fisheries 12.3 16.8 4.5 36.8
Industry 1,539.6 1,864.0 324.4 21.1of which, Construction 741.0 902.8 161.8 21.8
Food and Beverages 86.5 103.6 17.2 19.8 Textiles and Apparel 144.7 156.8 12.0 8.3 Fabricated Metal Products, Machinery and Transport Equipment 126.5 158.5 32.0 25.3
Services 1,149.7 1,331.0 181.3 15.8of which, Wholesale and Retail Trade 353.6 400.0 46.3 13.1
Tourism 118.8 160.4 41.7 35.1 Financial and Business Services 282.2 306.6 24.4 8.7 Shipping, Aviation and Freight Forwarding 26.1 22.7 -3.4 -12.9
Personal Loans and Advances (e) 824.2 972.1 147.9 17.9of which, Consumer Durables 172.0 207.0 35.1 20.4
Pawning 122.3 137.5 15.2 12.4Total 3,830.5 4,549.1 718.6 18.8
(a) Based on the Quarterly Survey of Commercial Banks’ Loans and Advances to the Private Sector. (b) Includes loans, overdrafts and bills discounted and purchased and excludes cash items in the process of collection (c) Revised (d) Provisional (e) Excludes personal housing loans, which have been included under ‘Construction’ classified under ‘Industry’ and includes credit card advances
Rs. billion
Source: Central Bank of Sri Lanka
Table 7.3 Classification of Outstanding Credit to the Private Sector Granted by Commercial Banks (a)(b)

7
103
Monetary Policy, interest rates, Money and credit
Advances category grew by 17.9 per cent, year-
on-year, during the first half of 2017, a marginal
moderation compared to the growth of 18.7
per cent recorded in the corresponding period
of 2016. Within this sub-sector, credit disbursed
under credit cards grew by 22.6 per cent during
the first half of 2017. Pawning Advances, which
continued to decline since September 2013,
reversed this trend during the first half of 2017,
recording a year-on-year growth of 12.4 per cent
by end June 2017. This was mainly attributable to
the rise in international gold prices as well as gold
imports. Nevertheless, growth in credit disbursed
to purchase consumer durables decelerated to
20.4 per cent by end June 2017 compared to
the significant growth of 58.9 per cent recorded
in the corresponding period of the previous
year. With regard to the maturity-wise analysis
of credit, the year-on-year growth of short term
loans accelerated to 18.4 per cent by end June
2017 compared to 15.7 per cent recorded in
the corresponding period of 2016. Meanwhile,
growth in medium and long term loans moderated
significantly to 14.2 per cent and 23.3 per cent,
respectively, by end June 2017, compared to 25.6
per cent and 55.8 per cent, respectively, at end
June 2016.
Broad Money (M4)
y Growth of broad money supply (M4)1, as
measured by the financial survey, moved
in line with the growth of M2b
. By end August
2017, M4 grew at a higher rate of 20.7 per cent
compared to a growth of 15.9 per cent recorded
at end 2016. Viewed from the liability side of
M4, total time and savings deposits held by the
public with licensed commercial banks (LCBs),
licensed specialised banks (LSBs) and licensed
finance companies (LFCs) grew by 22.7 per cent,
1 Financial Survey provides a broader measure of liquidity, covering LSBs and LFCs, in addition to LCBs and the Central Bank.
Sector EndAug-16
End2016
EndAug-17 (a)
Year-on-Year Change
End 2016 Aug-17
Amount % Amount %
Financial Survey (M4) 6,178.8 6,630.3 7,457.0 910.0 15.9 1,278.2 20.7
Underlying Factors Net Foreign Assets -429.1 -383.2 -205.2 61.0 13.7 223.9 52.2
Monetary Authorities 499.0 558.6 745.8 -17.6 -3.1 246.8 49.4LCBs -780.5 -789.8 -795.9 84.5 9.7 -15.3 -2.0LSBs & LFCs -147.6 -152.0 -155.1 -6.0 -4.1 -7.6 -5.1
Net Domestic Assets 6,607.9 7,013.5 7,662.3 849.1 13.8 1,054.4 16.0 Domestic Credit 8,293.2 8,763.3 9,595.6 1,159.6 15.3 1,302.4 15.7 Net Credit to the Government 2,529.4 2,555.9 2,843.2 211.6 9.0 313.7 12.4
Monetary Authorities 396.5 413.0 293.5 183.1 79.6 -103.0 -26.0 LCBs 1,541.4 1,559.1 1,944.0 29.6 1.9 402.6 26.1 LSBs 527.0 515.7 541.4 -13.6 -2.6 14.5 2.7
LFCs 64.5 68.1 64.2 12.5 22.5 -0.3 -0.5
Credit to Public Corporations (LCBs) 441.5 495.1 502.9 -27.9 -5.3 61.4 13.9
Credit to the Private Sector 5,322.3 5,712.3 6,249.5 975.9 20.6 927.2 17.4LCBs 3,905.9 4,204.4 4,609.1 754.9 21.9 703.2 18.0
LSBs 528.2 562.2 631.9 80.5 16.7 103.7 19.6LFCs 888.2 945.7 1,008.6 140.5 17.4 120.3 13.5
Other Items (net) (b) -1,685.3 -1,749.8 -1,933.3 -310.6 -21.6 -248.0 -14.7
(a) Provisional(b) Computed as the difference between other assets and other liabilities.
Rs. billion
Source: Central Bank of Sri Lanka
Table 7.4 Assets Side of Broad Money (M4)
(Computed as per the Financial Survey)
7
104
CENTRAL BANK OF SRI LANKA | RECENT ECONOMIC DEVELOPMENTS: HIGHLIGHTS OF 2017 AND PROSPECTS FOR 2018
year-on-year, by end August 2017, compared
to 17.1 per cent growth recorded at end 2016.
Time and savings deposits held at LSBs and
LFCs grew by 15.5 per cent and 25.6 per cent,
respectively, by end August 2017, supported by
high and competitive interest rates offered for
deposits during the period under review. From the
assets side, largely contributing to the expansion
in M4, NDA of licensed banks and LFCs increased
by Rs. 648.8 billion, while NFA also increased by
Rs. 178.0 billion during the period under review.
y The growth in credit to the private sector
in the financial survey also displayed a
moderation during the first eight months
of 2017. According to M4, growth in credit to
the private sector moderated to 17.4 per cent,
year-on-year, by end August 2017 compared to
20.6 per cent at the end of 2016. Following the
same trend, credit growth of LFCs moderated
to 13.5 per cent, year-on-year, by end August
2017 compared to 17.4 per cent at end 2016.
In contrast, credit growth of LSBs increased to
19.6 per cent, year-on-year, by end August 2017
compared to 16.7 per cent recorded at end 2016.
In absolute terms, the growth of credit amounted to
Rs. 537.2 billion during the first eight months of
2017 compared to the increase of Rs. 585.9 billion
in the corresponding period of 2016. Further, NCG
by all institutions covered in the financial survey
recorded an increase during the period under
review. Accordingly, overall NCG increased by
Rs. 287.3 billion during the first eight months of
2017 compared to an increase of Rs. 185.1 billion
during the same period of the previous year.
Expected Developments
y The monetary policy framework of the Central
Bank is being further strengthened with the
aim of adopting a FIT framework over the
medium term. The key aspects of this transition
include introducing necessary legal reforms,
building institutional and technical capacity,
strengthening central bank credibility and
autonomy, enhancing government-central bank
coordination, continuing the market based flexible
exchange rate regime, improving monetary policy
operations and enhancing public and stakeholder
awareness. In the near future, the Central Bank
intends to announce a Road Map, with the support
of the government, to facilitate a smooth transition
towards completing the remaining building blocks
necessary for adopting this new monetary policy
framework. In the recently published policy
document “Vision 2025: A Country Enriched”,
the government has also indicated its willingness
to further strengthen the legal framework of the
Central Bank to conduct its monetary policy more
efficiently under the FIT framework and to allow
greater flexibility in exchange rate determination.
y The unhindered progression of the ongoing
fiscal consolidation process is essential
for the smooth transition and successful
implementation of FIT. There is a strong need
for enhanced monetary-fiscal coordination at this
juncture with the government’s commitment to
the ongoing revenue-based fiscal consolidation
process to ensure the success of the FIT
framework in maintaining low and stable inflation
over the medium term. The improved fiscal space
will provide the Central Bank with enhanced
flexibility to conduct its monetary policy more
effectively and independently, that will pave
way for a more growth-conducive environment
supported by low levels of market interest rates
on a more predictable and consistent basis.
y With prudent monetary policy measures
and short term cost adjustments by the
government, the disturbances to price
levels observed at present are expected to
dissipate in the near term. The increase in
inflation observed during the most part of 2017
was mainly associated with tax revisions and
supply disruptions caused by inclement weather
conditions along with upward movements
in international commodity prices. However,
underlying inflation as indicated by core inflation

7
105
Monetary Policy, interest rates, Money and credit
has remained at tolerable levels in view of proactive monetary policy measures adopted by the Central Bank. While the Central Bank is committed to contain demand driven inflation through monetary policy measures and anchor inflation expectations towards targeted level of inflation, short and medium term actions are necessary to curb food inflation, which remains a serious concern. As a large proportion of the consumption basket comprises food items and
imported components, supply disruptions in the
domestic economy and the surge in international
commodity prices, including oil, threaten price
stability. Strengthening domestic supply networks
and strengthening safety nets to dampen the
impact of supply disturbances on the vulnerable
segments of the population are necessary to
increase the resilience of the economy to such
disturbances.

7
106
CENTRAL BANK OF SRI LANKA | RECENT ECONOMIC DEVELOPMENTS: HIGHLIGHTS OF 2017 AND PROSPECTS FOR 2018
Financial Sector PerFormance and SyStem Stability
8The financial sector continued to expand and remained stable during the first half of
2017. The expansion of the asset base of the banking sector, which comprised credit and investment portfolios, was largely funded through deposits. Liquidity and capital ratios
of the banking sector were maintained at levels that were well above the statutory requirements. The bank branch network expanded, contributing to improved financial inclusion in the country. The expansion of the licensed finance companies (LFCs) and specialised leasing companies (SLCs) sectors which slowed down with macroprudential policy measures implemented to curtail unhealthy developments in the market, showed signs of gradual rebounding with secured lending activities. Although the asset quality of LFC and SLC sectors deteriorated, it was at manageable levels in comparison to the expansion of the loan portfolio. Performance of primary dealers showed signs of some moderation. The insurance sector and superannuation funds recorded positive performance while the unit trust sector recorded a contraction. Amidst strengthened capital regulations, the stock broker sector recorded a mixed performance during the period under consideration. In the domestic money market, rupee liquidity remained mostly at deficit levels during the year, before turning to an excess from mid-July 2017. Accordingly, the interbank call money market rate, which remained close to the upper bound of the standing rate corridor, receded gradually since early August 2017. The yield rates of government securities across all maturities in the secondary market, which increased somewhat during the first four months of the year, declined substantially thereafter, particularly in view of improved domestic market conditions underpinned by foreign currency inflows to the government. The domestic foreign exchange market remained under pressure during the first seven months of the year on account of the tightening of global financial conditions and outflows resulting from import bills. However, with the receipt of the third tranche of the Extended Fund Facility (EFF) from the International Monetary Fund (IMF) along with notable conversions by exporters eased the pressure on the exchange rate. Reflecting these developments, the Sri Lankan rupee depreciated at a moderate level against the US dollar by 2.15 per cent during the first nine months of the year. Activities in the corporate debt securities market moderated, while the equity market performance remained subdued, reflecting volatile market behaviour and lower level of investor confidence. Nevertheless, share price indices and market capitalisation have recorded improvements, where foreigners remained net buyers in the equity market thus far during the year. Meanwhile, the national payment systems of the country operated smoothly without major disruptions or systemic risk concerns. Several initiatives were undertaken during the period to improve payment and settlement infrastructure to facilitate growing and changing payment needs of the financial sector.

8108
CENTRAL BANK OF SRI LANKA ǀ RECENT ECONOMIC DEVELOPMENTS: HIGHLIGHTS OF 2017 AND PROSPECTS FOR 2018
y Total loans and advances increased by 10.8 per cent during the first eight months of 2017 and stood at Rs. 6.1 trillion by end August 2017. Despite higher market interest rates, lending to all economic sectors increased during the first half of 2017 with large disbursements towards transport, trading, tourism and manufacturing sectors. Credit was mainly concentrated in the construction (17.7 per cent), trading (14.3 per cent), manufacturing (10.8 per cent) and other (16.5 per cent) sectors as at end June 2017. During the first eight months of 2017, overdrafts (18.4 per cent), term loans (10.3 per cent) and pawning (8.7 per cent) reported significant increases. However, the leasing portfolio recorded only a marginal increase of 3.1 per cent due to the introduction of the loan to value ratio, as a macroprudential measure, in January 2017.
Developments in Financial Institutions
Banking Sector
y The asset base of the banking sector expanded further during the first eight months of 2017 reflecting a growth in credit and investment portfolios of banks. The increase in the asset base was funded mainly through deposits. Profitability of the banking sector improved due to higher net interest income, significant revaluation gains and lower operating expenses. Liquidity was maintained at comfortable levels and the banks maintained sufficient levels of capital to absorb adverse shocks. The banking sector continued to establish its presence by expanding its branch and Automated Teller Machine (ATM) networks.
y Total assets of the banking sector stood at Rs. 9.9 trillion by end August 2017 recording an increase of 9.4 per cent during the first 8 months of 2017 compared to a growth of 6.8 per cent during the reference period of 2016. The asset base increased by Rs. 854.9 billion resulting from an increase in net loans and advances by Rs. 599.4 billion and investments by Rs. 296.2 billion. This expansion was largely financed through the increase in deposits. The investments in government securities and Sri Lanka Development Bonds (SLDBs) contributed to around 97 per cent of the investment portfolio.
Table 8.1
Banking Sector - Selected Indicators
Source: Central Bank of Sri Lanka
ItemEnd Aug
2015End Aug
2016End Dec
2016End Aug 2017 (a)
Y-O-Y Change (%)
Aug 2016 Aug 2017 (a)
Total Assets (Rs.billion) 7,491 8,624 9,047 9,901 15.1 14.8Loans & Advances (Rs.billion) 4,338 5,092 5,541 6,140 17.4 20.6Investments (Rs.billion) 2,345 2,428 2,291 2,588 3.6 6.6Deposits (Rs.billion) 5,067 5,855 6,296 7,063 15.6 20.6Borrowings (Rs.billion) 1,520 1,758 1,696 1,604 15.7 -8.8Capital Funds (Rs.billion) 613 683 707 823 11.4 20.5Tier 1 Capital Adequacy Ratio (%) (b) 13.5 12.2 12.5 12.2 Total Capital Adequacy Ratio (%) (b) 16.0 14.7 15.6 15.0 Gross Non-performing Loans Ratio (%) 4.2 3.0 2.6 2.8 Net Non-performing Loans Ratio (%) 2.2 1.1 0.7 0.9 Return on Assets (Before Tax) (%) 1.8 1.9 1.9 2.0 Return on Equity (After Tax) (%) 15.5 16.9 17.3 17.6 Statutory Liquid Assets Ratio (DBU) (%) 35.4 31.4 30.0 31.2 Liquid Assets to Total Assets (%) 30.6 29.2 27.3 29.0 (a) Provisional(b) As at end June
12,000 30
25
20
15
10
5
0
10,000
8,000
6,000
4,000
2,000
0
Chart 8.1
Assets of the Banking Sector
Feb
May
Aug
Nov Feb
May
Aug
Nov Feb
May
Aug
Nov Feb
May
Aug
Nov Feb
May
Aug
Nov Feb
May
Aug
Rs.
billi
on
Per c
ent
Cash and Due From Banks
Rupee Loans and Advances
Other Assets
Foreign Currency Loans and Advances
Investments
Source: Central Bank of Sri Lanka
Asset Growth (RHS)
2012 2013 2014 2015 2016 2017

8109
Financial Sector PerFormance and SyStem Stability
Foreign currency loans and advances increased by 13.4 per cent during the first eight months of 2017 while its share in total loans and advances increased to 19 per cent by end August 2017 from 18 per cent at end December 2016.
y There was a shift in the composition of investment portfolio during the first eight months of 2017. As at end August 2017, the held to maturity investment portfolio was 73.8 per cent of the total investment portfolio compared to 79.5 per cent as at end 2016. Share of trading portfolio increased to 25.9 per cent from 20.5 per cent as at end 2016. Year-to-date growth in the trading investment portfolio was 43.3 per cent.
y Deposits, which were the main source of funding, represented 71.3 per cent of the total assets of the banking sector, surpassing Rs. 7 trillion by end August 2017. The deposit base of the banking sector grew by Rs. 767.9 billion (12.2 per cent), of which 84 per cent consisted of rupee deposits. The increase in deposits was mainly from term deposits, which recorded an increase of 19.1 per cent. However, demand deposits decreased by 8.9 per cent, while savings deposits increased by 3.9 per cent during this period. The current and savings deposits to total deposits (CASA) ratio declined to 33.5 per cent at end August 2017 from 37.1 per cent at end 2016.
y Borrowings of the banking sector decreased by Rs. 92.2 billion (5.4 per cent) during the first eight months of 2017 due to a decline in rupee borrowings by Rs. 100.3 billion (15.1 per cent). In contrast, foreign currency borrowings increased by Rs. 8.1 billion (US dollars 52.9 million), increasing its share to 65 per cent by end August 2017 from 61 per cent at end 2016. Foreign currency borrowings from domestic sources increased by Rs. 14.5 billion or US dollars 95.2 million (18.4 per cent) while borrowings from foreign sources decreased by Rs. 6.5 billion or US dollars 42.2 million (0.7 per cent).
y Asset quality of the banking sector deteriorated marginally during the year by end August 2017. Total Non-Performing Loans (NPLs) increased by Rs. 26.8 billion to Rs. 169 billion. However, the NPL ratio increased marginally from 2.6 per cent at end 2016 to 2.8 per cent in August 2017 due to recovery measures adopted by banks and higher growth in the credit portfolio. Higher NPL ratios were reported in tourism (4.7 per cent), agriculture and fishing (4.1 per cent), manufacturing (3.8 per cent), traders (3.6 per cent), information and communication technology (3.2 percent) and construction (3.0 per cent) sectors as at end June 2017. Although specific provisions were 72.5 per cent of total provisions as at end August 2017, specific provision coverage ratio decreased to 48.0 per cent by end August 2017 from 52.1 per cent as at end December 2016.
257,000
6,000
5,000
4,000
3,000
2,000
1,000
0
20
15
10
5
0
Chart 8.2
Loans and Advances of the Banking Sector
Rs.
billi
on
2012
Feb
2017
Apr 2
017
Jun
2017
Aug
2017
2013
2014
2015
2016
Jan
2017
Mar
201
7
May
201
7
Jul 2
017
Source: Central Bank of Sri Lanka
Per c
ent
Y-O- Y Growth (RHS)Gross Loans and Advances
3012,000
10,000
8,000
6,000
4,000
2,000
0
25
20
15
10
5
0
Chart 8.3
Sources of Funding of the Banking Sector
Feb
May
Aug
Nov Feb
May
Aug
Nov Feb
May
Aug Nov
Feb
May
Aug
Nov Feb
May
Aug
Nov Feb
May
Aug
2012 2013 2014 2015 2016 2017
Rupee Deposits
Foreign Currency Borrowings
Foreign Currency Deposits
Other Liabilites
Liability Growth (RHS)
Equity Capital and Reserves
Rupee Borrowings
Rs.
billi
on
Per c
ent
Source: Central Bank of Sri Lanka

8110
CENTRAL BANK OF SRI LANKA ǀ RECENT ECONOMIC DEVELOPMENTS: HIGHLIGHTS OF 2017 AND PROSPECTS FOR 2018
y The banking sector maintained liquidity at a comfortable level during the first eight months of 2017. The Statutory Liquid Assets Ratios (SLAR) of Domestic Banking Units (DBUs) and Offshore Banking Units (OBUs) were well above the minimum statutory requirement of 20.0 per cent, recording 31.2 per cent and 35.4 per cent, respectively. The ratio of liquid assets to total assets stood at 29.0 per cent. Loans to deposits ratio decreased from 88.0 per cent as at end 2016 to 86.9 per cent at end August 2017 due to relatively higher increase in deposit mobilisation. Rupee and all currency liquidity coverage ratios, which were introduced under Basel III liquidity standards, stood at 205.3 per cent and 176.2 per cent, respectively, remaining well above the regulatory minimum of 80 per cent.
y The foreign currency exposure of DBUs in the banking sector increased during the first six months of 2017 due to increase in the rupee value of foreign currency borrowings. Net foreign currency exposure of DBUs as a percentage of banks’ regulatory capital and on-balance sheet foreign currency assets stood at 1.9 per cent and 1.5 per cent, respectively. The banking sector reported a long foreign currency position of Rs. 15.6 billion at end June 2017 compared to a long position of Rs. 16.4 billion at end 2016.
y Capital gains on treasury bonds for the first eight months of 2017 increased to Rs. 3.4 billion compared to Rs. 2.3 billion reported during the corresponding period of 2016 due to the downward trend that prevailed in yield rates of government securities. Equity risk of the banking sector was minimal as exposure to the equity market of Rs. 42.1 billion was only 0.4 per cent and 3.1 per cent, respectively, of total assets and investments held for trading of the banking sector.
y The banking sector reported a profit (after tax) of Rs. 86.6 billion during the first eight months of 2017, which is an increase of 18.2 per cent when compared with the corresponding period of 2016. The increased profitability was due to higher net interest income, which increased by Rs. 24.9 billion. Non-interest income also increased by Rs. 18.3 billion during this period as a result of significant capital gains and an increase in other sources of income. Operating expenses increased by Rs. 5.1 billion while losses on trading and investment securities declined during this period. Staff costs increased by Rs. 3.3 billion reporting an increase of 5.7 per cent over the corresponding period of last year.
y Profitability ratios as measured by the Return on Assets (ROA) before tax and Return on Equity (ROE) improved to 2.0 per cent and 17.6 per cent, respectively, during the first eight months of 2017 compared to 1.9 per cent and 16.9 per cent, respectively, in the corresponding period of 2016. The efficiency
Rs.
billi
on
Per c
ent6
7
8
5
4
3
2
1
00
50
100
150
200
250
Chart 8.4
Non-performing Loans of the Banking Sector
Source: Central Bank of Sri Lanka
Feb
May
Aug
Nov Feb
May
Aug
Nov Feb
May
Aug
Nov Feb
May
Aug
Nov Feb
May
Aug
Nov Fe
bM
ayAu
g
2012 2013 2014 2015 2016 2017
Gross NPLs Gross NPL Ratio (RHS) Net NPL Ratio (RHS)
Rs.
billi
on
Per c
ent
Per c
ent2,500
3,000
3,500
2,000
1,500
1,000
500
0
25
30
35
40
45
20
15
10
5
0
Chart 8.5
Liquidity Position of the Banking Sector
Source: Central Bank of Sri Lanka
Feb
May
Aug
Nov Feb
May
Aug
Nov Feb
May
Aug
Nov Feb
May
Aug
Nov Feb
May
Aug
Nov Feb
May
Aug
2012 2013 2014 2015 2016 2017
Liquid Assets - DBU Total Liquid Assets - DBU and OBUSLAR Ratio DBU (RHS) Liquid Assets to Total Assets (RHS)
Rs.
billi
on
Per c
ent

8111
Financial Sector PerFormance and SyStem Stability
ratio, which stood at 46.2 per cent has improved by 300 basis points when compared with end 2016. Net interest margin has remained unchanged year-on-year and stood at 3.5 per cent by end August 2017.
y The banking sector maintained sufficient capital levels in order to absorb any adverse shocks. The Core Capital Adequacy Ratio (CAR) and total CAR as at end June 2017 were 12.2 per cent and 15 per cent, respectively, and were maintained at healthy levels, well above the regulatory minimum of 5 per cent and 10 per cent, respectively.
y The branch network expanded further during the first half of 2017 improving financial accessibility. Accordingly, there were 3,543
bank branches, 3,045 student savings units and 4,148 ATMs installed by end June 2017. During this period, 19 new branches were opened and one branch was closed. Meanwhile, 335 ATMs were opened during this period.
y With a view to enhancing the presence of foreign banks in Sri Lanka, a Letter of Provisional Approval was issued to the Bank of China in July 2017 to establish a branch in Sri Lanka.
Non-Bank Financial Institutions (NBFIs) Sector
y The performance of Licensed Finance Companies (LFCs) and Specialised Leasing Companies (SLCs) showed signs of slowing down during the first eight months of 2017. The fiscal and macroprudential policy measures taken to curtail the imports and lending for motor vehicle purchases and the increasing trend of lending rates that prevailed in the second quarter negatively affected the demand for core lending products of the sector. However, it is observed that LFCs and SLCs are gradually moving from core business of vehicle financing to other secured lending activities. LFC and SLC sectors represent 7.8 per cent of assets of the financial system of Sri Lanka and consist of 45 LFCs and 6 SLCs with a network of 1,344 branches.
y Expansion of NBFI Sector has slowed down noticeably. Total assets of the sector expanded by 7.8 per cent (Rs. 94.9 billion) to Rs. 1,306.8 billion in the first eight months of 2017 compared to a growth of 14.4 per cent (Rs. 143.5 billion) in the corresponding period of 2016. The slow growth in credit hindered the expansion of the asset base of the LFCs and SLCs sector.
y The sector expansion was largely funded through deposits. During the past two years, the sector growth was propelled by the funds raised through borrowings. Nevertheless, sector borrowings declined by 5.8 per cent
Rs.
billi
on
Per c
ent
2.5
3. 0
20
15
10
5
0
25
2.0
1.5
1.0
0.5
0.0
Chart 8.6
ROA and ROE of the Banking Sector
Source: Central Bank of Sri Lanka
Feb
May
Aug
Nov Feb
May
Aug
Nov Feb
May
Aug
Nov Feb
May
Aug
Nov Feb
May
Aug
2013 2014 2015 2016 2017
Return on Equity (ROE) (After Tax)
Return On Assets (ROA) (Before Tax - RHS)
Rs.
billi
on
Per c
ent
Rs.
billi
on
Per c
ent
0
2
4
6
8
10
12
14
16
18
20
0
100
200
300
400
500
600
700
800
900
Chart 8.7
Capital Adequacy of the Banking Sector
Source: Central Bank of Sri Lanka
Q1
Q2
Q3
Q4
Q1
Q2
20132012 2014 2015 2016 2017
Capital Base
Tier 1 Capital/ Risk Weighted Assets (RHS)
Capital Base/Risk Weighted Assets (RHS)
Rs.
billi
on
Per c
ent
Q1
Q2
Q3
Q4
Q1
Q2
Q3
Q4
Q1
Q2
Q3
Q4
Q1
Q2
Q3
Q4

8112
CENTRAL BANK OF SRI LANKA ǀ RECENT ECONOMIC DEVELOPMENTS: HIGHLIGHTS OF 2017 AND PROSPECTS FOR 2018
(Rs. 25.5 billion) to Rs. 413.2 billion in the first eight months of 2017 compared to the growth of 29.9 per cent in the corresponding period of 2016. In contrast, the deposits grew by 19.8 per cent (Rs. 104.9 billion) to Rs. 635.6 billion in the first eight months of 2017 compared to the growth of 5.3 per cent (Rs. 25.6 billion) in the corresponding period of 2016.
y Credit growth responded to the macroprudential policy measures introduced by the CBSL. Lending activities of the sector showed signs of slowing down in response to macroprudential policies implemented on vehicle loans as well as the increasing trend observed in lending rates, which affected the demand side. Credit extended by LFCs and SLCs grew by 6 per
cent (Rs. 57.5 billion) to Rs. 1,020.2 billion in the first eight months of 2017 compared to the growth of 13.0 per cent in the corresponding period of 2016.
y Asset quality showed signs of stress, but remained manageable. Non-Performing Accommodations (NPAs) increased by 11.5 per cent to Rs. 59.0 billion during 2017. However, the NPA ratio remained at 5.5 per cent by end August 2017, which is a marginal increase from 5.3 per cent recorded at end 2016. When the loan loss provision is considered, the net NPA ratio increased marginally to 1.3 per cent by end August 2017 from 1.2 per cent at end 2016.
y The overall liquidity position of NBFIs recorded a surplus. The sector reported total liquid assets of Rs.115.6 billion with a surplus
Rs.
billi
on
Per c
ent
0
5
10
15
20
25
30
35
40
45
50
0
100
200
300
400
500
600
700
800
900
1000
1100
Chart 8.9
Total Loans and Advances of NBFIs
Feb
May
201420132012 2015 2016 2017
Total Loans
Rs.
billi
on
Feb
May Fe
b
May
Feb
May Feb
May
Feb
MayAu
g
Aug
Aug
Aug
Aug
Aug
Nov
Nov Nov
Nov
Nov
Y - o -Y growth (RHS)
Per c
ent
Source: Central Bank of Sri Lanka
Rs.
billi
on
60
50
40
30
20
10
0
Chart 8.8
Total Deposits and Borrowings of NBFIs
Feb
May
201420132012 2015 2016 2017
Deposits as a percentage of Total Liabilities
Per c
ent
Feb
May Feb
May Feb
May
Feb
May Fe
bM
ay
Borrowings as a Percentage of Total Liabilities
Aug
Aug
Aug
Aug
Aug
Aug
Nov
Nov Nov Nov
Nov
Source: Central Bank of Sri Lanka
(a) NBFIs sector represents licensed finance companies and specialised leasing companies Source: Central Bank of Sri Lanka
ItemEnd Aug
2015End Aug
2016End Dec
2016End Aug 2017 (b)
Y-O-Y Change (%)
Aug 2016 Aug 2017 (a)
Total Assets - Net (Rs.billion) 924.8 1,139.7 1,211.9 1,306.8 23.2 14.7 Loans & Advances - Net (Rs.billion) 715.2 899.5 962.7 1,020.2 25.8 13.4 Deposits (Rs.billion) 454.5 506.2 530.7 635.6 11.4 25.6 Borrowings (Rs.billion) 272.8 408.3 438.7 413.2 49.7 1.2 Capital Funds (Rs.billion) 127.0 142.4 144.1 167.4 12.2 17.6 Tier 1 Capital Adequacy Ratio (%) 13.0 12.0 11.3 12.5 Total Capital Adequacy Ratio (%) 13.6 12.6 11.7 13.3 Gross Non-performing Accommodations Ratio (%) 6.3 5.5 5.3 5.5 Net Non-performing Accommodations Ratio (%) 1.8 1.3 1.2 1.3 Return on Assets (Before Tax) (%) - Annualised 4.2 3.7 3.6 3.0 Return on Equity (After Tax) (%) - Annualised 20.8 20.0 19.8 14.9 Liquid Assets to Total Assets (%) 8.2 7.0 7.1 8.5
Table 8.2
NBFIs (a) - Selected Indicators
(b) Provisional
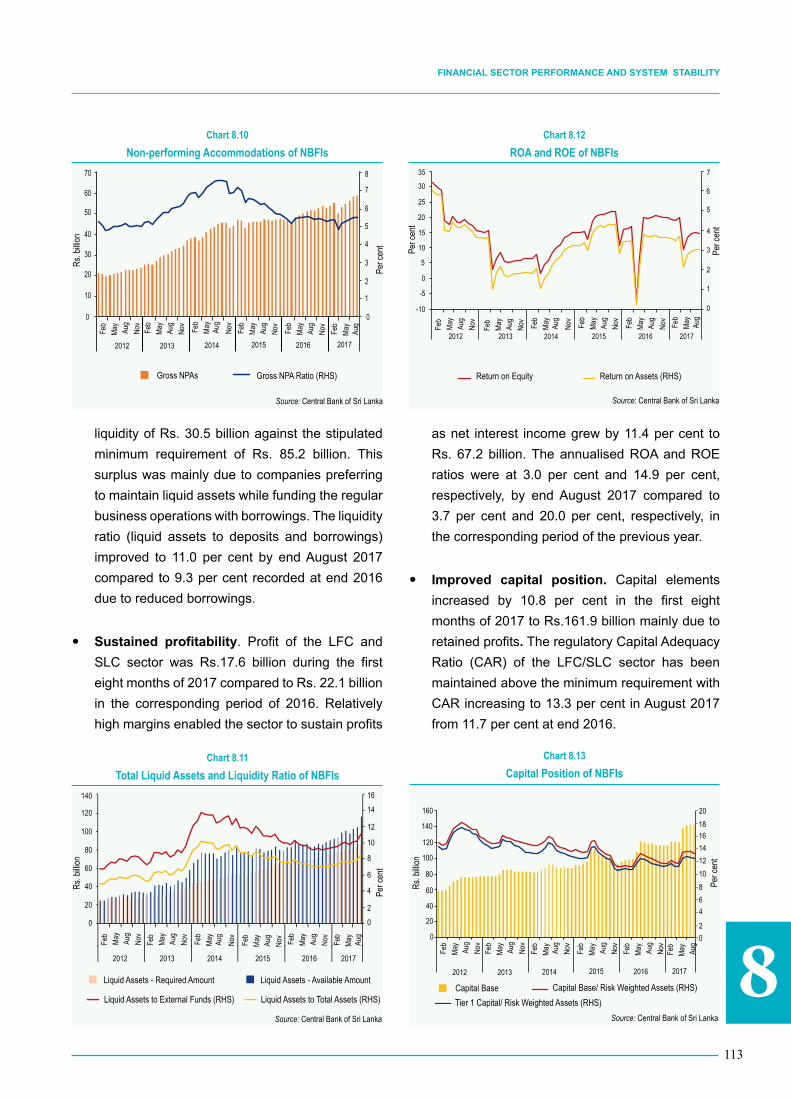
8113
Financial Sector PerFormance and SyStem Stability
liquidity of Rs. 30.5 billion against the stipulated minimum requirement of Rs. 85.2 billion. This surplus was mainly due to companies preferring to maintain liquid assets while funding the regular business operations with borrowings. The liquidity ratio (liquid assets to deposits and borrowings) improved to 11.0 per cent by end August 2017 compared to 9.3 per cent recorded at end 2016 due to reduced borrowings.
y Sustained profitability. Profit of the LFC and SLC sector was Rs.17.6 billion during the first eight months of 2017 compared to Rs. 22.1 billion in the corresponding period of 2016. Relatively high margins enabled the sector to sustain profits
as net interest income grew by 11.4 per cent to Rs. 67.2 billion. The annualised ROA and ROE ratios were at 3.0 per cent and 14.9 per cent, respectively, by end August 2017 compared to 3.7 per cent and 20.0 per cent, respectively, in the corresponding period of the previous year.
y Improved capital position. Capital elements increased by 10.8 per cent in the first eight months of 2017 to Rs.161.9 billion mainly due to retained profits. The regulatory Capital Adequacy Ratio (CAR) of the LFC/SLC sector has been maintained above the minimum requirement with CAR increasing to 13.3 per cent in August 2017 from 11.7 per cent at end 2016.
Rs.
billi
on
Per c
ent
0
10
20
30
40
50
60
70
0
1
2
3
4
5
6
7
8
Chart 8.10
Non-performing Accommodations of NBFIs
Feb
May
201420132012 2015 2016 2017
Gross NPAs
Rs.
billi
on
Feb
May Fe
b
May
Feb
May Feb
May
Feb
MayAu
g
Aug
Aug
Aug
Aug
Aug
Nov
Nov Nov
Nov
Nov
Gross NPA Ratio (RHS)Pe
r cen
t
Source: Central Bank of Sri LankaR
s. b
illion
Per c
ent
20
1618
141210
468
200
20
40
60
80
100
120
140
160
Chart 8.13
Capital Position of NBFIs
Capital Base
Feb
May Feb
May
Feb
May Feb
May Feb
May
Feb
MayAu
g
Aug
Aug
Aug
Aug
Aug
Nov
Nov
Nov
Nov
Nov
201420132012 2015 2016 2017
Capital Base/ Risk Weighted Assets (RHS)
Tier 1 Capital/ Risk Weighted Assets (RHS)
Rs.
billi
on
Per c
ent
Source: Central Bank of Sri Lanka
Rs.
billi
on
Per c
ent
2012
140
120
100
80
60
40
20
0
16
14
12
10
8
6
4
2
0
2013 2014 2015 2016 2017
Chart 8.11
Total Liquid Assets and Liquidity Ratio of NBFIs
Feb
May
Liquid Assets - Required Amount Liquid Assets - Available Amount
Liquid Assets to External Funds (RHS) Liquid Assets to Total Assets (RHS)
Rs.
billi
on
Feb
May
Feb
May
Feb
May Fe
b
May
Feb
MayAu
g
Aug
Aug
Aug
Aug
Aug
Nov
Nov
Nov
Nov Nov
Per c
ent
Source: Central Bank of Sri Lanka
Rs.
billi
on
Per c
ent
7
6
5
4
3
2
1
0
30
35
25
20
15
10
5
-5
2012 2013 2014 2015 2016 2017
-10
0
Chart 8.12
ROA and ROE of NBFIs
Feb
May
Return on Equity Return on Assets (RHS)
Per c
ent
Feb
May Fe
b
May Fe
b
May Feb
May Fe
b
May
Aug
Aug
Aug
Aug
Aug
Aug
Nov
Nov Nov Nov
Nov
Per c
ent
Source: Central Bank of Sri Lanka

8114
CENTRAL BANK OF SRI LANKA ǀ RECENT ECONOMIC DEVELOPMENTS: HIGHLIGHTS OF 2017 AND PROSPECTS FOR 2018
Microfinance Institutions
y During 2017, the Department of Supervision of Microfinance Institutions (DSMI) of the Central Bank continued exercising its duties as stipulated by the Microfinance Act No.6 of 2016. DSMI issued two directions approved by the Monetary Board, namely, Opening, Closure and Relocation of Business Places and the Structural Changes, regulating Licensed Microfinance Companies (LMFCs). Further, DSMI issued Principles, Standards and Guidelines, approved by the Monetary Board under Section 28(1) of the Microfinance Act, to the Registrar of Voluntary Social Service Organisations, for rules to be made to give effect to the same. DSMI received several applications for licence under the Microfinance Act and is in the process of evaluating those applications.
Insurance Sector
y The insurance sector continued to grow in terms of total assets and premium income.
Total assets of the sector improved by 11.4 per cent, on a year-on-year basis, by end June 2017, compared to a growth of 9.9 per cent reported at end June 2016. Gross Written Premiums (GWP) grew by 13.9 per cent in the first half of 2017 compared to a growth of 17.2 per cent in the corresponding period of 2016. The general insurance premium grew by 16.2 per cent, largely underpinned the growth in GWP during the first half of 2017. Meanwhile, growth in premium income of long-term insurance decelerated to 11.1 per cent by end June 2017 compared to the growth of 21.3 per cent at end June 2016. Motor insurance, the largest contributor to the general insurance business, representing a share of 63.3 per cent, recorded a growth in premium income of 15.8 per cent in the first half of 2017, compared to the increase of 14.5 per cent in the corresponding period of 2016. Further, premium income from fire insurance (share of 9.4 per cent) and marine insurance (share of 2.6 per cent) also recorded growth rates of 11.0 per cent and 7.3 per cent, respectively, compared to the negative growth of 18.3 per cent and 0.1 per cent, respectively, in the first half of 2016.
Source: Central Bank of Sri Lanka
(a) Provisional(b) During the period(c) Introduced in lieu of the solvency margin ratio since 2016
Source: Insurance Board of Sri Lanka
ItemEnd Jun
2015End Jun
2016End Dec
2016End Jun 2017 (a)
Y-O-Y Change (%)
Jun 2016 Jun 2017 (a)
Total Assets (Rs.billion) 435.4 478.4 503.1 533.1 9.9 11.4 Total Income (Rs.billion) (b) 71.2 82.2 181.0 96.6 15.5 17.6
Gross Premium Income (Rs.billion) (b) 57.1 66.9 140.3 76.2 17.2 13.9 Investment Income (Rs.billion) (b) 14.1 15.3 40.7 20.5 8.7 33.9
Profit Before Tax (Rs.billion) (b) 3.9 5.2 21.6 4.7 32.7 -10.0Solvency Margin Ratio (Times)
Long-term Insurance 9.3 n.a. n.a. n.a.General Insurance 2.2 n.a. n.a. n.a.
Capital Adequacy Ratio (CAR) (%) (c)Long-term Insurance n.a. 296 317 358General Insurance n.a. 166 192 117
Retention Ratio (%) Long-term Insurance 96.1 96.2 96.6 95.9General Insurance 161.2 159.1 80.1 78.5
Claims Ratio (%) Long-term Insurance 40.3 37.1 37.5 36.9General Insurance 63.0 55.7 65.9 63.9
Combined Operating Ratio (%)Long-term Insurance 87.0 85.1 84.2 86.2General Insurance 107.6 97.2 105.2 102.9
Return on Assets (ROA) (%) Long-term Insurance 2.0 2.2 2.9 1.8
General Insurance 1.8 2.4 7.3 8.9
Return on Equity (ROE) (%) - General Insurance 2.9 4.5 14.5 18.8Underwriting Ratio (%) - General Insurance 14.6 15.7 17.8 17.1
Table 8.3
Insurance Sector - Selected Indicators

8115
Financial Sector PerFormance and SyStem Stability
y Insurance sector recorded a decline in overall profits. The aggregate profit before tax dropped by 11.4 per cent in the first half of 2017 compared to a growth of 34.9 per cent in the corresponding period of 2016, largely due to weak performance in long-term insurance business, whose profits declined by 78.5 per cent in first half of 2017 compared to a growth of 34.1 per cent during the reference period of 2016. The claims of general insurance and long-term insurance sectors increased by 11.9 per cent and 8.3 per cent, respectively, during the period under consideration. Investment income of insurance companies increased by 33.9 per cent in the first half of 2017 compared to the 8.7 per cent growth in 2016. The investments in government securities by the long-term and general insurance sectors accounted for 51.3 per cent and 30.3 per cent, respectively, of their total investment portfolio.
Primary Dealers
y The Primary Dealer (PD) sector expanded during the first eight months of 2017. Total assets increased by 34.2 per cent to Rs. 418.3 billion and the total portfolio of government securities increased by 53.8 per cent to Rs. 393.8 billion, largely underpinned by the increase in investment portfolio. Meanwhile, borrowings under repo agreements decreased by 12.3 per cent to Rs. 149.9 billion.
y Profitability decreased. The sector recorded a profit of Rs. 10.3 billion over the period ending August 2017 compared to a profit of Rs. 11.1 billion in the corresponding period of 2016. Total capital gains (realised and unrealised) marked Rs. 3.0 billion compared to Rs. 6.9 billion in 2016. Profitability measured in terms of return on assets and return on equity of standalone PDs stood at 4.6 per cent and 14.1 per cent, respectively, as at end August 2017.
Source: Central Bank of Sri Lanka
ItemEnd Aug
2015End Aug
2016End Dec
2016End Aug2017 (a)
Y-O-Y Change (%)
Aug 2016 Aug 2017 (a)
Total Assets (Rs.billion) 235.8 311.8 260.0 418.3 32.2 34.2 Standalone PDs 54.0 87.5 77.1 67.6 62.0 -22.7
Bank PDs 181.9 224.4 183.0 350.7 23.4 56.3
Total Portfolio (Rs.billion) 217.1 256.0 222.7 393.8 17.9 53.8 Standalone PDs 42.8 41.3 46.9 50.6 -3.5 22.4
Bank PDs 174.3 214.6 175.9 343.2 23.2 59.9
Total Capital (Rs.billion) (b) 9.3 19.5 21.5 23.2 108.6 19.3
Profit before Tax (Rs.billion) (c) 3.8 11.1 15.2 10.3 193.7 -7.3
Standalone PDs 1.5 7.4 8.7 2.4 392.9 -68.3
Bank PDs 2.3 3.7 6.5 8.0 62.3 114.8
Tier 1 Capital Adequacy Ratio (%) (b) 18.0 33.7 59.9 57.4 15.7 23.7
Total Capital Adequacy Ratio (%) (b) 19.1 35.0 61.5 58.8 15.9 23.8
Return on Assets (%) 2.8 5.8 5.8 4.6 3.0 -1.2
Standalone PDs 4.1 15.0 12.6 4.9 10.9 -10.1
Bank PDs 2.3 2.6 3.3 4.5 0.3 1.9
Return on Equity (%) (b) 25.1 70.8 52.1 14.1 45.6 -56.7
Leverage Times (b) 5.0 3.5 2.6 1.9 -29.0 -46.0
Operating Expenses to Total Income (%) (c) 6.2 3.1 3.5 3.0 -3.1 -0.1
Standalone PDs 14.0 5.6 7.1 12.1 -8.4 6.5
Bank PDs 1.8 0.8 0.8 0.5 -1.0 -0.3
Total Cost to Total Income (%) (c) 66.3 52.7 57.9 66.2 -13.6 13.4
Standalone PDs 63.2 34.0 43.9 64.0 -29.2 30.0
Bank PDs 68.1 69.8 68.4 66.7 1.7 -3.1
Duration of Assets and Liabilities (years) 1.2 1.3 1.2 1.0 7.9 -25.9
Standalone PDs 2.6 3.0 2.1 2.4 16.6 -21.7
Bank PDs 0.6 0.6 0.6 0.4 -6.1 -33.2
Table 8.4
Primary Dealers - Selected Indicators
(a) Provisional(b) Standalone PDs only(c) During the period
Note: Above data excludes financials of Entrust Securities PLC.

8116
CENTRAL BANK OF SRI LANKA ǀ RECENT ECONOMIC DEVELOPMENTS: HIGHLIGHTS OF 2017 AND PROSPECTS FOR 2018
y Capital was maintained at healthy levels. All standalone PDs except one maintained their core capital above the minimum requirement of Rs. 1 billion by end August 2017. The risk weighted capital adequacy ratio of the sector was above the minimum of 10 per cent and the ratio increased to 58.8 per cent by end August 2017 from 35.0 per cent at end August 2016.
y Risk profile improved. The share of trading portfolio in total investment portfolio decreased from 52.1 per cent at end August 2016 to 34.5 per cent at end August 2017. As a result, the exposure of the sector to market risk decreased. In view of the large holding of risk-free government securities and its ability to be used as collateral for obtaining funds to bridge unforeseen liquidity gaps, the liquidity risk profile of PDs remained low. Further, most PDs had stand-by contingency funding arrangements to bridge liquidity gaps, if emerged.
Unit Trust Sector
y The Unit Trust (UT) sector recorded a contraction in terms of number of units in issue and net asset value. Despite the dismal performance of the sector, the total number of unit holders marginally increased by 2.3 per cent on year-on-year basis while total number of UTs managed by 14 unit trust management companies remained constant. The Net Asset Value (NAV) of the UT sector marked a decrease of 18.5 per cent, on a year-on-year basis, to Rs.103.3 billion by
end June 2017. Meanwhile, the share of equities in investment portfolios of UTs increased to 13.9 per cent as at end June 2017 from 9.9 per cent as at end June 2016.
Stock Broking Companies Sector
y Stock broking companies sector showed a positive performance with further strengthening of capital regulations. The income of stock brokers showed a moderate decline during the first half of 2017 recording Rs. 406 million compared to Rs. 447 million in the first half of 2016. However, net profit before taxes improved during this period to Rs. 35 million from the recorded loss of Rs. 121 million at end June 2016. In addition, net capital of the stock broking companies sector increased by 22.6 per cent to Rs. 5.6 billion during the period under consideration from Rs. 4.5 billion in the previous year, while total assets increased marginally.
y Capital requirements of the stock brokers were upgraded to risk based capital adequacy ratio and minimum liquid capital in March 2017 from the previous requirement of minimum net capital. All stock broking companies have met the net capital requirement in the first two months of 2017. Two companies failed to comply with the new requirement of risk, based capital adequacy ratio and minimum liquid capital introduced in March 2017. However, only one company failed
(a) Provisional Source: Unit Trust Association of Sri Lanka
ItemEnd Jun
2015End Jun 2016
End Dec 2016
End Jun 2017 (a)
Y-O-Y Change (%)
Jun 2016 Jun 2017 (a)
Total Assets (Rs.billion) 133.8 127.7 103.1 104.4 -4.6 -18.3Net Asset Value - NAV (Rs.billion) 133.1 126.8 103.1 103.3 -4.7 -18.5Investments (Rs.billion) 133.6 122.8 102.9 102.3 -8.1 -16.7 Equity 13.5 12.6 13.9 14.4 -6.6 13.9 Government Securities 55.4 55.9 49.6 42.8 0.8 -23.4 Other (E.g.,Commercial Papers, Debentures, Trust Certificates & Bank Deposits) 64.7 54.4 39.3 45.2 -16.0 -16.8Investments in Equity as a % of NAV 10.1 9.9 13.5 13.9Investments in Government Securities as a % of NAV 41.6 43.7 48.1 41.0Other Investments as a % of NAV 48.6 42.9 38.1 43.8Total No. of Unit Holders 35,660 39,707 41,249 40,651No. of Units in Issue (billion) 9.6 8.9 7.2 6.7No. of Unit Trusts 70 76 77 76
Table 8.5
Unit Trust Sector - Selected Indicators

8117
Financial Sector PerFormance and SyStem Stability
to comply with the new regulatory requirement as at 30 June 2017.
Superannuation Funds
y The Employees’ Provident Fund (EPF) is the largest superannuation fund in Sri Lanka with an asset base of over Rs. 1.9 trillion as at end June 2017. The total number of member accounts of the EPF reached 17.5 million mark in December 2016, recording an increase of 3.6 per cent when compared with the previous year. Total member contributions during the first six months of 2017 increased by 16.0 per cent to Rs. 65.3 billion while refund payments increased by 14.9 per cent to Rs. 63.1 billion when compared with the corresponding period of the previous year. During the period under review, the net contribution (contributions minus refunds) stood at Rs. 2.2 billion, which is an increase of 57.1 per cent compared to the corresponding period of 2016. During the 12 month period ending 30 June 2017, total assets of the EPF increased by 11.9 per cent to Rs. 1,948 billion whereas the total investment of
EPF also grew by 11.9 per cent to Rs. 1,873 billion. The investments of EPF consist of government securities (91.6 per cent), equity (4.5 per cent), corporate debt, trust certificates and reverse repo (2.1 per cent) and fixed deposits (1.8 per cent). The Fund reported a gross investment income of Rs. 107.0 billion during the first half of 2017, which is an increase of 11.5 per cent compared to the corresponding period of 2016.
y The Employees’ Trust Fund (ETF) has about 12.5 million accounts, of which about 2.6 million are active accounts. Total contributions received and benefits paid to members during the first six months of 2017 increased to Rs. 11.1 billion (13.7 per cent) and Rs. 9.4 billion (27.9 per cent), respectively, from Rs. 9.8 billion and Rs. 7.3 billion, respectively, during the corresponding period of 2016. With the high growth in the disbursement of benefits, net contributions of the ETF decreased by 35.3 per cent in the first half of 2017. Meanwhile, total assets of the ETF increased by 12.1 per cent to Rs. 263.2 billion by end June 2017. The investment portfolio of
(a) Provisional(b) During the period
Source: Securities and Exchange Commission of Sri Lanka
ItemEnd Jun
2015End Jun
2016End Dec
2016End Jun 2017
(a)
Y-O-Y Change (%)
Jun 2016 Jun 2017 (a)
Total Assets (Rs. billion) 10.9 9.5 10.1 12.8 -12.2 34.4
Total Liabilities (Rs. billion) 4.8 3.9 4.5 7.3 -18.7 87.5
Net Capital (Rs. billion) 4.7 4.5 4.6 5.6 -2.8 22.6
Income (Rs. billion) (b) 0.6 0.4 0.3 0.4 -26.7 10.1
Net profit/(Loss) before tax (Rs. million) (b) 19.2 -121.0 -460.0 35.0 -729.4 128.9
Table 8.6
Stock Broking Companies - Selected Indicators
(a) Provisional(b) During the period
Sources: Central Bank of Sri Lanka Employees' Trust Fund Board
Item
Employees' Provident Fund (EPF) Employees' Trust Fund (ETF)
End Jun 2016 End Jun 2017 (a) Change (%) (a) End Jun 2016 End Jun 2017 (a) Change (%) (a)
Total Contributions (Rs. billion) (b) 56.3 65.3 16.0 9.8 11.1 13.7
Total Refunds (Rs. billion) (b) 54.9 63.1 14.9 7.3 9.4 27.9
Total Assets (Rs. billion) 1,741 1,948 11.9 234.7 263.2 12.1
Total Investment Portfolio (Rs. billion) 1,674 1,873 11.9 221.0 247.6 12.1
o/w, Government Securities (%) 93.2 91.6 -1.7 91.7 84.1 -8.3
Gross Income (Rs. billion) (b) 96.0 107.2 11.7 11.5 13.6 18.8
Table 8.7
Superannuation Funds - Selected Indicators

8118
CENTRAL BANK OF SRI LANKA ǀ RECENT ECONOMIC DEVELOPMENTS: HIGHLIGHTS OF 2017 AND PROSPECTS FOR 2018
the ETF remained concentrated in government securities. However, the share of government securities declined to 84.1 per cent as at end June 2017 from 91.7 per cent as at end June 2016. Investments in equity stood at 4.9 per cent by end June 2017.
y The Public Service Provident Fund (PSPF) had 229,951 members as at end June 2017. Total assets of the PSPF amounted to Rs. 49.9 billion as at end June 2017 compared to Rs. 47.7 billion as at end June 2016. Total contributions and refunds of the PSPF during the first six months of 2017 amounted to Rs. 897.0 million and Rs. 256.8 million, respectively.
y There were 151 privately managed approved provident funds (APFs) with around 169,281 members as at end June 2017. The total assets of APFs stood at Rs. 434.3 billion while total investments stood at Rs. 264.5 billion at the end June 2017.
Developments in Financial Markets
Inter-Bank Call Money Market
y The Average Weighted Call Money Rate (AWCMR), which moved closer to the upper bound of the Standing Rate Corridor (SRC), formed by the Standing Lending Facility Rate (SLFR) and the Standing Deposit Facility Rate (SDFR) till early August, moved downwards thereafter and has hovered at levels around the middle of the SRC since early September. The AWCMR, which was at 8.42 per cent by end 2016, increased towards the upper bound of the SRC with the decline in excess money market liquidity, which reached deficit levels by around mid-February. Central Bank tightened its monetary policy stance in March 2017 by increasing the SDFR and the SLFR by 25 basis points each to 7.25 per cent and 8.75 per cent, respectively. Consequently, the AWCMR increased further and continued to hover at rates close to the upper bound of the SRC up until early August 2017. While the money market has
continued to have surplus levels of liquidity since around mid-July 2017, the weighted average yield rate at the daily overnight repo auctions conducted by the Central Bank has declined since around mid-August, recording 7.25 per cent by end September 2017. Following this trend, the AWCMR also declined to around 8.00 per cent by mid-September 2017 and increased marginally to 8.11 per cent by end September 2017. With market repo rates following the movements of call money rates, the Average Weighted Repo Rate (AWRR) recorded at end September 2017 was 8.01 per cent, having declined in recently along with the decline in call money market rates.
y Excess rupee liquidity in the domestic money market increased sharply at the beginning of 2017. Whilst declining to deficit levels by early February, market liquidity fluctuated thereafter till mid-July, moving between deficit and surplus levels. Since mid-July, the domestic money market has continued to have excess rupee liquidity. The sharp increase in money market liquidity from a surplus of Rs. 39.2 billion at end 2016 to over Rs. 100 billion at the beginning of the year 2017 was mainly due to the provisional advances extended to the Government by the Central Bank. However, money market liquidity declined thereafter with the market experiencing deficits in liquidity from time to time from around mid-February until
9.0
8.5
8.0
7.5
7.0
6.5
6.0
180
140
100
60
20
-20
-60
Chart 8.14
Standing Rate Corridor, OMO Auction Yield Rates, AWCMR and Absorption of the Market Liquidity
Jan-
2017
Feb-
2017
Mar
-201
7
Apr-2
017
May
-201
7
Jun-
2017
Jul-2
017
Aug-
2017
Sep-
2017
Oct
-201
7
Rs.
billi
on
Per c
ent
Overnight Auctions
Short Term Auctions
Standing Facilities
Long Term Auctions Rev Repo OMO Auction W.A Yield RateRepo OMO Auction W.A Yield Rate
SDFR
AWRR
AWCMR
SLFR
Source: Central Bank of Sri Lanka

8119
Financial Sector PerFormance and SyStem Stability
mid-July, primarily as a result of the Central Bank allowing its Treasury bill holdings to mature as well as outright sales of Treasury bills by way of conducting OMO. Seasonal withdrawals of currency was an additional factor that drove down money market liquidity during the month of April. Foreign exchange related transactions of the Central Bank including foreign exchange purchases and foreign exchange swaps have had a positive impact, on money market liquidity on a net basis during the first nine months of 2017. Conversion of a part of the proceeds from the International Sovereign Bond (ISB) to rupees by the government to settle its dues was another factor that led to an increase in market liquidity to surplus levels since around mid-July 2017. However, measures adopted by the Central Bank to reduce its holdings of Treasury bills by way of allowing its Treasury bill holdings to mature and outright sales of Treasury bills through OMO, have resulted in a decline in excess money market liquidity from the beginning of September. By end September 2017, excess money market liquidity amounted to Rs. 20.96 billion.
Domestic Foreign Exchange Market
y The Sri Lankan rupee depreciated against US dollar by 2.15 per cent during the first nine months of 2017. The pressure on the Sri Lankan rupee to depreciate surged in the first two
quarters of 2017 due to the increased outflows of investments from government securities market with the interest rate hike by the Federal Reserve USA in March 2017 as well as due to the heightened import demand. This depreciating trend continued further until end July 2017 along with the second announcement by the Federal Reserve USA to raise interest rates in June 2017. However, with the positive sentiments created through the receipt of the third tranche of the EFF from the IMF, and the conversions of export proceeds, the pressure on the exchange rate eased towards end September 2017. During the period up to end September 2017, the Sri Lankan rupee depreciated against other major currencies such as the Japanese yen, the Indian rupee, the pound sterling and the euro.
y Central Bank was a net buyer in the domestic foreign exchange market during the first nine months of 2017 with the intention of curbing excess volatility while engaging in foreign reserves accumulation. Accordingly, during the period up to end September 2017, Central Bank absorbed US dollars 1,710.6 million from the market and supplied US dollars 549.8 million to the market resulting in a net purchase of US dollars 1,160.9 million.
y During the period up to end September 2017, trading volumes in the domestic foreign exchange market increased by 13.54 per cent
Per c
ent
149.5
150.0
150.5
151.0
151.5
152.0
152.5
153.0
153.5
154.0
Chart 8.16
Movement of Rupee per US dollar
Source: Central Bank of Sri Lanka
Jan-
17
Feb-
17
Mar
-17
Apr-1
7
May
-17
Jun-
17
Jul-1
7
Aug-
17
Sep-
17
USD
/LKR
Rs.
billi
on
Per c
ent
300
200
100
-100
-200
-300
0
Chart 8.15
Changes in the Central Bank's Balance Sheet driving Money Market Liquidity
Net T-bill Transactions
Fx Swaps Fx Transactions Provisional Advances
SRR Actual Liquidity
Net Currency Deposit
Other
2-Ja
n-17
16-J
an-1
7
30-J
an-1
7
13-F
eb-1
7
27-F
eb-1
7
13-M
ar-1
7
27-M
ar-1
7
10-A
pr-1
7
24-A
pr-1
7
08-M
ay-1
7
22-M
ay-1
7
05-J
un-1
7
19-J
un-1
7
03-
Jul-1
7
17-
Jul-1
7
31-
Jul-1
7
14-
Aug-
17
28-
Aug-
17
11-
Sep-
17
25-
Sep-
17
Rs.
billi
on
Source: Central Bank of Sri Lanka

8120
CENTRAL BANK OF SRI LANKA ǀ RECENT ECONOMIC DEVELOPMENTS: HIGHLIGHTS OF 2017 AND PROSPECTS FOR 2018
compared to the corresponding period in 2016. The total volume of inter-bank foreign exchange transactions was US dollars 12.75 billion up to end September 2017 as against US dollars 11.23 billion in the corresponding period of 2016. The daily average volumes in the inter-bank foreign exchange market also increased by 11.43 per cent to US dollars 70.44 million during the reference period, from US dollars 62.39 million in the corresponding period of 2016. The total volume of forward transactions for the period up to end September 2017 also increased to US dollars 6.56 billion compared to US dollar 6.45 billion recorded during the first nine months of 2016.
Government Securities Market
y In the first half of 2017, majority of borrowings were sourced from the domestic market. With high interest rates and the liquidity shortage then prevailed in the market, the strategies adopted for debt issuance in the first half of 2017 included the issuance of Treasury bonds with shorter maturities and the issuance of Sri Lanka Development Bonds (SLDBs) amounting to US dollars 2,231.4 million. This was intended to offset any possibilities to crowd out the available domestic investible funds. However, with the relatively high volume of issuance of short and medium-term Treasury bonds in the first half of the year, the average time to maturity of government securities decreased.
y The secondary market yield curve of government securities moderated during the first half of 2017, compared to first half of 2016. The secondary market yield rates pertaining to 91-day and 182-day Treasury bills moved upward by 73 basis points and 51 basis points, respectively, while yield rates pertaining to 364-day Treasury bills decreased by around 3 basis points. Market yield rates of actively traded Treasury bonds with maturities of 2 to 10 years decreased by about 33 basis points, at the end of the first half of 2017 compared to the yield rates at end of the corresponding period. of 2016. The improved market conditions along
with foreign inflows from International Sovereign Bonds, syndicated loans and increased foreign investments in Treasury bills and Treasury bonds combined with government strategy to settle only the principal amount of maturing Treasury bonds through domestic sources, contributed positively towards reducing the dependency in domestic funding. This has caused the secondary market yield rates to ease during the first seven months of 2017. The non-resident holdings of Treasury bills and Treasury bonds increased by 7.49 per cent to Rs. 254.44 billion by end July 2017 from Rs. 236.71 billion at end January 2017.
Corporate Debt Securities Market
y Activities of the commercial paper market moderated during the first six months of 2017. The value of Commercial Papers (CPs) issued during the period under review amounted to Rs. 3.6 billion in comparison to Rs. 4.8 billion during the same period of 2016. Continuing the upward trend observed in the previous year, interest rates appliable on CPs continued to increase to a range of 14.5-16.5 per cent in the first half of 2017 from the range of 8.7 - 13.0 per cent in the same period of 2016. The CPs issued during the period, had shorter maturities compared to the previous periods, reflecting somewhat unfavourable investor sentiments. The CPs with maturities up to 3 months accounted for 92.5 per cent of the market, while the share of CPs between 3 months
Rs.
billi
on
Per c
ent
5
6
7
8
9
10
11
12
13
14
15
Chart 8.17
Secondary Market Yield Curve of Government Securities
Per c
ent
Jan-
16
Jan-
17
Feb-
16
Feb-
17
Mar
-16
Mar
-17
Apr-1
6
Apr-1
7
May
-16
May
-17
Jun-
16
Jun-
17
Jul-1
6
Jul-1
7
Aug-
16
Aug-
17
Sep-
16
Sep-
17
Oct
-16
Nov
-16
Dec
-16
1 year T-bills 5 year T-bonds 10 year T-bonds 30 year T-bonds
Source: Central Bank of Sri Lanka

8121
Financial Sector PerFormance and SyStem Stability
to 6 months maturity amounted to 7.5 per cent. There were no commercial papers issued for higher maturities than 6 months during the year. The total outstanding value of CPs amounted to Rs. 2.3 billion as at end June 2017 compared to Rs. 4.5 billion as at end June 2016.
y The volumes in the corporate bond market contracted during the first half of 2017 compared to the corresponding period of the previous year. During the first six months of 2017, there were seven listings of corporate debentures by two institutions, compared with 17 issues by nine institutions during the first six months of 2016. Consequently, the total value of the corporate bonds listed in the first six months of 2017, reduced to Rs. 10.0 billion compared to Rs. 34.4 billion in the corresponding period of the previous year. During the first six months of 2017, the two issuers were from the banking and finance sector, and the interest rates applicable to these bonds varied between 11.95 per cent and 15.00 per cent.
Equity Market
y The Colombo Stock Exchange (CSE) could not sustain the positive performance it gained during the second quarter of the year, as reflected by the volatile movements in price indices during the last few months. The sluggish behaviour of the equity market that prevailed at the end of 2016 continued in the first three months of 2017. This was largely due to expected policy rate hikes in advanced economies, uncertainty in the local policy direction and sustained pressure on the exchange rate. An upward trend was observed in early April as a result of the substantial net foreign investments. In addition, local institutional investors started to accumulate sound stocks at the prevailing lower prices while retail investors bounced back with regained confidence on the recovery of the CSE. However, starting from July 2017 onwards, performance of the equity market deteriorated diminishing the positive momentum prevailed in the preceding months. Although the momentum in the equity market diminished after the first half of 2017, an improvement in market
activity was recorded during the first nine months of the year when compared to the performance in the corresponding period of the previous year. The All Share Price Index (ASPI) and S&P SL20 Index increased by 3.4 per cent and 5.5 per cent respectively, by September compared to end 2016.
y Business involvement in the stock market as reflected by market capitalisation and turnover improved during the first nine month of 2017. Market capitalisation increased to Rs. 2,919.7 billion at the end of September 2017, compared to Rs. 2,745 billion at end 2016. Further, total turnover for the first nine months of 2017 improved to Rs. 165.6 billion compared to Rs. 135.4 billion of the corresponding period of the
0
1,000
2,000
3,000
4,000
5,000
6,000
7,000
8,000
0
2,000
4,000
6,000
8,000
10,000
12,000
14,000
16,000
Chart 8.18
Movements of Share Price Indices
Pric
e In
dex
Daily Turnover (RHS) All Share Price Index (1985=100)
Milanka Price Index(1998 Dec=100)
S&P SL20 Index (2004=1,000)
2012 2013 2014 2015 2016 2017
Rs.
milli
on
Source: Colombo Stock Exchange
0
20
(20)
40
60
80
100
120
Chart 8.19
Foreign Participation at the CSE
Foreign Purchases Net Foreign Purchases/SalesForeign Sales
2012 2013 2014 2015 2016 2017(Jan-Sep)
Rs.
billi
on
Source: Colombo Stock Exchange

8122
CENTRAL BANK OF SRI LANKA ǀ RECENT ECONOMIC DEVELOPMENTS: HIGHLIGHTS OF 2017 AND PROSPECTS FOR 2018
previous year. The average daily turnover and the number of shares traded in the equity market also improved during the first nine months of the year. The net cumulative foreign purchases increased significantly by 711.3 per cent to US dollars 118.9 million in September 2017. However, the total number of trades declined to 727,064 compared to 882,201 in the corresponding period while market Price Earnings Ratio (PER) deteriorated to 10.7 times as at end September 2017 compared to 13.4 times prevailed at the end of 2016. During the period, there were 2 Initial Public offerings (IPO) at CSE which raised Rs. 8.5 billion while 14 right issues raised Rs. 42.0 billion.
Development Finance and Access to Finance
y Central Bank continued to implement a number of development credit schemes with concessionary interest rates, terms and conditions through Participating Financial Institutions (PFIs) during the first eight months of 2017. These schemes provided refinance facilities, interest subsidies and/or credit guarantees and credit supplementary services, targeting development of agriculture and livestock and Micro, Small and Medium Scale Enterprise (MSME) sectors. The primary objective of implementing these schemes was to assist farmers and entrepreneurs who are having limited or no access to the formal
financial institutions and cannot afford high cost of financing to carry out their income generating activities. Broadly, these schemes are expected to promote access to finance and thereby improve the financial inclusion and balanced regional growth in the country. Overall, loans totalling to Rs. 11,562.3 million were disbursed among 78,740 beneficiaries through eleven credit Schemes by the Central Bank up to August 2017. The amount of funds released to the Agriculture and Livestock sector accounted for 50.2 per cent of the loans disbursed followed by 36.4 per cent and 13.4 per cent to the MSME sector and microfinance sector, respectively.
y Central Bank provided concessionary credit to the MSME sector focusing on sustainable economic growth, employment generation, poverty eradication, etc. through five credit schemes. These schemes, namely, the “Saubagya” Loan Scheme (SLS), “Swashakthi – Towards One Million Jobs” Loan Scheme, Dry Zone
Loan Scheme
Share (%)
2016Jan - Aug
2017Jan - Aug
No. of LoansAmountRs. mn.
No. of LoansAmountRs. mn.
MSME 10 41 12 36
Microfinance 24 13 29 13
Agriculture and Livestock 66 46 60 50
Source: Central Bank of Sri Lanka
Table 8.9
Sector-wise Loan Disbursements
*Based on GDP for 2016 (Rs.11,839 billion) Source: Colombo Stock Exchange
Item End Sep 2015 End Sep 2016 End 2016 End Sep 2017 (a)
All Share Price Index (1985 = 100) 7,050.9 6,534.8 6,228.3 6,438.2 Year-to-date change (%) -3.4 -5.2 -9.7 3.4
S&P SL20 Index (2004 = 1,000) 3,826.2 3,617.3 3,496.4 3,688.0
Year-to-date change (%) -0.1 -0.2 -3.6 5.5
Market Capitalisation (Rs.billion) 2,990.8 2,785.7 2,745.4 2,919.7
As a percentage of GDP* (%) 25.3 23.5 23.2 24.7
Market Price Earnings Ratio 18.4 13.4 12.4 10.7
Average Daily Turnover (Rs. million) 1,115.4 753.2 737.2 914.8
Net Cumulative Foreign Purchases in Secondary Market (USD million) -23.4 -19.4 13.7 118.6
Number of Companies Listed 296 295 295 295
Number of Rights Issues (b) 12 6 6 14
Amount raised through Rights issues (Rs. billion) (b) 12.0 2.5 2.5 42.0
Initial Public Offering (b) 2 3 3 2Amount raised through IPOs (Rs. billion) (b) 0.3 1.9 1.9 8.5
Table 8.8
Equity Market - Selected Indicators
(a) Provisional(b) During the period

8123
Financial Sector PerFormance and SyStem Stability
Livelihood Support and Partnership Programme (DZLiSPP-RF), Second Phase of Self Employment Initiative Promotion Loan Scheme (SEPI Ph II) and Working Capital Loan Scheme for Tea Factories (WCLSTF), together, disbursed loans totalling Rs. 4,206.5 million among 9,393 beneficiaries. Of these schemes, SLS alone, which operates island-wide as the flagship loan scheme distributed Rs. 2,616.3 million which accounted for 62.2 per cent of total disbursements to the sector. New loan registrations under the WCLSTF declined during the first eight months of 2017, compared to the same period of 2016 as the scheme is nearing its completion as expected targets have been attained. The “Swashakthi - towards one million jobs” loan scheme that was introduced in March 2017 targeting the MSME sector development, and employment generation, disbursed loans totalling Rs. 930.4 million among 4,045 beneficiaries during the first eight months of the year.
y Overall, the number and amount of loans disbursed to the MSME sector declined mainly due to limited availability of funds in the “Saubagya” loan scheme during the first eight months of 2017 compared to the corresponding period of the previous year since these schemes were nearing their completion.
y With a view to broadening the financial outreach among the masses and promoting poverty alleviation in the country, Central Bank
provided financial support to the Microfinance sector through four microfinance loan schemes. These Schemes, which included, Poverty Alleviation Micro-Finance Project II-Revolving Fund (PAMP II–RF), Poverty Alleviation Micro-Finance Project–Revolving Fund (PAMP-RF), Small Farmers and Landless Credit Project–Revolving Fund (SFLCP-RF) and National Agribusiness Development Programme (NADeP) targeted the micro level entrepreneurs engaged in income generating activities in the agriculture and livestock, trade and other services, and fisheries sectors. Under these schemes, loans amounting to Rs. 1,555.9 million were disbursed among 22,421 beneficiaries, during the first eight months of the year. The amount of funds released to this sector accounted for 13.4 per cent of the total disbursements made by the Central Bank. Overall, the amount of loans disbursed under the microfinance loan schemes decreased by 22.2 per cent during the first eight months of 2017 compared to the corresponding period of the previous year, since PAMP II-RF and SFLCP-RF to be concluded shortly.
y The agriculture and livestock sector continued its dominance in receiving concessionary credit facilities provided through the Central Bank operated loan schemes. Funds amounting to Rs. 5,799.9 million released to this sector, accounted for 50.2 per cent of the total disbursements made through the credit schemes implemented by the Central Bank during the first eight months of 2017. Of the total disbursements, Rs. 4,959.5 million of loans or 85.5 per cent of loans granted to the sector, were delivered through the New Comprehensive Rural Credit
Loan Scheme
Loan Disbursements Growth (%)
2016 Jan - Aug 2017 Jan - Aug2017
Jan - Aug
No. of Loans
AmountRs. mn.
No. of Loans
AmountRs. mn.
No. of Loans
AmountRs. mn.
Saubagya 9,776 3,574 5,141 2,616 -47.4 -26.8
Swashakthi* - - 4,045 930 - -
SEPI Ph II* - - 190 82 - -
SPEnDP** 198 25 - - - -
DZLiSPP-RF 12 1 3 0 -75.0 -66.7
WCLSTF 108 3,450 14 577 -87.0 -83.3
Total 10,094 7,050 9,393 4,207 -6.9 -40.3
Source: Central Bank of Sri Lanka
Table 8.10
Loan Disbursements to the MSME Sector
* Loan Scheme has been commenced in 2017** Loan scheme was concluded in December 2016
Loan Scheme
Loan Disbursements Growth (%)
2016 Jan - Aug
2017 Jan - Aug
2017Jan - Aug
No. of Loans
AmountRs. mn.
No. of Loans
AmountRs. mn.
No. of Loans
AmountRs. mn.
PAMP RF 3,747 183 6,174 307 64.8 67.7
PAMP II RF 15,283 1,247 10,468 889 -31.5 -28.7
SFLCP RF 1,219 67 328 22 -73.1 -67.2
NADeP 4,299 502 5,451 338 26.8 -32.7
Total 24,548 1,999 22,421 1,556 -8.7 -22.2
Source: Central Bank of Sri Lanka
Table 8.11
Loan Disbursements under the Microfinance Loan Schemes

8124
CENTRAL BANK OF SRI LANKA ǀ RECENT ECONOMIC DEVELOPMENTS: HIGHLIGHTS OF 2017 AND PROSPECTS FOR 2018
Scheme (NCRCS) which is the principal scheme that provides both interest subsidy and credit guarantee for loans granted for working capital requirements of small-scale farmers covering 33 short-term crop varieties. The amount of loans granted under NCRCS increased by 3.6 per cent in spite of the prevailed drought condition throughout the country. Among all the districts, the Monaragala District received the highest (14 per cent) amount of loan disbursements made under this scheme, followed by Anuradhapura (13 per cent), and Ampara (12 per cent) districts respectively. Paddy, being the major crop item, received the highest share of 59 per cent of total loan disbursements to the sector.
y Commercial Scale Dairy Development Loan Scheme (CSDDLS) operated successfully during the first eight months of 2017, made disbursements to dairy farmers and entrepreneurs in the dairy related activities. Compared to the first eight months of 2016, disbursements under CSDDLS decreased by 9 per cent during the corresponding period of 2017 due to limited availability of funds for the interest subsidy payments under this scheme. However, overall amount of loans granted under these two schemes to the agriculture and livestock sector increased by 1.6 per cent during the period under review.
y The Central Bank continued to promote financial literacy and inclusiveness and helped entrepreneurship development through a number of programmes and workshops conducted during the reference period covering financial literacy, financial
management, entrepreneurship development and Training of Trainers (TOT) and project appraisal workshops for entrepreneurs. Formation of Self Help Groups and awareness of financial management were also given priority.
y Accordingly, Central Bank conducted 110 Skills Development programmes, 13 Capacity Building programmes and 56 programmes for beneficiaries of the PAMP II - RF project. The number of programmes conducted under the category of awareness building in the reference period exceeded the targets given under the strategic goals. 30 societies of low income families under the Microfinance Credit Schemes too were formed during the reference period.
Developments in the Payment and Settlement Systems
y Central Bank supervises and regulates payment and settlement systems in order to maintain a secure, reliable and efficient payment and settlement system in the country, which is a key requirement for achieving financial system stability. In 2017, Central Bank continued to facilitate the national payment infrastructure to facilitate the economic activities of the country.
y Central Bank continued to facilitate the establishment of Common Card and Payment Switch (CCAPS) operated by LankaClear (Pvt.) Ltd. (LCPL) under the brand name of ‘LankaPay’, which is a network of five interoperable switches. i.e. Common ATM Switch (CAS), Common Electronic Fund Transfer Switch (CEFTS), Shared ATM Switch (SAS), Common Point of Sale Switch (CPS) and Common Mobile Switch (CMobS).
y CAS, which is the first phase of CCAPS, started live operations in July 2013. During first nine months of 2017, membership of CAS increased to 27. Within this period CAS settled 32.4 million transactions amounting to Rs. 189.2 billion. In order to enhance the security of card
Loan Scheme
Loan Disbursements Growth (%)
2016 Jan - Aug
2017 Jan - Aug
2017Jan - Aug
No. of Loans
AmountRs. Mn.
No. of Loans
AmountRs. Mn.
No. of Loans
AmountRs. Mn.
NCRCS 53,437 4,788 45,917 4,960 -14.1 3.6
CSDDLS 1,281 923 1,009 840 -21.2 -9.0
TDP RF 2 0 - - - -
Total 54,720 5,711 46,926 5,800 -14.2 1.6
Source: Central Bank of Sri Lanka
Table 8.12
Loan Disbursements to the Agriculture and Livestock Sector

8125
Financial Sector PerFormance and SyStem Stability
transactions carried through CAS network, CAS members were instructed by Central Bank to enable Europay, MasterCard and Visa (EMV) technology in ATM machines installed by all CAS members.
y CEFTS, which is the second phase of CCAPS, was implemented on 21 August 2015. CEFTS provides a common infrastructure to clear payments effected through multiple payment channels such as ATM, internet banking, mobile banking, kiosks and over-the-counter. During the first nine months of 2017, eight financial institutions integrated with CEFTS increasing the members of CEFTS, thereby to 30. CEFTS settled 2.1 million transactions amounting to Rs. 181.1 billion during the first nine months of 2017.
y LankaPay Online Payment Platform (LPOPP) was launched on 20 July 2017 to facilitate real time payments to Sri Lanka Customs through CEFTS member financial institutions. By end September 2017, six LCBs had connected to LPOPP. LPOPP can be extended to facilitate payments to other government institutions as well. Payment and Settlement Systems Circular No. 08 of 2017 on Maximum Limits on Transaction Value and Fees of CEFTS was issued replacing the Payment and Settlement Systems Circular No. 01 of 2015, in order to increase the maximum per transaction value limit for transactions carried out through a specific transaction code to facilitate real time payments to Sri Lanka Customs.
y The Central Bank approved the request made by LCPL to implement a National Card Scheme in partnership with an international card scheme. Accordingly, the National Card Scheme, which will be implemented in 2018, will facilitate the introduction of low cost products for national initiatives such as social benefit schemes and public transport. The CPS will commence live operations after implementation of the national card scheme.
y The National Payment Council (NPC), which is the industry consultative and monitoring committee on payment systems commenced
the consultative process for preparation of a Roadmap for medium-term development of payment systems covering application of new technology, new payment products and system stability and consumer protection focused regulation. The draft Roadmap was finalised after incorporating the suggestions made by council members. In order to facilitate implementation of the action points of the Roadmap, the NPC appointed two committees to study the potential impact of FinTech and Blockchain and to make recommendations.
Expected Developments
y The Credit growth is expected to gradually moderate to a sustainable rate in the medium term in line with the current monetary policy direction. There has been an increase in the NPLs and banks will need to be cautious of further increase in NPLs associated with the increase in credit and ensure that proper risk management mechanisms are in place to mitigate such risks.
y Capital levels of banks are expected to strengthen further, with the build-up of capital as a result of the enhanced capital requirements. With the enhanced minimum capital levels and the implementation of Basel III Minimum Capital Requirements, banks are required to increase their high quality capital. Banks which are unable to comply, will be encouraged to consolidate on a voluntary basis. Further, with the adoption of Sri Lanka Financial Reporting Standard – 9, Financial Instruments (SLFRS 9) in January 2018, banks will be required to recognise loan losses under expected credit loss approach instead of the existing incurred loan loss approach. Accordingly, banks will be required to augment their capital levels further to be in line with the new accounting standard. This will improve the ability of the banking sector to absorb shocks arising from financial and economic stress, reducing the risks of spill over from the financial sector to the real economy in the coming years.

8126
CENTRAL BANK OF SRI LANKA ǀ RECENT ECONOMIC DEVELOPMENTS: HIGHLIGHTS OF 2017 AND PROSPECTS FOR 2018
y The liquidity positions of banks will continue to be maintained at healthy levels. Banking Act Directions on Liquidity Coverage Ratio (LCR) under Basel III Liquidity Standards were issued in 2015 to be complied with on a staggered basis and the banks are required to maintain an LCR of 100 per cent by 2019. Also with the implementation of the Net Stable Funding Ratio (NSFR) in 2018, the liquidity risk profile of banks will be further strengthened.
y With a view to strengthening the banking sector, the Central Bank issued a consultation paper on Basel III Leverage Ratio Framework for Licensed Banks. Commencing 31 March 2017 banks were required to report Leverage Ratio for monitoring purposes within 30 days from the end of each quarter. Banking Act Directions on the Leverage ratio will be issued upon the issuance of final guidelines by the Basel Committee on Banking Supervision and with this, banks may need to reassess the balance sheet size and business expansion, as the leverage ratio restricts the assets expansion regardless of the relative risk of different assets classes.
y Changes in macroeconomic variables will be closely monitored to identify and address any spillover risks arising from the real economy to the banking sector and appropriate macroprudential measures will be introduced to preempt any future risks to the stability of the financial system. The regulatory and supervisory framework will be further strengthened in line with the Basel Core Principles on Effective Banking Supervision and other international and regional best practices. Examination methodology of banks will be enhanced focusing on the efficiency, effectiveness and sustainability of individual banks and the banking sector.
y Changes are to be introduced to the regulatory and supervisory framework with respect to Cyber-Security and FINTECH, pertaining to banks in line with international standards and best practices. This will prompt banks to upgrade and strengthen their management information systems and related technological
platforms enabling the banks to cater to emerging information requirements. Digital initiatives such as mobile/phone banking and internet banking will be used to increase access for banking services, utilising Information Technology as a service delivery channel. This will require banks to take preventive measures to strengthen information security management of all systems related aspects.
y The banking sector is expected to increase access to banking with a view to enhancing financial inclusion and supporting economic activities throughout the country. With a view to achieving a balanced growth island-wide, banks will be expected to closely monitor and take steps to improve region-wise credit to deposit ratios to be able to utilize funds collected from a particular region to finance economic activities of the same region.
y Large commercial banks will be encouraged to look into avenues of regional expansion, which will lead to an increase in the geographical reach of the banking sector. Close interactions will be maintained with other regional regulators with a view to enhancing information sharing among regulators and cross-border supervision.
y Direction on risk weighted capital adequacy ratio. A new capital adequacy framework for LFCs and SLCs is proposed to be implemented during 2017 in view of fostering a strong emphasis on risk management and to encourage ongoing improvements in LFC and SLC’s risk assessment capabilities. Therefore, the proposed capital adequacy framework provides for maintenance of capital adequacy ratios on a more risk sensitive focus covering credit risk and operational risks under the basic approach available in the Basel accord. Further, the above proposed new regulatory framework is expected to enforce a strict regulatory environment and a natural consolidation drive by pushing smaller, inefficient, weak LFCs/SLCs to consolidate with bigger players or to seek strategic investors with capital infusions.

8127
Financial Sector PerFormance and SyStem Stability
y The stability of the sector is expected to be reinforced further in the medium-term horizon with changes to the existing regulatory framework. The changes are proposed to the existing risk management, liquidity and provisioning regulations, which will enable to establish an Integrated Risk Management Framework for LFCs and SLCs. New governance practices are also expected to be incorporated to the Corporate Governance Framework with a view to improving governance.
y A positive outcome will be expected through the initiatives proposed on the resolution of some distressed finance companies. Initiatives will be taken to resolve distressed finance companies, largely through mergers and recapitalisation through strategic investors. Further, options are being evaluated to settle the existing depositors of these institutions through the Sri Lanka Deposit Insurance and Liquidity Support Scheme and thereafter to liquidate those companies.
y During 2018, DSMI expects to receive applications for licence under the Microfinance Act, which would be evaluated and suitable applicants will be licensed. Action will be taken to include LMFCs under the Credit Information Bureau of Sri Lanka.
y DSMI is in the process of reviewing the Microfinance Act to suggest amendments for more effective regulation of the microfinance sector. DSMI has identified the need for provisions on regulation of non-deposit taking micro-credit institutions through an appropriate regulatory framework, and a unified customer protection framework for protection of microfinance customers. DSMI expects to issue a customer protection charter during 2018, With a view to protecting microfinance customers.
y Regulation of the microfinance sector in a holistic manner has been difficult due to the fact that Microfinance Institutions (MFIs) are regulated by a number of other
regulators apart from the Central Bank, such as Samurdhi Development Department and Co-operative Development Department, which are exempted from the purview of the Microfinance Act. Therefore, DSMI expects to take mesures during 2018 to convene an inter-regulatory council comprising of all regulators of MFIs, which would meet at regular intervals. It is anticipated that Central Bank would entering into MOUs with other regulators of MFIs for sharing of information and regulatory knowledge during 2018.
y It is expected that new and advanced electronic retail payment instruments such as payment cards, mobile and internet payments will become more popular as a means of settling transactions. The increased use of these new electronic retail payment systems, has necessitated measures to minimise risks, and to increase efficiency levels and reduce costs. Accordingly, the Central Bank introduced policy measures to provide a safe and sound environment for easy adoption of electronic payment systems and to maintain public confidence in the electronic retail payment and settlement systems.
y Central Bank is engaged in the preparation of guidelines for mobile applications used by institutions providing payment services for payment related mobile applications which is expected to be issued during the year. These guidelines will lay down the minimum standards in relation to protection of customer information and transaction security and is expected to ensure availability of secure mobile applications to effect payments.
y Central Bank is in the process of revising the Credit Card Operational Guidelines issued in 2010, in line with the new developments in the credit card industry. It is expected to issue revised guidelines during the year after considering the suggestions made by relevant stakeholders.

8128
CENTRAL BANK OF SRI LANKA ǀ RECENT ECONOMIC DEVELOPMENTS: HIGHLIGHTS OF 2017 AND PROSPECTS FOR 2018
y Strengthening of the supervisory and regulatory framework governing the capital markets and the insurance sector continued during the year. The Insurance Board of Sri Lanka (IBSL) has taken measures to streamline the provision of ancillary services by insurance brokering companies. In addition, IBSL intends to work with the World Bank for developing a Micro-Insurance Framework for Sri Lanka. This framework intends to promote micro-insurance as an effective poverty reduction tool. The development of the micro-insurance sector would improve the ability of risk mitigation and reduce the vulnerability of low-income households by facilitating them with access to affordable insurance products.
y The Securities and Exchange Commission (SEC) introduced new risk based criteria on minimum capital requirements and minimum liquid capital of stock brokers while promotional activities of unit trust were streamlined. Approval of a Small and Medium Enterprises Board and minimum public
float enforcement rules by SEC in 2017 are considered to be a major step towards further expansion of capital market operations. Further, the SEC intends to facilitate the demutualisation of the CSE with technical assistance from Asian Development Bank. Demutualisation of the CSE is expected to yield a number of advantages including raising additional capital for expansion and innovation purposes, increasing the ability to operate in a more customer-focused and responding to changes in the dynamic business environment in speedily manner.
y Central Bank has formulated new strategies expecting to promote access to finance, improve financial inclusion and balanced regional growth in the country. Accordingly, the Central Bank facilitates all sectors by enhancing the flow of credit and credit plus services and provision of non-financial support to achieve sustainable development of the country and create a conducive financial environment to bring-in excluded segment to the formal financial sector by developing a National Financial Inclusion Strategy for the country.

APPENDIX 1

130
CENTRAL BANK OF SRI LANKA | RECENT ECONOMIC DEVELOPMENTS: HIGHLIGHTS OF 2017 AND PROSPECTS FOR 2018
Major Economic Policy Changes and Measures: January - October 20171
Monetary Policy24 March 2017 - The Standing Deposit Facility Rate (SDFR) and Standing Lending Facility Rate
(SLFR) of the Central Bank were increased by 25 basis points each to 7.25 per cent and 8.75 per cent, respectively.
Financial Sector
Licensed Banks10 January 2017 - A consultation paper was issued on ‘Basel III Leverage Ratio Framework for
Licensed Banks’.
13 January 2017 - Banking Act Directions No. 01 of 2017 were issued to licensed banks informing the Loan to Value ratio (LTV) for credit facilities granted by the licensed banks for the purpose of purchase or utilisation of vehicles commencing 16 January 2017.
01 February 2017 - A Circular was issued to licensed banks informing the national policy approved in the Budget 2017 in respect of the following;
- credit to identified sectors such as small and medium enterprises, exports, tourism activities, agriculture, youth and women
- enhancing banking services
15 February 2017 - A Direction on LTV for credit facilities in respect of motor vehicles was issued amending and replacing some interpretations in the Direction 5 of the Banking Act Directions No. 01 of 2017.
22 March 2017 - A determination was issued to licensed banks amending the pawning conditions issued on 07 September 1998.
26 May 2017 - A Circular was issued permitting licensed banks to charge interest rates on credit products and penal interest as per their policies, provided banks make adequate disclosures.
29 May 2017 - A Circular was issued to licensed banks informing that they may grant the concessions on a case by case basis to the borrowers affected by the recent floods, adverse weather conditions and connected circumstances in terms of the national policy adopted to facilitate rehabilitation of business and normal operations of such borrowers.
31 May 2017 - A Direction on LTV for credit facilities in respect of motor vehicles was issued amending and replacing Directions 5.1 and 5.4 of the Banking Act Directions No. 02 of 2017.
1. This includes major economic policy changes and measures implemented during January to October 2017. Policy changes and measures that have been announced and are yet to be implemented during the remaining period of 2017 are also included.

131
Appendix i
26 October 2017 - A Direction on enhancing the Minimum Capital Requirement of licensed banks was issued.
Forthcoming - Introducing the Leverage Ratio to licensed banks
- Introducing the Net Stable Funding Ratio (NSFR) to licensed banks
- Enhancing bank examination methodology
Licensed Finance Companies (LFCs) and Specialised Leasing Companies (SLCs)13 January 2017 - The Directions issued to LFCs and SLCs on LTV for credit facilities in respect of
motor vehicles were revised in line with the National Budget 2017.
17 February 2017 - Amendments were issued to the LTV Direction issued on 13 January 2017 as the vehicle categories were mapped to vehicle classes given by the Department of Motor Traffic.
23 February 2017 - A Direction was issued to increase the minimum core capital for LFCs on a staggered basis.
30 May 2017 - LFCs and SLCs were allowed to grant the following concessions to borrowers which have been affected by floods, adverse weather conditions and connected circumstances in terms of the national policy adopted to facilitate rehabilitation of businesses and normal operations of such borrower;
- grant a moratorium of not exceeding 3 months in respect of all performing credit facilities
- waive off the penal interest on overdue loans of the borrowers under the above moratorium and non-performing borrowers as affected above who are willing to settle their loans on rescheduled terms to recommence/restructure their business activities
02 June 2017 - Amendments were made to the LTV Direction issued on 17 February 2017 as the vehicle categories were mapped to vehicle classes given by the Department of Motor Traffic.
Forthcoming - Implementing a new capital adequacy framework for LFCs and SLCs
Insurance 01 January 2017 - Insurance Board of Sri Lanka (IBSL) issued guidelines on conducting investigations
on insurance claims with the objective of promoting professionalism and enhancing the image of the industry while safeguarding the interests of the policy holder.
09 May 2017 - IBSL issued a Direction requiring prior approval of IBSL for the provision of ancillary services other than insurance brokering business by Insurance Brokering Companies.
Forthcoming - Formalising the insurance dispute resolution process by establishing an independent dispute resolution panel, as an alternative dispute resolution mechanism, to resolve disputes arising out of insurance contracts

132
CENTRAL BANK OF SRI LANKA | RECENT ECONOMIC DEVELOPMENTS: HIGHLIGHTS OF 2017 AND PROSPECTS FOR 2018
- Developing a comprehensive strategy for deepening financial literacy on insurance products
- Providing new guidelines to streamline investment activities and unclaimed benefits of insurance companies
Capital Market09 May 2017 - Securities and Exchange Commission of Sri Lanka (SEC) approved Multi-Currency
Board (MCB) to be implemented by Colombo Stock Exchange (CSE) in order to list foreign entities, subject to clearance from the Attorney General’s Department.
06 June 2017 - SEC issued guidelines on the content of advertisements and promotional material to be followed by the companies of unit trust when marketing unit trusts to the public.
13 June 2017 - SEC approved Small and Medium Enterprises (SME) Board to facilitate SME listing in CSE.
28 June 2017 - SEC approved the minimum public float enforcement rules for noncompliance, which is to be implemented by CSE.
01 August 2017 - SEC approved a procedure to be enforced on stock brokering companies to strengthen the framework for risk based capital adequacy requirement of stock brokering firms.
Small and Medium Enterprise (SME) Development20 January 2017 - Operating Instructions were issued to Participating Financial Institutions (PFIs)
to extend operations of the Self-Employment Promotion Initiative (SEPI) Loan Scheme – Phase II up to 31 December 2019.
06 February 2017 - Maximum period for loan repayments under the Commercial Scale Dairy Development Loan Scheme (CSDDLS) was increased to 6 years from 5 years inclusive of a maximum grace period of one year, depending on the nature of the project.
08 February 2017 - A new loan scheme named “Swashakthi – Towards One Million Jobs” was launched by the Central Bank of Sri Lanka (CBSL) for the development of Micro, Small and Medium scale Enterprise (MSME) sector and employment generation, on behalf of the Government.
03 April 2017 - The period of operations of National Agribusiness Development Programme (NADeP) was extended up to 31 December 2017 and the Operating Instructions were issued to PFIs.
26 April 2017 - Operating Instructions were issued to PFIs to establish the Partial Credit Guarantee Scheme (PCG) under the Agriculture Sector Modernisation Project funded by the World Bank.
08 May 2017 - Loan size and repayment period of “Tharuna Diriya” loan scheme were increased up to Rs. 1 million and 48 months, respectively.

133
Appendix i
28 June 2017 - Operating Instructions were issued to PFIs to implement the Post-disaster Economic Activity Recovery Loan Scheme (PEARL) under NADeP.
18 August 2017 - “Athwela” loan scheme was launched by CBSL to provide credit facilities at concessionary terms and conditions to resume economic activities affected by disasters.
Payments and Settlements 20 July 2017 - Payment and Settlement Systems Circular No. 08 of 2017 on maximum limits on
transaction value and fees of Common Electronic Fund Transfer Switch (CEFTS) was issued replacing the Payment and Settlement Systems Circular No. 01 of 2015 in order to increase the maximum per transaction value limit for transactions carried out through a specific transaction code to facilitate real time payments to Sri Lanka Customs.
Forthcoming - Issuing guidelines to set standards for payment related mobile applications
Suspicious Transactions Formats30 March 2017 - Extraordinary Gazette No. 2015/56 dated 30 March 2017 was issued on the
Suspicious Transactions (Format) Regulations of 2017.
Foreign Exchange Management07 March 2017 - Permission was granted to Sri Lankans, resident outside Sri Lanka on Permanent
Residency visa (PR) in another country and individuals who have obtained dual citizenship in Sri Lanka and any other country, to obtain loans in foreign currency and in Sri Lanka rupees, from the Domestic Banking Units (DBUs) of authorised dealers.
- Permission was granted to repay such foreign currency or Sri Lanka rupee loans by utilising funds available in Non-Resident Foreign Currency (NRFCs) accounts, Resident Foreign Currency (RFCs) accounts and Securities Investment Accounts (SIAs) of the same account holder and transfer funds from Foreign Currency Loan Accounts (FCLAs) to Foreign Exchange Earners’ Accounts (FEEAs) for the purpose of acquisition/ construction/ development and renovation of a residential property.
25 May 2017 - New Directions on NRFCs, RFCs, FEEAs and Resident Non-National Foreign Currency (RNNFCs) accounts were issued to the National Savings Bank (NSB) incorporating relaxations made so far with respect to such accounts opened and maintained with authorised dealers.
23 June 2017 - Permission was granted to authorised dealers on considering funds received from exchange companies/ houses, as inward remittances received from abroad through the banking system for the purpose of permitted credits to RFCs, NRFCs, SIAs and Special Foreign Investment Deposit Accounts (SFIDAs).

134
CENTRAL BANK OF SRI LANKA | RECENT ECONOMIC DEVELOPMENTS: HIGHLIGHTS OF 2017 AND PROSPECTS FOR 2018
05 July 2017 - The permission granted to authorised dealers to open new Foreign Currency Accounts for International Services Providers and their Employees (FCAISPE) was withdrawn, as the income tax exemption granted for the professional service providers has been withdrawn by the Inland Revenue (Amendment) Act No.09 of 2015. However, authorised dealers were permitted to maintain existing FCAISPE.
10 July 2017 - Permission was granted to authorised dealers and NSB to open and maintain RFCs jointly, provided that each joint holder is an eligible person to open a RFC account.
28 July 2017 - Foreign Exchange Act, No. 12 of 2017 was enacted;
- to promote and regulate foreign exchange
- to vest the responsibility for promoting and regulating foreign exchange in the Central Bank as the agent of the government
- to provide for the repeal of the Exchange Control Act (Chapter 423)
Price Revisions09 January 2017 - The retail price of kerosene was reduced by Rs. 5 to Rs. 44 per litre.
27 January 2017 - The Maximum Retail Prices (MRP) on certain items were reduced as follows:
- Masoor Dhal (red lentils) from Rs. 169 to Rs. 159 per kg
- Dried sprats (imported - Thailand) from Rs. 495 to Rs. 490 per kg
- Dried sprats (imported - Dubai) from Rs. 410 to Rs. 405 per kg
- Green gram (Moong) from Rs. 220 to Rs. 205 per kg
- White sugar from Rs. 95 to Rs. 93 per kg
- Potatoes (imported) from Rs. 120 to Rs. 115 per kg
08 February 2017 - The MRP on rice was set as follows:
- Samba rice at Rs. 80 per kg
- Naadu rice at Rs. 72 per kg
- Raw rice (Kekulu) at Rs. 70 per kg
17 February 2017 - The MRP on rice was revised as follows:
Variety of RiceMRP on Locally Produced Rice
(Rs. per kg.)
MRP on Imported Rice (Rs. per kg.)
Samba Rice (excluding Keeri and Suduru Samba) 90 80
Naadu Rice 80 72
Raw Rice (Kekulu) 78 70
- Medical Devices Pricing Regulations, No. 01 of 2017 was issued to set MRP on medical devices.

135
Appendix i
14 March 2017 - The MRP on following items was removed:
- White sugar- Frozen or chilled Broiler chicken meat (whole chicken) with skin and without
skin
01 July 2017 - Passenger bus fares were increased by 6.28 per cent. The minimum bus fare was increased to Rs. 10 from Rs. 9.
16 August 2017 - MRP imposed on rice was removed.
30 August 2017 - MRP imposed on dried sprats (imported - Thailand and Dubai) was removed.
26 September 2017 - Price of a 12.5 kg cylinder of LP gas was increased by Rs. 110 to Rs. 1,431.
Tax Revisions
Personal Income TaxForthcoming - Increasing tax free threshold on employment from Rs. 750,000 to Rs. 1.2 million
per annum.
- Tax free allowance will be remained as Rs. 500,000 and the progressive tax rate structure will be introduced as follows;
Taxable Income Tax Rate
First Rs. 600,000 4%
Rs. 600,000- Rs. 1,200,000 8%
Rs. 1,200,000- Rs. 1,800,000 12%
Rs. 1,800,000- Rs. 2,400,000 16%
Rs. 2,400,000- Rs. 3,000,000 20%
Exceeding Rs. 3,000,000 24%
- Introducing Capital Gains Tax (CGT) at a rate of 10 per cent
Corporate Income TaxForthcoming - Revising income tax rates as follows:
- The corporate income tax to a 3 tier structure with a lower rate of 14 per cent, a standard rate of 28 per cent and a higher rate of 40 per cent as follows:
(a) Lower rate of 14 per cent will be applicable to profits and income of SMEs, export of goods or services, agriculture enterprises and educational services
(b) Higher rate of 40 per cent will be applicable to profits and income of betting and gaming, liquor and tobacco
(c) The standard rate of 28 per cent will be applicable on profits and income of all other sectors including banking and finance, insurance, leasing and related activities, etc

136
CENTRAL BANK OF SRI LANKA | RECENT ECONOMIC DEVELOPMENTS: HIGHLIGHTS OF 2017 AND PROSPECTS FOR 2018
Withholding Tax (WHT)Forthcoming - Increasing WHT on interest income to 5 per cent from current 2.5 per cent
- Introducing WHT for specified fees exceeding Rs. 50,000 per month
Economic Service Charge (ESC) 01 April 2017 - Threshold of ESC was reduced from Rs. 50 million per quarter to Rs. 12.5 million
per quarter.
- ESC was charged on motor vehicles in advance on the CIF value certified by the Director General of Customs, of an importer (disregarding the threshold for ESC liability) in respect of every consignment of imports of motor vehicles.
- The CBSL was redefined as a person for the purpose of ESC and made liable for ESC.
Value Added Tax (VAT) Forthcoming - Granting VAT exemptions on plant, machinery and accessories imported for
renewable energy
- Granting VAT exemptions on plant and machinery imported by Ceylon Electricity Board (CEB) for generation, transmission and distribution of energy
- Removing VAT exemptions on locally manufactured dairy products other than milk powder
Nation Building Tax (NBT) 01 April 2017 - Following goods and services were made exempt:
- Supply of international telecommunication services to local operators by External Gateway Operators
- Supply of printed books, magazines, journals, or periodicals other than newspapers
- Supply of electricity other than supply of electricity by CEB
01 August 2017 - Following exemptions were removed and made liable for NBT:
- Supply of any goods required for the purpose of providing of services of international transportation, being goods consigned to Sri Lankan Airlines Ltd, Mihin Lanka (Pvt) Ltd. or Air Lanka Catering services Ltd.
- Supply of any goods or services provided by any Cooperative Society or Lak Sathosa
- Construction services by a contractor other than by a sub contractor
- Services of a travel agent in respect of inbound tours (other than services where the payment is received in foreign currency through a bank)
- The supply of residential apartments

137
Appendix i
Excise Duty01 January 2017 - The duty on bottled toddy was increased to Rs. 50 per litre from Rs. 30 per litre.
- Annual distillery license (except Palmyrah arrack) fee was reduced to Rs. 1 million from Rs. 100 million.
- A license fee of Rs. 100,000 was imposed on arrack licenses that are issued together with foreign liquor license.
- A license fee of Rs. 50,000 was imposed on the sale of bottled toddy.
13 March 2017 - A Gazette was issued to simplify the process of issuing licenses on the importation of foreign liquor.
Excise (Special Provisions)18 August 2017 - Excise duty on motor vehicles for the transport of goods under HS Headings 87.04
was revised downwards to Rs. 700,000 per unit from Rs. 1,000,000 per unit.
- Excise duty on motorcycles including mopeds under HS Headings 87.11 was revised.
Customs Duty01 February 2017 - Customs duty waiver of Rs. 3 per litre was imposed on the importation of diesel.
Hence, the applicable rate is Rs. 12 per litre.
- Customs duty waiver of Rs. 10 per litre was imposed on the importation of petrol. Hence, the applicable rate is Rs. 25 per litre.
17 February 2017 - Importation of ingredients for animal feed production, alloy steel bars for manufacturing of leaf spring and steel for manufacturing of prefabricated buildings was exempted from Customs duty.
- Customs duty on the importation of polymers in primary forms, soya beans, tyres, steel, ball bearings, sparking plugs and batteries was revised.
08 July 2017 - Customs duty waiver on milk powder was increased to Rs. 223 per kg from Rs. 180 per kg. Hence, the applicable rate is Rs. 2 per kg.
02 August 2017 - Customs duty waiver on wheat grain was increased to Rs. 6 per kg from Rs. 3 per kg. Hence, the applicable rate is Rs. 6 per kg.
Customs Valuation15 March 2017 - A method was prescribed for determination of Customs value for
disposal of machinery and equipment imported under exemption of customs import duty on conditional basis by enterprises in the business of manufacturing and exporting apparel.

138
CENTRAL BANK OF SRI LANKA | RECENT ECONOMIC DEVELOPMENTS: HIGHLIGHTS OF 2017 AND PROSPECTS FOR 2018
Cess02 August 2017 - Cess on wheat flour was reduced to Rs. 15 per kg from Rs. 25 per kg
Special Commodity Levy (SCL)07 January 2017 - SCL of Rs. 15 per kg was imposed on the importation of semi-milled or wholly
milled raw rice (Kekulu), Naadu rice (red or white) and Samba rice (red or white) for a period of three months.
19 January 2017 - SCL on the importation of Maldive fish, dried sprats, black gram, chillies, seeds of coriander, turmeric, black gram flour and canned fish was extended for a period of six months.
- SCL on the importation of vegetable oils was reduced by Rs. 20 per kg for a period of six months.
28 January 2017 - SCL duty waiver of Rs. 10 per kg was imposed on the semi-milled or wholly milled raw rice (Kekulu), Naadu rice (red or white) and Samba rice (red or white) for a period of 30 days. Hence the applicable rate is Rs. 5 per kg.
17 February 2017 - SCL on the importation of potatoes and b’ onions was extended for a period of six months.
- SCL on the importation of red and yellow lentils was increased for a period of six months as follows:
- Whole from Rs. 5 per kg to Rs. 10 per kg
- Split from Rs. 10 per kg to Rs. 15 per kg
24 February 2017 - SCL on the importation of vegetable oils was reduced by Rs. 20 per kg for a period of six months.
27 February 2017 - SCL duty waiver of Rs. 10 per kg imposed on semi-milled or wholly milled raw rice (Kekulu), Naadu rice (red or white) and Samba rice (red or white) was extended for a period of 30 days. Hence, the applicable rate is Rs. 5 per kg.
08 March 2017 - SCL on the importation of mackerel, peas, chickpeas, cowpeas, kurakkan and sugar other than white crystalline sugar was extended for a period of six months.
28 March 2017 - SCL duty waiver of Rs. 10 per kg imposed on semi-milled or wholly milled raw rice (Kekulu), Naadu rice (red or white) and Samba rice (red or white) was extended up to 31 March 2017. Hence, the applicable rate is Rs. 5 per kg.
01 April 2017 - SCL on the importation of semi-milled or wholly milled raw rice (Kekulu), Naadu rice (red or white) and Samba rice (red or white) was reduced to Rs. 5 per kg from Rs. 15 per kg for a period of 60 days.
02 April 2017 - SCL on the importation of dried fish, yoghurt, butter, dairy spreads, garlic, fresh oranges, grapes, apples, mathe seeds, kurakkan flour, ground nuts, mustard seeds and salt was extended for a period of six months.
139
Appendix i
08 May 2017 - SCL on the importation of fish, fresh or chilled and frozen, excluding fish fillets and other fish meat, green gram (Moong), Mangoesteens (fresh and dried), Oranges (dried), Pears, Cherries, Plums and soles, Kiwifruit and other fresh fruits under HS Code No. 0810.90.90 was extended for a period of six months.
21 May 2017 - SCL on the importation of red onion, dates, grapes (dried), seeds of cumin and seeds of fennel was extended for a period of six months.
- SCL of Rs. 5 per kg was imposed on husked (brown) rice for a period of six months.
31 May 2017 - SCL on the importation of semi-milled or wholly milled raw rice (Kekulu), Naadu rice (red or white) and Samba rice (red or white) was extended up to 31 August 2017.
06 June 2017 - SCL on the importation of margarine was extended for a period of six months.
- SCL on the importation of sugar was increased by Rs. 10 per kg for a period of six months.
07 June 2017 - SCL duty waiver of Rs. 25 per kg was imposed on fish for a period of 30 days. Hence, the applicable rate is 10 per cent or Rs. 50 per kg.
01 July 2017 - SCL of Rs. 5 per kg was imposed on broken rice for a period of three months.
19 July 2017 - SCL on the importation of Maldive fish, dried sprats, black gram, chillies, seeds of coriander, turmeric, black gram flour and canned fish was extended for a period of six months.
27 July 2017 - SCL on the importation of husked brown rice, semi-milled or wholly milled raw rice (Kekulu), Naadu rice (red or white) and Samba rice (red or white) was reduced to 25 cents per kg from Rs. 5 per kg until 31 December 2017.
01 August 2017 - SCL on the importation of frozen fish meat of Sail fish and Marlin fish was reduced to Rs. 25 per kg from 10 per cent or Rs. 75 per kg, the amount of levy whichever is higher, for a period of three months.
- SCL of Rs. 10 per kg was imposed on the importation of maize for a period of six months.
02 August 2017 - SCL on the importation of broken rice was reduced to 25 cents per kg from Rs. 5 per kg until 31 December 2017.
16 August 2017 - SCL on the importation of sugar was increased by Rs. 8 per kg for a period of six months.
17 August 2017 - SCL on the importation potatoes, b’ onion and lentils was extended for a period of six months.
08 September 2017 - SCL on the importation of mackerel, peas, chickpeas, cowpeas and kurakkan was extended for a period of six months.

140
CENTRAL BANK OF SRI LANKA | RECENT ECONOMIC DEVELOPMENTS: HIGHLIGHTS OF 2017 AND PROSPECTS FOR 2018
Stamp Duty21 February 2017 - Motor vehicle categories, which are liable for paying stamp duty on policy insurance,
finance lease agreement and hire purchase agreement were specified.
Embarkation Levy01 January 2017 - Embarkation Levy was increased to US dollars 50 from US dollars 30.
Fees and ChargesForthcoming - Increasing fines on traffic offences
Other01 September 2017 - Telecommunication Levy on internet services was removed.
Forthcoming - Introducing a Financial Transaction Levy at 0.05 per cent on the basis of the total transaction value by banks or financial institutions
- Increasing teledrama levy applicable on the foreign teledramas flowing in to the country and dubbed in Sinhala, Tamil or any other language
- Imposing a SIM Activation Levy of Rs. 200
- Imposing a Carbon Tax on vehicles other than electric cars and tractors
- Charging a fee for license to import lubricants, bitumen and gold
Government Expenditure09 February 2017 - A Pension Instruction Letter No. 02/2017 was issued to grant a pension
entitlement to the officers who had been sent on retirement after becoming disabled due to terrorist activities without completing 10 years of service in the Armed Forces and Police and 12 years service in the other ranks of Armed Forces.
08 March 2017 - Public Administration Circular No. 06/2017 was issued to extend the age limit of compulsory retirement of the officers in Sri Lanka Engineering Service up to 61 years with effect from 01 January 2017.
09 June 2017 - Pension Circular No.01/2017 was issued to grant a “Ranaviru Surakum Allowance” for disabled officers of Tri Forces who became disabled during the active service due to terrorist activities and their widows with effect from 01 January 2017.
Debt Management10 January 2017 - Issuance of Sri Lanka Development Bonds (SLDBs) up to a limit of US dollars
1,500 million for 2017 was authorised.
24 April 2017 - A Circular was issued requiring all licensed commercial banks, licensed specialised banks and primary dealers to use the Bloomberg trading platform (Fixed Income Quote - FIQ) designed for Sri Lanka to;

141
Appendix i
- quote repurchase rates, tenures and volumes
- report yield rates, tenures and volumes of all repurchase transactions carried out over the counter within 30 minutes of each such trade of Rs. 100 million or above
08 May 2017 - Issuance of SLDBs up to a limit of US dollars 3,000 million for 2017 was re-authorised.
27 July 2017 - A new primary issuance system for Treasury bonds was introduced. Regular monthly Treasury bond auctions are carried out through this system. There are three standard phases for each issuance of Treasury bonds;
Phase I - explores issuance of the entire announced volume in a competitive multiple price auction system through reasonable market bids
Phase II - opens for voluntary, volume based bidding
Phase III - any under allocation during Phases I and II, is issued on a mandatory basis to primary dealers

142
CENTRAL BANK OF SRI LANKA | RECENT ECONOMIC DEVELOPMENTS: HIGHLIGHTS OF 2017 AND PROSPECTS FOR 2018

APPENDIX 2

STATISTICAL APPENDIXDefinitions and Explanatory Notes
The following general notes supplement the footnotes given below the individual tables:
1. In an attempt to bring the material up-to-date, provisional figures are included in some tables.
2. Figures in some tables have been rounded off to the nearest final digit. Hence, there may be a slight discrepancy between the total as shown and the sum of its components.
3. Differences as compared with previously published figures are due to subsequent revisions.
4. The following symbols have been used throughout:-
... = negligible
- = nil
n.a. = not available
144
CENTRAL BANK OF SRI LANKA ǀ RECENT ECONOMIC DEVELOPMENTS: HIGHLIGHTS OF 2017 AND PROSPECTS FOR 2018

TABLE 1
Gross Domestic Product by Industrial Origin at Current Market Prices (a)Rs. million
ECONOMIC ACTIVITY2014(b)
2015(b) (c)
2016(c)
2017First Half
(c)
% Change
15/14(b) (c)
16/15 (c)
17/16First Half
(c)
Agriculture, Forestry and Fishing 829,577 894,780 890,659 479,067 7.9 -0.5 10.6
1. Growing of cereals (except rice) 18,454 20,383 19,863 9,168 10.4 -2.6 -15.6
2. Growing of rice 100,931 117,136 73,484 25,362 16.1 -37.3 -19.3
3. Growing of vegetables 73,091 90,525 89,251 44,282 23.9 -1.4 -8.2
4. Growing of sugar cane, tobacco and other non-perennial crops 3,431 2,774 3,171 1,499 -19.1 14.3 -8.1
5. Growing of fruits 45,697 55,252 63,557 42,819 20.9 15.0 32.6
6. Growing of oleaginous fruits (coconut, king coconut, oil palm) 79,820 95,573 70,860 48,770 19.7 -25.9 27.4
7. Growing of tea (green leaves) 91,533 75,746 82,321 57,646 -17.2 8.7 47.5
8. Growing of other beverage crops (coffee, cocoa etc.) 1,622 1,366 2,096 1,190 -15.8 53.4 44.9
9. Growing of spices, aromatic, drug and pharmaceutical crops 75,735 80,476 89,381 46,113 6.3 11.1 11.3
10. Growing of rubber 17,437 14,218 10,643 6,941 -18.5 -25.1 1.5
11. Growing of other perennial crops 22,636 24,507 25,411 12,230 8.3 3.7 2.2
12. Animal production 57,284 65,458 88,836 46,522 14.3 35.7 18.9
13. Plant propagation and support activities to agriculture 12,110 13,808 14,414 7,324 14.0 4.4 3.5
14. Forestry and logging 71,767 75,546 84,003 40,151 5.3 11.2 -0.7
15. Marine fishing and marine aquaculture 141,987 146,709 159,064 83,680 3.3 8.4 5.8
16. Fresh water fishing and fresh water aquaculture 16,043 15,303 14,305 5,368 -4.6 -6.5 14.8
Industries 2,931,998 2,991,106 3,208,476 1,800,797 2.0 7.3 13.7
17. Mining and quarrying 254,392 249,056 315,067 166,607 -2.1 26.5 17.8
18. Manufacture of food, beverages & tobacco products 759,354 851,869 858,954 515,747 12.2 0.8 17.7
19. Manufacture of textiles, wearing apparel and leather related products 415,363 396,724 383,411 223,188 -4.5 -3.4 7.3
20. Manufacture of wood and of products of wood and cork, except furniture 22,269 27,947 26,879 10,532 25.5 -3.8 -5.0
21. Manufacture of paper products, printing and reproduction of media products 36,585 37,897 41,361 21,639 3.6 9.1 3.7
22. Manufacture of coke and refined petroleum products 66,690 20,399 2,406 1,520 -69.4 -88.2 19.4
23. Manufacture of chemical products and basic pharmaceutical products 74,134 70,385 84,870 41,507 -5.1 20.6 -5.1
24. Manufacture of rubber and plastic products 77,754 80,133 96,811 41,371 3.1 20.8 3.7
25. Manufacture of other non- metallic mineral products 110,571 93,903 97,578 55,381 -15.1 3.9 11.7
26. Manufacture of basic metals and fabricated metal products 33,635 38,600 48,848 22,919 14.8 26.6 7.3
27. Manufacture of machinery and equipment 33,421 41,758 46,804 21,820 24.9 12.1 10.7
28. Manufacture of furniture 78,967 82,639 84,434 47,872 4.7 2.2 15.4
29. Other manufacturing, and repair and installation of machinery and equipment 49,971 56,669 64,823 34,166 13.4 14.4 13.0
30. Electricity, gas, steam and air conditioning supply 77,639 82,793 86,660 45,871 6.6 4.7 9.6
31. Water collection, treatment and supply 14,425 15,075 17,792 9,026 4.5 18.0 1.7
32. Sewerage, waste, treatment and disposal activities 13,140 16,873 19,517 11,326 28.4 15.7 19.5
33. Construction 813,689 828,388 932,260 530,306 1.8 12.5 16.2
Services 5,895,618 6,270,028 6,743,346 3,450,595 6.4 7.5 7.8
34. Wholesale and retail trade 1,117,234 1,188,521 1,264,170 734,019 6.4 6.4 11.1
35. Transportation of goods and passengers including warehousing 1,288,124 1,300,167 1,426,726 628,554 0.9 9.7 2.0
36. Postal and courier activities 4,821 5,001 4,890 2,647 3.7 -2.2 16.5
37. Accommodation, food and beverage service activities 166,608 171,314 184,992 98,424 2.8 8.0 10.2
38. Programming and broadcasting activities and audio video productions 3,680 4,425 4,749 2,444 20.2 7.3 11.3
39. Telecommunication 44,733 57,222 68,316 35,765 27.9 19.4 6.1
40. IT programming consultancy and related activities 13,405 15,528 17,265 9,298 15.8 11.2 10.0
41. Financial service activities and auxiliary financial services 340,727 346,447 405,572 212,650 1.7 17.1 20.5
42. Insurance, reinsurance and pension funding 92,938 102,251 120,973 47,344 10.0 18.3 6.0
43. Real estate activities, including ownership of dwelling 562,687 625,521 676,760 360,222 11.2 8.2 9.4
44. Professional services 210,966 197,212 198,198 102,843 -6.5 0.5 5.6
45. Public administration and defence; compulsory social security 563,280 637,464 678,665 334,422 13.2 6.5 6.1
46. Education 212,148 250,024 256,726 130,945 17.9 2.7 1.8
47. Human health activities, residential care and social work activities 210,304 257,008 265,962 134,163 22.2 3.5 3.4
48. Other personal service activities 1,063,962 1,111,922 1,169,381 616,855 4.5 5.2 8.8
Equals Gross Value Added (GVA) at Basic Price 9,657,194 10,155,914 10,842,481 5,730,458 5.2 6.8 9.8
Taxes less subsidies on products 703,957 795,782 996,495 611,682 13.0 25.2 12.6
Equals Gross Domestic Product (GDP) at Market Price 10,361,151 10,951,695 11,838,975 6,342,141 5.7 8.1 10.1
(a) The data is based on the base year 2010 GDP estimates of Department of Census and Statistics Source : Department of Census and Statistics(b) Revised(c) Provisional
145
STATISTICAL APPENDIX 2

TABLE 2
Gross Domestic Product by Industrial Origin at Constant (2010) Prices (a)Rs. million
ECONOMIC ACTIVITY2014(b)
2015(b) (c)
2016(c)
2017First Half
(c)
% Change
15/14 (b) (c)
16/15 (c)
17/16First Half
(c)
Agriculture, Forestry and Fishing 639,696 670,106 641,943 310,400 4.8 -4.2 -3.1
1. Growing of cereals (except rice) 13,969 14,982 13,410 6,238 7.3 -10.5 -15.2
2. Growing of rice 61,019 76,256 52,649 13,497 25.0 -31.0 -42.1
3. Growing of vegetables 55,244 56,714 55,522 27,231 2.7 -2.1 -4.6
4. Growing of sugar cane, tobacco and other non-perennial crops 2,287 1,944 2,205 1,061 -15.0 13.4 -10.2
5. Growing of fruits 40,888 48,033 46,258 26,348 17.5 -3.7 1.7
6. Growing of oleaginous fruits (coconut, king coconut, oil palm) 64,158 67,504 67,074 30,367 5.2 -0.6 -14.9
7. Growing of tea (green leaves) 73,936 71,978 63,893 34,105 -2.6 -11.2 1.2
8. Growing of other beverage crops (coffee, cocoa etc.) 1,538 1,259 1,353 682 -18.1 7.5 0.7
9. Growing of spices, aromatic, drug and pharmaceutical crops 57,505 61,483 65,417 33,728 6.9 6.4 1.3
10. Growing of rubber 28,688 25,777 23,023 13,119 -10.1 -10.7 -5.9
11. Growing of other perennial crops 15,402 16,839 16,473 8,604 9.3 -2.2 3.9
12. Animal production 47,950 51,811 55,060 27,763 8.1 6.3 8.9
13. Plant propagation and support activities to agriculture 9,767 10,421 9,936 5,124 6.7 -4.7 3.5
14. Forestry and logging 47,450 48,360 51,020 25,306 1.9 5.5 7.2
15. Marine fishing and marine aquaculture 105,822 104,245 104,915 52,578 -1.5 0.6 4.5
16. Fresh water fishing and fresh water aquaculture 14,072 12,501 13,734 4,651 -11.2 9.9 15.1
Industries 2,218,711 2,264,673 2,416,276 1,255,249 2.1 6.7 5.8
17. Mining and quarrying 201,613 191,112 218,545 116,914 -5.2 14.4 18.1
18. Manufacture of food, beverages & tobacco products 513,960 532,936 519,815 260,512 3.7 -2.5 -1.1
19. Manufacture of textiles, wearing apparel and leather related products 276,800 282,070 281,481 152,768 1.9 -0.2 1.3
20. Manufacture of wood and of products of wood and cork, except furniture 23,139 26,239 30,311 12,136 13.4 15.5 -3.2
21. Manufacture of paper products, printing and reproduction of media products 24,968 27,092 29,730 16,213 8.5 9.7 6.8
22. Manufacture of coke and refined petroleum products 28,723 29,075 31,245 15,907 1.2 7.5 -15.2
23. Manufacture of chemical products and basic pharmaceutical products 82,243 82,303 85,623 41,881 0.1 4.0 -5.1
24. Manufacture of rubber and plastic products 71,909 76,446 90,119 39,197 6.3 17.9 5.7
25. Manufacture of other non- metallic mineral products 78,671 74,269 64,520 37,708 -5.6 -13.1 16.8
26. Manufacture of basic metals and fabricated metal products 24,882 28,516 36,711 17,010 14.6 28.7 4.8
27. Manufacture of machinery and equipment 32,064 38,838 44,300 20,680 21.1 14.1 13.0
28. Manufacture of furniture 82,748 93,529 96,684 51,174 13.0 3.4 7.1
29. Other manufacturing, and repair and installation of machinery and equipment 55,993 68,380 72,922 33,020 22.1 6.6 -7.2
30. Electricity, gas, steam and air conditioning supply 80,298 85,067 92,175 45,712 5.9 8.4 1.2
31. Water collection, treatment and supply 11,504 12,005 12,950 6,913 4.4 7.9 13.3
32. Sewerage, waste, treatment and disposal activities 17,355 21,681 25,539 13,856 24.9 17.8 10.7
33. Construction 611,842 595,115 683,604 373,650 -2.7 14.9 12.8
Services 4,618,501 4,883,444 5,087,452 2,536,917 5.7 4.2 4.0
34. Wholesale and retail trade 884,094 929,208 952,652 521,757 5.1 2.5 4.2
35. Transportation of goods and passengers including warehousing 885,506 929,854 968,421 426,310 5.0 4.1 2.3
36. Postal and courier activities 4,056 4,052 4,259 2,088 -0.1 5.1 6.0
37. Accommodation, food and beverage service activities 131,481 133,984 139,406 70,536 1.9 4.0 3.5
38. Programming and broadcasting activities and audio video productions 2,513 2,623 2,824 1,317 4.4 7.7 -0.7
39. Telecommunication 30,986 34,125 36,967 20,062 10.1 8.3 7.9
40. IT programming consultancy and related activities 10,579 12,144 13,011 6,659 14.8 7.1 3.3
41. Financial service activities and auxiliary financial services 420,223 492,642 553,826 317,008 17.2 12.4 15.8
42. Insurance, reinsurance and pension funding 74,978 81,960 88,962 34,215 9.3 8.5 6.5
43. Real estate activities, including ownership of dwelling 444,049 489,217 509,993 258,110 10.2 4.2 2.7
44. Professional services 166,486 154,239 149,382 73,710 -7.4 -3.1 -0.8
45. Public administration and defence; compulsory social security 402,205 430,098 452,579 198,213 6.9 5.2 -4.8
46. Education 173,751 159,758 171,707 85,375 -8.1 7.5 4.3
47. Human health activities, residential care and social work activities 147,962 159,901 162,243 82,632 8.1 1.5 12.4
48. Other personal service activities 839,633 869,640 881,221 438,923 3.6 1.3 2.0
Equals Gross Value Added (GVA) at Basic Price 7,476,908 7,818,224 8,145,671 4,102,566 4.6 4.2 4.0
Taxes less subsidies on products 758,521 815,667 866,355 270,781 7.5 6.2 3.0
Equals Gross Domestic Product (GDP) at Market Price 8,235,429 8,633,890 9,012,026 4,373,347 4.8 4.4 3.9
(a) The data is based on the base year 2010 GDP estimates of Department of Census and Statistics Source : Department of Census and Statistics
(b) Revised
(c) Provisional
146
CENTRAL BANK OF SRI LANKA ǀ RECENT ECONOMIC DEVELOPMENTS: HIGHLIGHTS OF 2017 AND PROSPECTS FOR 2018

147
STATISTICAL APPENDIX 2
TABLE 3
Expenditure on Gross Domestic Product at Current Market Prices (a)Rs. million
ITEM 2015 (b)(c) 2016 (c) 2017First Half (c) 2017 (d)
1. Private Consumption Expenditure 7,677,131 8,003,789 4,257,982 8,667,529
2. General Government Consumption Expenditure 984,755 1,015,107 516,614 1,063,575
3. Gross Domestic Capital Formation 3,114,674 3,723,875 2,078,023 4,118,572
4. Export of Goods and Services 2,301,065 2,538,695 1,366,566 2,923,450
5. Less: Import of Goods and Services 3,125,931 3,442,490 1,877,044 3,902,589
Gross Domestic Product 10,951,695 11,838,975 6,342,141 12,870,538
(a) The data is based on the base year 2010 GDP estimates of Department of Census and Statistics Sources : Department of Census and Statistics
(b) Revised Central Bank of Sri Lanka
(c) Provisional
(d) CBSL Projections

TABLE 4
Trends in Principal Agricultural Crops
CATEGOrY Unit 2013 2014 2015 2016 (a)2017
First Half (b) Annual (c)
1. Tea
1.1 Production (d) kg mn 340.0 338.0 328.8 292.6 156.5 311.0
1.2 Extent hectares '000 222 203 203 203 201 201
1.3 Cost of Production (e) Rs./kg 422.70 475.11 458.84 469.24 - n.a.
1.4 Average Price
Colombo Auction Rs./kg 445.83 459.01 401.46 473.15 618.33 644.62
Export (F.O.B.) Rs./kg 623.91 649.44 593.08 639.88 796.34 821.09
2. rubber
2.1 Production kg mn 130.4 98.6 88.6 79.1 45.1 85.0
2.2 Extent hectares '000 134 134 137 136 136 136
2.3 Average Yield kg/hectare 1,247 889 819 851 n.a. 864
2.4 Cost of Production
Estate Sector Rs./kg 259.43 282.04 266.41 277.60 - n.a.
Small Holding Sector Rs./kg 150.00 160.00 170.00 180.00 - 195.00
2.5 Average Price
Colombo Auction (RSS 1) Rs./kg 376.90 286.05 248.17 239.28 331.65 336.10
Export (F.O.B.) Rs./kg 389.81 362.83 342.03 294.33 330.09 334.07
3. Coconut
3.1 Production nuts mn 2,513 2,870 3,056 3,011 1,289 2,650
3.2 Extent hectares '000 392 441 455 447 449 452
3.3 Cost of Production Rs./nut 13.58 13.67 16.39 16.70 - n.a.
3.4 Average Export Price (F.O.B.) (f) Rs./nut 29.36 39.08 54.54 41.16 53.15 50.55
4. Paddy (g)
4.1 Production mt '000 4,621 3,381 4,819 4,420 1,419 2,448
Maha mt '000 2,846 2,236 2,877 2,903 1,419 1,419
Yala mt '000 1,774 1,145 1,942 1,517 - 1,029
4.2 Area
Sown hectares '000 1,227 964 1,254 1,114 531 801
Harvested hectares '000 1,067 793 1,088 1,011 371 601
4.3 Fertiliser Issued (h) mt '000 363 275 341 202 - -
4.4 Average Yield kg/hectare 4,329 4,264 4,429 4,372 4,277 4,071(F.O.B. = Freight on Board) Sources : Sri Lanka Tea Board
(a) Revised Tea Small Holdings Development Authority
(b) Provisional Ministry of Plantation Industries
(c) Projections are based on information available upto end August Department of Census and Statistics
(d) Including green tea Rubber Development Department
(e) Weighted average cost of production of public sector estates and private plantation Coconut Cultivation Board
companies, including green leaf suppliers' profit margin Coconut Development Authority
(f) Three major coconut kernel products only. Plantation Companies
(g) On a cultivation year basis (Maha harvesting falls in the first half of the year) National Fertiliser Secretariat
(h) From 2016 Yala Season, a direct cash grant was provided, replacing existing fertiliser Sri Lanka Customs
subsidy scheme. Accordingly, Rs. 6,468.6 million was disbursed for the 2016 Yala Central Bank of Sri Lanka
Season and figure for 2016 is only for 2015/16 Maha Season.
148
CENTRAL BANK OF SRI LANKA ǀ RECENT ECONOMIC DEVELOPMENTS: HIGHLIGHTS OF 2017 AND PROSPECTS FOR 2018

149
STATISTICAL APPENDIX 2
TABLE 5
Foreign Direct Investment of BOI Enterprises by Sector (a)US dollars million
SECTOr 2012 2013 2014 2015 2016 (b)
First Half
2016 2017 (b)
Manufacturing
Food, Beverages and Tobacco Products 75.9 49.7 44.7 42.7 49.5 19.9 37.6
Textile, Wearing Apparel and Leather Products 86.7 102.6 83.1 45.4 21.3 6.5 27.3
Wood and Wooden Products 2.4 1.7 2.5 2.8 3.1 1.5 1.1
Paper, Paper Products, Printing and Publishing 4.0 2.1 36.3 2.2 3.1 0.2 4.0
Chemicals, Petroleum, Coal, Rubber and Plastic Products 59.2 114.4 91.9 75.4 99.5 51.9 74.3
Non-metallic Mineral Products 17.7 45.2 29.7 13.7 31.2 4.2 6.1
Fabricated Metal, Machinery and Transport Equipment 38.8 17.0 7.0 46.1 11.9 3.7 3.1
Manufactured Products not elsewhere specified 22.9 27.1 38.7 28.7 28.2 7.8 31.9
Agriculture 7.2 8.5 5.7 3.9 1.9 ... 0.6
Services
Hotels and Restaurants 117.3 67.9 68.4 181.9 141.3 95.9 97.1
IT and BPO (c) 25.9 19.3 24.7 13.6 23.0 8.5 20.8
Other Services 224.6 149.1 413.3 59.9 47.6 15.9 20.5Infrastructure
Housing, Property Development and Shop Office 55.7 217.6 339.2 212.1 79.5 16.0 199.0
Telephone and Telecommunication Network 242.1 359.8 152.5 138.8 243.6 97.0 76.2
Power Generation, Fuel, Gas, Petroleum and Other 96.5 44.9 12.5 51.3 14.8 1.7 0.7
Port Container Terminals 202.2 164.5 178.2 51.2 1.6 1.4 0.7
Total 1,279.2 1,391.4 1,528.4 969.7 801.0 332.2 601.3(a) Includes loans, excludes inflows to non-BOI companies and direct investment in listed companies in the CSE not
registered with the BOI.Source : Board of Investment of Sri Lanka
(b) Provisional
(c) Information Technology and Business Process Outsourcing

150
CENTRAL BANK OF SRI LANKA ǀ RECENT ECONOMIC DEVELOPMENTS: HIGHLIGHTS OF 2017 AND PROSPECTS FOR 2018
TABLE 6
Developments in Economic Infrastructure
SECTOr 2013 2014 2015 2016 (a)2016 (a)
For the Period
2017 (a)
For the Period
1. Electricity Jan.-Jul. Jan.-Jul.Installed Capacity (MW - End Period) 3,362 3,932 3,847 4,018 3,975 4,134
Total Power Generation (GWh) 11,898 12,357 13,090 14,149 8,141 8,374
Share of Hydropower in Total Generation (%) (b) 50 29 37 25 30 15
2. Transport Jan.-Jun. Jan.-Jun.2.1 Sri Lanka Transport Board
Operated Kilometrage (million) 344 371 440 452 223 219
Passenger Kilometrage (million) 12,201 12,717 15,210 16,101 7,770 7,737
Average No. of Operated Buses 4,373 4,226 5,284 5,315 5,306 5,219
Total Revenue (Rs. million) 30,189 33,665 35,825 40,928 20,334 20,514
Operating Expenditure (Rs. million) 33,684 35,527 40,555 42,004 20,998 19,971
Operating Profit/(Loss) (Rs. million) (3,496) (1,862) (4,730) (1,076) (664) 542
2.2 Sri Lanka railwaysOperated Kilometrage ('000) 10,924 11,075 11,797 11,921 5,896 5,941 (c)
Passenger Kilometrage (million) 6,257 6,842 7,407 7,413 3,577 3,639Freight Ton Kilometrage (million) 133 130 130 140 67 71Total Revenue (Rs. million) 5,423 5,909 6,335 6,623 3,173 3,193Operating Expenditure (Rs. million) 10,586 16,943 14,049 13,396 6,529 7,011Operating Profit/(Loss) (Rs. million) (5,163) (11,034) (7,714) (6,773) (3,356) (3,818)
2.3 New registration of Motor Vehicles Jan.-Sep. Jan.-Sep.Buses 1,805 3,851 4,140 2,685 2,011 2,356
Motor Cars 28,380 38,780 105,628 45,172 33,198 29,684
Three Wheelers 83,673 79,038 129,547 56,945 40,314 17,519
Dual Purpose Vehicles 24,603 20,799 39,456 26,887 19,336 12,613
Motor Cycles 169,280 272,885 370,889 340,129 245,350 262,012
Goods Transport Vehicles 5,872 5,121 7,142 7,563 5,326 8,503
Land Vehicles 13,038 9,082 12,105 13,947 9,620 9,528
Total Vehicles Registered 326,651 429,556 668,907 493,328 355,155 342,215
3. Port Services Jan.-Sep. Jan.-Sep.Ships Arrived at Ports of Sri Lanka 3,976 4,264 4,728 4,998 3,769 3,647
Total Cargo Handling (MT '000 ) 66,243 74,410 77,579 86,519 64,502 69,337
Total Container Handling (TEUs '000) 4,306 4,908 5,185 5,735 4,255 4,545
Transshipments (TEUs '000) 3,274 3,781 3,967 4,435 3,304 3,523
4. Telecommunication Services End June End JuneFixed Access Telephones (No.) 2,706,787 2,709,848 2,601,196 2,550,432 2,597,297 2,514,154
Cellular Telephones (No.) 20,315,150 22,123,000 24,384,544 26,227,631 24,695,535 28,113,153
Internet Connections (No.) 2,009,456 3,396,295 4,090,920 4,920,554 4,232,291 5,479,328
Total Telephone Penetration
(Telephones per 100 Persons) 112 120 129 136 129 143
Mobile Telephone Penetration
(Telephones per 100 Persons) 99 107 116 124 116 131
(TEUs=Twenty-foot Equivalent Container Units) Sources : Ceylon Electricity Board
(a) Provisional Sri Lanka Transport Board
(b) Excluding mini hydropower Sri Lanka Railways
(c) Estimates Department of Motor Traffic
Sri Lanka Ports Authority
Telecommunications Regulatory Commission of Sri Lanka

151
STATISTICAL APPENDIX 2
TABLE 7
Consumer Price Indices - National Consumer Price Index2013 = 100
PErIOD Index Year-on-Year Change (%) Annual Average Change (%)
NCPI Core NCPI NCPI Core NCPI NCPI Core NCPI2015 December 113.2 112.9 4.2 5.8 3.8 4.6
2016 January 112.0 113.4 -0.7 3.0 2.9 4.3February 110.8 113.9 1.7 4.6 2.6 4.4March 110.0 114.3 2.2 5.0 2.4 4.5April 111.6 115.7 4.3 5.9 2.6 4.7May 113.7 117.5 5.3 7.2 2.7 5.0June 116.1 118.2 6.4 7.5 3.1 5.3July 115.2 117.9 5.8 6.8 3.4 5.5August 113.3 117.4 4.5 6.0 3.6 5.6September 113.5 117.7 4.7 5.7 3.8 5.7October 114.7 118.2 5.0 5.7 4.0 5.7November 116.6 120.4 4.1 6.8 4.0 5.8December 118.0 120.5 4.2 6.7 4.0 5.9
2017 January 119.3 121.4 6.5 7.1 4.6 6.2February 119.9 122.0 8.2 7.1 5.1 6.4March 119.5 122.3 8.6 7.0 5.6 6.6April 121.0 122.5 8.4 5.9 6.0 6.6May 121.8 123.0 7.1 4.7 6.1 6.4June 123.4 123.1 6.3 4.1 6.1 6.1July 122.4 122.9 6.3 4.2 6.2 5.9August 122.3 123.0 7.9 4.8 6.5 5.8September 123.3 123.1 8.6 4.6 6.8 5.7
NCPI - National Consumer Price Index Source : Department of Census and Statistics
Core NCPI - Core National Consumer Price Index
TABLE 8
Consumer Price Indices - Colombo Consumer Price Index 2013 = 100
PErIOD Index Year-on-Year Change (%) Annual Average Change (%)
CCPI Core CCPI CCPI Core CCPI CCPI Core CCPI2015 December 109.8 113.2 4.6 6.7 2.2 4.9
2016 January 110.0 113.4 1.7 3.6 2.1 4.9February 109.3 113.5 2.9 4.4 2.1 5.0March 108.6 113.5 2.6 3.7 2.2 5.0April 109.5 114.1 3.4 3.5 2.4 4.9May 111.5 116.5 4.8 5.6 2.7 5.0June 113.2 116.8 5.5 5.4 3.0 5.1July 113.9 116.8 5.8 5.0 3.4 5.1August 112.1 116.0 4.4 3.8 3.7 4.9September 111.8 116.3 4.2 3.7 3.9 4.8October 112.1 116.6 4.1 3.8 4.0 4.6November 113.6 118.5 4.0 4.8 4.0 4.5December 114.7 119.8 4.5 5.8 4.0 4.4
2017 January 116.1 121.3 5.5 7.0 4.3 4.7February 116.7 121.6 6.8 7.1 4.6 5.0March 116.5 121.8 7.3 7.3 5.0 5.3April 117.1 121.9 6.9 6.8 5.3 5.5May 118.2 122.5 6.0 5.2 5.4 5.5June 120.1 122.8 6.1 5.1 5.5 5.5July 119.4 122.5 4.8 4.9 5.4 5.4August 118.8 123.0 6.0 6.0 5.5 5.6September 119.7 123.3 7.1 6.0 5.8 5.8
CCPI - Colombo Consumer Price Index Source : Department of Census and Statistics
Core CCPI - Core Colombo Consumer Price Index
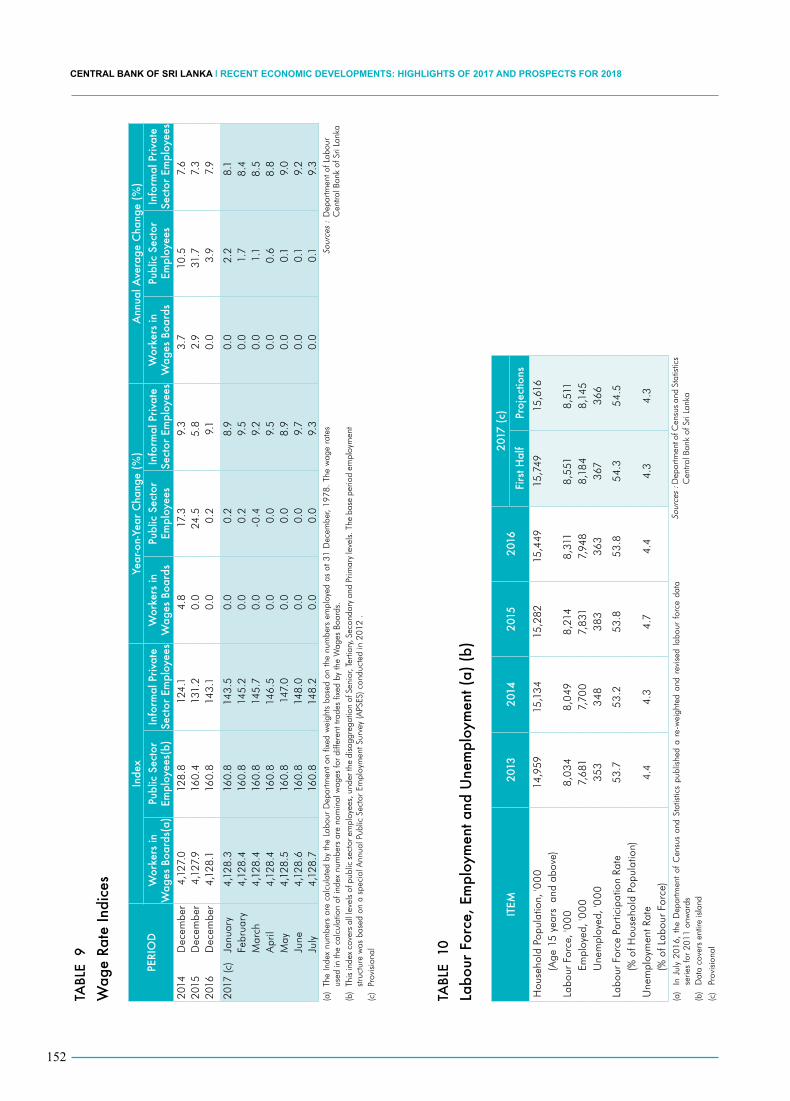
152
CENTRAL BANK OF SRI LANKA ǀ RECENT ECONOMIC DEVELOPMENTS: HIGHLIGHTS OF 2017 AND PROSPECTS FOR 2018TA
BLE
9
Wag
e ra
te In
dice
s
PErI
OD
Inde
xYe
ar-o
n-Ye
ar C
hang
e (%
)A
nnua
l Ave
rage
Cha
nge
(%)
Wor
kers
in
Wag
es B
oard
s(a)
Publ
ic S
ecto
r Em
ploy
ees(
b)In
form
al P
rivat
e Se
ctor
Em
ploy
ees
Wor
kers
in
Wag
es B
oard
sPu
blic
Sec
tor
Empl
oyee
sIn
form
al P
rivat
e Se
ctor
Em
ploy
ees
Wor
kers
in
Wag
es B
oard
sPu
blic
Sec
tor
Empl
oyee
sIn
form
al P
rivat
e Se
ctor
Em
ploy
ees
2014
Dec
embe
r4,
127.
012
8.8
124.
14.
817
.39.
33.
710
.57.
620
15D
ecem
ber
4,12
7.9
160.
413
1.2
0.0
24.5
5.8
2.9
31.7
7.3
2016
Dec
embe
r4,
128.
116
0.8
143.
10.
00.
29.
10.
03.
97.
9
2017
(c)
Janu
ary
4,12
8.3
160.
814
3.5
0.0
0.2
8.9
0.0
2.2
8.1
Febr
uary
4,12
8.4
160.
814
5.2
0.0
0.2
9.5
0.0
1.7
8.4
Mar
ch4,
128.
416
0.8
145.
70.
0-0
.49.
20.
01.
18.
5A
pril
4,12
8.4
160.
814
6.5
0.0
0.0
9.5
0.0
0.6
8.8
May
4,12
8.5
160.
814
7.0
0.0
0.0
8.9
0.0
0.1
9.0
June
4,12
8.6
160.
814
8.0
0.0
0.0
9.7
0.0
0.1
9.2
July
4,12
8.7
160.
814
8.2
0.0
0.0
9.3
0.0
0.1
9.3
(a)
The
Inde
x nu
mbe
rs a
re c
alcu
late
d by
the
Labo
ur D
epar
tmen
t on
fixed
wei
ghts
bas
ed o
n th
e nu
mbe
rs e
mpl
oyed
as
at 3
1 D
ecem
ber,
1978
. Th
e w
age
rate
s us
ed in
the
calc
ulat
ion
of in
dex
num
bers
are
nom
inal
wag
es fo
r di
ffere
nt tr
ades
fixe
d by
the
Wag
es B
oard
s.So
urce
s :
Dep
artm
ent o
f Lab
our
Cen
tral B
ank
of S
ri La
nka
(b)
This
inde
x co
vers
all
leve
ls o
f pub
lic s
ecto
r em
ploy
ees,
und
er th
e di
sagg
rega
tion
of S
enio
r, Te
rtiar
y, S
econ
dary
and
Prim
ary
leve
ls. T
he b
ase
perio
d em
ploy
men
t st
ruct
ure
was
bas
ed o
n a
spec
ial A
nnua
l Pub
lic S
ecto
r Em
ploy
men
t Sur
vey
(APS
ES) c
ondu
cted
in 2
012
.(c
)Pr
ovis
iona
l
TABL
E 1
0
Labo
ur F
orce
, Em
ploy
men
t and
Une
mpl
oym
ent (
a) (
b)
ITEM
2013
2014
2015
2016
2017
(c)
Firs
t Hal
fPr
ojec
tions
Hou
seho
ld P
opul
atio
n, '0
00
14,9
5915
,134
15,2
8215
,449
15,7
4915
,616
(Age
15
year
s a
nd a
bove
)La
bour
For
ce, '
00
0 8,
034
8,0
498,
214
8,31
18,
551
8,51
1Em
ploy
ed, '
00
07,
681
7,70
07,
831
7,94
88,
184
8,14
5U
nem
ploy
ed, '
00
035
334
838
336
336
736
6
Labo
ur F
orce
Par
ticip
atio
n Ra
te
53.7
53.2
53.8
53.8
54.3
54.5
(% o
f Hou
seho
ld P
opul
atio
n)U
nem
ploy
men
t Rat
e 4.
44.
34.
74.
44.
34.
3(%
of L
abou
r Fo
rce)
(a)
In J
uly
2016
, th
e D
epar
tmen
t of
Cen
sus
and
Stat
istic
s pu
blis
hed
a re
-wei
ghte
d an
d re
vise
d la
bour
for
ce d
ata
serie
s fo
r 20
11 o
nwar
dsSo
urce
s :D
epar
tmen
t of C
ensu
s an
d St
atis
tics
Cen
tral B
ank
of S
ri La
nka
(b)
Dat
a co
vers
ent
ire is
land
(c)
Prov
isio
nal

TABLE 11
Developments in External TradeUS dollars million
CATEGOrY 2013 2014 2015 2016 2016 Jan.-Aug.
2017 Jan.-Aug. (a)
Growth % Jan.-Aug.
EXPOrTSAgricultural Exports 2,581.1 2,793.9 2,481.5 2,326.1 1,520.6 1,815.0 19.4
Tea 1,542.2 1,628.3 1,340.5 1,269.0 835.0 1,002.7 20.1Rubber 71.3 45.3 26.1 32.7 20.9 28.7 37.4Coconut 204.6 356.4 351.7 366.0 238.3 240.1 0.7
Kernel Products 85.8 214.3 221.7 216.1 137.0 131.8 -3.9Other 118.9 142.1 130.0 149.9 101.3 108.3 7.0
Spices 355.4 264.6 377.4 317.1 194.1 248.7 28.1Vegetables 24.9 40.1 30.5 26.5 18.3 19.5 6.6Unmanufactured Tobacco 47.6 41.3 31.8 31.2 19.9 23.5 18.0Minor Agricultural Products 101.3 165.2 160.4 114.1 83.4 96.6 15.7Seafood 233.7 252.7 163.1 169.6 110.7 155.4 40.4
Industrial Exports 7,749.4 8,262.0 8,017.1 (b) 7,940.1 (b) 5,337.6 (b) 5,562.3 4.2Textiles and Garments 4,508.3 4,929.9 4,820.2 4,884.1 3,333.7 3,283.4 -1.5Rubber Products 887.8 889.8 761.2 767.9 508.4 538.1 5.8Petroleum Products 427.7 338.0 373.9 286.9 185.4 252.7 36.3Gems, Diamonds and Jewellery 445.5 393.6 331.7 273.9 187.3 166.7 -11.0Food, Beverages and Tobacco 235.2 289.3 306.8 (b) 323.7 (b) 222.4 (b) 259.1 16.5Machinery and Mechanical Appliances 312.3 342.9 293.8 317.6 200.2 242.1 20.9Printing Industry Products 36.3 52.4 45.7 42.4 17.7 28.0 58.3Transport Equipment 146.3 151.8 243.7 131.5 80.9 138.1 70.7Leather, Travel Goods and Footwear 76.8 138.9 135.7 165.6 115.7 107.0 -7.5Ceramic Products 40.4 41.3 35.2 34.4 22.8 22.1 -3.0Other Industrial Exports 632.7 694.1 669.4 712.2 463.1 525.0 13.4
Mineral Exports 51.6 59.5 28.4 29.0 19.7 24.5 24.6Unclassified Exports 12.2 14.7 19.5 14.5 10.2 11.3 10.1
Total Exports 10,394.3 11,130.1 10,546.5 (b) 10,309.7 (b) 6,888.1 (b) 7,413.1 7.6IMPOrTSConsumer Goods 3,182.5 3,852.5 4,713.5 4,319.0 2,824.9 2,952.1 4.5Food and Beverages 1,368.1 1,633.7 1,627.8 1,627.4 1,039.1 1,204.5 15.9
Rice 17.9 281.7 135.1 12.8 7.2 176.4 2,346.4Sugar 288.9 255.5 252.5 342.5 194.5 187.5 -3.6Dairy Products 291.0 339.4 250.9 249.3 157.1 202.9 29.2Lentils 104.1 121.2 148.0 139.4 86.8 81.8 -5.7Other 666.1 636.0 841.3 883.4 593.6 555.8 -6.4
Other Consumer Goods 1,814.4 2,218.8 3,085.7 2,691.5 1,785.8 1,747.6 -2.1Vehicles 582.2 896.7 1,359.6 794.8 547.1 505.0 -7.7Medical and Pharmaceuticals 378.3 380.5 459.8 525.8 354.2 334.9 -5.4Home Appliances 192.2 156.4 221.0 270.7 175.6 168.2 -4.2Clothing and Accessories 201.7 282.7 390.1 365.8 243.2 262.3 7.9Other 460.0 502.5 655.0 734.4 465.7 477.2 2.5
Intermediate Goods 10,553.7 11,397.7 9,638.2 9,870.0 6,309.0 7,271.7 15.3Fuel 4,308.2 4,597.3 2,699.6 2,481.0 1,500.8 2,152.8 43.4Textiles and Textile Articles 2,045.8 2,327.6 2,296.2 2,704.9 1,764.7 1,781.3 0.9Diamonds, Precious Stones and Metals 482.9 175.4 161.5 514.4 299.3 474.6 58.6Chemical Products 734.3 808.2 870.3 856.3 568.1 549.9 -3.2Wheat and Maize 323.2 404.7 357.2 249.2 164.5 225.2 36.9Fertiliser 238.7 272.4 289.6 136.9 99.2 64.0 -35.4Other Intermediate Goods 2,420.8 2,812.0 2,963.7 2,927.3 1,912.4 2,023.9 5.8
Investment Goods 4,252.7 4,152.2 4,567.0 5,198.0 3,259.6 3,237.7 -0.7Machinery and Equipment 2,221.9 2,131.0 2,278.1 2,740.7 1,815.4 1,738.3 -4.2Building Materials 1,357.2 1,308.9 1,352.0 1,568.7 1,025.7 1,054.8 2.8Transport Equipment 667.8 707.3 930.9 880.2 414.3 438.6 5.9Other Investment Goods 5.8 4.9 5.9 8.5 4.1 6.0 45.8
Unclassified Imports 13.9 14.4 15.9 13.1 9.4 137.5 1,358.3
Total Imports 18,002.8 19,416.8 18,934.6 19,400.1 12,402.9 13,599.1 9.6
(a) Provisional Sources : Sri Lanka Customs(b) Revised Ceylon Petroleum Corporation and Other Exporters of Petroleum
Lanka IOC PLCNational Gem and Jewellery AuthorityCentral Bank of Sri Lanka
153
STATISTICAL APPENDIX 2

TABLE 12
Balance of Payments (a) US dollars million
ITEM 2015 2016 (b)First Half
2016 (c) 2017 (b)Current Account Balance -1,883 -1,942 -644 -1,480
Trade Balance -8,388 -9,090 -4,191 -4,753Exports 10,546 10,310 5,130 5,398
Imports 18,935 19,400 9,321 10,151
Services (net) 2,325 2,879 1,314 1,407Receipts 6,397 7,138 3,493 3,646
Payments 4,072 4,259 2,179 2,239
Primary Income (net) -2,013 -2,184 -971 -1,038Receipts 127 120 59 73
Payments 2,140 2,304 1,030 1,111
Secondary Income (net) 6,193 6,453 3,204 2,904Secondary Income: credit 7,007 7,260 3,619 3,362
Secondary Income: debit 814 807 414 458
Capital Account (net) 46 26 1 8Capital Account: credit 71 46 21 23
Capital Account: debit 24 21 21 15
Current and Capital Account (net) -1,836 -1,917 -643 -1,473Financial Account (net) (d) -2,312 -2,117 -1,234 -1,295
Direct Investment: Assets 53 237 118 37Direct Investment: Liabilities 680 898 173 509Portfolio Investment: Assets 0.02 -0.01 -0.01 -
Debt Securities 0.02 -0.01 -0.01 -
Portfolio Investment: Liabilities 686 993 -623 1,036Equity and Investment Fund Shares -60 24 -45 201
Debt Securities 747 969 -578 835
Financial Derivatives - - - -Other Investment: Assets 503 317 -62 -250
Currency and Deposits 143 5 -134 -87
Trade Credit and Advances 116 -67 -56 38
Other Accounts Receivable 244 379 128 -201
Other Investment: Liabilities 1,857 308 -259 808Currency and Deposits 1,457 -609 -981 -607
Loans 759 753 740 1,314
Trade Credits and Advances -401 109 15 151
Other Accounts Payable 41 55 -34 -50
Special Drawing Rights - - - -
reserve Assets 354 -472 -2,000 1,270Net Errors and Omissions -476 -201 -591 177Overall Balance -1,489 -500 -1,186 1,563
(a) This presentation is a summery of the BPM6 format and conforms to the latest (sixth) edition of the 'Balance of Payments and International Investment Position' Manual (BPM6) of the Inetrnational Monetary Fund.
Source : Central Bank of Sri Lanka
(b) Provisional(c) Revised(d) Assets - Liabilities
154
CENTRAL BANK OF SRI LANKA ǀ RECENT ECONOMIC DEVELOPMENTS: HIGHLIGHTS OF 2017 AND PROSPECTS FOR 2018

TABLE 13
International Investment PositionUS dollars million
(End Period Position)
Item2016 (a) June 2017 (a)
Assets Liabilities Assets Liabilities
Direct Investment (b) 1,136 9,745 1,173 10,249Equity and Investment Fund Shares 1,131 6,943 1,166 7,221
Debt Instruments 5 2,802 7 3,027
Portfolio Investment 0.1 13,772 0.1 15,019Equity and Investment Fund Shares 1,507 1,726
Debt Securities (c) 0.1 12,265 0.1 13,293
Deposit-taking Corporations 0.1 2,190 0.1 1,691
General Government 9,903 11,424
Other Sectors 172 178
Other Investment 2,931 31,519 2,681 32,827
Currency and Deposits 706 2,442 619 1,835Central Bank - 403 - 2
Deposit-taking Corporations 706 2,039 619 1,832
Loans - 26,530 - 28,324Central Bank - 554 - 382
Deposit-taking Corporations - 4,562 - 5,464
General Government - 17,295 - 18,274
Other Sectors (d) - 4,119 - 4,205
Trade Credit and Advances 610 1,483 648 1,634Deposit-taking Corporations 93 - 101 -
Other Sectors (e) 517 1,483 547 1,634
Other Accounts receivable/Payable 1,615 533 1,414 483Central Bank (f) - 533 - 483
Deposit-taking Corporations 1,615 - 1,414 -
Special Drawing rights 532 550
reserve Assets 6,019 6,959Monetary Gold 830 890
Special Drawing Rights 2 0.3
Reserve Position in the IMF 64 67
Other Reserve Assets 5,122 6,002
Currency and Deposits 2,644 3,847
Debt Securities 2,478 2,155
Total Assets / Liabilities 10,086 55,036 10,813 58,094Net International Investment Position -44,949 -47,281
IIP- Maturity-wise BreakdownShort Term 6,299 8,853 7,180 9,264
Long Term 3,788 46,182 3,633 48,831
(a) Provisional Source : Central Bank of Sri Lanka(b) Include direct investment stock position of BOI, CSE and other private companies
(c) Foreign currency debt issuances are based on market values while domestic currency issuances are based on book values(d) Include loans outstanding position of project loans obtained by State Owned Business Enterprises and private sector companies(e) Include outstanding trade credit position of Ceylon Petroleum Corporation and other private sector companies(f) Outstanding position of ACU liabilities managed by the Central Bank
155
STATISTICAL APPENDIX 2

156
CENTRAL BANK OF SRI LANKA ǀ RECENT ECONOMIC DEVELOPMENTS: HIGHLIGHTS OF 2017 AND PROSPECTS FOR 2018
TABLE 14
Outstanding External Debt PositionUS dollars million
(End Period Position)
ITEM 2015 2016 (a) June 2017 (a)
General Government 24,681 27,197 29,697 Short Term 33 80 71
Debt Securities (Treasury Bills) (b) 33 80 71 Long Term 24,647 27,118 29,626
Debt Securities 8,501 9,823 11,352 Treasury Bonds (b) 1,811 1,440 1,087 SLDBs (c) 265 58 31 International Sovereign Bonds (d) 6,425 8,325 10,235
Loans 16,147 17,295 18,274 Central Bank 2,823 2,022 1,417
Short Term 483 536 485 Currency and Deposits 5 3 2 Other Accounts Payable (ACU Liabilities) 478 533 483
Long Term 2,340 1,486 932 Special Drawing Rights allocation 548 532 550 Currency and Deposits 1,100 400 - Loans (IMF-SBA and EFF Facility) 692 554 382
Deposit-taking Corporations 9,156 8,790 8,987 Short Term 5,762 5,247 5,347
Currency and Deposits (e) 1,946 2,039 1,832 Loans 3,816 3,209 3,514
Long Term 3,393 3,543 3,640 Debt Securities (d) 2,140 2,190 1,691 Loans 1,253 1,354 1,950
Other Sectors (f) 5,567 5,774 6,018 Short Term 1,375 1,483 1,634
Trade Credit and Advances (g) 1,375 1,483 1,634 Long Term 4,192 4,291 4,383
Debt Securities (d) 164 172 178 Loans 4,028 4,119 4,205
Private Sector Corporations 1,604 1,876 2,052 State Owned Business Enterprises and Public Corporations 2,423 2,242 2,153
Direct Investment: Intercompany Lending (h) 2,613 2,802 3,027 Gross External Debt Position 44,839 46,586 49,147
As a Percentage of GDPGross External Debt 55.7 57.3 60.2 Short Term Debt 9.5 9.0 9.2 Long Term Debt 46.2 48.3 51.0
(a) Provisional Source : Central Bank of Sri Lanka(b) Based on book value(c) Based on face value(d) Based on market prices(e) Include deposits of non-resident foreign currency holders(f) Include private sector and State Owned Business Enterprises(g) Include trade credits outstanding of Ceylon Petroleum Corporation and private sector companies(h) Include inter-company borrowings and shareholder advances on BOI registered companies

157
STATISTICAL APPENDIX 2
TABLE 15
Exchange rate Movements (rupees per Unit of Foreign Currency)
PErIOD
End Period rates
US Dollar Pound Sterling Euro Japanese
YenIndian rupee SDr (a)
2012 127.1608 205.4728 168.1257 1.4799 2.3262 195.3110
2013 130.7530 215.5790 180.4522 1.2459 2.1116 201.3550
2014 131.0486 204.0427 159.4206 1.0979 2.0675 189.8640
2015 144.0623 213.5724 157.3737 1.1960 2.1677 199.6310
2016 149.8000 184.0443 157.8742 1.2867 2.2056 201.3810
2016 January 143.9208 206.5911 157.3630 1.2135 2.1132 198.6820
February 144.3450 200.0313 157.8655 1.2735 2.0986 199.3980
March 143.9000 206.5685 162.9452 1.2810 2.1680 202.7290
April 143.9000 210.6984 163.8014 1.3407 2.1653 203.9540
May 145.7500 214.0922 162.4675 1.3121 2.1694 204.4700
June 145.2500 194.8747 161.4381 1.4142 2.1518 203.1820
July 145.7466 192.2398 161.5310 1.4009 2.1731 203.0800
August 145.6200 190.7768 162.3954 1.4143 2.1702 203.0440
September 146.7229 190.1676 164.5644 1.4536 2.1950 204.7980
October 147.1136 179.1991 161.2733 1.4027 2.2026 202.1120
November 147.9500 184.6342 157.5520 1.3176 2.1559 200.2890
December 149.8000 184.0443 157.8742 1.2867 2.2056 201.3810
2017 January 150.2429 187.9614 160.7299 1.3231 2.2158 204.1550
February 151.2500 188.0264 160.0906 1.3435 2.2676 204.7760
March 151.7354 189.5327 162.0306 1.3538 2.3394 205.8820
April 151.9000 196.0953 165.1305 1.3665 2.3692 208.2590
May 152.5000 195.5508 170.4264 1.3729 2.3598 211.1090
June 153.5100 199.9314 175.6154 1.3728 2.3741 213.5920
July 153.7278 201.9061 180.4764 1.3918 2.3977 216.4100
August 152.8350 197.3788 181.5145 1.3833 2.3884 216.0150
September 153.0983 205.3890 180.3651 1.3594 2.3384 216.3730
(a) Special Drawing Rights (SDRs), the unit of account of the International Monetary Fund Source : Central Bank of Sri Lanka

158
CENTRAL BANK OF SRI LANKA ǀ RECENT ECONOMIC DEVELOPMENTS: HIGHLIGHTS OF 2017 AND PROSPECTS FOR 2018
TABLE 16
Government Fiscal Operations
ITEM 2013 2014 2015 2016 (a)2016
Jan.-Aug.(a)
2017 Jan.-Aug.
(a)
2017 Estimates
rs. millionTotal revenue and Grants 1,153,306 1,204,621 1,460,892 1,693,558 1,014,088 1,174,639 2,020,300
Total Revenue 1,137,447 1,195,206 1,454,878 1,686,062 1,013,395 1,172,374 2,010,300Tax Revenue 1,005,895 1,050,362 1,355,779 1,463,689 931,980 1,094,948 1,827,000Non Tax Revenue 131,552 144,844 99,099 222,374 81,415 77,426 183,300
Grants 15,859 9,415 6,014 7,496 693 2,265 10,000
Expenditure and Net Lending 1,669,396 1,795,865 2,290,394 2,333,883 1,499,138 1,694,859 2,645,300Recurrent 1,205,180 1,322,898 1,701,658 1,757,782 1,159,488 1,294,354 1,946,000Capital and Net Lending 464,216 472,967 588,737 576,101 339,650 400,505 699,300
o/w Public Investment 481,203 486,610 602,767 594,013 348,795 404,859 708,300
Current Account Surplus (+)/Deficit (-) -67,733 -127,692 -246,779 -71,719 -146,093 -121,980 64,300Primary Account Surplus (+)/Deficit (-) -72,083 -154,849 -319,827 -29,430 -70,465 -1,590 55,087Overall Fiscal Surplus (+)/Deficit (-) -516,090 -591,244 -829,502 -640,325 -485,050 -520,220 -625,000Total Financing 516,090 591,244 829,502 640,325 485,050 520,220 625,000Foreign Financing 123,700 212,523 236,803 391,914 175,560 246,731 332,000
Loans 67,905 14,562 131,253 109,293 37,633 15,112 52,000Commercial Loans - 197,171 232,751 319,689 136,828 224,604 220,000Non Resident Investments in Treasury
Bills/ Bonds55,795 790 -127,201 -37,069 1,099 7,015 60,000
Domestic Financing 392,390 378,721 592,699 248,411 309,490 273,489 293,000Market Borrowings 379,390 392,084 592,699 248,411 309,490 273,489 293,000
Non Bank 82,414 265,155 300,858 108,456 171,384 37,034 261,000Bank 296,977 126,929 291,841 139,955 138,106 236,456 32,000
Other Borrowings 13,000 -13,363 - - - - -
As a per cent of GDPTotal revenue and Grants 12.0 11.6 13.3 14.3 8.2 9.0 15.0Total Revenue 11.9 11.5 13.3 14.2 8.2 9.0 14.9
Tax Revenue 10.5 10.1 12.4 12.4 7.6 8.4 13.5Non Tax Revenue 1.4 1.4 0.9 1.9 0.7 0.6 1.4
Grants 0.2 0.1 0.1 0.1 … … 0.1
Expenditure and Net Lending 17.4 17.3 20.9 19.7 12.2 13.0 19.6Recurrent 12.6 12.8 15.5 14.8 9.4 10.0 14.4Capital and Net Lending 4.8 4.6 5.4 4.9 2.8 3.1 5.2
o/w Public Investment 5.0 4.7 5.5 5.0 2.8 3.1 5.2
Current Account Surplus (+)/Deficit (-) -0.7 -1.2 -2.3 -0.6 -1.2 -0.9 0.5Primary Account Surplus (+)/Deficit (-) -0.8 -1.5 -2.9 -0.2 -0.6 … 0.4Overall Fiscal Surplus (+)/Deficit (-) -5.4 -5.7 -7.6 -5.4 -3.9 -4.0 -4.6Total Financing 5.4 5.7 7.6 5.4 3.9 4.0 4.6
Foreign Financing 1.3 2.1 2.2 3.3 1.4 1.9 2.5Loans 0.7 0.1 1.2 0.9 0.3 0.1 0.4Commercial Loans - 1.9 2.1 2.7 1.1 1.7 1.6Non Resident Investments in Treasury
Bills/ Bonds0.6 … -1.2 -0.3 … 0.1 0.4
Domestic Financing 4.1 3.7 5.4 2.1 2.5 2.1 2.2Market Borrowings 4.0 3.8 5.4 2.1 2.5 2.1 2.2
Non Bank 0.9 2.6 2.7 0.9 1.4 0.3 1.9Bank 3.1 1.2 2.7 1.2 1.1 1.8 0.2
Other Borrowings 0.1 -0.1 - - - - -
(a) Provisional Source : Ministry of Finance and Mass Media

159
STATISTICAL APPENDIX 2
TABLE 17
Developments in Monetary Aggregates and Underlying FactorsRs. million (End Period)
ITEM 2013 2014 2015 2016 August 2017 (a)
1. reserve Money 488,586 577,912 673,432 856,147 911,389(year-on-year change in per cent) 0.9 18.3 16.5 27.1 16.0
Net Foreign Assets of the Central Bank 529,128 688,007 576,187 558,589 745,768Net Domestic Assets of the Central Bank -40,543 -110,095 97,245 297,557 165,621
2. Narrow Money (M1) 484,578 612,155 714,988 776,624 759,137(year-on-year change in per cent) 7.7 26.3 16.8 8.6 6.3
3. Broad Money (M2b) 3,417,853 3,875,853 4,565,917 5,405,596 6,050,583(year-on-year change in per cent) 16.7 13.4 17.8 18.4 21.3
3.1 Net Foreign Assets -76,325 15,126 -298,163 -231,238 -50,097Monetary Authorities 529,128 688,007 576,187 558,589 745,768Commercial Banks -605,453 -672,881 -874,350 -789,827 -795,865
3.2 Net Domestic Assets 3,494,178 3,860,727 4,864,081 5,636,834 6,100,680Domestic Credit 4,200,783 4,640,146 5,732,034 6,671,677 7,349,510
Net Credit to the Government 1,301,342 1,435,900 1,759,492 1,972,133 2,237,515Central Bank 114,007 149,672 229,926 413,016 293,545Commercial Banks 1,187,335 1,286,228 1,529,566 1,559,116 1,943,970
Credit to Public Corporations 365,098 446,047 522,966 495,114 502,943(year-on-year change in per cent) 24.8 22.2 17.2 -5.3 13.9
Credit to the Private Sector 2,534,343 2,758,199 3,449,577 4,204,430 4,609,052(year-on-year change in per cent) 7.5 8.8 25.1 21.9 18.0
Other Items (net) -706,605 -779,418 -867,954 -1,034,843 -1,248,830
Memorandum Items:
Money Multiplier (M2b) 7.00 6.71 6.78 6.31 6.64
Velocity (M2b average) (b) 2.99 2.85 (c) 2.62(c) 2.40(c) n.a.
(a) Provisional Source : Central Bank of Sri Lanka(b) Based on GDP estimates by the Department of Census and Statistics
(c) Revised

TABLE 18
Commercial Banks' Loans and Advances to the Private Sector (a)(b)(c)
CATEGOrYEnd June 2016 (d) End June 2017 (e)
% ChangeAmount
(rs. mn)As a % of
TotalAmount(rs. mn)
As a % ofTotal
1. Agriculture and Fishing 316,993 8.3 382,033 8.4 20.5 of which…
Tea 78,051 2.0 84,610 1.9 8.4Rubber 20,411 0.5 25,265 0.6 23.8Coconut 12,541 0.3 19,567 0.4 56.0Paddy 23,456 0.6 32,323 0.7 37.8Vegetable and Fruit Cultivation and Minor Food Crops 22,000 0.6 27,200 0.6 23.6Livestock and Dairy Farming 13,061 0.3 17,644 0.4 35.1Fisheries 12,254 0.3 16,767 0.4 36.8
2. Industry 1,539,581 40.2 1,863,992 41.0 21.1 of which…
Construction 740,963 19.3 902,762 19.8 21.8of which…
Personal Housing including Purchasing/Construction/Repairs 354,255 9.2 435,454 9.6 22.9Staff Housing 66,261 1.7 70,991 1.6 7.1
Food and Beverages 86,472 2.3 103,627 2.3 19.8Textiles and Apparel 144,718 3.8 156,759 3.4 8.3Wood and Wood Products including Furniture 14,692 0.4 15,651 0.3 6.5Paper and Paper Products 11,758 0.3 14,493 0.3 23.3Chemical, Petroleum, Pharmaceutical and Healthcare, and Rubber and
Plastic Products 77,939 2.0 82,758 1.8 6.2
Non-metallic Mineral Products 14,961 0.4 17,944 0.4 19.9Basic Metal Products 20,702 0.5 28,182 0.6 36.1Fabricated Metal Products, Machinery and Transport Equipment 126,529 3.3 158,490 3.5 25.3Other Manufactured Products 16,179 0.4 20,477 0.5 26.6
3. Services 1,149,743 30.0 1,331,024 29.3 15.8 of which…
Wholesale and Retail Trade 353,623 9.2 399,951 8.8 13.1Tourism 118,778 3.1 160,429 3.5 35.1Financial and Business Services 282,150 7.4 306,580 6.7 8.7Transport 56,731 1.5 72,458 1.6 27.7Communication and Information Technology 56,808 1.5 61,177 1.3 7.7Printing and Publishing 16,841 0.4 21,677 0.5 28.7Education 8,881 0.2 10,321 0.2 16.2Health 29,034 0.8 31,916 0.7 9.9Shipping, Aviation and Freight Forwarding 26,065 0.7 22,708 0.5 -12.9
4. Personal Loans and Advances (f) 824,209 21.5 972,084 21.4 17.9 of which…
Consumer Durables 171,955 4.5 207,018 4.6 20.4Pawning 122,309 3.2 137,517 3.0 12.4Credit Cards 66,912 1.7 82,003 1.8 22.6Personal Education 2,078 0.1 2,415 0.1 16.3Personal Healthcare 2,728 0.1 3,848 0.1 41.1Other 416,501 10.9 502,607 11.0 20.7
5. Total 3,830,526 100.0 4,549,133 100.0 18.8(a) Based on the Quarterly Survey of Commercial Banks' Loans and Advances to the Private Sector, which includes loans and advances of
both DBUs and OBUs of commercial banks. Source : Central Bank of Sri Lanka
(b) Includes loans, overdrafts, bills discounted and purchased and excludes cash items in the process of collection(c) Total values in this Table differ from credit to the private sector values in Table 17 due to differences in the compilation methodologies.(d) Revised(e) Provisional
(f) Excludes personal housing loans, which have been included under ‘Construction’ classified under ‘Industry’ and includes Safety Net Scheme related loans.
160
CENTRAL BANK OF SRI LANKA ǀ RECENT ECONOMIC DEVELOPMENTS: HIGHLIGHTS OF 2017 AND PROSPECTS FOR 2018

161
STATISTICAL APPENDIX 2
TABLE 19
Selected Interest ratesPer cent per annum
END PErIOD rATE 2013 2014 2015 2016 2017 September
1. Standing Deposit Facility Rate (SDFR) (a) 6.50 6.50 6.00 7.00 7.252. Standing Lending Facility Rate (SLFR) (a) 8.50 8.00 7.50 8.50 8.753. Bank Rate (b) 15.00 15.00 15.00 15.00 15.004. Average Weighted Prime Lending Rate (AWPR) - Weekly 10.13 6.26 7.53 11.52 11.555. Average Weighted Deposit Rate (AWDR ) 9.37 6.20 6.20 8.17 9.256. Average Weighted Call Money Rate (AWCMR) 7.66 6.21 6.40 8.42 8.117. Treasury Bill Yields (c)
91-day 7.54 5.74 6.45 8.72 8.71 364-day 8.29 6.01 7.30 10.17 9.10
8. Treasury Bond Yields (c) 2-year - - 6.70 11.04 9.83 3-year 10.87 - 8.18 11.62 - 4-year - - 8.91 11.94 11.14 5-year 10.64 8.93 9.79 11.76 10.09 6-year 10.97 - 9.90 12.03 11.21
9. Rates on Foreign Currency Deposits Savings Deposits - US Dollar 0.02-2.68 0.01-3.25 0.02-3.00 0.02 - 3.62 0.02-4.23 Fixed Deposits - US Dollar (1 year) 0.15-5.00 0.06-4.25 0.14-4.25 0.15 - 5.00 0.15-6.15
10. National Savings Bank Savings Deposits 5.00 5.00 5.00 4.25 4.00 Fixed Deposits (1 year) 9.50 6.50 7.25 11.00 11.00
(a) Repurchase rate and Reverse Repurchase rate were renamed as Standing Deposit Facility Rate (SDFR) and Standing LendingFacility Rate (SLFR) respectively, with effect from 02 January 2014.
Sources : Central Bank of Sri LankaLicensed Commercial Bank
(b) Bank Rate: Central Bank rate on advances to commercial banks. National Savings Bank(c) Weighted average yield rates at the latest available auction.

162
CENTRAL BANK OF SRI LANKA ǀ RECENT ECONOMIC DEVELOPMENTS: HIGHLIGHTS OF 2017 AND PROSPECTS FOR 2018
TABLE 21
Money and Capital Market DevelopmentsRs. million
CATEGOrY 2013 2014 2015 2016 2017 (a) Jan.-Sep.
Money Market Call Money Market
Total Turnover 2,079,206 2,198,356 2,827,930 3,493,392 2,709,772 Treasury Bill Market
Total Amount Issued (b) 1,235,304 1,121,705 1,589,527 1,635,349 1,286,604Total Outstanding (b) (c) 774,052 750,267 663,285 792,396 782,039
Capital Market Treasury Bond Market
Total Amount Issued (b) 1,017,134 860,695 869,923 663,616 476,315Total Outstanding (b) (c) 2,951,809 3,341,727 3,699,945 4,053,575 4,114,967
Listed Corporate Bond MarketTotal Amount Issued 68,262 51,235 83,414 77,995 10,000Total Issues (Number) 28 20 25 17 2Total Turnover 2,229 7,140 4,714 2,932 2,937Market Value of Listed Corporate Debt 100,838 160,924 232,458 289,324 283,006
Share Market ASPI (1985 = 100) (c) 5,913 7,299 6,895 6,228 6,438 S&P SL 20 (2004=1,000) (c) 3,264 4,089 3,626 3,496 3,688 Total Turnover 200,468 340,917 253,251 176,935 165,574 Net Foreign Purchase 22,783 21,217 -5,372 338 17,185 Market Capitalisation (c) 2,459,897 3,104,860 2,938,000 2,745,410 2,919,698
(a) Provisional Sources : Central Bank of Sri Lanka
(b) Face Value Colombo Stock Exchange
(c) End Period
TABLE 20
Expansion of Banking Activities (a)
CATEGOrY 2013 2014 2015 2016 (b) 2017 (b) Jan.-Jun.
1. Number of Banks 33 34 32 32 32
2. Number of Bank Branches Excluding Students Savings Units (c) 3,306 3,377 3,452 3,524 3,543
3. Number of Automated Teller Machines (ATMs) 3,122 3,344 3,569 3,871 4,035
4. Number of Credit Cards Issued (d) 166,181 176,750 198,843 264,058 130,953
5. Number of Credit Cards in Use 951,625 1,032,833 1,145,055 1,315,915 1,392,931
6. Number of Debit Cards Issued (d) 2,324,579 2,872,673 2,798,873 3,025,664 1,734,352
7. Number of Debit Cards in Use 12,441,743 13,591,317 15,243,811 17,732,516 18,167,593
8. Number of Phone Banking Transactions (d) 300,094 731,773 1,992,826 3,444,065 1,871,613
9. Number of Internet Based Transactions (d) 8,942,384 10,817,849 13,725,195 18,163,636 10,734,964
10. Banking Density (e) 16.1 16.3 16.5 16.6 n.a.
(a) End Period Source : Central Bank of Sri Lanka
(b) Provisional
(c) Revised
(d) During the period
(e) Number of branches per 100,000 people


