“recent activities at kathmandu university
TRANSCRIPT

1Kathmandu University [email protected]
“Recent Activities at Kathmandu University
for Minimizing Sediment Erosion in
Hydraulic Turbines”
Biraj Singh Thapa, PhD
Faculty In-Charge, Turbine Testing Lab
Asst. Professor, Department of Mechanical Engineering
Kathmandu University, Nepal
01, June 2018

2Kathmandu University [email protected]
Area: 147,181 km²
Population: 29 Million;
Growth rate: 1.24%;
Infant mortality rate: 28.9 /1,000
Life expectancy: 70 yrs. (60 yrs. in 2001)
Languages: 123 as mother tongue
Religions: 10 Major. Hindu 81%;
Buddhist 9%
Literacy rate: 63.9%
GDP per Capita: USD 730
(China: USD 8,123 )
Electricity consptn. per capita: 140 kWh
(China 4,000 kWh)
Nepal: Some Facts

3Kathmandu University [email protected]
The Water Tower of Asia
3
RiverLength
(km)
Fall
(m)
Avg flow
(m3/s)
Gross
(GW)Built%
Yellow 5464 4800 2571 28 6.1
Yangtze 6300 5042 30166 197.24 53.4
Mekong 4350 5224 16000 53
Salween 2815 5350 4978
Irrawaddy 2170 147 13000 25.3 15
Brahmaputra 2900 5210 19300 206
http://www.21stcentech.com/climate-change-impact-major-rivers-asia/
Glaciers are twenty times of the European Alps
Feeds 1.5 billion people in nine countries.
Koshi 720 3500 2166 22.35 <0.5
Gandaki 630 6268 1760 20.65 <0.5
Karnali 1080 3962 2990 36.18 <0.5
Ganges 2525 3892 16648 13 14.2
Sutlej 1500 4575 500
Indus 2900 4255 6600
Wikipedia, 2016
www.meltdownintibet.com

4Kathmandu University [email protected]
Hydropower Development Trends
1911, Nepal
Pharping Hydro Power Project
2*250 kW
2017: 0.8 GW (1.7% of TF)
1912, China
Shilongba Hydroelectric Power Station
2*240 kW
2017: 331 GW (40% of TF)
2002, Nepal
Kaligandaki A Hydroelectric Power Station
144 MW
2003, China
Three Gorges Dam Power Station
22,500 MW
Nepal lacks the experience for building a larger scale hydropower plants

5Kathmandu University [email protected]
Status of Hydropower Development in Nepal
Ref: Department of Electricity Development, Government of Nepal, 2017
Hydropower Development Opportunities
Some major hydropower projects that are in
advanced stage of development in Nepal
S.N. ProjectsCapacity
(MW)
1 Budhi Gandaki Hydropower Project 1,200
2 Upper Karnali Hydropower Project 900
3 Arun III Hydropower Project 900
4 Tamakoshi III 650
5 Upper Marsyangdi II 600
6 West Seti 750
7 Nalsingad Hydropower Project 410
8 Dudhkoshi Hydropower Project 300
9 Upper Trishuli 1 Hydropower Project 216
Total 5,926
Nepal need to generate hydropower development professionals and technicians
S.N.Summary status of
hydropower development
No. of
projects
Capacity
(MW)
1 Completed projects 80 937.31
2 Projects under construction 57 4935
3Issued construction
licenses for generation
148 4322.59
4 Issued survey licenses 289 13397.85
5Application received for
survey licenses
23 2084.16
Total (2-5) 24,739.56

6Kathmandu University [email protected]
Sediment erosion in Hydro turbines
23 MW*2 Francis runner at Chawa Powerplant, Chile
Ref: O.G. Dahlhaug
Runner inlet
Ref: Bhilaganga III HEP, 2016
8MW*3 Bhilaganga III HEP,
India
Guide vane
Ref: O.G. Dahlhaug
4 MW*3 Francis runner at
Jhimruk Hydroelectric
Center, Nepal
Runner outlet
Runner inletRunner outlet
Ref: Wikipedia
Ref: O.G. Dahlhaug
2.5 MW*2 Pelton runner
at Adhi Khola Hydropower
Plant, Nepal
Erosion in Pumps in Yello
River, China Ref: Qian

7Kathmandu University [email protected]
Kathmandu University (KU)
KU Vision Statement:
To become a world class university devoted to bringing knowledge and
technology to the service of mankind
Facts:
• Established July 1991
• Autonomous and self-sustainable public institution
• 7 Faculties: School of Engineering, Science, Management, Medical Sciences,
Education, Arts and School of Law.
• 4,000 students in constituent campuses 7,500 students are in affiliated colleges

8Kathmandu University [email protected]
KU’s Focus in Renewable Energy
Target Areas for R&D:➢ Hydropower
➢ Renewable Energy Technology (Solar, Biomass, Biogas)
Means:Platform Resources:
➢ Specialized Laboratories • Turbine Testing Lab
• High Voltage Lab
• Stove Testing Lab
• Geo Energy Testing Lab
➢ Center of Excellence • Aquatic Ecology Center
• Center for hydro turbine studies
➢ Training Centers • Technical Training Center
➢ Business Incubation Center
Academic Programs:
➢ Civil Engineering: Specialized in Hydropower
➢ Mechanical Engineering: Specialized in Hydropower
➢ Masters and Masters by Research in Civil,
Electrical, Mechanical and Environmental
Engineering
➢ PhD level Research in in Civil, Electrical,
Mechanical and Environmental Engineering

9Kathmandu University [email protected]
Early R&D of Hydro Turbines at KU
• R&D activities in several miniature turbine laboratories 2002-2005
a) Demo Francis turbine designed by student team
b) Flow visualization in Pelton bucket at miniature laboratory
c) 800 W Propeller Turbine designed and tested at Pico turbine
test laboratory
a b c

10Kathmandu University [email protected]
Erosion measurement test rig at KU
waterpower lab
Erosion Test Conditions
50 m/s 45o
Water jet
R&D at KU Against Sediment Erosion (2002-2005)


12Kathmandu University [email protected]
R&D at KU Against Sediment Erosion (2005-2008)
RDA Cavitation and Erosion study Erosion test of HVOF coating Erosion patter generated by sand erosion
a. Raw image of sand
particles
b. Cropped image
of single sand
c. Edge boundary of
single sand
d. Shape and size distribution
of sediment particles
a. c.b. d.

13Kathmandu University [email protected]
Design Optimization of Francis Turbine (2010-2012)
Numerical study of design optimization
Design 1 Design 2 Reference

14Kathmandu University [email protected]
Laboratory Experiments on Erosion Testing
• RDA at KU was used to quantify the
erosion rates in model blades
• Both reference and optimized designs of
Francis runner were tested
Rotating Disc Apparatus

15Kathmandu University [email protected]
Turbine Testing Lab at KU (2011)
Specifications:
• 30 m Open System Head
• 150 m Closed System Head
• 500 l/s Maximum Flow
• 300 kW Maximum Testing Capacity
• 300 m3 Lower Reservoir
• 100 m3 Upper Reservoir
• 5000 kg EOT Crane Capacity
Inaugurated on 10 November 2011 by
then Norwegian Ambassador to Nepal
Total USD 1.3 Million
www.ku.edu.np/ttl

16Kathmandu University [email protected]
Development of sediment erosion resistant Francis turbine
Stay ring with stay vane Spiral Casing Sections
Casted Runner Blades
Guide vanes
Assembly of the runner blades
Turbine in test rig at TTL
TTL: A Milestone for Design of Francis Turbine
Complete runner
CAD Model
Hydraulic Design and Optimization

17Kathmandu University [email protected]
Effects of sediment erosion in guide vanes of Francis turbine

18Kathmandu University [email protected]
Francis turbine
Operational range of Francis turbine
Spiral Casing
Draft Tube Cone
Governing Ring
Guide Vanes
Stay Vanes
Runner
Labyrinth
seals
Stay Ring
Lower Cover
Upper Cover
Tu
rbin
e S
ha
ft
Svartisen Power Plant, Norway
Francis turbine Components
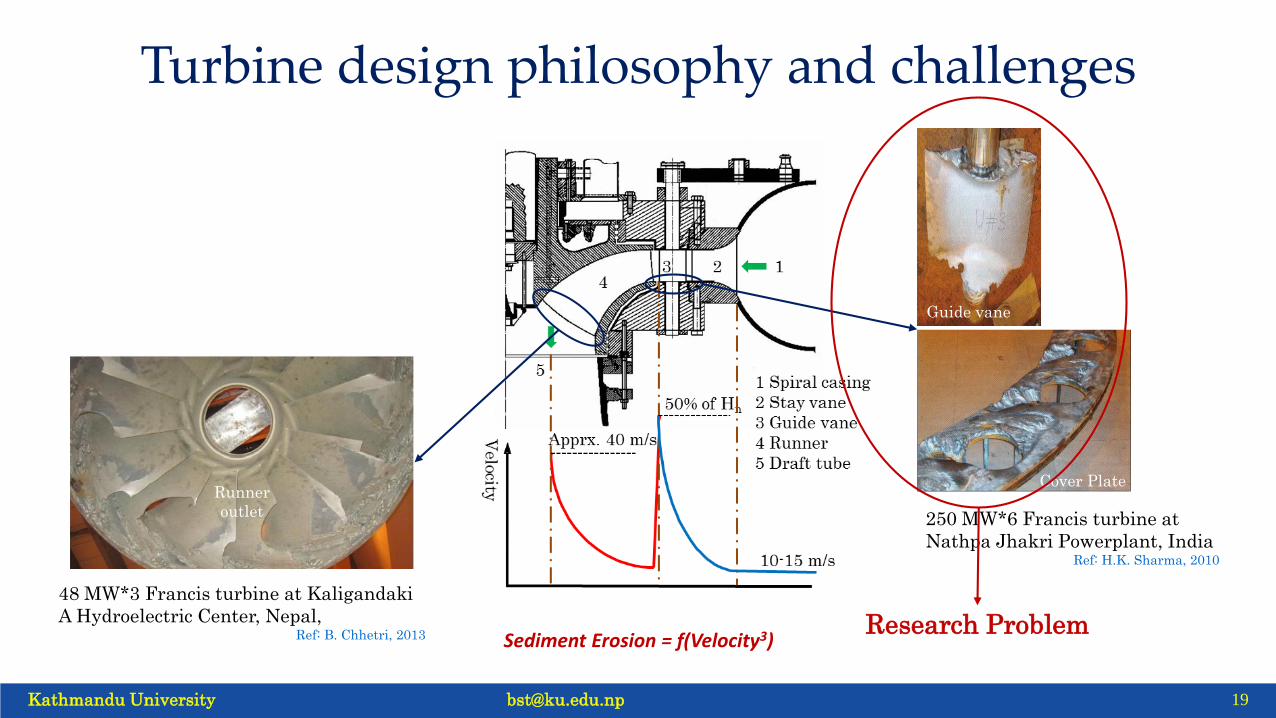
19Kathmandu University [email protected]
Guide vane
250 MW*6 Francis turbine at
Nathpa Jhakri Powerplant, IndiaRef: H.K. Sharma, 2010
Cover Plate
48 MW*3 Francis turbine at Kaligandaki
A Hydroelectric Center, Nepal, Ref: B. Chhetri, 2013
Runner
outlet
Turbine design philosophy and challenges
Research ProblemSediment Erosion = f(Velocity3)

20Kathmandu University [email protected]
Erosion of GV trailing edge
A
C
B
D
Flow
Ref: R. Koirala, B. Thapa, H. P. Neopane, B. Zhu, and B. Chhetry, "Sediment erosion in guide vanes of Francis turbine:
A case study of Kaligandaki Hydropower Plant, Nepal," Wear, vol. 362–363, pp. 53-60, 2016.
Formation of GV clearance gap Measurement locations
Clearance gap in GV trailing edgeClearance gap in GV leading edge
545
mm
Problem status

21Kathmandu University [email protected]
Dry clearance gap from design
Flow with sediments causes erosion
Increases the size of the gap
Leakage flow due to pressure difference Disturbances in the
main flow
Reduction in efficiency
Increase in erosion
Research hypothesis
22Kathmandu University [email protected]
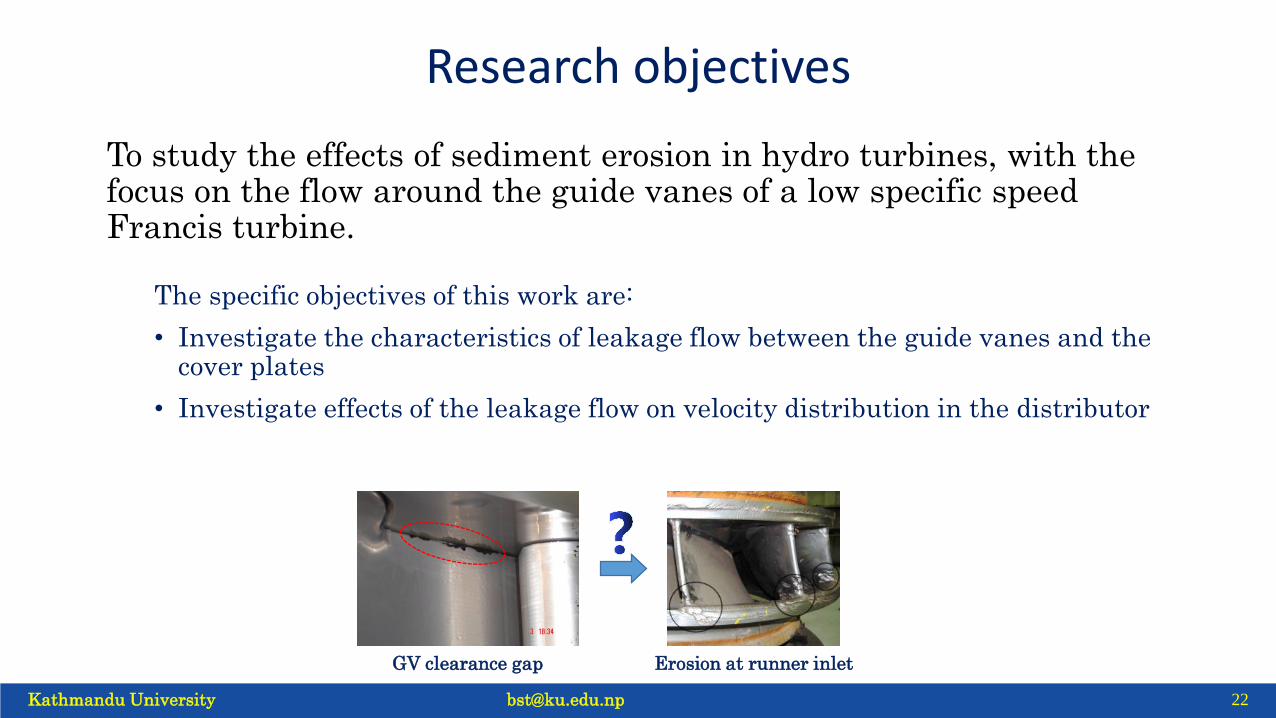
To study the effects of sediment erosion in hydro turbines, with the focus on the flow around the guide vanes of a low specific speed Francis turbine.
The specific objectives of this work are:
• Investigate the characteristics of leakage flow between the guide vanes and the cover plates
• Investigate effects of the leakage flow on velocity distribution in the distributor
GV clearance gap Erosion at runner inlet
Research objectives


24Kathmandu University [email protected]
Control parameters for design optimization
Parameters Symbol Unit Value
Tangential velocity at runner inlet Cu-Rin m/s 40.72
Radial velocity at runner inlet Cm-Rin m/s 9.7
Velocity Components in Francis turbine
Design & optimization of cascade
Design optimization of flow cascade

25Kathmandu University [email protected]
Average discharge = 0.155 m3/s (±0.15%)
Velocity at runner inlet (Vref) = 33.23 m/s
Lowest pressure inside test section = 213.8 kPa
The test setup
The Waterpower Laboratory
Norwegian University of Science and Technology
Trondheim, Norway

26Kathmandu University [email protected]
11 pressure taps along
mid span of TGV
Pressure measurements at TGV mid-span
14 pressure taps at wall along TGV
pressure and suction surfaces
Pressure tap at
runner inlet position
Test section cover plate
Pressure measurements at TGV wall
Sampling rate = 5 Hz
Min. number of samples = 1000
Maximum uncertainty = ±0.05%
Pressure measurements

27Kathmandu University [email protected]
PIV measurement section and positons
Trigger rate = 4 Hz
Time delay (dt) = 75 μs
Spatial resolution = 4.7 mm
Min. number of image pairs= 100
PIV Measurement span relative to runner blade
Clearance gap size= 0, 0.5, 1.5, 2, 3 mm
GV profile design= NACA 0012
Velocity measurements

28Kathmandu University [email protected]
Unprocessed PIV image of flow field Distribution of bad vectors in flow field
PIV approach

29Kathmandu University [email protected]
PIV Convergence tests
……. C-RinRef
PIV measurement repetition tests
PIV approach


32Kathmandu University [email protected]
Velocity vectors along GV mid-span Velocity vectors along CG 2 mm
Effects of clearance gap on flow field

33Kathmandu University [email protected]
Pressure along GV surface
Pressure difference between GV surfacesTorque on GV shaft
Velocity vectors along CG-2 mmIntensities of crosswise velocity from CG
Crosswise leakage flow from CG
Pressure distributions and effects

34Kathmandu University [email protected]
Flow conditions at runner inlet for CG 2 mm
𝑹𝒆𝒍𝒂𝒕𝒊𝒗𝒆 (𝒓𝒆) =𝒇𝒍𝒐𝒘 𝒑𝒂𝒓𝒂𝒎𝒆𝒕𝒆𝒓 𝒘𝒊𝒕𝒉 𝑪𝑮
𝒇𝒍𝒐𝒘 𝒑𝒂𝒓𝒂𝒎𝒆𝒕𝒆𝒓 𝒘𝒊𝒕𝒉𝒐𝒖𝒕 𝑪𝑮
Effects on ‘Cu’ Effects on ‘Cm’ Effects on ‘W’
Effects on ‘β’

35Kathmandu University [email protected]
Vorticity due to leakage flow from CG 2 mm
measured at 4 mm away from walls
Vortex filament
Guide vane
Flow channel
Observation of vortex filament from CG 2 mm
Study of vorticity

36Kathmandu University [email protected]
Vortex flow from CG 2 mm
GV
Vortex observed
in the cascade
Clearance gap
Runner blade
Study of vorticity

37Kathmandu University [email protected]
Symmetric NACA profile for guide vanes
High pressure difference towards trailing edge
Erosion in trailing edge and secondary flows
Increase in clearance gap, inducing strong crossflow
Higher relative velocity and lower tangential velocity
Higher erosion and lowered runner efficiency
Explanation of observations

38Kathmandu University [email protected]
NACA 2412 at 0.5mm NACA 4412 at 0.5mm NACA 0012 at 0.5mm
Velocity (m/s), PIV
a) b) c)
At designed condition, the vortex from leakage flow in NACA4412 is straight
downstream of the trailing edge, which inferred no cross flow through the gap.
Alternative design of GV

39Kathmandu University [email protected]
Vortices, CFD
At -5 deg
At 5 deg
At 0 deg
Upgrading to 3 GV rig
To enable testing in different
opening angles
To make the velocity field
more periodic – more similar
to real turbines
NACA0012 NACA0012 NACA4412NACA4412
NACA0012 NACA4412
Development of three GV cascade

40Kathmandu University [email protected]
• Francis turbines designed with standard methods are not
suitable for sediment-laden projects
• Design of guide vane can play important role to minimize
sediment erosion in turbine components
• Guide vane clearance gap should never reach to critical size
• Choice of guide vane axis location should be carefully done in
sediment- laden projects
• More studies are necessary to make future market sustainable
Recommendations

41Kathmandu University [email protected]
Thankyou for your kind attention
References to the original work:
1. B.S. Thapa, O.G. Dahlhaug, B. Thapa, “Flow measurements around guide vanes of Francis turbine: A PIV
approach”, Renewable Energy (2018), vol. 126, 177-188.
2. B.S. Thapa, O.G. Dahlhaug, B. Thapa, “Effects of sediment erosion in guide vanes of Francis turbine”, Wear
(2017), vol 390–391, 104-112.
3. B.S. Thapa, O.G. Dahlhaug, B. Thapa, “Sediment erosion induced leakage flow from guide vane clearance gap in
a low specific speed Francis turbine”, Renewable Energy (2017), vol. 107, 253-261.
4. B.S. Thapa, C. Trivedi, and O. G. Dahlhaug, “Design and development of guide vane cascade for a low speed
number Francis turbine,” J. Hydrodynamics, Ser. B (2016), vol. 28, 840-847.
5. B.S. Thapa, O.G. Dahlhaug, B. Thapa, “Sediment erosion in hydro turbines and its effect on the flow around
guide vanes of Francis turbine” Renewable and Sustainable Energy Reviews (2015), vol. 49, 1100-1113.
6. B.S. Thapa, B. Thapa, O.G. Dahlhaug, “Current research in hydraulic turbines for handling sediments”, Energy
(2012), Vol. 47, vol. 1, 62–69.
7. B.S. Thapa, B. Thapa, O.G. Dahlhaug, “Empirical modelling of sediment erosion in Francis turbines, Energy
(2012), Vol. 41, vol. 1, 386-391.