received: government of puerto rico public service … · 2021. 1. 27. · case no.:...
TRANSCRIPT
0110
GOVERNMENT OF PUERTO RICO PUBLIC SERVICE REGULATORY BOARD
PUERTO RICO ENERGY BUREAU IN RE: THE PERFORMANCE OF THE PUERTO RICO ELECTRIC POWER AUTHORITY
CASE NO.: NEPR-MI-2019-0007 SUBJECT: Supplemental Information to Performance Metrics Reporting Requirements
MOTION TO SUBMIT SUPPLEMENTAL INFORMATION DISCUSSED DURING TECHNICAL CONFERENCE
TO THE HONORABLE PUERTO RICO ENERGY BUREAU
COMES NOW the Puerto Rico Electric Power Authority through the undersigned legal
representation and respectfully sets forth and prays as follows:
1. On January 19, 2021, Energy Bureau of the Puerto Rico Service Regulatory Board (the
“Energy Bureau”) held a Technical Conference to discuss the Puerto Rico Power Authority’s
(PREPA) Performance Metrics.1
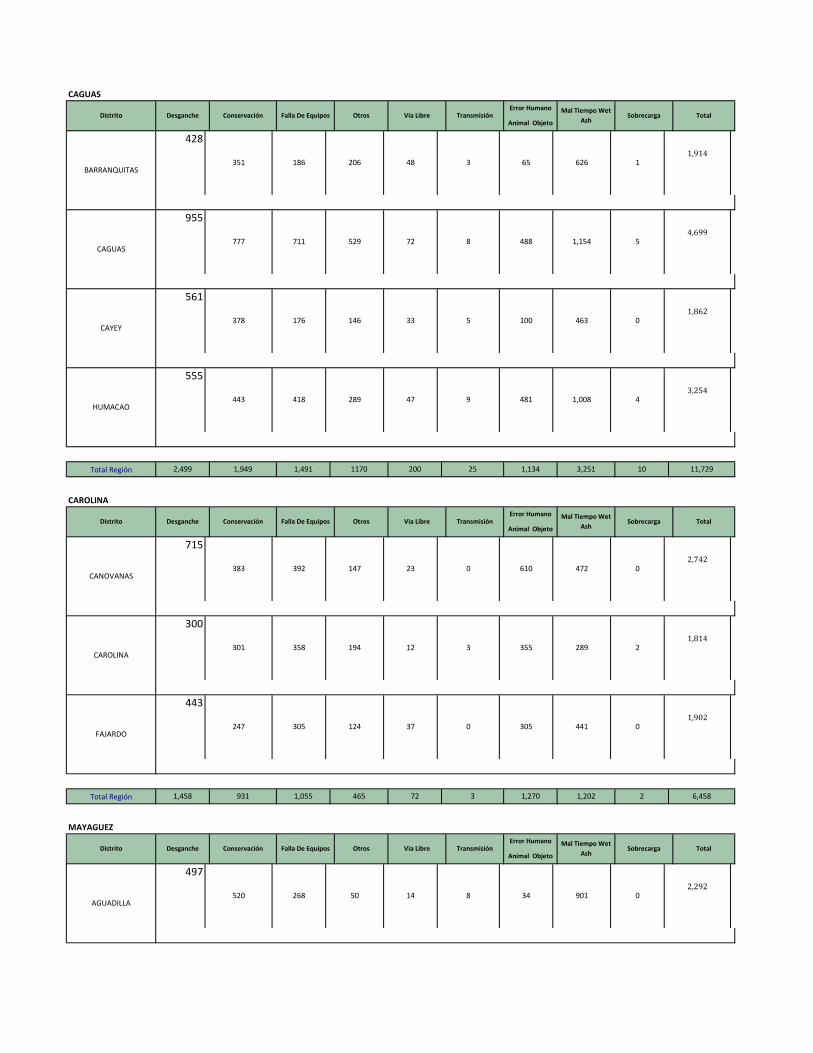
2. During the Technical Conference, Eng. Jose L. Sepulveda, Director of the Transmission
and Distribution Directorate, informed that, even though it is not required by the Order, the
Authority could make available to the Energy Bureau a breakdown of the common causes
registered during an electrical service interruption/outage. The report with data of the past 18
months is submitted with this motion as Attachment A.
3. Similarly, Mrs. Shehaly Rosado, Director of the Occupational Safety Division offered to
provide the annual ledger of registered injury and illness reported to Occupational Safety and
1 In compliance with the Resolution and Order dated May 14, 2020 (the “Order”), the Authority tracks certain key performance indicators/metrics on a monthly basis and submits the gathered information at the end of every quarter.
NEPR
Received:
Jan 26, 2021
6:25 PM

0110
-2-
Health Administration, including a breakdown of security incident indicators. The report is
attached as Attachment B.
WHEREFORE, PREPA respectfully requests the Energy Bureau to note the filing of the
attached supplemental information.
In San Juan, Puerto Rico, this 26th day of January 2021.
s/ Katiuska Bolaños Lugo Katiuska Bolaños Lugo TSPR 18,888 [email protected] s/ Joannely Marrero Cruz Joannely Marrero Cruz TSPR 20,014 [email protected] DÍAZ & VÁZQUEZ LAW FIRM, P.S.C. 290 Jesús T. Piñero Ave. Oriental Tower, Suite 1105 San Juan, PR 00918 Tel. (787) 395-7133 Fax. (787) 497-9664

0110
CERTIFICATE OF SERVICE
It is hereby certified that, on this same date, I have filed the above motion using the Energy Bureau’s Electronic Filing System, at the following address: http://radicacion.energia.pr.gov.
In San Juan, Puerto Rico, this 26th day of January 2021.
s/ Joannely Marrero Cruz Joannely Marrero Cruz

0110
Attachment A

Distrito Desganche Conservaci Falla De Eq Otros Via Libre Transmisió Error HumaMal TiempoSobrecargaTotal12650 10293 7511 8902 927 176 4121 12820 57 57457
01/25/2021
Periodo de 06-01-2019 a 12-31-2020
22%
18%
13%16%
2%0%7%
22%
0%
Interrupciones por Causa
Desganche
Conservación
Falla De Equipos
Otros
Via Libre
Transmisión
Error Humano
Mal Tiempo
Sobrecarga

Total Región
Total Región 1,117 1,374 1,240 3654 91 29 334 892 0 8,731
01,478
VEGA BAJA
300
347 301 1,069 18 7 88 221 02,351
PALO SECO
68
264 396 562 21 8 66 93
03,316
COROZAL
323
247 147 579 21 0 55 214 01,586
BAYAMON
426
516 396 1,444 31 14 125 364
BAYAMON
Distrito Desganche Conservación Falla De Equipos Otros Via Libre TransmisiónError Humano Mal Tiempo Wet
AshSobrecarga Total
Animal Objeto
01,108
1,872 1,198 807 107 117 12 182 2,105 3 6,403
UTUADO
269
265 119 19 5 2 3 426
02,194
QUEBRADILLAS
367
273 234 19 67 7 15 448 01,430
MANATI
717
336 244 28 21 0 129 719
Sobrecarga TotalAnimal Objeto
ARECIBO
519
324 210 41 24 3 35 512 31,671
Distrito Desganche Conservación Falla De Equipos Otros Via Libre TransmisiónError Humano Mal Tiempo Wet
Ash
AUTORIDAD DE ENERGÍA ELÉCTRICA DE PUERTO RICODIRECTORADO DE TRANSMISIÓN Y DISTRIBUCIÓN
INTERRUPCIONES POR CAUSA(Averias Primarias Sin Relevo de Carga)
Periodo de 06-01-2019 a 12-31-2020 ARECIBO
Total Región
Total Región
02,292
AGUADILLA
497
520 268 50 14 8 34 901
MAYAGUEZ
Distrito Desganche Conservación Falla De Equipos Otros Via Libre TransmisiónError Humano Mal Tiempo Wet
AshSobrecarga Total
Animal Objeto
01,902
1,458 931 1,055 465 72 3 1,270 1,202 2 6,458
FAJARDO
443
247 305 124 37 0 305 441
02,742
CAROLINA
300
301 358 194 12 3 355 289 21,814
CANOVANAS
715
383 392 147 23 0 610 472
CAROLINA
Distrito Desganche Conservación Falla De Equipos Otros Via Libre TransmisiónError Humano Mal Tiempo Wet
AshSobrecarga Total
Animal Objeto
2,499 1,949 1,491 1170 200 25 1,134 3,251 10 11,729
01,862
HUMACAO
555
443 418 289 47 9 481 1,008 43,254
CAYEY
561
378 176 146 33 5 100 463
11,914
CAGUAS
955
777 711 529 72 8 488 1,154 54,699
BARRANQUITAS
428
351 186 206 48 3 65 626
CAGUAS
Distrito Desganche Conservación Falla De Equipos Otros Via Libre TransmisiónError Humano Mal Tiempo Wet
AshSobrecarga Total
Animal Objeto

Total Región
Total Región
143,363
MONACILLOS
714
655 505 1,315 12 7 82 246 03,536
GUAYNABO
422
746 507 1,153 78 19 66 358
SAN JUAN
Distrito Desganche Conservación Falla De Equipos Otros Via Libre TransmisiónError Humano Mal Tiempo Wet
AshSobrecarga Total
Animal Objeto
1,200 1,081 625 252 274 48 715 1,412 19 5,626
3842
YAUCO
232
250 141 68 59 19 92 360 01,221
SANTA ISABEL
91
201 62 54 19 7 116 289
1752
PONCE
791
484 341 94 153 14 309 610 152,811
GUAYAMA
86
146 81 36 43 8 198 153
PONCE
Distrito Desganche Conservación Falla De Equipos Otros Via Libre TransmisiónError Humano Mal Tiempo Wet
AshSobrecarga Total
Animal Objeto
3,156 1,879 957 225 42 24 299 3,134 1 9,717
12,691
SAN SEBASTIAN
521
325 192 23 4 6 18 927 02,016
SAN GERMAN
986
484 219 52 15 4 195 735
MAYAGÜEZ
1152
550 278 100 9 6 52 571 02,718

Total Región
01/25/2021
d:5axm: c:
G7
81,894
1,348 1,881 1,336 3029 131 35 187 824 22 8,793
RIO PIEDRAS
212
480 324 561 41 9 39 220

0110
Attachment B

Historial de Lesiones y Enfermedades Registables
Informe de Registro de casos OSHA por añoDate: January 26 2021
INFORME DE REGISTRO DE CASOS OSHA POR AÑO 0
AÑO Death (right axis)
Cases with Days away from work
cases
Job transfer or rest. Cases
Other recordable
cases
Total Incidents
Total number of days of job transfer or
restriction
Total number of days away from
workInjuries and illnesses Injury
(1)Skin Disorder
(2)Respiratory Condition
(3)Poisoning
(4)Hearing Loss
(5)Other
(6)
Promedio Anual de Número de Empleados
TOTAL HORAS TRABAJADAS IR LTC DART
Severity Rate
2002 1 1,009 0 60 1,070 0 54,937 1,070 1,055 1 6 0 0 8 10,154 17,517,698 12.2 11.5 11.5 51.3 2003 2 1,046 9 28 1,085 159 66,009 1,085 1,041 13 4 0 0 27 9,885 17,078,683 12.7 12.2 12.4 60.8 2004 0 1,146 4 257 1,407 168 69,499 1,407 1,112 4 5 0 255 31 9,966 17,177,387 16.4 13.3 13.4 49.4 2005 2 994 130 135 1,261 3,235 63,198 1,261 980 50 54 2 40 135 9,762 15,155,505 16.6 13.1 14.8 50.1 2006 2 1,159 167 160 1,488 2,367 67,619 1,488 1,290 36 40 0 44 78 9,560 20,173,877 14.8 11.5 13.1 45.4 2007 1 914 166 191 1,272 5,169 59,960 1,272 1,129 31 15 0 29 68 9,518 16,873,417 15.1 10.8 12.8 47.1 2008 3 1,082 235 190 1,510 6,727 72,676 1,510 1,260 16 34 0 45 155 9,543 16,350,798 18.5 13.2 16.1 48.1
2009 0 980 124 143 1,247 3,932 92,499 1,247 1,137 11 13 1 22 63 8,962 14,327,982 17.4 13.7 15.4 74.2 2010 2 949 120 185 1,256 7,337 76,569 1,256 1,038 10 8 0 83 117 8,772 14,331,597 17.5 13.2 14.9 61.0 2011 2 968 56 136 1,162 1,121 67,251 1,162 1,013 23 9 0 27 90 8,609 11,791,281 19.7 16.4 17.4 57.9 2012 0 1,039 55 120 1,214 1,763 54,902 1,214 1,070 19 17 0 15 93 8,931 15,146,976 16.0 13.7 14.4 45.2 2013 0 1,191 22 146 1,359 175 39,257 1,359 1,204 18 23 1 13 100 7,836 14,493,599 18.8 16.4 16.7 28.92014 3 767 4 205 979 18 18,065 979 865 12 22 0 20 60 7,747 12,197,587 16.1 12.6 12.6 18.52015 0 458 1 298 757 81 4,352 757 666 24 6 2 16 43 6,726 11,527,910 13.1 7.9 8.0 5.72016 0 467 2 246 704 11 6,344 704 512 60 7 1 23 72 6,956 10,782,452 13.1 8.7 8.7 9.02017 0 358 0 203 650 0 3,097 0 650 518 2 6 1 13 106 6,060 9,032,998 14.4 7.9 7.9 4.82018 0 366 0 221 587 0 2,440 587 404 3 1 1 16 162 5,638 10,950,167 10.7 6.7 6.7 4.22019 0 287 1 161 449 9 1,621 449 293 7 10 0 11 128 5,359 9,391,621 9.6 6.1 6.1 3.6
YTD 2020 0 99 0 24 123 0 906 123 111 0 2 0 0 10 4,825 8,481,103 2.9 2.3 2.3 7.4
Forecast Include days from accidents on previous monthsACTUAL Jan-17 0 30 0 23 53 0 195 53 42 1 0 0 4 6 6,328 761,312 13.92 7.88 7.9 3.7ACTUAL Feb-17 0 40 0 15 55 0 296 55 45 1 1 0 0 7 6,179 852,586 12.90 9.38 9.4 5.4ACTUAL Mar-17 0 32 0 29 61 0 236 61 43 0 1 0 2 15 6,167 977,338 12.48 6.55 6.5 3.9ACTUAL Apr-17 0 39 0 19 58 0 235 58 50 0 1 0 1 6 6221 903411 12.84 8.63 8.6 4.1ACTUAL May-17 0 61 0 21 82 0 480 82 67 0 1 0 1 13 6205 809615 20.26 15.07 15.1 5.9ACTUAL Jun-17 0 44 0 22 66 0 303 66 47 0 1 1 3 14 6,205 750,258 17.59 11.73 11.7 4.6ACTUAL Jul-17 0 37 0 21 58 0 272 58 46 0 1 0 2 9 6,143 706,692 16.41 10.47 10.5 4.7ACTUAL Aug-17 0 40 0 29 69 0 311 69 57 0 0 0 0 12 6,108 920,704 14.99 8.69 8.7 4.5ACTUAL Sep-17 0 13 0 14 27 0 168 27 24 0 0 0 0 3 5,998 931,676 5.80 2.79 2.8 6.2ACTUAL Oct-17 0 22 0 10 32 0 112 32 29 0 0 0 0 0 6,178 1,419,406 4.51 3.10 3.1 3.5ACTUAL Nov-17 0 23 0 12 35 0 159 35 29 0 0 0 0 6 5,097 1,250,285 5.60 3.68 3.7 4.5ACTUAL Dec-17 0 35 0 19 54 0 330 54 39 0 0 0 0 15 5,885 1,199,871 9.00 5.83 5.8 6.1ACTUAL Jan-18 0 25 0 10 35 0 171 35 25 0 0 0 0 10 5,795 1,030,205 6.79 4.85 4.9 4.9ACTUAL Feb-18 0 35 0 26 61 0 302 61 46 1 0 0 1 13 5,780 893,543 13.65 7.83 7.8 5.0ACTUAL Mar-18 0 31 0 28 59 0 187 59 45 0 0 0 4 10 5,806 1,025,994 11.50 6.04 6.0 3.2ACTUAL Apr-18 0 41 0 25 66 0 263 66 42 0 0 1 2 21 5,776 1,070,835 12.33 7.66 7.7 4.0ACTUAL May-18 0 29 0 19 48 0 186 48 26 0 0 0 1 21 5,719 1,049,723 9.15 5.53 5.5 3.9ACTUAL Jun-18 0 34 0 17 51 0 247 51 35 0 1 0 0 15 5,661 986,304 10.34 6.89 6.9 4.8ACTUAL Jul-18 0 31 0 15 46 0 198 46 31 0 0 0 0 15 5,562 818,043 11.25 7.58 7.6 4.3ACTUAL Aug-18 0 30 0 18 48 0 154 48 33 0 0 0 1 14 5,582 815,131 11.78 7.36 7.4 3.2ACTUAL Sep-18 0 31 0 18 49 0 193 49 34 1 0 0 0 14 5,572 911,732 10.75 6.80 6.8 3.9ACTUAL Oct-18 0 31 0 15 46 0 221 46 32 0 0 0 2 12 5,530 985,268 9.34 6.29 6.3 4.8ACTUAL Nov-18 0 23 0 17 40 0 161 40 31 0 0 0 1 8 5,475 611,429 13.08 7.52 7.5 4.0ACTUAL Dec-18 0 25 0 13 38 0 157 38 24 1 0 0 4 9 5,403 751,959 10.11 6.65 6.6 4.1ACTUAL Jan-19 0 25 0 12 37 0 139 37 25 1 0 0 0 11 5,392 682,941 10.84 7.32 7.3 3.8ACTUAL Feb-19 0 27 0 13 40 0 151 40 23 1 0 0 1 15 5,396 682,585 11.72 7.91 7.9 3.8ACTUAL Mar-19 0 24 0 16 40 0 153 40 27 0 0 0 1 12 5,376 672,655 11.89 7.14 7.1 3.8ACTUAL Apr-19 0 29 0 8 37 0 166 37 20 1 1 0 0 15 5,346 832,723 8.89 6.97 7.0 4.5ACTUAL May-19 0 24 0 20 44 0 125 44 24 1 1 0 2 16 5,324 912,704 9.64 5.26 5.3 2.8ACTUAL Jun-19 0 22 1 25 48 8 135 48 27 2 8 0 3 8 5,300 844,131 11.37 5.21 5.4 2.8ACTUAL Jul-19 0 26 0 8 34 0 118 34 27 0 0 0 0 7 5,306 816,701 8.33 6.37 6.4 3.5ACTUAL Aug-19 0 28 0 18 46 0 190 46 33 0 0 0 2 11 5,324 735,206 12.51 7.62 7.6 4.1ACTUAL Sep-19 0 28 0 14 42 1 146 42 32 0 0 0 1 9 5,562 864,380 9.72 6.48 6.5 3.5ACTUAL Oct-19 0 23 0 12 35 0 124 35 26 0 0 0 0 9 5,351 898,439 7.79 5.12 5.1 3.5ACTUAL Nov-19 0 14 0 9 23 0 81 23 16 1 0 0 0 6 5,321 704,060 6.53 3.98 4.0 3.5ACTUAL Dec-19 0 17 0 6 23 0 93 23 13 0 0 0 1 9 5,306 745,096 6.17 4.56 4.6 4.0ACTUAL Jan-20 0 21 0 13 34 0 138 34 28 0 2 0 0 4 5,297 658,495 10.33 6.38 6.4 4.1ACTUAL Feb-20 0 18 0 6 24 0 88 24 21 0 0 0 0 3 5,270 868,645 5.53 4.14 4.1 3.7ACTUAL Mar-20 0 16 0 0 16 0 171 16 15 0 0 0 0 1 5,245 669,068 4.78 4.78 4.8 10.7ACTUAL Apr-20 0 1 0 0 1 0 15 1 1 0 0 0 0 0 3,297 421,950 0.47 0.47 0.5 15.0ACTUAL May-20 0 2 0 2 4 0 17 4 4 0 0 0 0 0 3,297 421,950 1.90 0.95 0.9 4.3ACTUAL Jun-20 0 6 0 1 7 0 118 7 7 0 0 0 0 0 4,655 582,650 2.40 2.06 2.1 16.9ACTUAL Jul-20 0 4 0 0 4 0 40 4 4 0 0 0 0 0 5,199 674,264 1.19 1.19 1.2 10.0ACTUAL Aug-20 0 6 0 0 6 0 58 6 6 0 0 0 0 0 5,213 942,967 1.27 1.27 1.3 9.7ACTUAL Sep-20 0 5 0 0 5 0 33 5 4 0 0 0 0 1 5,194 882,042 1.13 1.13 1.1 6.6ACTUAL Oct-20 0 10 0 0 10 0 95 10 10 0 0 0 0 0 5,154 882,553 2.27 2.27 2.3 9.5ACTUAL Nov-20 0 4 0 1 5 0 40 5 4 0 0 0 0 1 5,074 793,957 1.26 1.01 1.0 8.0ACTUAL Dec-20 0 6 0 1 7 0 93 7 7 0 0 0 0 0 5,005 682,564 2.05 1.76 1.8 13.3
TOTAL 0 416 0 234 650 0 8,064.0 1,809 5,470 40,306,044 8.98 2.1 2.1 12.41,159
TablesTotal days away from
work
Injury and Illness [1]
Total worked hours
Actuals Forecast [1] Actuals Forecast [2] Actuals Forecast[1] IR [3] LTC [4] Severity Rate [2]
2002 54,937 0 1,070 0 17,517,698 0 12.22 11.5 51.32003 66,009 0 1,085 0 17,078,683 0 12.71 12.2 60.82004 69,499 0 1,407 0 17,177,387 0 16.38 13.3 49.42005 63,198 0 1,261 0 15,155,505 0 16.64 13.1 50.12006 67,619 0 1,488 0 20,173,877 0 14.75 11.5 45.4

Historial de Lesiones y Enfermedades Registables
2007 59,960 0 1,272 0 16,873,417 0 15.08 10.8 47.12008 72,676 0 1,510 0 16,350,798 0 18.47 13.2 48.12009 92,499 0 1,247 0 14,327,982 0 17.41 13.7 74.22010 76,569 0 1,256 0 14,331,597 0 17.53 13.2 61.02011 67,251 0 1,162 0 11,791,281 0 19.71 16.4 57.92012 54,902 0 1,214 0 15,146,976 0 16.03 13.7 45.22013 39,257 0 1,359 0 14,493,599 0 18.75 16.4 28.92014 18,065 0 979 0 12,197,587 0 16.05 12.6 18.52015 4,352 0 757 0 11,527,910 0 13.13 7.9 5.72016 6,344 0 704 0 10,782,452 0 13.06 8.7 9.02017 3,097 0 650 0 9,032,998 0 14.39 7.9 4.82018 2,440 0 587 0 10,950,167 0 10.72 6.7 4.2 2019 1621 0 449 0 9,391,621 0 9.56 6.1 3.6
YTD 2020 906 0 123 0 8,481,103 0 2.90 2.3 7.4906 F 123 F
IR: For every 100 employees, 14.4 have been involved in a recordable injury or illness. Severity Rate: For every recordable incident at PREPA, an average of 4.8 days will be lost due toLTCR: For every 100 employees, 7.9 have suffered lost time because of a work related injury or illness. those work related injuries and illnesses in 2015
[1] Includes: general injuries, skin disorders, respiratory conditions, poisoning and hearing loss. [1] Forecast: Average monthly number of days away from work from 2014 is used to calculate the remaining 2015 months.[2] Forecast: Maximum monthly injuries and illnesses in 2016. Number of employees is assumed to be constant using 2015 monthly [2] The severity rate is a calculation that gives a company an average of the number of lost days per recordable incident. Please average numbers) throughout the rest of the year. note, that it only provides an average. The calculation is made by dividing the total lost workdays by the number of incidents. [3] OSHA Recordable Incident Rate (IR) is calculated by multiplying the number of recordable cases by 200,000, and then dividing that number by the number of total labor hours.[4] The Lost Time Case Rate (LTCR) is a similar calculation, only it uses the number of cases that contained lost work days.
Number of Incidents and Incident Rates - Forecast Number of Days Away From Work - Forecast
5493766009 69499
63198 6761959960
72676
92499
7656967251
54902.2
39257.36
180654352 6344 3097 2440 1621 773
51.34299065
60.83778802
49.3951670250.1173671745.4428763447.1383647848.12980132
74.17722534
60.9625796257.87521515
45.22421746
28.88694628
18.45250255
5.7490092479.0113636364.7646153854.1567291313.610244989
6.963963964
0
10
20
30
40
50
60
70
80
2002 2003 2004 2005 2006 2007 2008 2009 2010 2011 2012 2013 2014 2015 2016 2017 2018 2019 YTD2020
0
10000
20000
30000
40000
50000
60000
70000
80000
90000
100000
Total days away from work Forecast [1] Severity Rate [2]
906 F
1070 1085 1407 1261 1488 1272 1510 1247 1256 1162 1214 1359 979 757 704 650 587 449 111
12.2162169912.70589776
16.3820026916.6408179714.7517506715.07696989
18.4700465417.406498717.52770469
19.70947855
16.02960221
18.75310583
16.05235558
13.1333433313.0582542814.39167833
10.721297769.561715067
3.169353605
11.5197784512.2491880713.3431237213.11734581
11.4901068710.83360887
13.2348280513.6795258413.24346477
16.41891157
13.71890997
16.43484109
12.57625815
7.9459329518.6622226567.9264936046.6848296116.111831234
2.5411934310
200
400
600
800
1000
1200
1400
1600
2002 2003 2004 2005 2006 2007 2008 2009 2010 2011 2012 2013 2014 2015 2016 20170
5
10
15
20
25
Injury and Illness [1] Forecast [2] IR [3] LTC [4]
123 F
2018 2019YTD 2020